Aminergic and peptidergic modulation of insulin-producing cells in Drosophila
- Ache Lab, Neurobiology and Genetics, Theodor-Boveri-Institute, Biocenter, Julius-Maximilians-University of Würzburg, Am Hubland, Germany
- Zandawala Lab, Neurobiology and Genetics, Theodor-Boveri-Institute, Biocenter, Julius-Maximilians-University of Würzburg, Am Hubland, Germany
- Department of Biochemistry and Molecular Biology, University of Nevada Reno, United States
Figures
Figure 1 with 5 supplements
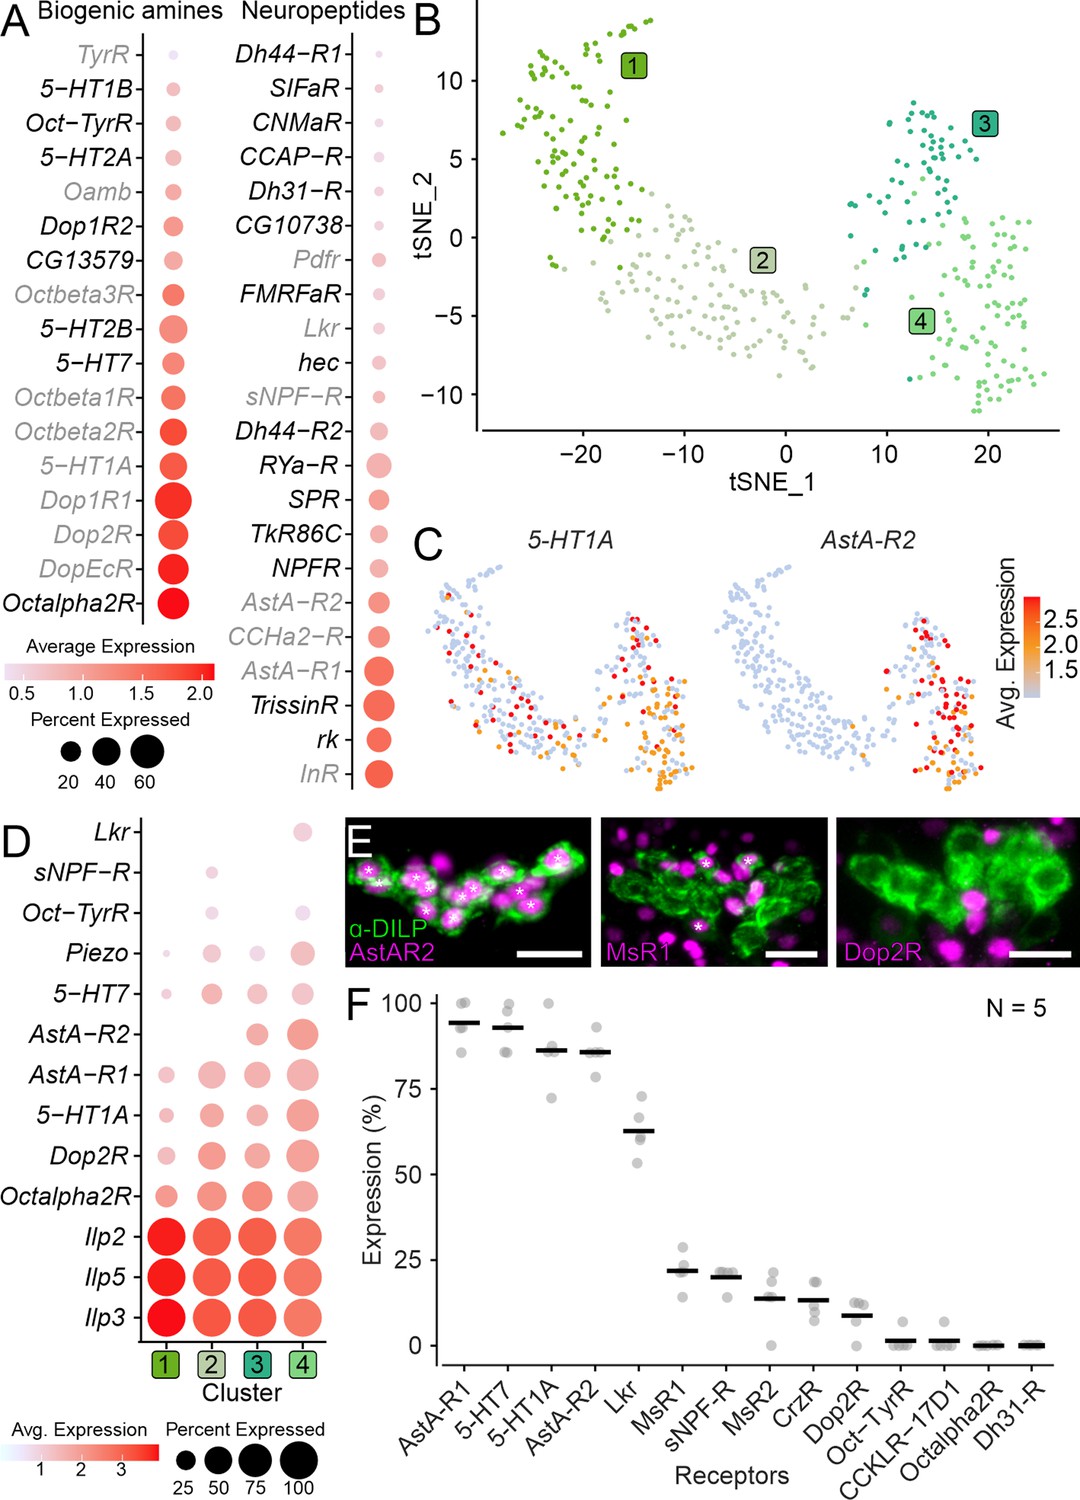
Expression of neuromodulator receptors in insulin-producing cells (IPCs).
(A) Expression of biogenic amine and neuropeptide receptors in IPC single-nucleus transcriptomes. Novel receptors are depicted in black, and receptors previously shown to be expressed in IPCs are shown in gray. (B) t-distributed Stochastic Neighbor Embedding (t-SNE) plot based on unsupervised clustering of IPC transcriptomes reveals four clusters. (C) t-SNE plots showing expression of 5-HT1A receptor and Allatostatin-A receptor 2. (D) Expression of IPC markers (Ilp2, Ilp3, Ilp5, and Piezo) and select neuromodulatory receptors across different IPC clusters. Note that some receptors are expressed in all clusters while others are only expressed in a subset of clusters. A cutoff of 10% expression was used for this analysis. (E) Maximum projection of representative confocal images showing receptor-T2A-GAL4 driven mCherry expression (magenta) in IPCs (labeled using DILP2 antibody in green). Asterisks indicate IPCs whose nuclei are stained. Scale bars = 10 µm. (F) Fraction of IPCs expressing select receptors based on T2A-GAL4 driven mCherry expression in IPCs. Averages are based on five preparations for each receptor. See Supplementary file 1A for all abbreviations.
Figure 1—figure supplement 1
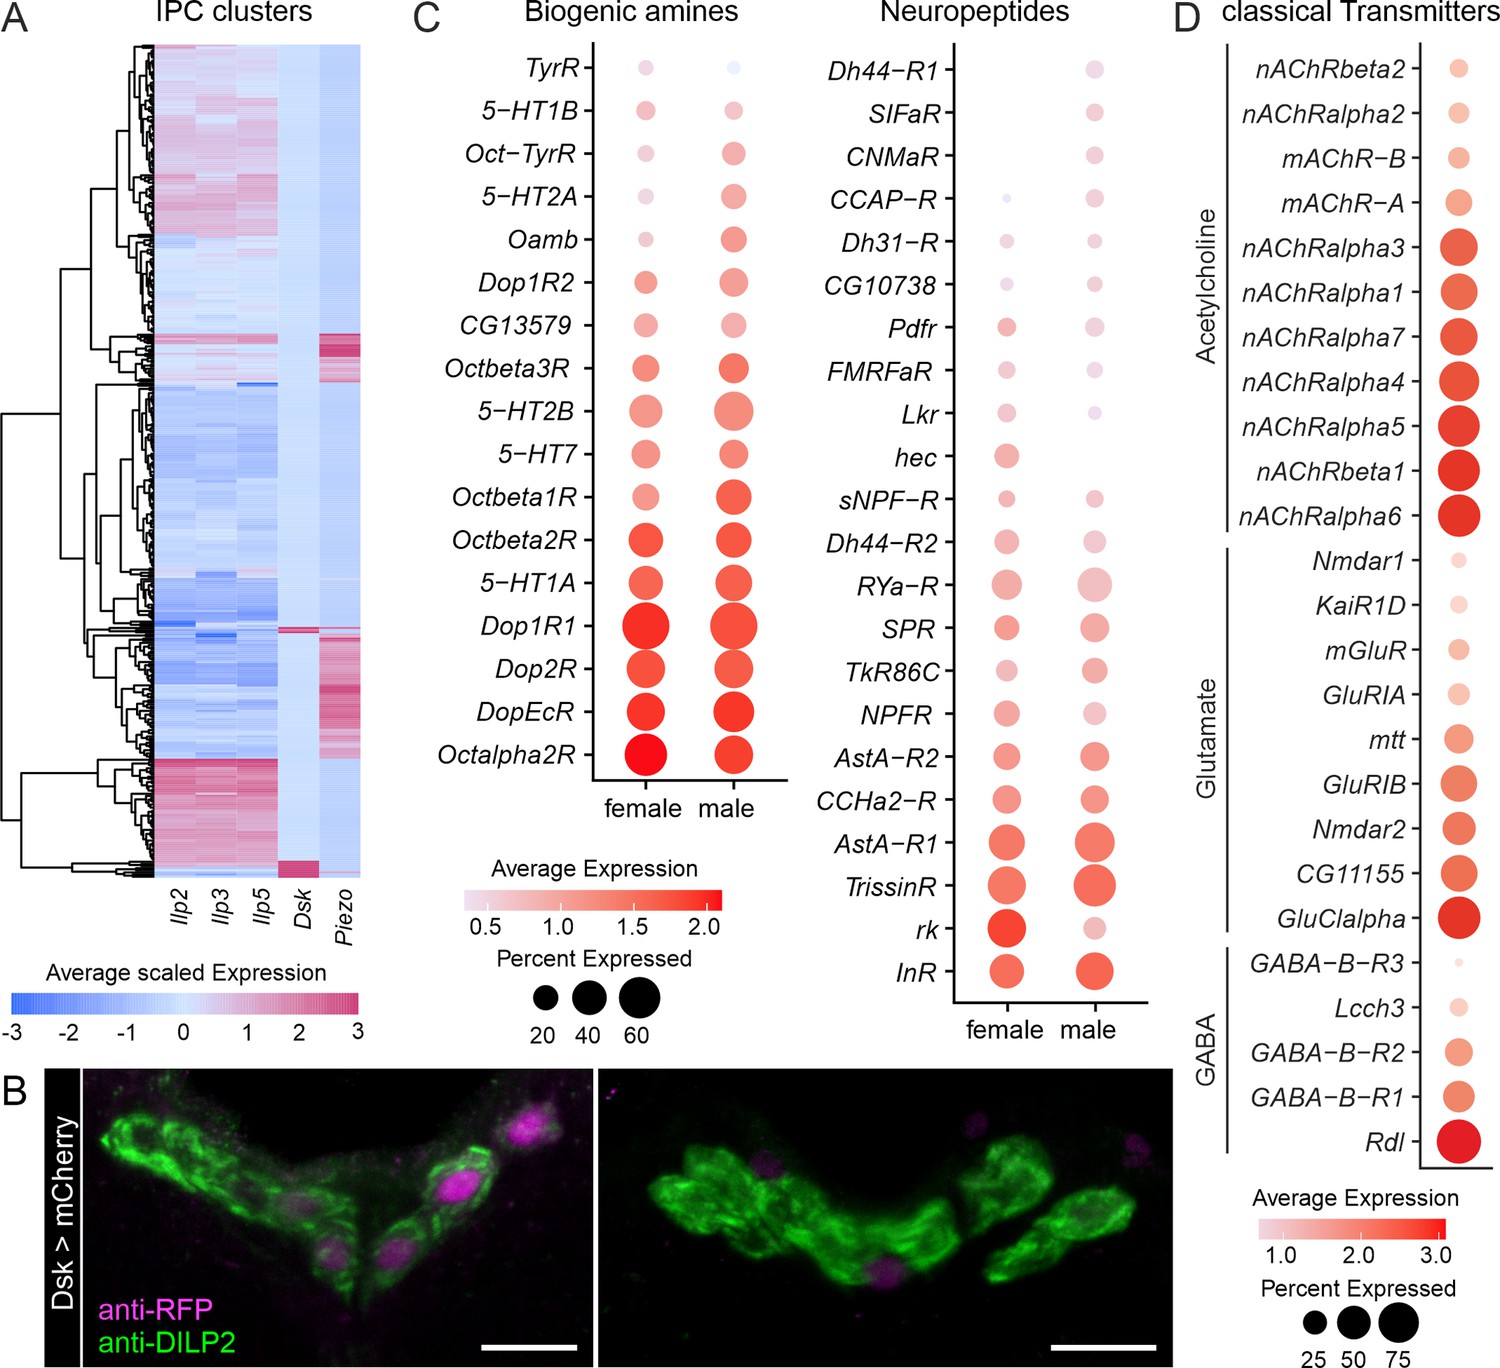
Insulin-producing cells (IPCs) express receptors for biogenic amines, neuropeptides, and classical neurotransmitters.
(A) Cluster analysis of IPCs based on Ilp2, Ilp3, Ilp5, Dsk, and Piezo expression. Expression levels are depicted as a heatmap where each row represents a single-cell. Expression was scaled based on all genes in the dataset. Therefore, negative values indicate low expression. (B) Representative confocal stacks from two brains showing sparse Dsk-T2A-GAL4 driven nuclear mCherry expression (amplified with RFP antibody and shown in magenta) in IPCs (labeled with DILP2 antibody and shown in green). Scale bars = 10 µm. (C) Comparison of biogenic amine and neuropeptide receptor expression in IPC transcriptomes derived from males and females. (D) Expression of classical fast-acting neurotransmitter receptors in IPC transcriptomes.
Figure 1—figure supplement 2
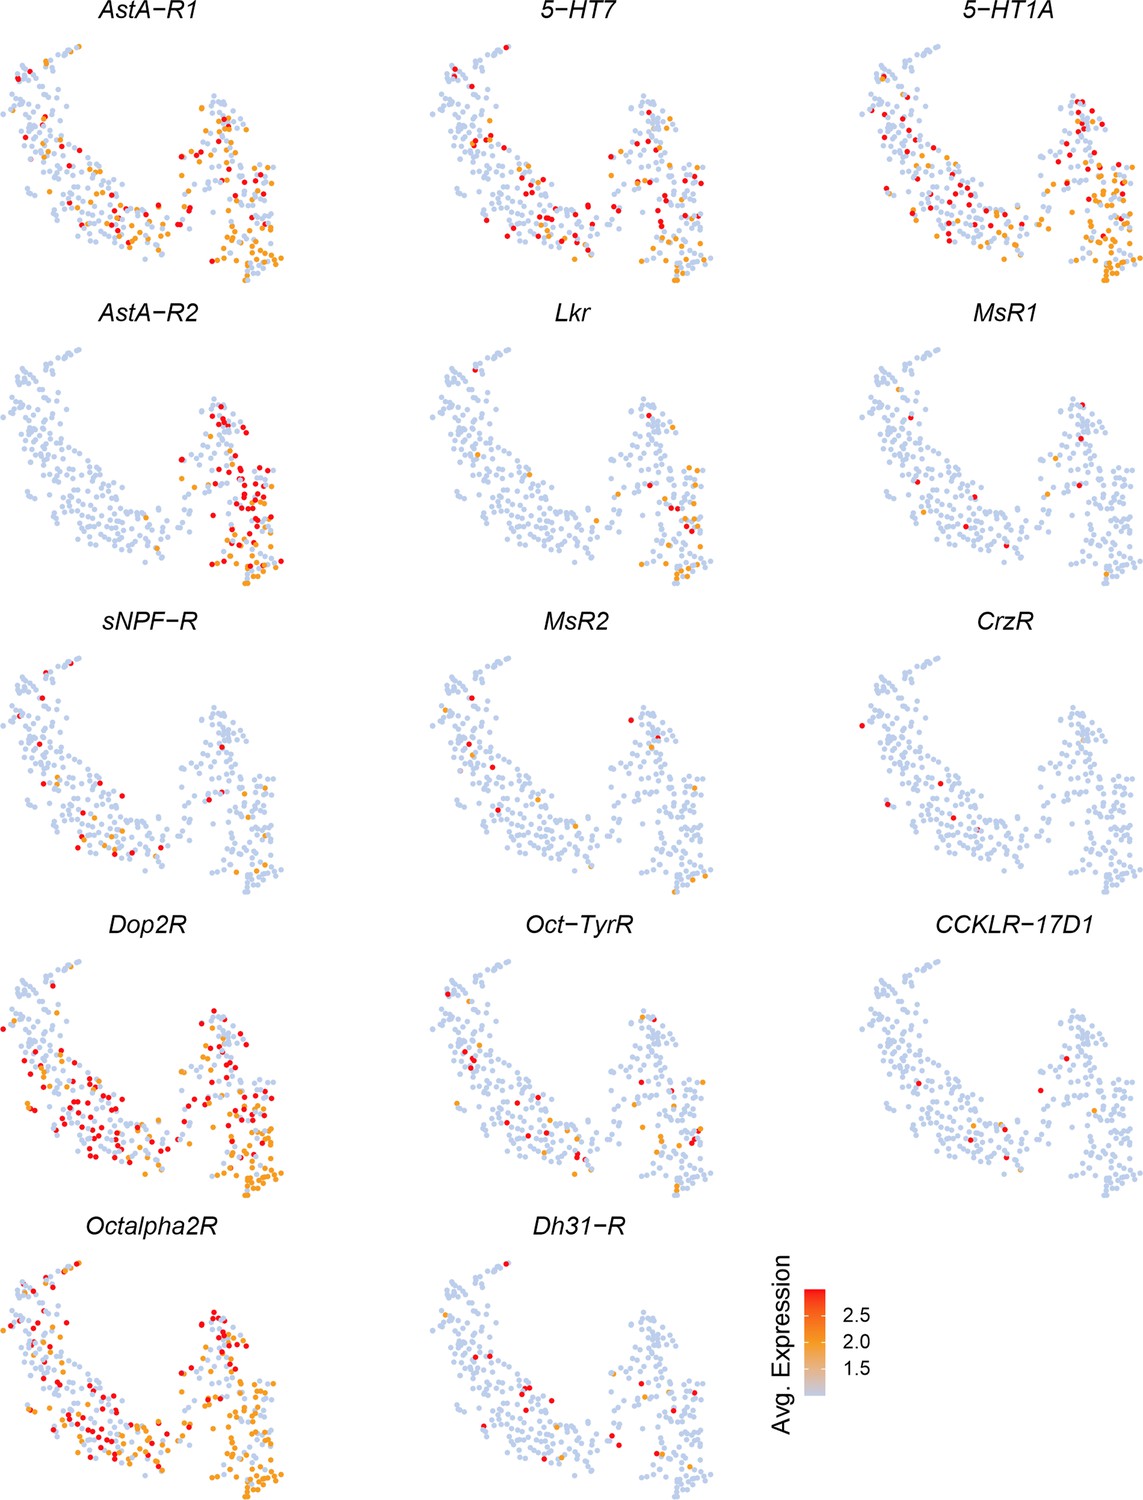
Expression of select neuromodulator receptors across individual insulin-producing cells (IPCs).
t-distributed Stochastic Neighbor Embedding (t-SNE) plots showing expression of select biogenic amine and neuropeptide receptors across IPC transcriptomes. Note that some receptors such as AstA-R1 and 5-HT1A are broadly expressed whereas others, for example MsR1 and MsR2, are sparsely expressed.
Figure 1—figure supplement 3
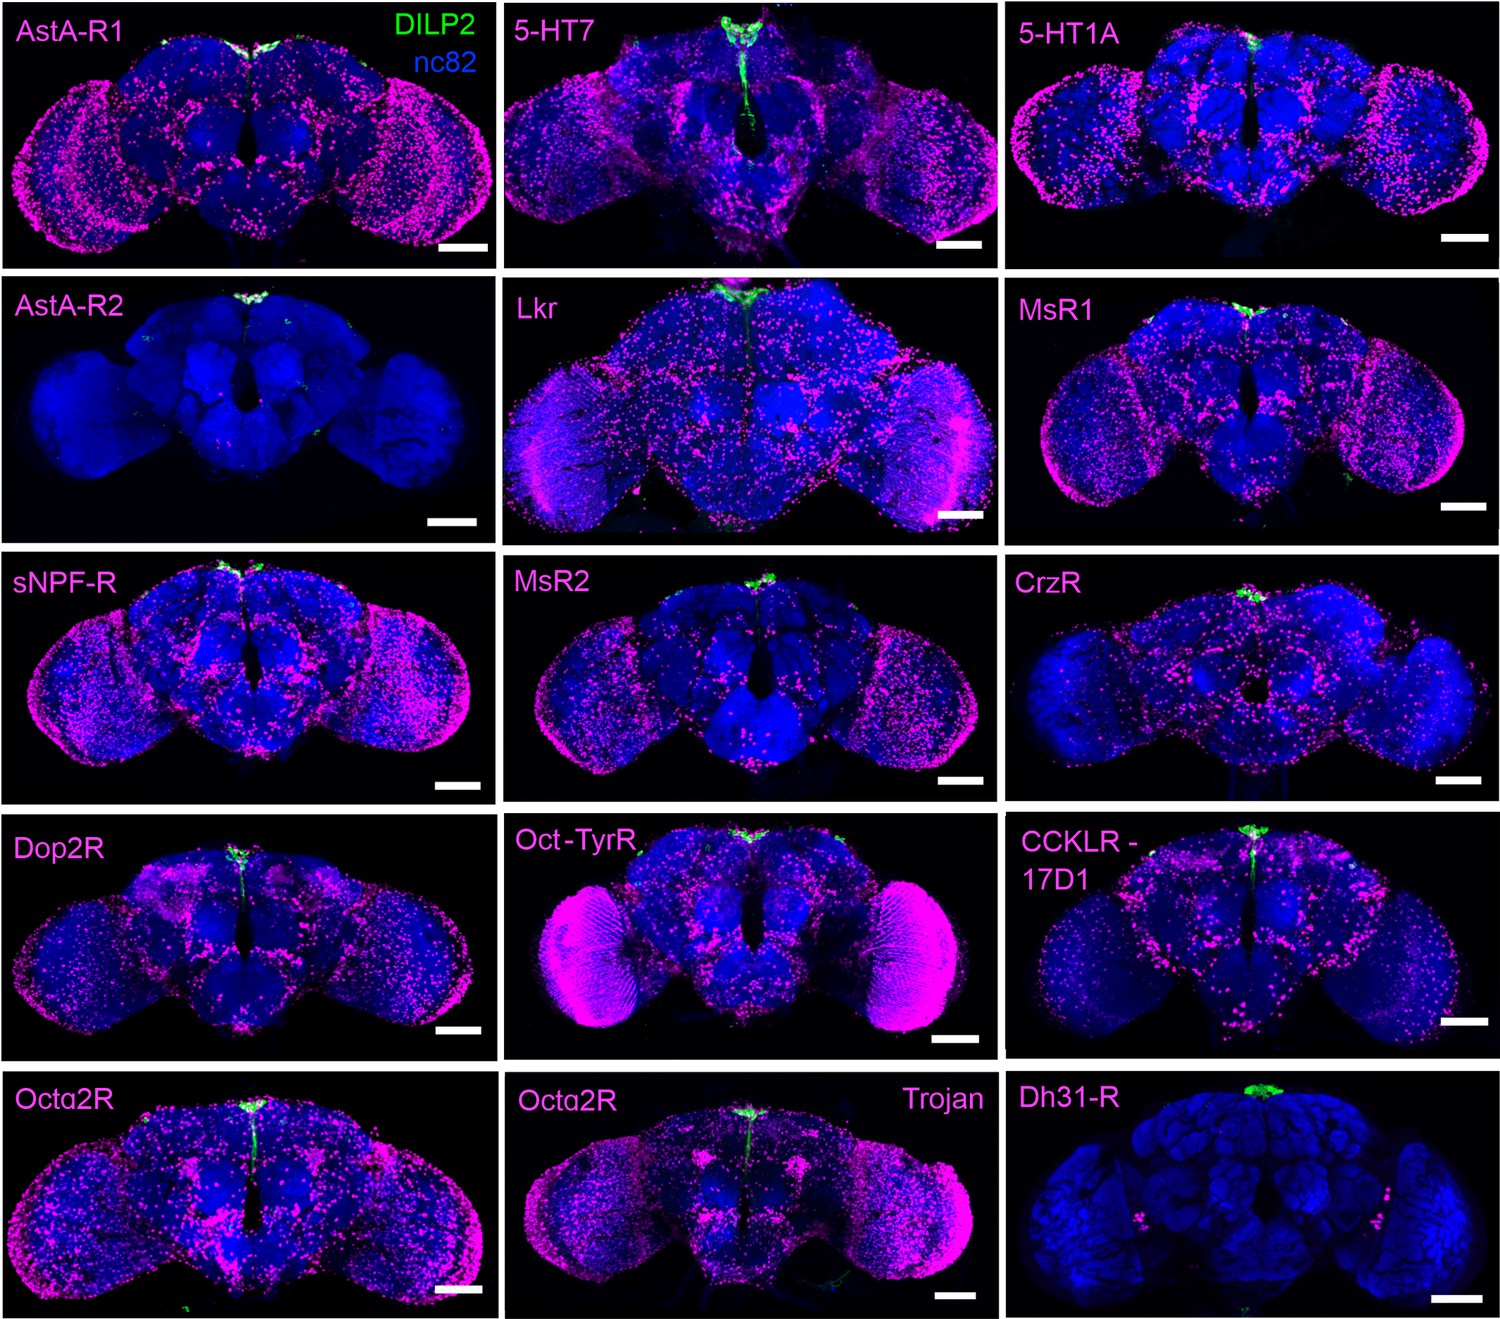
Overview of neuromodulator receptor expression in the brain.
T2A-GAL4 knock-in lines for different receptors drive broad expression of nuclear mCherry (magenta). Insulin-producing cells (IPCs) (green) and the neuropil (blue) have been labeled using DILP2 and nc82 antibodies, respectively. Note that AstAR2 is mainly expressed in the IPCs. For Octα2R, an independent GAL4 (Trojan) was also tested. Scale bars = 50 µm.
Figure 1—figure supplement 4
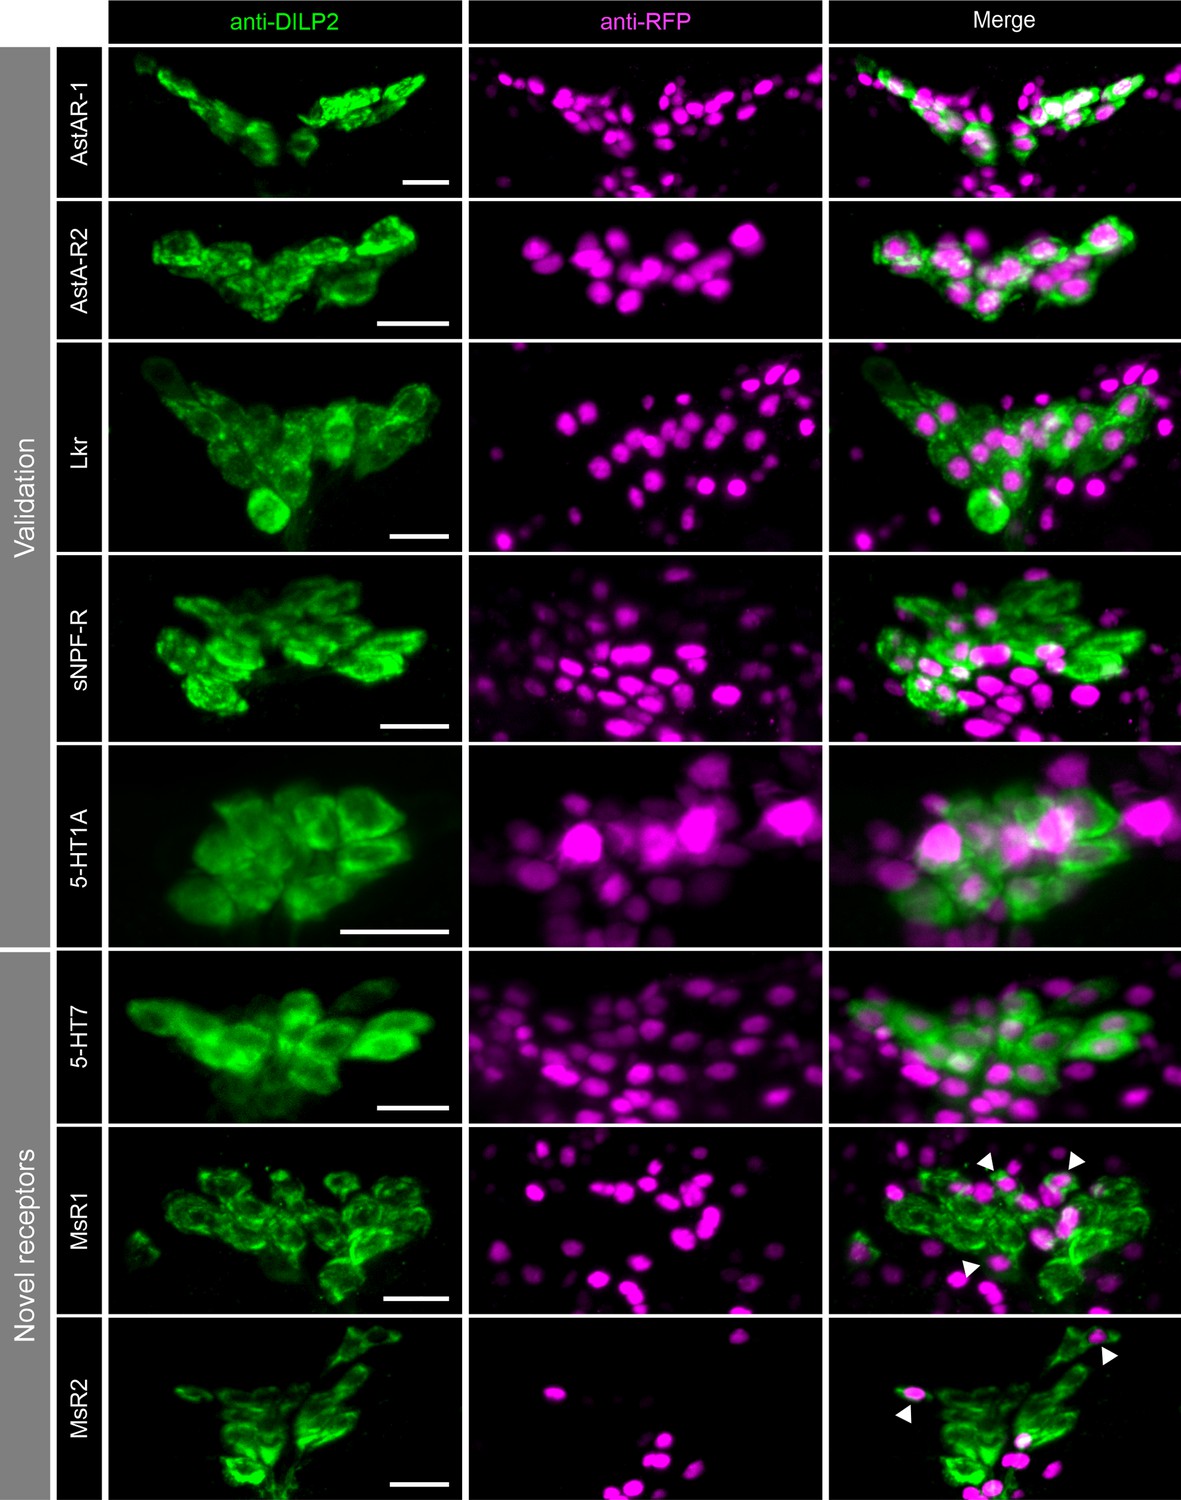
Neuromodulator receptors expressed in insulin-producing cells (IPCs).
Representative confocal stacks showing expression of different neuromodulator receptors (magenta) in IPCs (labeled using DILP2 antibody in green). Receptor expression was assessed by driving nuclear mCherry reporter using -T2A-GAL4 knockin lines for allatostatin-A receptor 1 (AstA-R1), allatostatin-A receptor 2 (AstA-R2), leucokinin receptor (Lkr), short neuropeptide F receptor (sNPF-R), 5-hydroxytryptamine (5-HT) receptor 1 A (5-HT1A), 5-HT receptor 7 (5-HT7), myosuppressin receptor 1 (MsR1), and myosuppressin receptor 2 (MsR2). Scale bars = 10 µm.
Figure 1—figure supplement 5
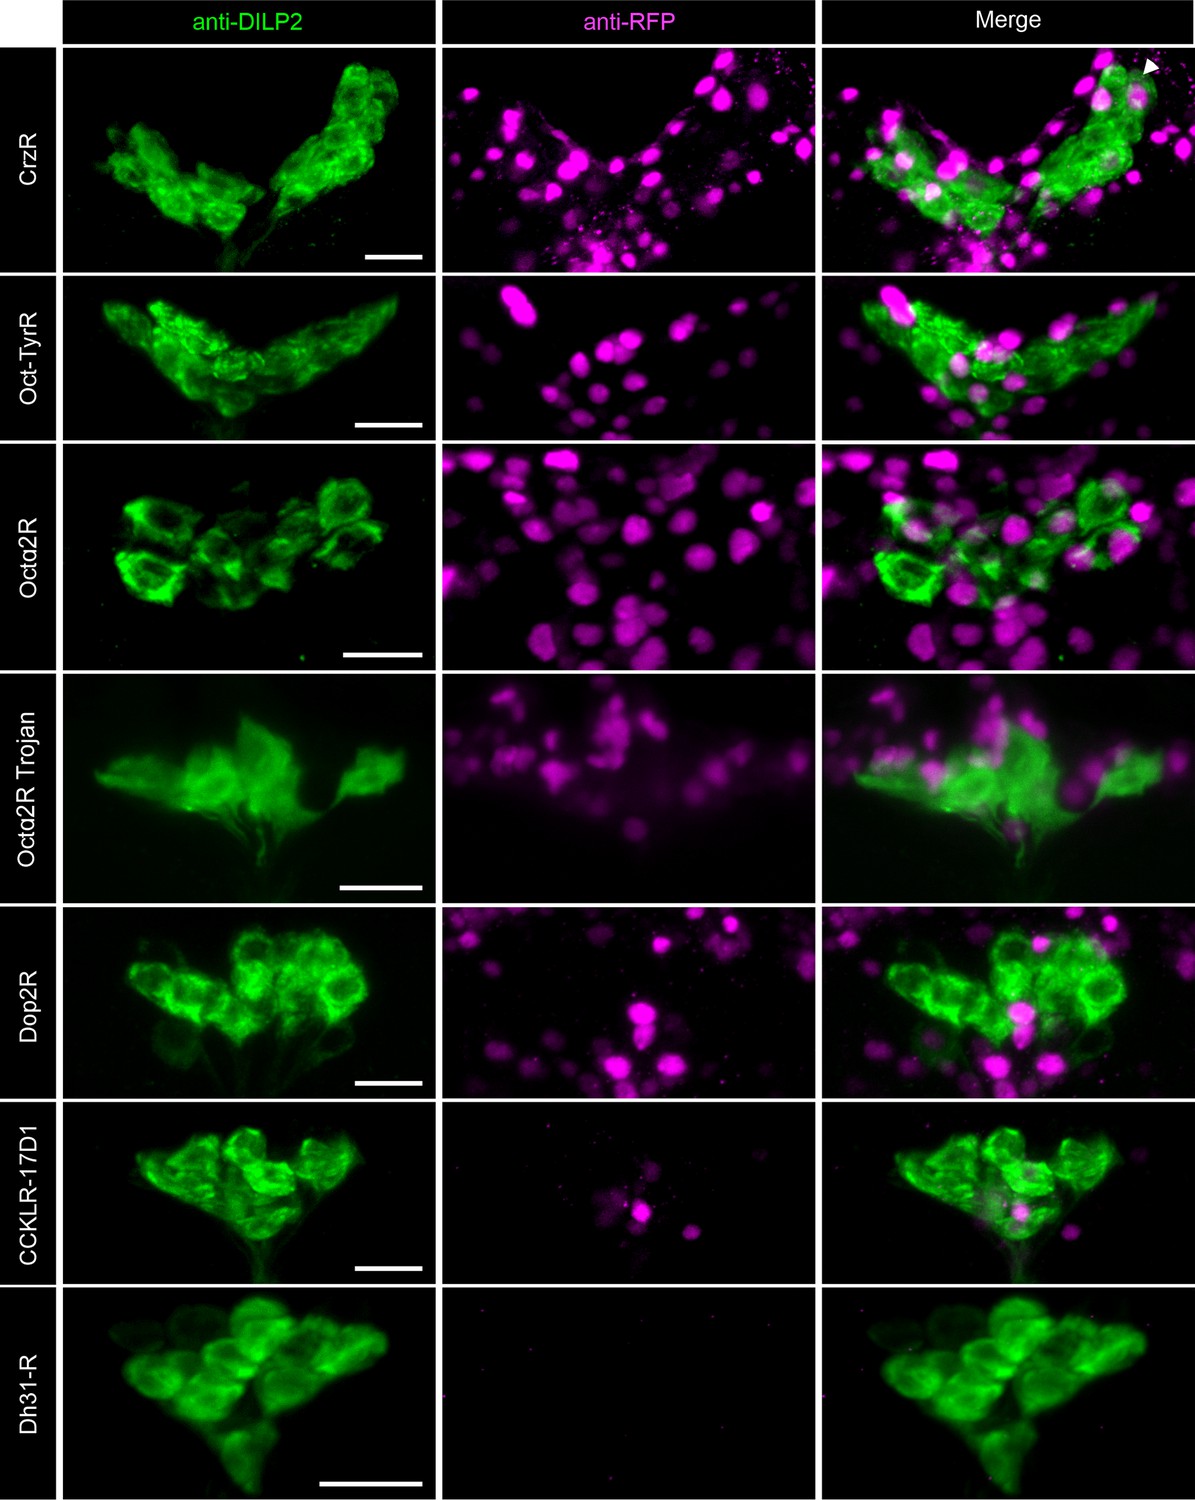
Neuromodulator receptors not expressed in insulin-producing cells (IPCs).
Representative confocal stacks showing a lack of expression of different neuromodulator receptors (magenta) in IPCs (labeled using DILP2 antibody in green). Receptor expression was assessed by driving nuclear mCherry reporter using GAL4 lines for corazonin receptor (CrzR), octopamine (Oct)-tyramine receptor (Oct-TyrR), Oct alpha receptor 2 (Octα2R), Octα2R Trojan, dopamine receptor 2 (Dop2R), cholecystokinin-like receptor at 17D1 (CCKLR-17D1), and diuretic hormone 31 receptor (Dh31-R). Scale bars = 10 µm. With the exception of Octα2R Trojan, all other lines were T2A-GAL4 knock-ins.
Figure 2 with 2 supplements
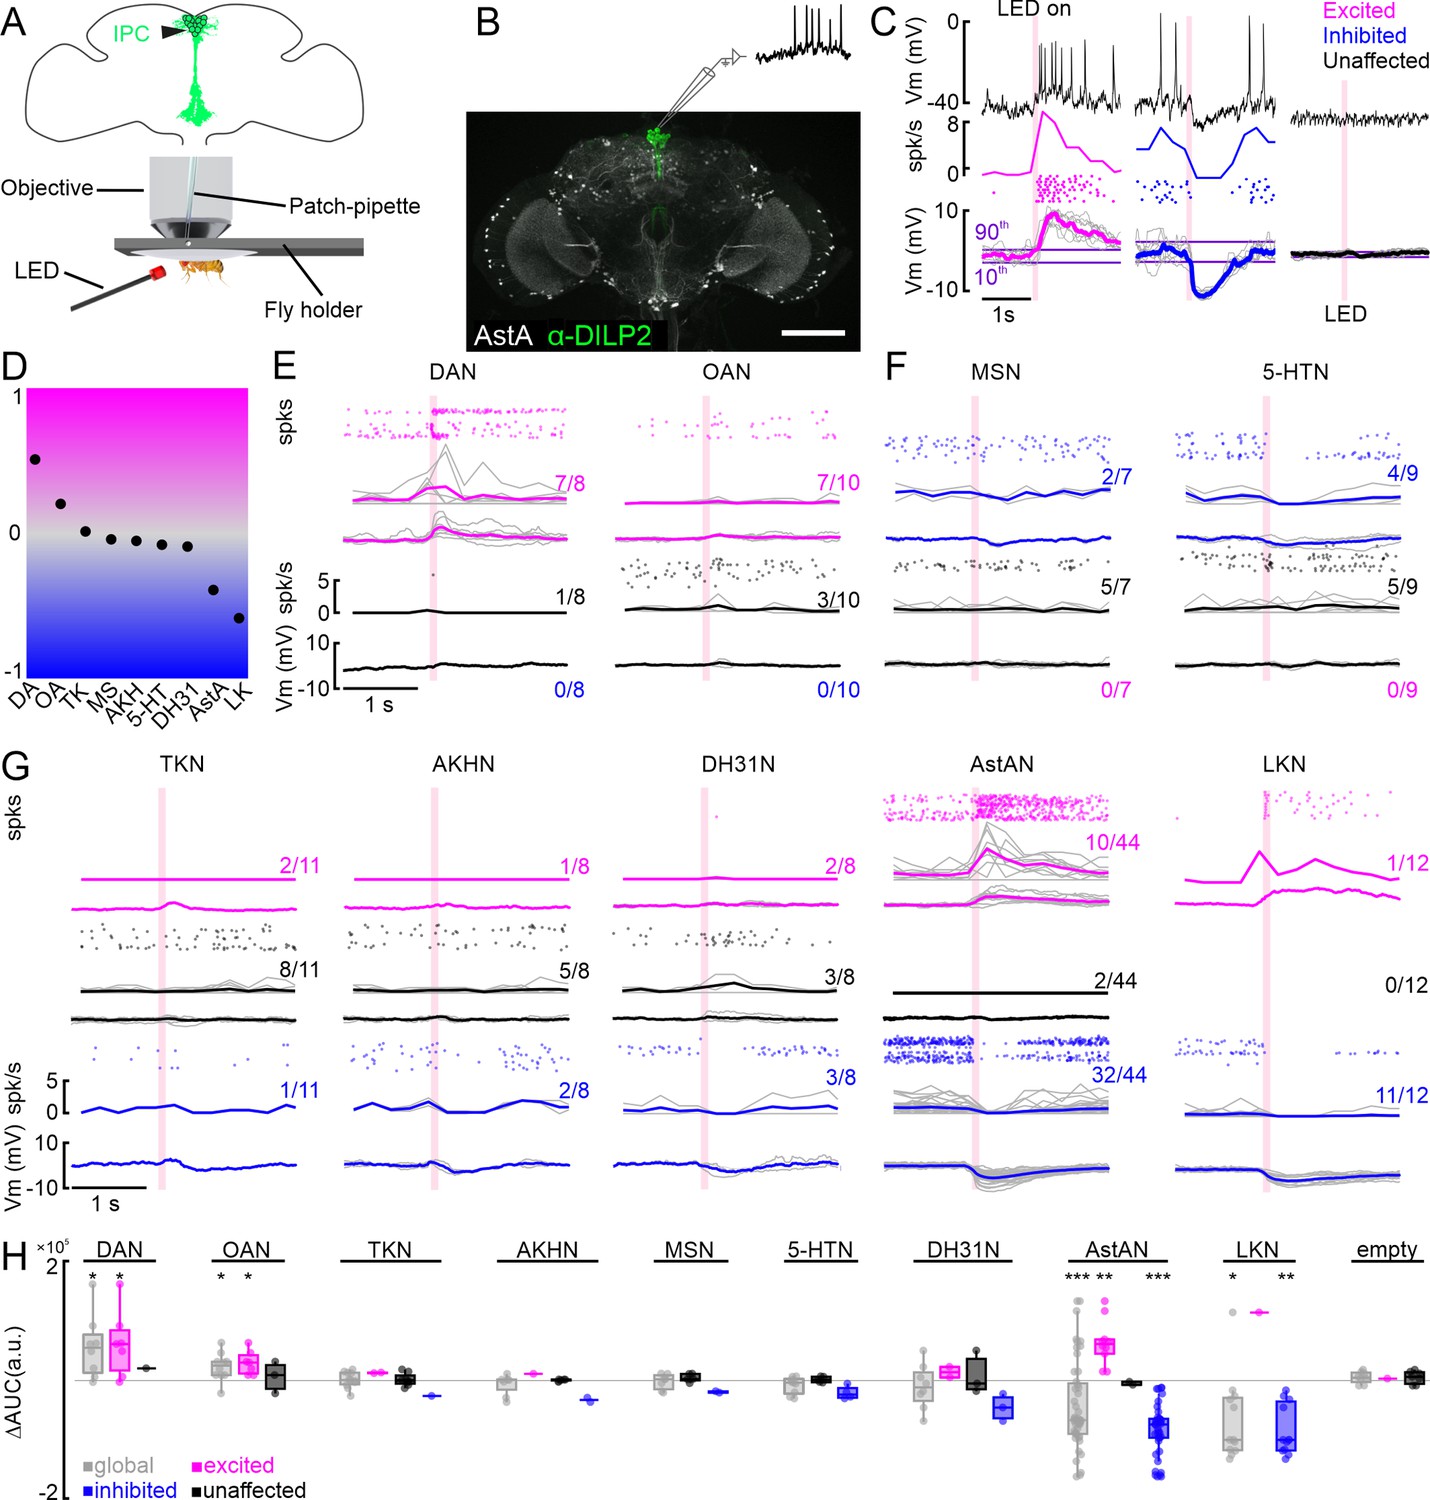
Modulation of individual insulin-producing cells (IPCs) by aminergic and peptidergic neurons in patch-clamp recordings.
(A) Schematic of setup for patch-clamp recordings and optogenetic activation. (B) Anatomy of an example driver line labeling AstANs (gray) and antibody staining against DILP2 labeling IPCs (green). (C) Example responses of three IPCs to optogenetic activation of AstANs (red bar). IPCs with a membrane potential (Vm) rising above the 90th percentile of the baseline during or after stimulation were defined as ‘excited’ (magenta). IPCs with Vm falling below the 10th percentile were defined as ‘inhibited’ (blue). IPCs remaining between the thresholds were ‘unaffected’ (black). (D) Normalized overall trends across all tested lines based on the area under the curve (AUC) average of all recorded cells for the respective line. (E) DAN, and OAN populations primarily drove excitation or had no effect on IPCs upon activation. Spike events (dots), spike frequency (spk/s), and low-pass filtered Vm (mV) are shown, color-coded according to the clusters as before. Gray lines indicate individual IPCs, while color-coded lines show the cluster average. Fractions indicate number of IPCs per cluster. (F) MS- and 5-HT-expressing neurons had inhibitory or no effects on IPCs. Details as in D. (G) TKNs, AKHNs, DH31Ns, AstANs, and LKNs evoked mixed effects in IPCs upon activation. Details as in D. (H) Baseline subtracted AUC values (∆AUC) of all recorded cells (gray), and excited (magenta), unaffected (black), and inhibited (blue) clusters. p-values were calculated using the Wilcoxon signed-rank test.
Figure 2—figure supplement 1
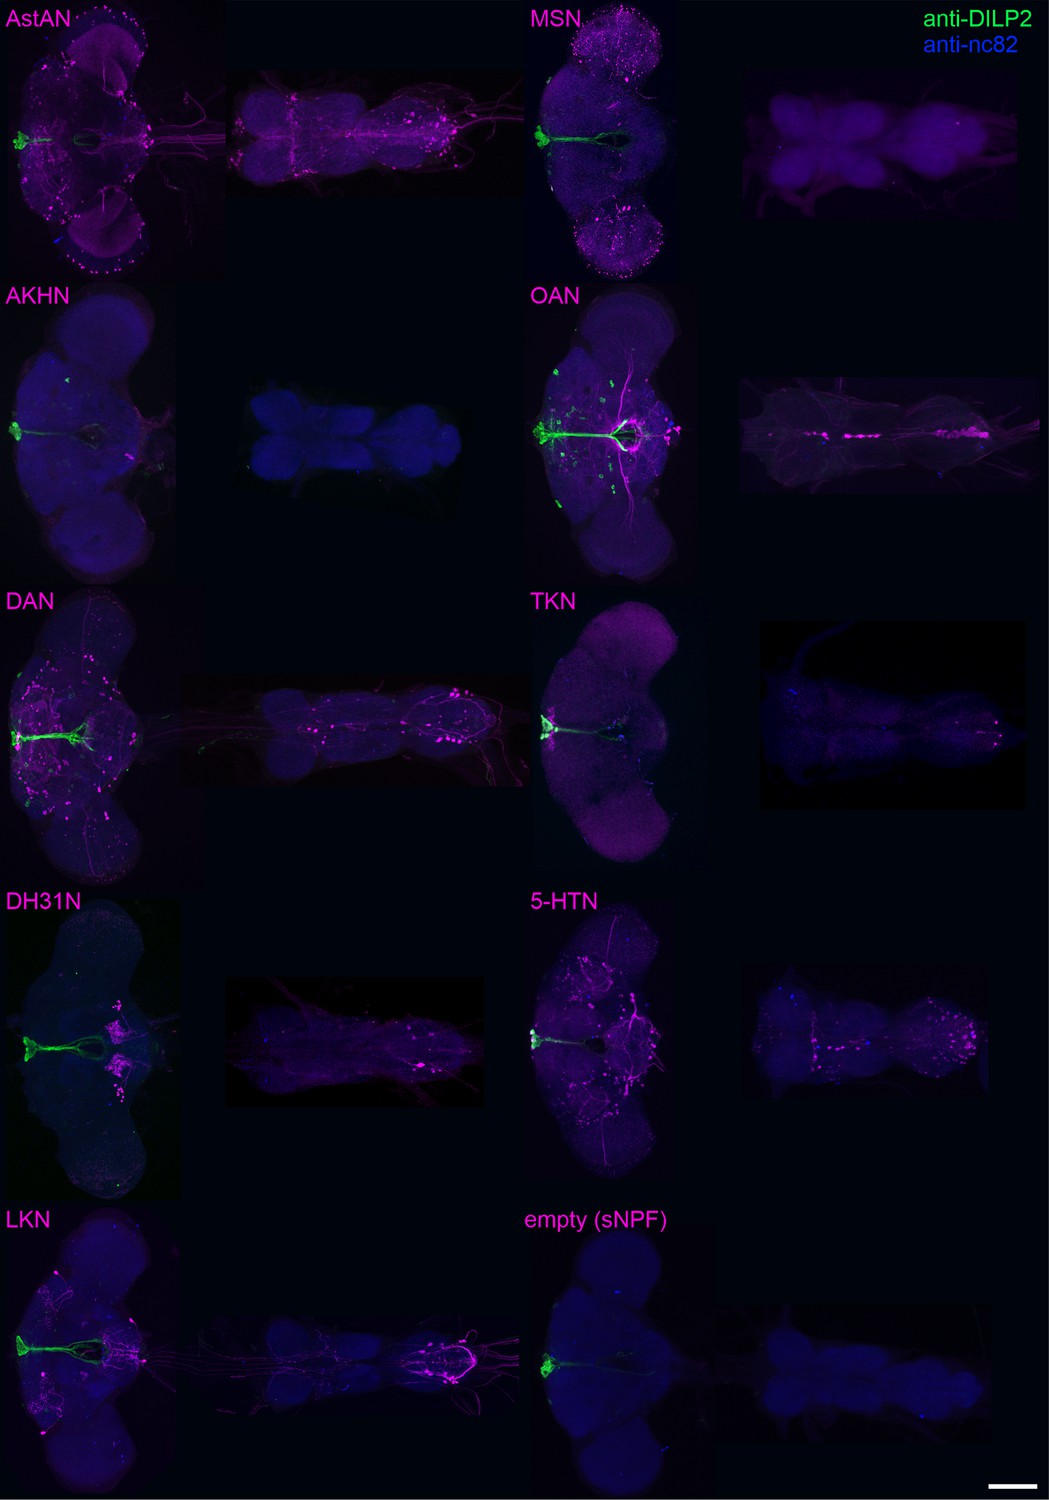
Expression of the ModN driver lines in the brain and VNC.
The expression pattern of each ModN line was visualized via GFP-expression (magenta) in the fly brain and VNC using the respective GAL4 driver line. IPCs were visualized using anti-DILP2 (green), and anti-nc82 immunohistochemical labeling was used to stain the neuropil (blue). The sNPFN driver line was expected to drive expression in sNPF-expressing neurons. However, anatomical labeling revealed no expression in the central nervous system across all inspected animals. Therefore, the sNPF driver lines was ‘empty’ and served as a negative control. Scale bar = 100 µm.
Figure 2—figure supplement 2

Insulin-producing cell (IPC) responses to repeated activation of ModNs and statistical analysis of IPC responses to ModN activation for all lines.
(A) Example recording from IPC shows excitation upon dopamine (DAN) activation across ten repetitions (black traces) for 100 ms activation (left) and 1 s activation (right). Spike events are displayed as dots, with each row representing one repetition of the activation, and the spike frequency as thick, color-coded line. The membrane potential of each repetition is displayed in gray with the median as thick, color-coded line. Purple lines indicate the upper and lower thresholds for the cluster analysis. (B) Recording of example IPC that shows inhibition upon AstAN activation. Plot details as in A. (C) Area under the curve (AUC) values of individual IPCs averaged in a 1 s window before activation onset (pre) and in a window from activation onset to 1 s after activation offset (act.) for all ModN lines. Gray, all recorded IPCs, colors, three clusters (color-coded as before). p-values were calculated using a paired Wilcoxon signed-rank test. (D) Upper panel: IPC responses to activation of the ‘empty’ sNPF line. One IPC showed a slight membrane potential increase that did not cause spikes but crossed the upper threshold, and seven IPCs remained completely unaffected. Lower panel: averaged AUC values of the eight IPCs recorded during activation of the ‘empty’ line (details as in C). Activation of this ‘empty’ line had no significant effect on the IPCs, as expected.
Figure 3 with 1 supplement
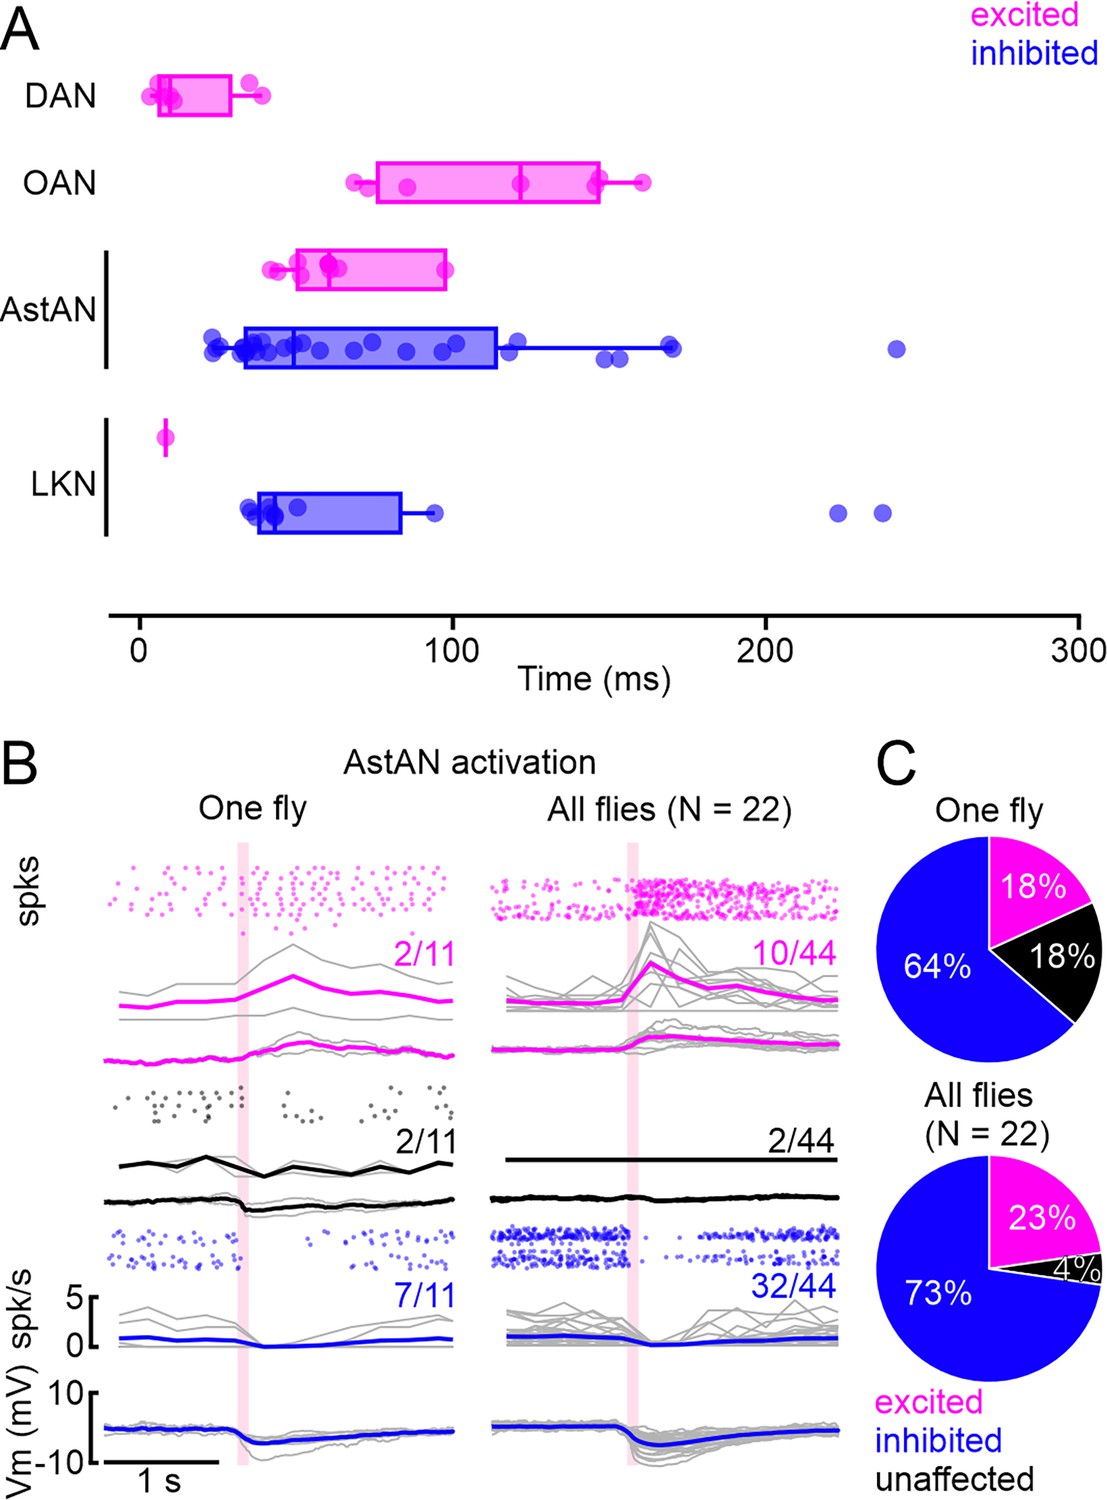
Latency analysis and singly fly recordings.
(A) Threshold-based latency analysis for excited (magenta) and inhibited (blue) insulin-producing cells (IPCs) during activation of dopamine (DANs), octopamine (OANs), neuropeptides AstA (AstANs), and LKNs, which had significant effects on the IPC activity upon activation. Activation onset at 0 s. Boxplots show median and interquartile range, dots represent individual recordings. Three outliers for AstAN between 0.4 and 0.8 not shown for clarity of inspection. (B) Patch-clamp recordings of 11 IPCs subsequently patched in the same fly reveal a similar distribution of excited, inhibited, and unaffected IPCs compared to recorded IPCs across all flies (Plot from Figure 2G.). (C) Cluster distribution across 11 cells in one fly and in 44 cells in 22 flies.
Figure 3—figure supplement 1
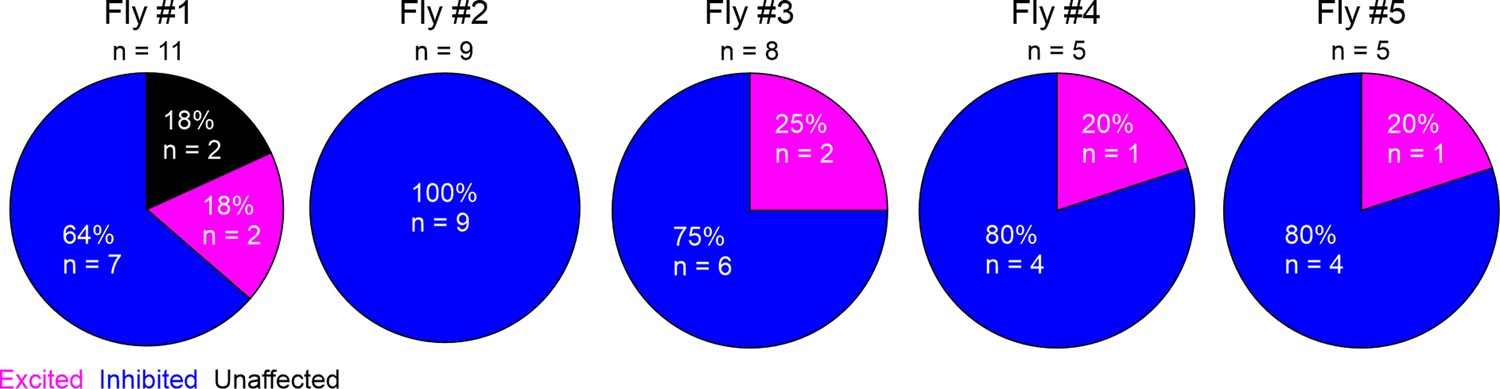
Cluster distribution of multiple insulin-producing cells (IPCs) recorded in the same individuals during neuropeptides AstA (AstANs) activation.
The recorded IPCs in Fly #1 (example from Figure 3) were divided into an excited, inhibited, and an unaffected cluster based on threshold clustering. In Fly #2, all IPCs were inhibited, while in Fly #3 – Fly #5 the recorded IPCs were either inhibited or excited. n=number of recorded IPCs.
Figure 4 with 1 supplement
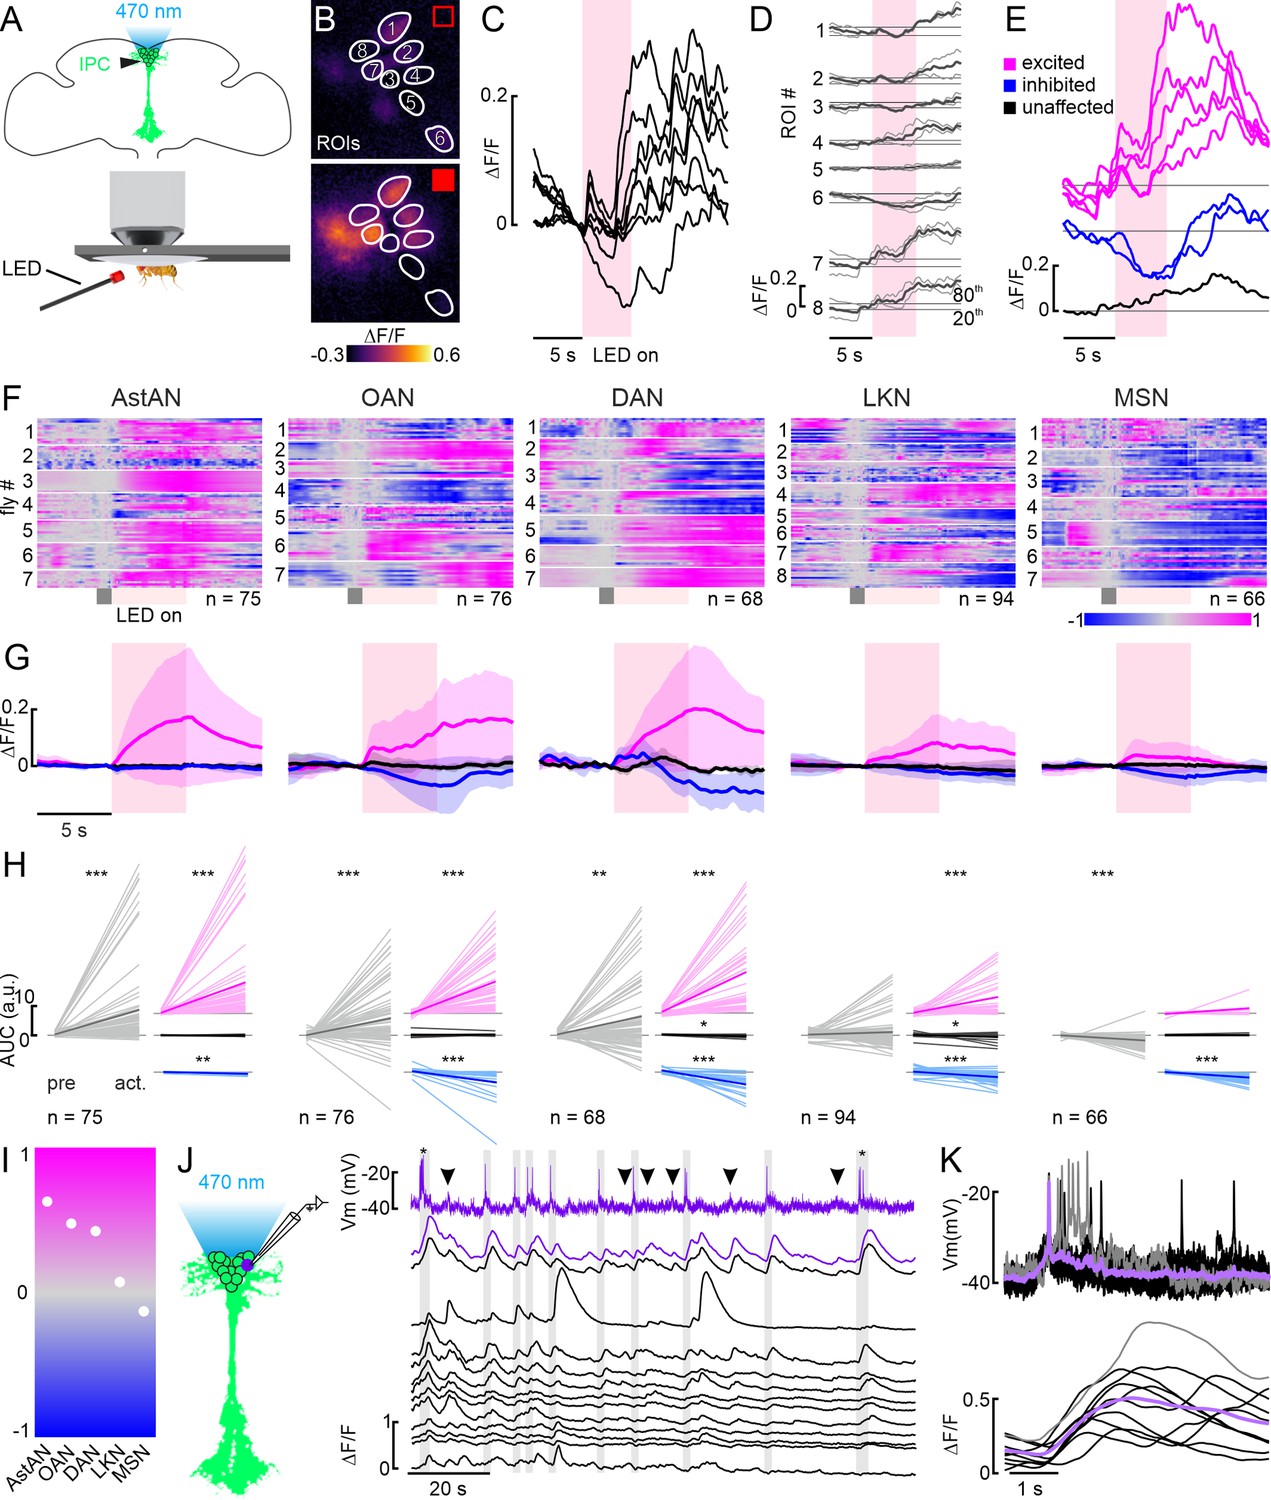
Modulation of the insulin-producing cell (IPC) population by aminergic and peptidergic neurons in calcium imaging experiments.
(A) Schematic of the setup for optogenetic activation during calcium imaging. (B) Example images of the GCaMP6m-expressing IPC cell bodies, delimited as ROIs during a time series before and during a 5 s optogenetic activation of octopamine (OANs) (C) Normalized ∆F/F traces for regions of interests (ROIs) in B during one activation (red shading). (D) Superimposition of two subsequent activations (thin lines) and the mean of both (thick line) from the example in B. The mean was used for further analysis steps. (E) Cluster analysis based on the 20th and 80th percentile of the baseline (see Material and methods) revealed three cluster within this one example animal. (F) Heatmaps of the mean ∆F/F traces of all recorded IPCs per driver line. Traces were baseline subtracted based on the activity during a 1 s window (gray box) before the 5 s activation (red box). (G) Mean ∆F/F traces (thick lines) for each cluster (color-coded as before) with respective standard deviation (shaded areas). Data correspond to the respective driver line indicated in F. (H) Area under the curve (AUC) of IPCs before activation (pre) and during activation (act.; from onset to 5 s after activation) for all recorded IPCs (gray, left) and for the three clusters (colors, right). p-values were calculated using the Wilcoxon signed-rank test (see Table 1 for all p-values). (I) Overall trends across all tested lines based on the AUC averaged across all IPC responses. (J) Simultaneous recording of one IPC via patch-clamp (first row, purple), and the same IPC (second row, purple ∆F/F trace) as well as 12 additional IPCs (black ∆F/F traces) via calcium imaging. Gray boxes indicate action potentials, asterisks indicate bursts of action potentials, and arrowheads point at sub-threshold membrane potential changes leading to calcium increases. (K) Superimposition of action potentials from J and corresponding ∆F/F traces (black traces, individual events, lavender trace, mean, gray trace, burst of action potentials, and respective ∆F/F trace).
Figure 4—figure supplement 1
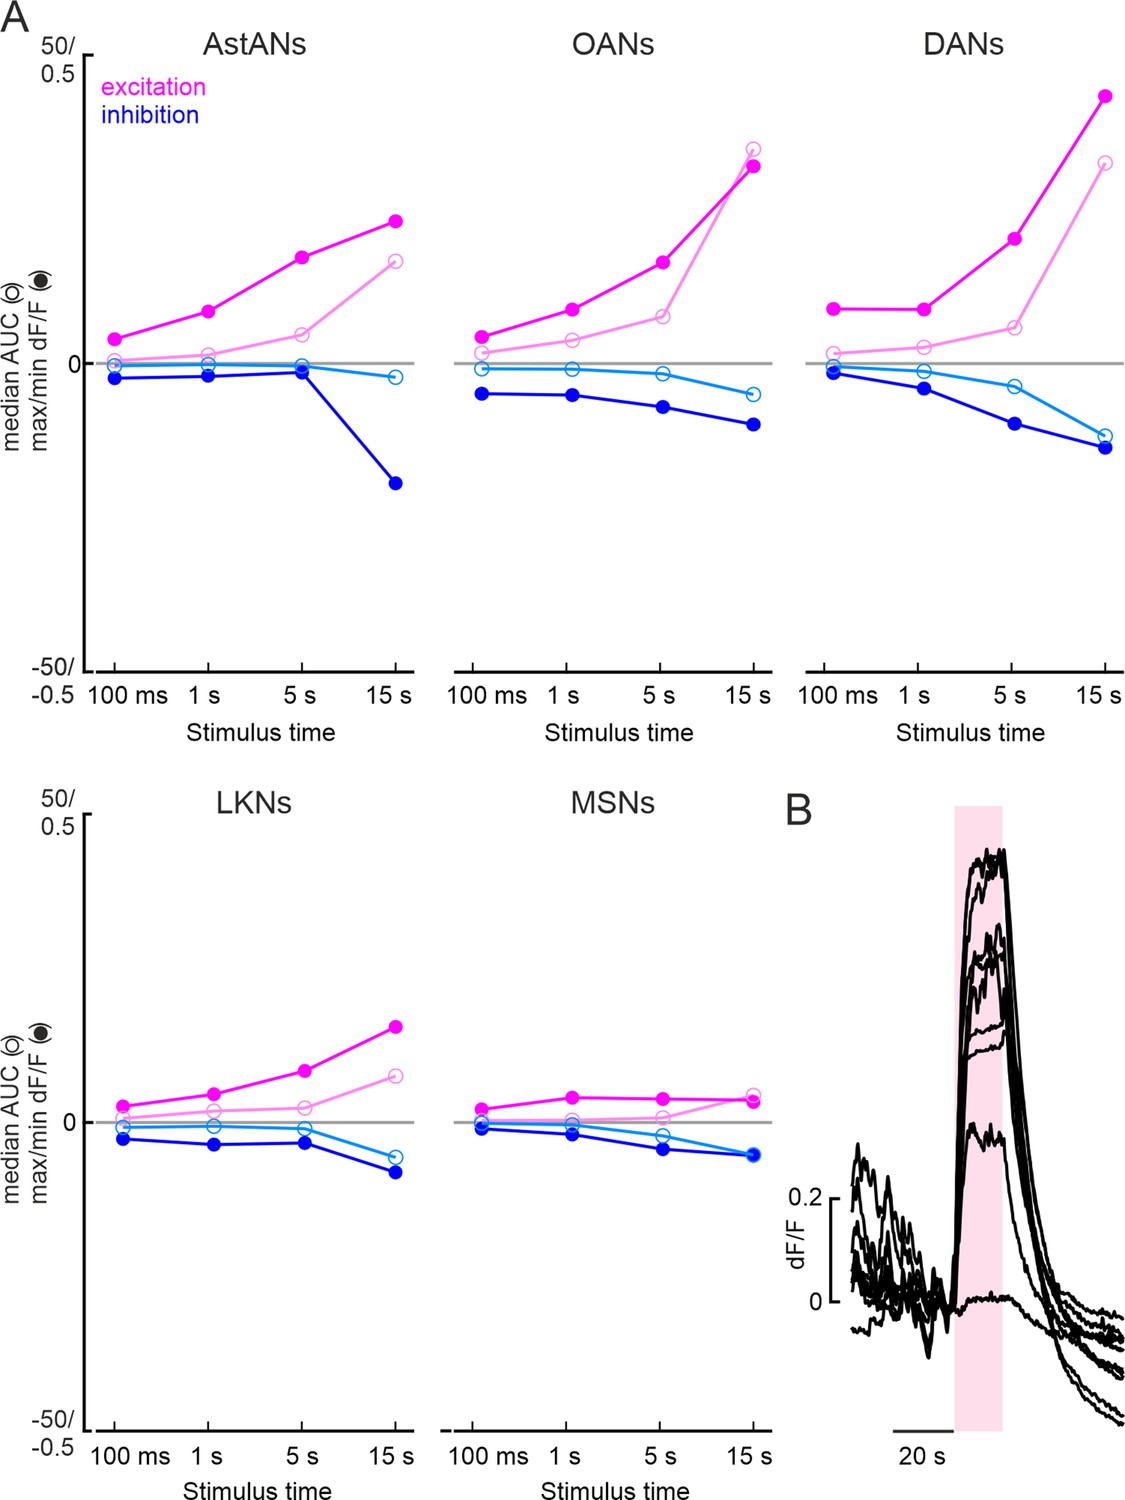
Comparison of insulin-producing cell (IPC) responses to ModN activation for different durations in calcium imaging recordings.
(A) Median area under the curve (AUC) (empty circles) and maximum and minimum dF/F values (filled circles) for different activation lengths and all ModNs tested. Magenta, excited, blue, inhibited. (B) Raw traces of 10 IPCs from one fly responding to 15 s AstAN activation revealed strong and robust responses during the whole activation period. After extensive activation, the activity did not return to baseline level, indicating depletion of calcium or deterioration of the IPCs.
Figure 5
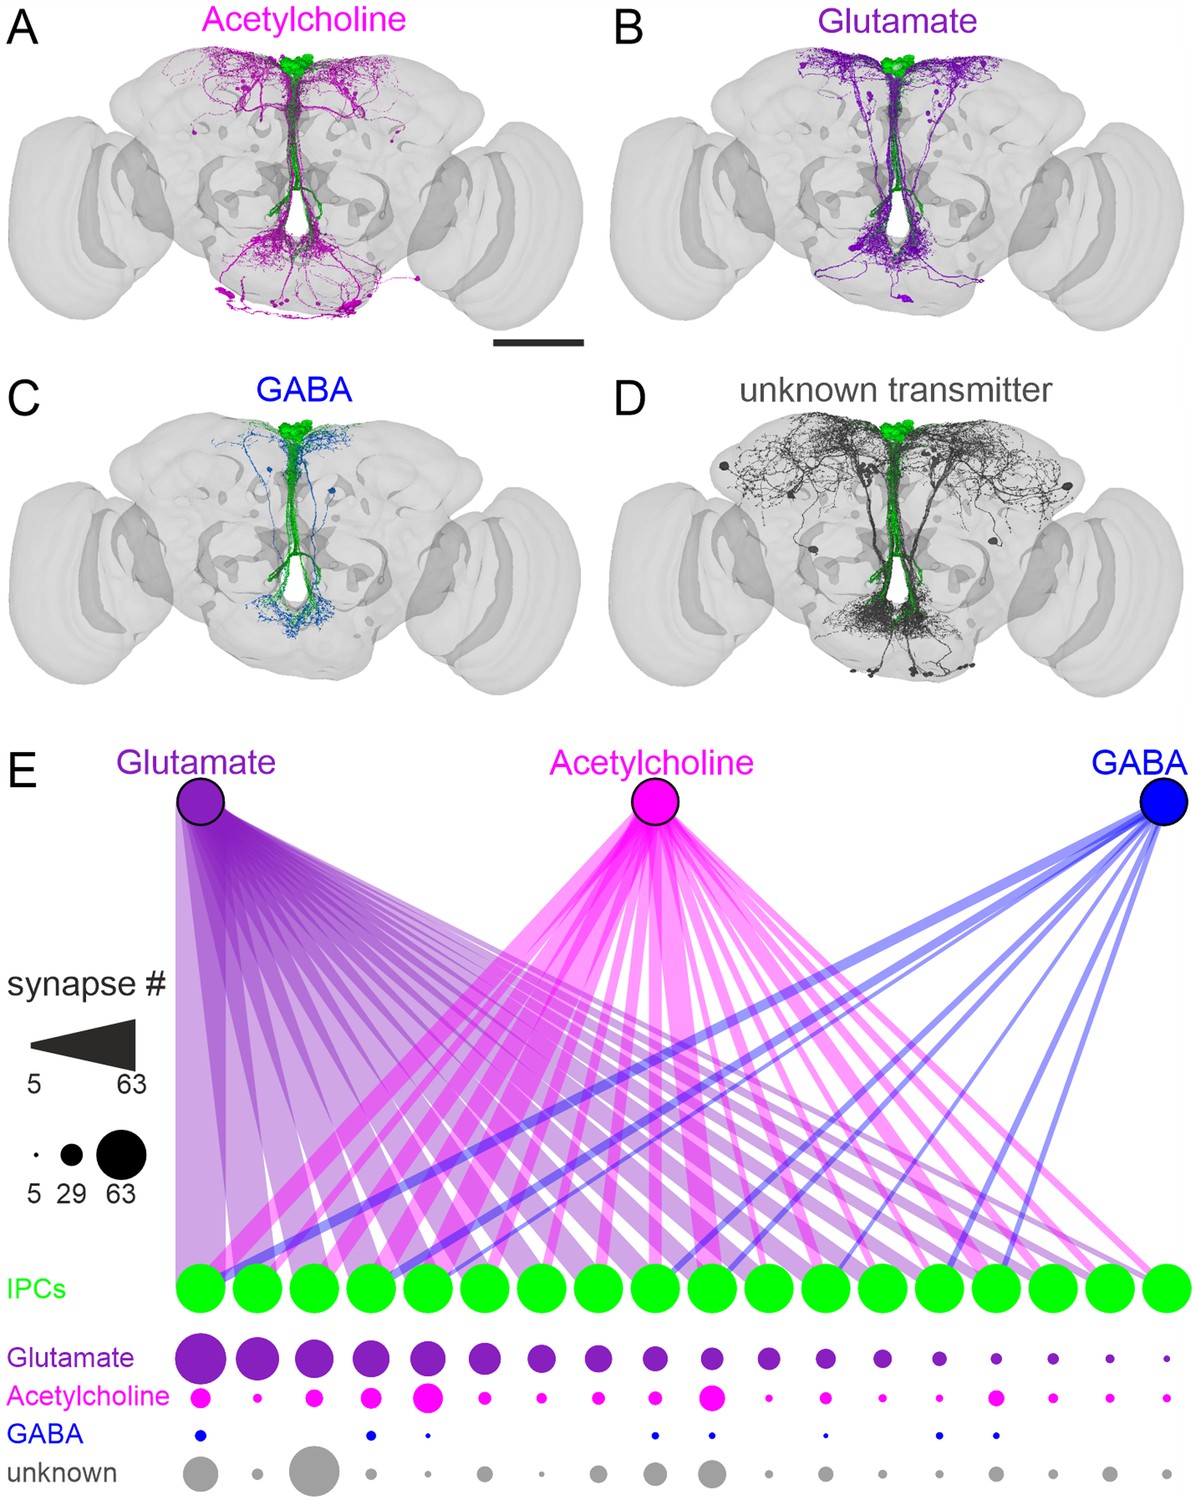
Neurons containing classical transmitters provide heterogeneous input to insulin-producing cells (IPCs).
(A – D) Presynaptic neurons to IPCs in the FlyWire connectome contain acetylcholine (A), glutamate (B), GABA (C), or unknown transmitters (D). Scale bar = 100 µm. (E) Connectivity map of presynaptic neurons containing glutamate (purple), acetylcholine (magenta), or GABA (blue) to individual IPCs (green). Connection strength is indicated with the numbers of synapses by line thickness (upper panel) and circle diameter (lower panel). Individual IPCs differ regarding their synaptic input and input strength. Note that 18 IPCs were identified in FlyWire (Musselman et al., 2011).
Figure 6
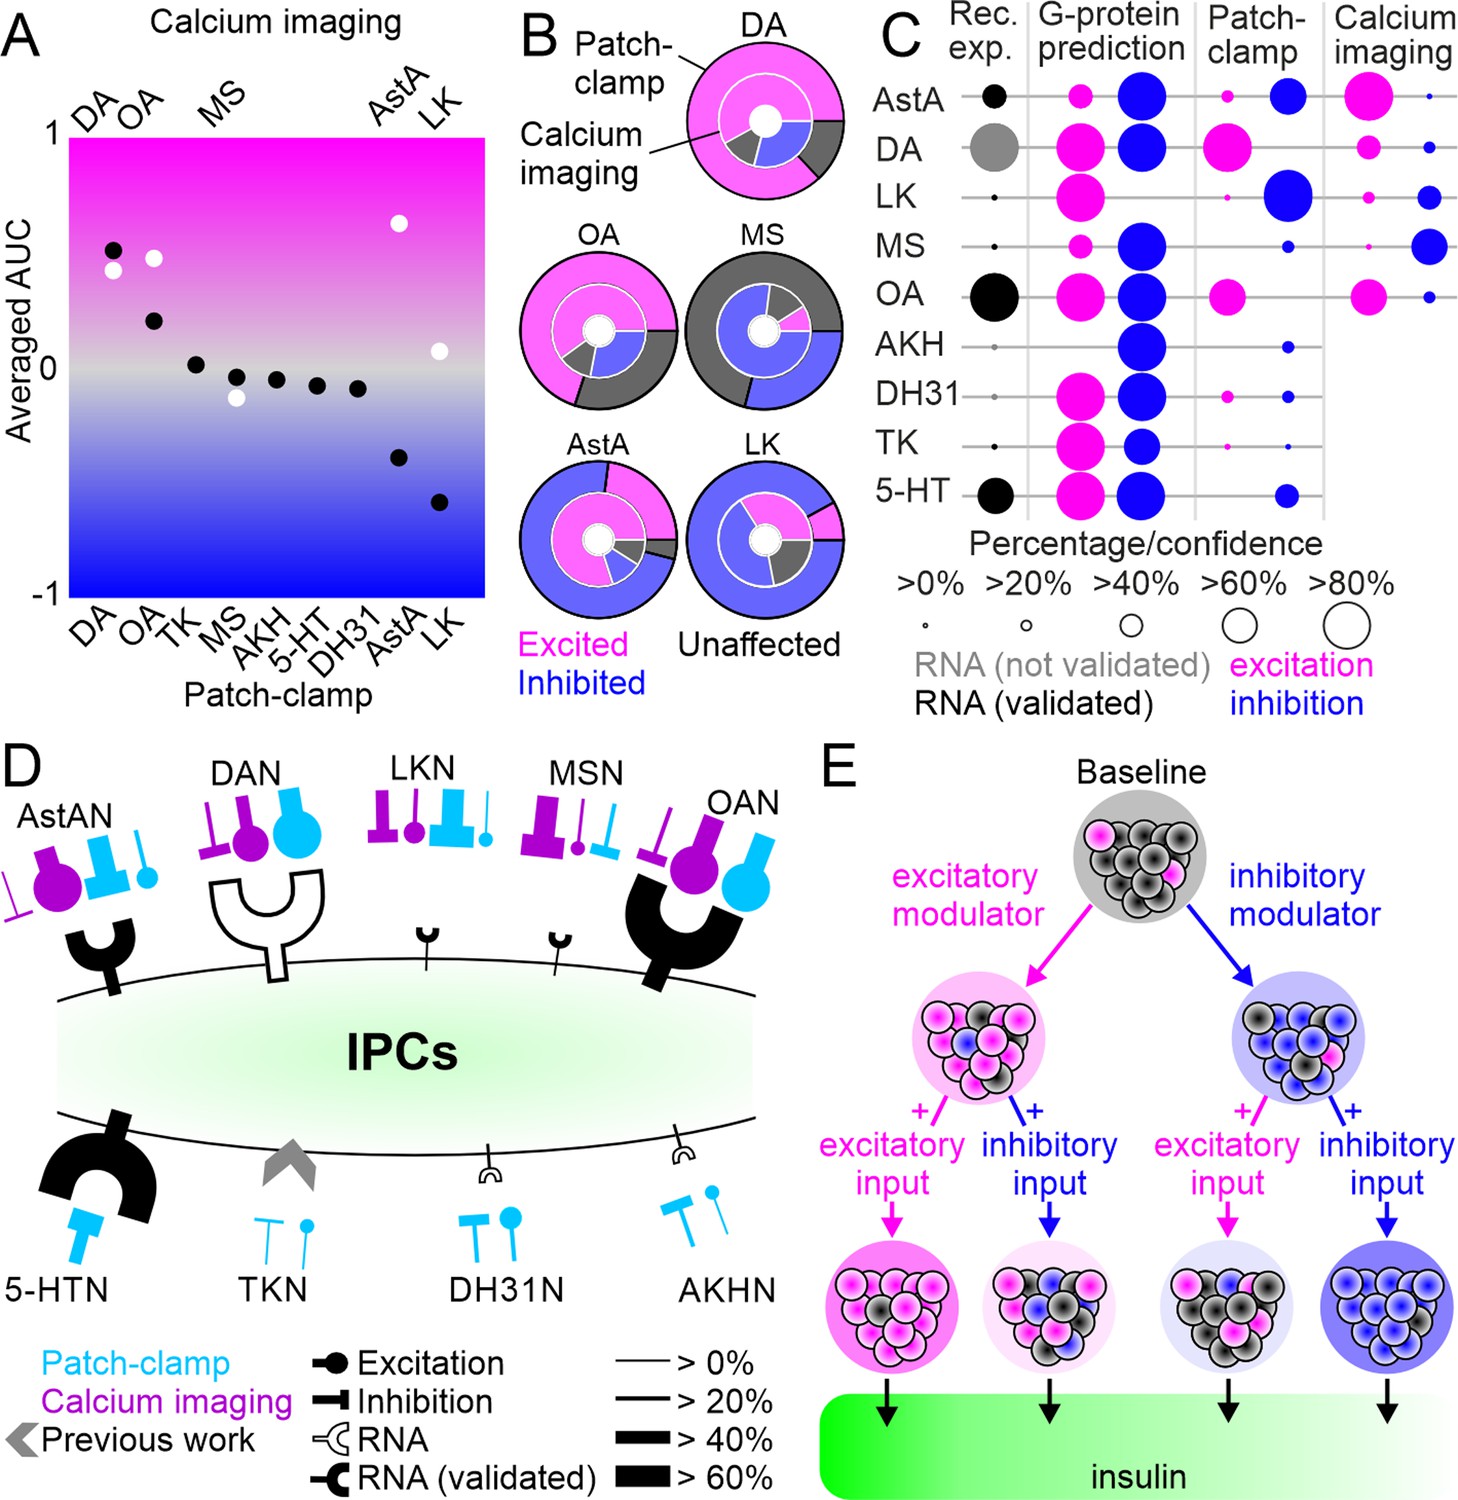
Summary of neuromodulation of insulin-producing cells (IPCs).
(A) Comparison of overall activity shifts for all driver lines and IPCs tested between patch-clamp (black) and calcium imaging (white). (B) Comparison of cluster proportions between patch-clamp (outer circles) and calcium imaging (inner circles). (C) Comparison of, expression data, G-protein coupling prediction, patch-clamp recording, and calcium imaging. Dots indicate percentage of IPCs for expression data, patch-clamp, and calcium imaging, and the confidence for G-protein prediction. For receptor expression data, black dots indicate the expression has been validated with receptor mapping. (D) Simplified model of IPC modulation. Overview of receptor expression and functional connectivity in patch-clamp (blue) and calcium imaging (purple) recordings for all modulatory inputs tested. Line thickness indicates fraction of involved IPCs. Receptor expression for TK from Birse et al., 2011. (E) Simplified hypothesis of IPC population activity shifts through excitatory or inhibitory modulator input and the effects of consecutive input on insulin output.
Author response image 1

Tables
Key resources table
| Reagent type (species) or resource | Designation | Source or reference | Identifiers | Additional information |
|---|---|---|---|---|
| Strain (D. melanogaster) | UAS-NLS-mCherry | Bloomington Drosophila Stock Center | RRID:BDSC_38425 | Used for receptor mapping |
| Strain (D. melanogaster) | Oct-TyrR-T2A-GAL4 | Bloomington Drosophila Stock Center | RRID:BDSC_86138 | Used for receptor mapping |
| Strain (D. melanogaster) | 5HT7-T2A-GAL4 | Bloomington Drosophila Stock Center | RRID:BDSC_84592 | Used for receptor mapping |
| Strain (D. melanogaster) | Oct-alpha2R-T2A-GAL4 | Bloomington Drosophila Stock Center | RRID:BDSC_84610 | Used for receptor mapping |
| Strain (D. melanogaster) | AstAR1-T2A-GAL4 | Deng et al., 2019 | Used for receptor mapping | |
| Strain (D. melanogaster) | MsR1-(B)-T2A-GAL4 | Bloomington Drosophila Stock Center | RRID:BDSC_84653 | Used for receptor mapping |
| Strain (D. melanogaster) | AstAR2-(A/C)-T2A-GAL4 | Bloomington Drosophila Stock Center | RRID:BDSC_84594 | Used for receptor mapping |
| Strain (D. melanogaster) | sNPFR-T2A-GAL4 | Bloomington Drosophila Stock Center | RRID:BDSC_84691 | Used for receptor mapping |
| Strain (D. melanogaster) | CCKLR17D1-T2A-GAL4 | Bloomington Drosophila Stock Center | RRID:BDSC_84605 | Used for receptor mapping |
| Strain (D. melanogaster) | CrzR-T2A-GAL4 | Kondo et al., 2020 | Used for receptor mapping | |
| Strain (D. melanogaster) | Dh31R-(A/B/C)-T2A-GAL4 | Bloomington Drosophila Stock Center | RRID:BDSC_84625 | Used for receptor mapping |
| Strain (D. melanogaster) | Dop2R-T2A-GAL4 | Bloomington Drosophila Stock Center | RRID:BDSC_84628 | Used for receptor mapping |
| Strain (D. melanogaster) | LkR-GAL4 Knock-in mutant | Zandawala et al., 2018 | Used for receptor mapping | |
| Strain (D. melanogaster) | Oct-alpha2R-Trojan-GAL4 | Bloomington Drosophila Stock Center | RRID:BDSC_67636 | Used for receptor mapping |
| Strain (D. melanogaster) | 5-HT1A-T2A-GAL4 | Bloomington Drosophila Stock Center | RRID:BDSC_84588 | Used for receptor mapping |
| Strain (D. melanogaster) | R96A08-LexA- p65-vk37::LexOp-dilp2::GFP;20x-UAS-CsChrimson- attp2/TM6b | Liessem et al., 2023 | Used for optogenetic activation during patch-clamp recordings | |
| Strain (D. melanogaster) | R96A08-LexA-p65-vk37/CyO;LexOp-GCaMP6m-vk5, 20X-UAS-CsChrimson. mVenus-su(Hw) attp1/TM6 | This study | Used for optogenetic activation during calcium imaging | |
| Strain (D. melanogaster) | TH-GAL4 | Friggi-Grelin et al., 2003 | Used for optogenetic activation | |
| Strain (D. melanogaster) | AstA-GAL4 | Bloomington Drosophila Stock Center | RRID:BDSC_84593 | Used for optogenetic activation |
| Strain (D. melanogaster) | Tdc2-GAL4 | Bloomington Drosophila Stock Center | RRID:BDSC_9313 | Used for optogenetic activation |
| Strain (D. melanogaster) | LK-GAL4 | Bloomington Drosophila Stock Center | RRID:BDSC_51993 | Used for optogenetic activation |
| Strain (D. melanogaster) | MS-GAL4 | Bloomington Drosophila Stock Center | RRID:BDSC_51986 | Used for optogenetic activation |
| Strain (D. melanogaster) | AKH-GAL4 | Bloomington Drosophila Stock Center | RRID:BDSC_25684 | Used for optogenetic activation |
| Strain (D. melanogaster) | TK-GAL4 | Bloomington Drosophila Stock Center | RRID:BDSC_51973 | Used for optogenetic activation |
| Strain (D. melanogaster) | sNPF-GAL4 | Bloomington Drosophila Stock Center | RRID:BDSC_51991 | Used for optogenetic activation |
| Strain (D. melanogaster) | DH31-GAL4 | Bloomington Drosophila Stock Center | RRID:BDSC_51988 | Used for optogenetic activation |
| Strain (D. melanogaster) | TrH-GAL4 | Yi Rao Laboratory Chinese Institute for Brain Research, Beijing (China) | CG9122 | Used for optogenetic activation |
| Strain (D. melanogaster) | GFP-p10 | Bloomington Drosophila Stock Center | RRID:BDSC_32201 | Used for patch-clamp recordings |
| Antibody | anti-RFP (primary guinea pig polyclonal) | Dr. Susan Brenner-Morton, Columbia, USA | Enhances RFP signal, diluted 1:5000 | |
| Antibody | anti-DILP2 (primary rabbit polyclonal) | Veenstra et al., 2008 | RRID:AB_2569969 | Used to label IPCs, diluted 1:2000 |
| Antibody | anti-nc82 (primary mouse monoclonal) | DSHB | RRID:AB_2314866 | Used to label neuropils, diluted 1:500 |
| Antibody | anti-GFP (primary chicken polyclonal) | Abcam | RRID:AB_2269474 | Enhances GFP signal, diluted 1:1000 |
| Antibody | Donkey anti-rabbit Alexa Fluor 647 (secondary donkey polyclonal) | ThermoFisher Scientific | RRID:AB_2536183 | Diluted 1:1000 |
| Antibody | Goat anti-guinea pig Alexa Fluor 555 (secondary goat polyclonal) | ThermoFisher Scientific | RRID:AB_2535856 | Diluted 1:1000 |
| Antibody | Donkey anti-mouse Alexa Fluor 488 (secondary donkey polyclonal) | ThermoFisher Scientific | RRID:AB_141607 | Diluted 1:1000 |
| Antibody | Goat anti-chicken Alexa Fluor 488 (secondary goat polyclonal) | ThermoFisher Scientific | RRID:AB_2534096 | Diluted 1:200 |
| Antibody | Goat anti-rabbit Alexa Fluor 555 (secondary goat polyclonal) | ThermoFisher Scientific | RRID:AB_2535849 | Diluted 1:200 |
| Antibody | Goat anti-mouse Alexa Fluor 635 (secondary goat polyclonal) | ThermoFisher Scientific | RRID:AB_2536184 | Diluted 1:400 |
| Chemical compound | SigmaCote | Sigma-Aldrich | cat. no. SL2; RRID:SCR_008988 | siliconizing reagent |
| Chemical compound | Vectashield Antifade Mounting Medium | VEC-H-1000 | Biozol | - |
| Chemical compound | all-trans-retinal | Sigma-Aldrich | R2500 | Used in optogenetic experiments |
| Software, algorithm | OCULAR | OCULAR | Image acquisition software (patch clamp) | |
| Software, algorithm | Micro-Manager 2.0 for Image J | Edelstein et al., 2014 | Image acquisition software (calcium imaging) | |
| Software, algorithm | pCLAMP 10 | Molecular Devices | Used for recordings (Optogenetic activation and patch clamp) | |
| Software, algorithm | MATLAB R2021a | The Mathworks | Used for data analysis and statistical testing | |
| Software, algorithm | Jupyter Notebook | Project Jupyter | Pre-processing of calcium imaging data |
-
BDSC = Bloomington Drosophila Stock Center.
Table 1
p-values for calcium imaging area under the curves (AUCs) before and after activation.
| Line | p-values | |||
|---|---|---|---|---|
| Global | Excited | Unaffected | inhibited | |
| AstAN | <0.0001 | <0.0001 | 0.6875 | 0.0078 |
| OAN | <0.0001 | <0.0001 | 0.9101 | <0.0001 |
| DAN | 0.0036 | <0.0001 | 0.0195 | 0.0001 |
| LKN | 0.3684 | <0.0001 | 0.0495 | <0.0001 |
| MSN | <0.0001 | 0.1562 | 0.3593 | <0.0001 |
Additional files
-
Supplementary file 1
Tables listing abbreviations used for receptors, neuropeptides, and biogenic amines (A) and G-protein prediction scores for selected receptors in insulin-producing cells (IPCs) (B).
- https://cdn.elifesciences.org/articles/99548/elife-99548-supp1-v1.docx
-
MDAR checklist
- https://cdn.elifesciences.org/articles/99548/elife-99548-mdarchecklist1-v1.docx
Download links
A two-part list of links to download the article, or parts of the article, in various formats.
Downloads (link to download the article as PDF)
Open citations (links to open the citations from this article in various online reference manager services)
Cite this article (links to download the citations from this article in formats compatible with various reference manager tools)
Aminergic and peptidergic modulation of insulin-producing cells in Drosophila
eLife 13:RP99548.
https://doi.org/10.7554/eLife.99548.3


