Empowering AlphaFold2 for protein conformation selective drug discovery with AlphaFold2-RAVE
- Institute for Physical Science and Technology, University of Maryland, United States
- University of Maryland Institute for Health Computing, United States
- Biophysics Program, University of Maryland, United States
- Department of Chemistry and Biochemistry, University of Maryland, United States
Figures
Figure 1
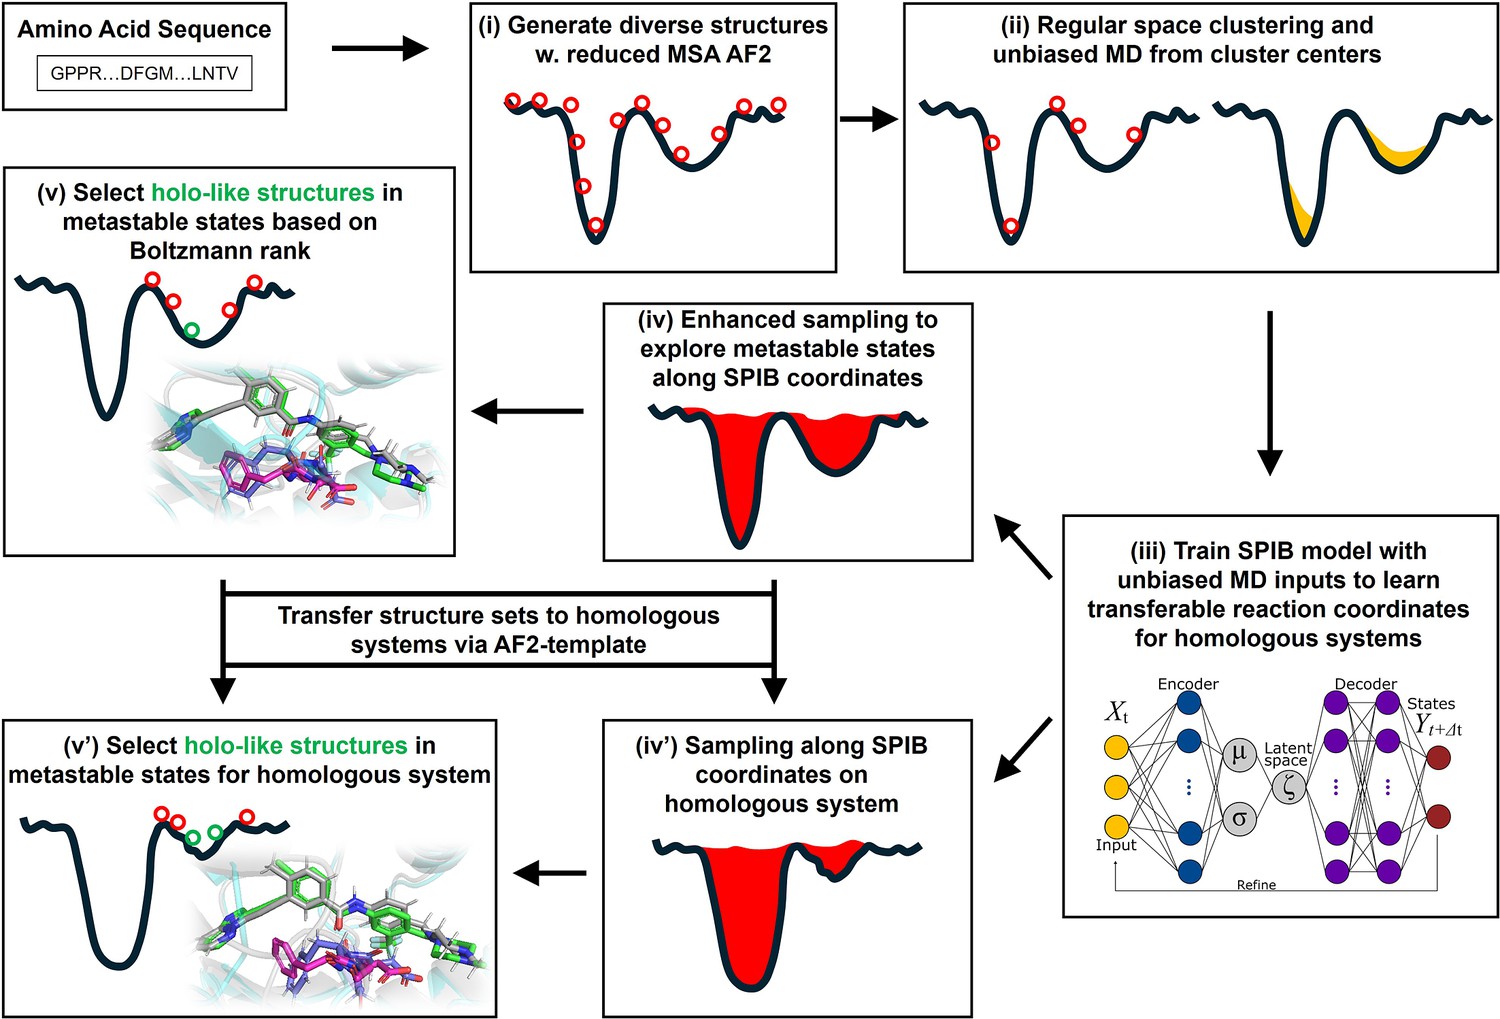
A schematic of the AF2RAVE-Glide workflow.
A schematic of the AF2RAVE-Glide workflow: (i) decoy structures generated by reduced multiple sequence alignment (MSA) AlphaFold2 (AF2), (ii) regular space clustering and unbiased molecular dynamics (MD) simulations starting from cluster centers, (iii) state predictive information bottleneck model (SPIB, a reweighted autoencoded variational Bayes for enhanced sampling [RAVE] variant) to learn reaction coordinates from unbiased MD, (iv) enhanced sampling runs to calculate free energy landscape, (v) distinguish holo-like structures from decoys in metastable states based on Boltzmann rank and conduct Glide XP or Induced Fit docking (IFD) on holo-like structures for ligands targeting metastable states. (iv’) and (v’) The decoy structure set and the learnt SPIB coordinates are transferable to homologous systems.
Figure 2 with 1 supplement
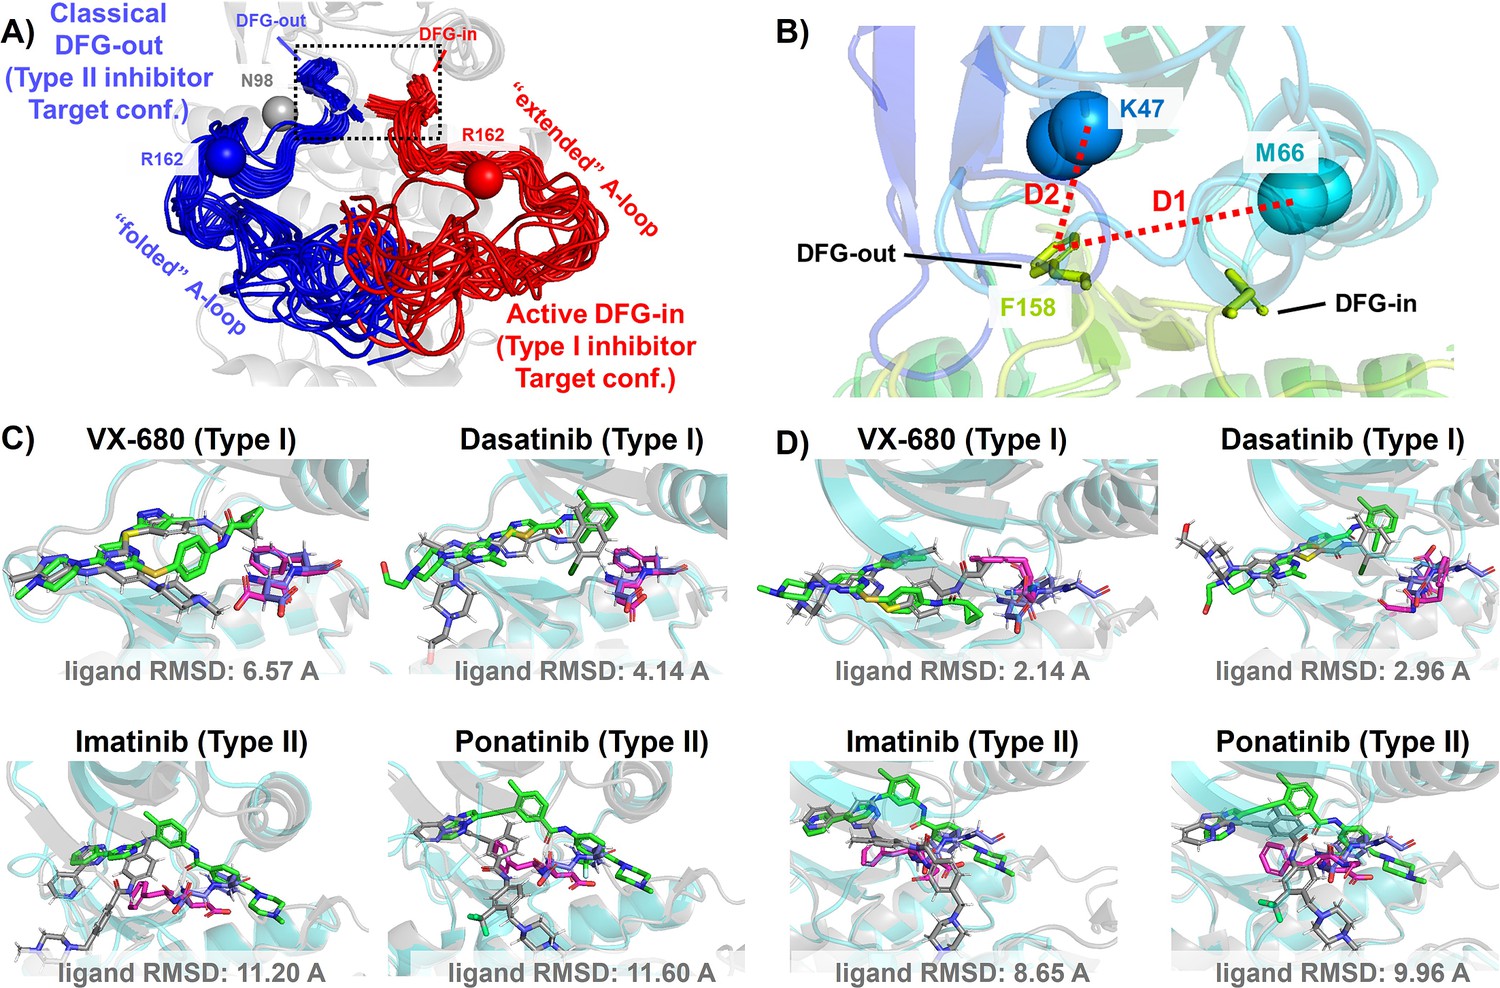
DFG-in and DFG-out conformation adopted by DDR1 kinase and their relation with Type I and Type II inhibitors.
(A) The NMR (nuclear magnetic resonance) structures of Abl1 kinase overlay, comparing the activation loop (A-loop) in the active DFG-in state (red, Protein Data Bank [PDB]: 6XR6) with the classical DFG-out state (blue, PDB: 6XRG). Type I inhibitors target the active DFG-in state, where the DFG motif adopting the DFG-in configuration and the A-loop adopting the ‘extended’ configuration, while type II inhibitors target the classical DFG-out state, where the DFG motif adopting the DFG-out configuration and the A-loop is ‘folded’. The distance between CB atoms of residue N98 (gray bead) and residue R162 (red/blue bead) in Abl1 kinase serves as an order parameter here to illustrate the location of the A-loop. The dashed black block emphasizes the different configurations of the DFG motif in these two states. (B) The Dunbrack definition for DFG motif configuration is employed here. The Dunbrack space is delineated by two-order parameters: D1=dist(F158-CZ, M66-CA),D2=dist(F158-CZ, K47-CA). (Cor D) The docking poses with the lowest ligand RMSD for four known kinase inhibitors targeting the Abl1 or DDR1 kinase AlphaFold2 (AF2) structure, generated by Glide XP. Co-crystallized structures are shown as light-cyan cartoons (proteins), green sticks (ligand), and magenta sticks (DFG motif). Docking poses are shown as light-gray cartoons (proteins), gray sticks (ligand), and blue sticks (DFG motif). Comparing with type I inhibitors, AF2 structures of protein kinases fail to dock with type II inhibitors.
Figure 2—figure supplement 1
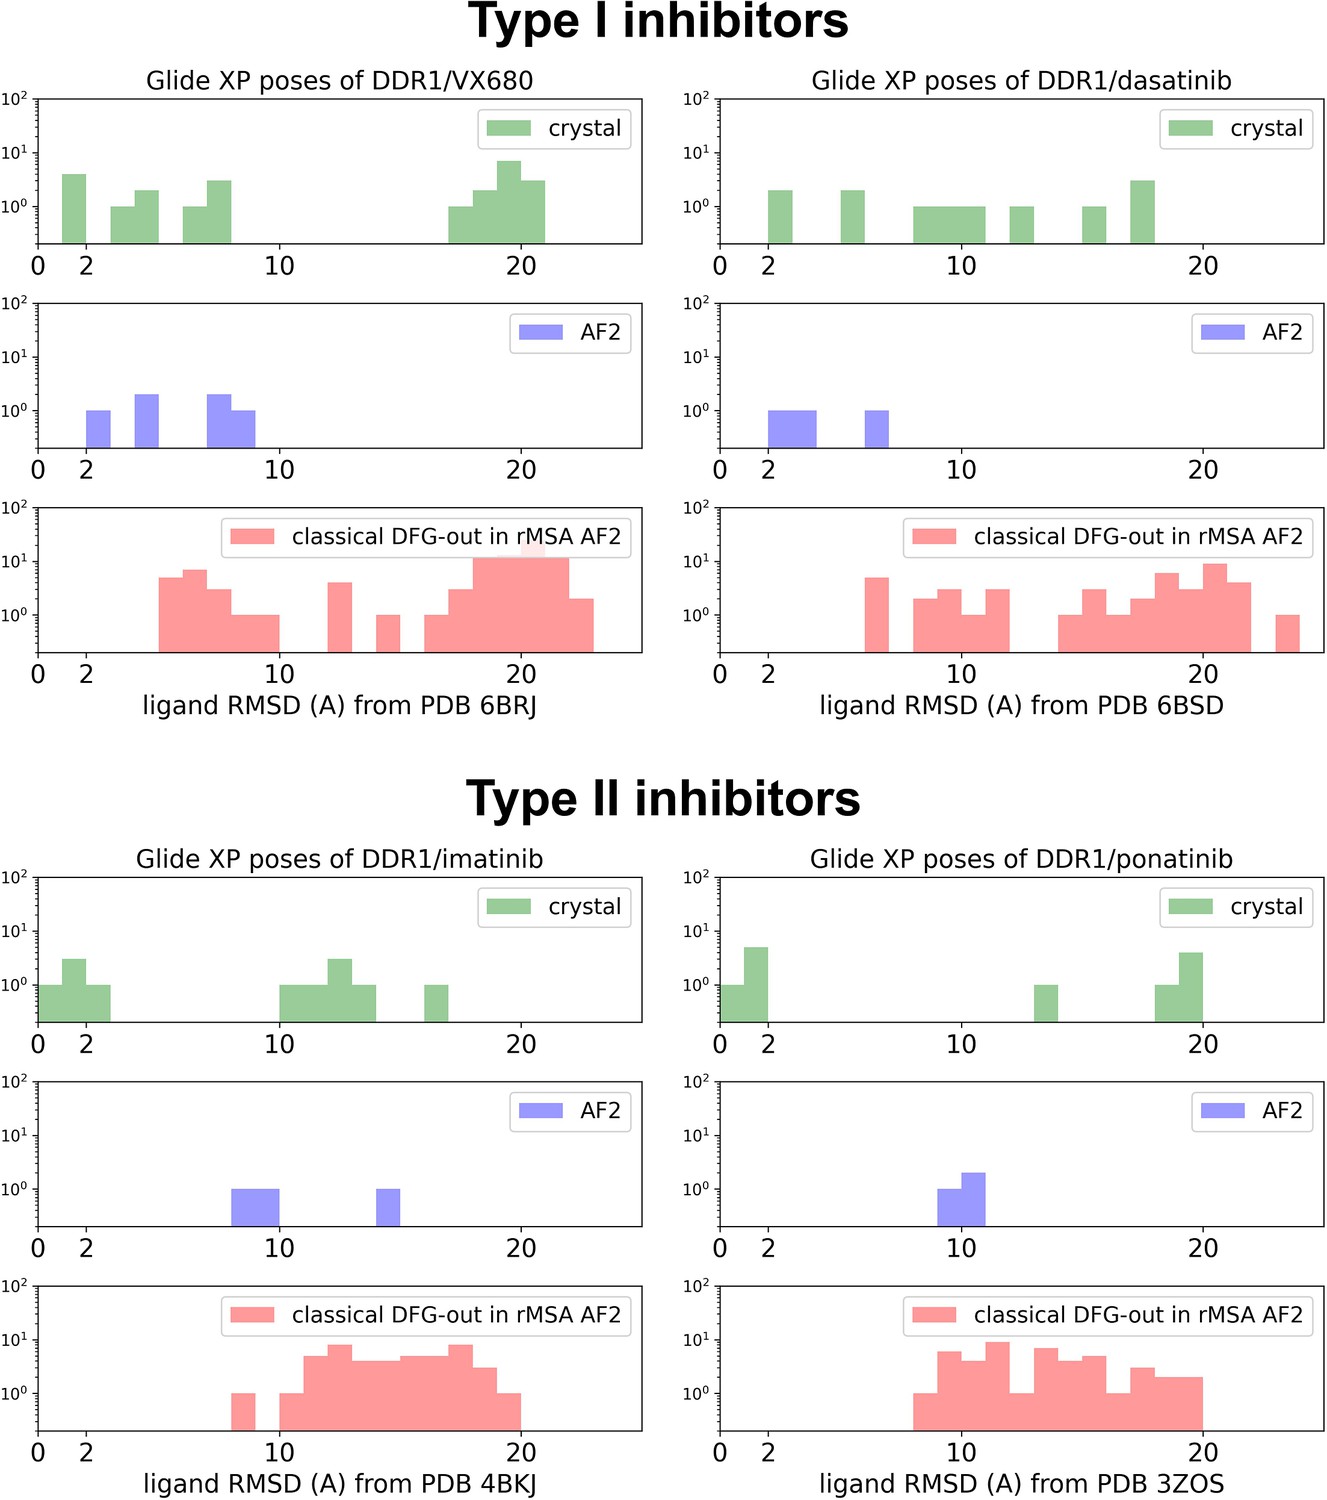
The distributions of ligand RMSDs for Glide XP docking poses of DDR1 and type I/type II inhibitors (upper/lower panel).
Results from cross-docking against four crystal holo structures, docking against the AF structure, and docking against 15 classical DFG-out structure in reduced multiple sequence alignment (rMSA) AlphaFold2 (AF2) ensemble are shown as green, blue, and red, separately.
Figure 3 with 6 supplements
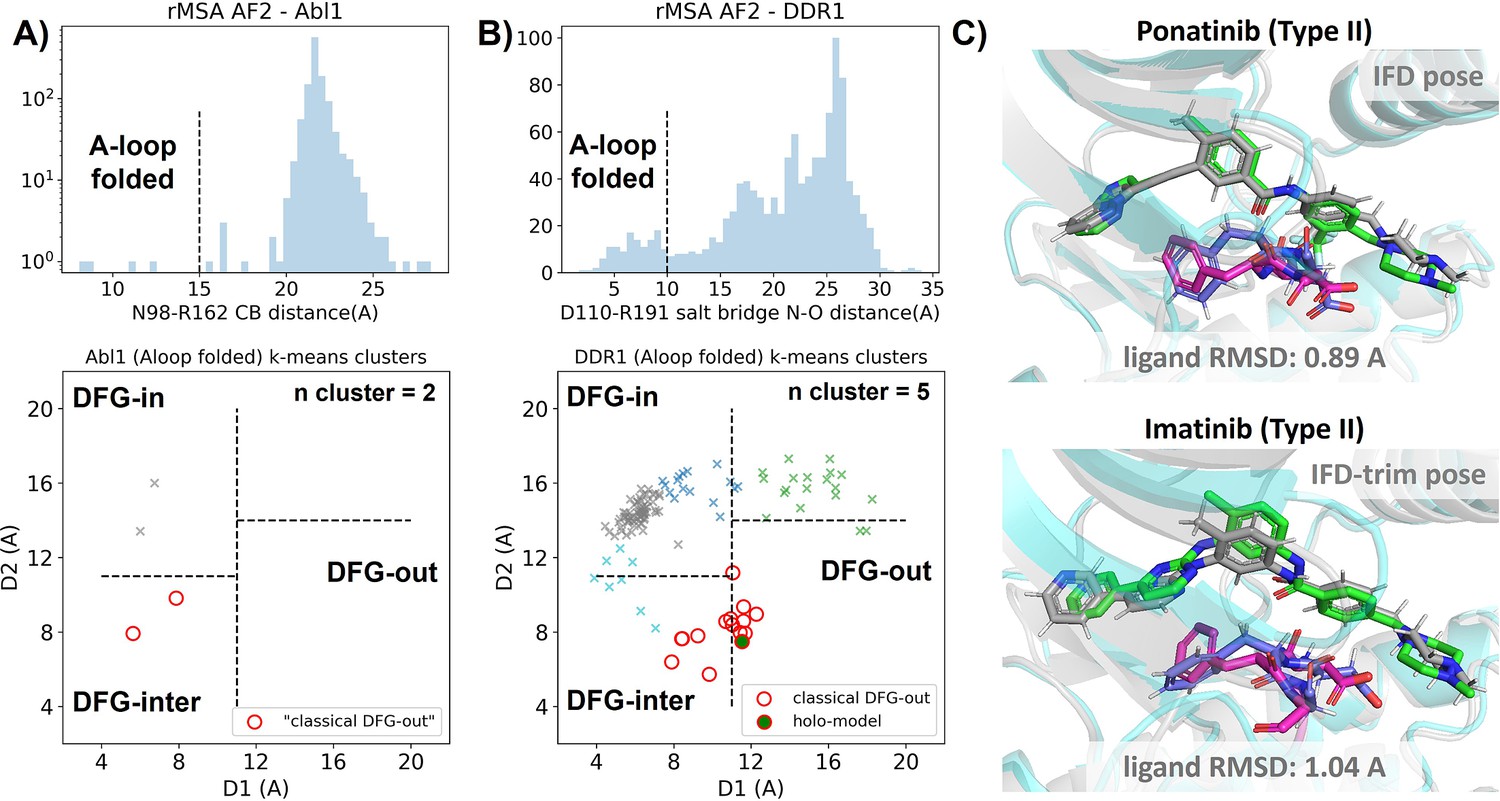
Reduced MSA AF2 is capable of generating crystal-like DFG-out state for DDR1 kinase.
(A) Upper panel: distribution of A-loop location for the reduced multiple sequence alignment (MSA) AlphaFold2 (AF2) structures of Abl1 kinase. 4 out of 1198 structures are A-loop folded. Lower panel: k-means clustering of four A-loop folded Abl1 structures in Dunbrack space, with the number of clusters (n cluster) set to 2. The structures in the cluster closest to the classical DFG-out state (red circles) fail to dock with type II inhibitors using Induced Fit docking (IFD). (B) Upper panel: distribution of A-loop location for the reduced MSA AF2 structures of DDR1 kinase. 124 out of 1147 structures are A-loop folded. Lower panel: k-means clustering of 124 A-loop folded DDR1 structures in Dunbrack space, with n cluster set to 5. Among the 15 structures in the cluster closest to the classical DFG-out state (red circles), one structure (‘holo-model’, highlighted by a red circle filled with green) demonstrates successful docking with type II inhibitors, showcasing a ligand RMSD<2 Å, utilizing IFD or an extended-sampling version of IFD, IFD-trim. (C) The docking poses with the lowest ligand RMSD for two type II kinase inhibitors targeting the DDR1 kinase ‘holo-model’ structure, generated by IFD or IFD-trim. The color code is the same as Figure 2.
Figure 3—figure supplement 1
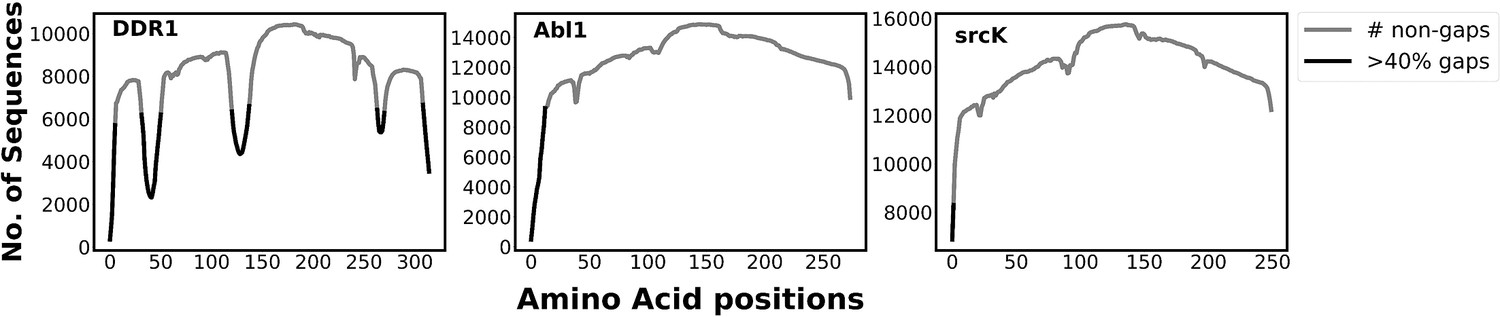
The plot illustrates the number of gaps in the multiple sequence alignment (MSA) generated by mmseq2 (using ColabFold; Mirdita et al., 2022) for different kinases.
The non-gap count describes the coverage of each position in the MSA. The presence of residue positions with gap counts higher than 40% of the total sequence in DDR1 implies that it has fewer conserved regions than abl1 kinase and src kinase. This characteristic of DDR1 MSA enables the reduced MSA (rMSA) AlphaFold2 (AF2) protocol to generate multiple conformations for DDR1, including the classical DFG-out conformation, by initializing it at various states. However, the highly conserved nature of abl1 and src makes it challenging for the rMSA AF2 to initialize at a state that can lead to a classical DFG-out conformation. Therefore, we used the AlphaFold template protocol to overcome this initialization issue with rMSA AF2.
Figure 3—figure supplement 2
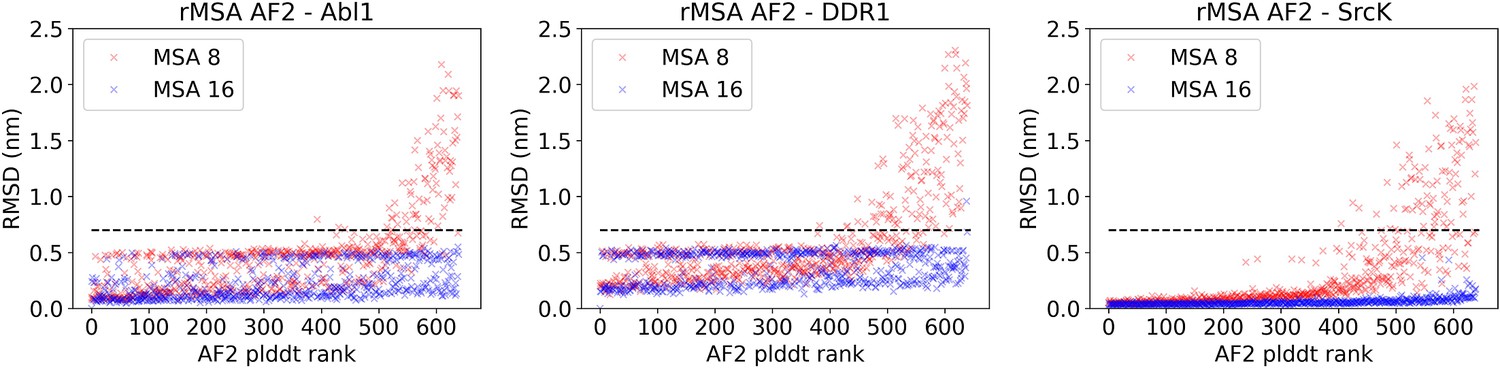
The AlphaFold2 (AF2) pLDDT rank is plotted against the CA RMSDs from the AF2 structure (the one with the highest pLDDT) for each structure in the reduced multiple sequence alignment (rMSA) AF2 ensemble for Abl1, DDR1, or Src kinase.
An RMSD cutoff of 7 Å (dashed black line) is applied to filter out unphysical structures with large RMSD from the native structure. Each rMSA AF2 ensemble consists of 1280 structures, 640 for MSAs of depth 8:16 (red) and 16:32 (blue), separately.
Figure 3—figure supplement 3
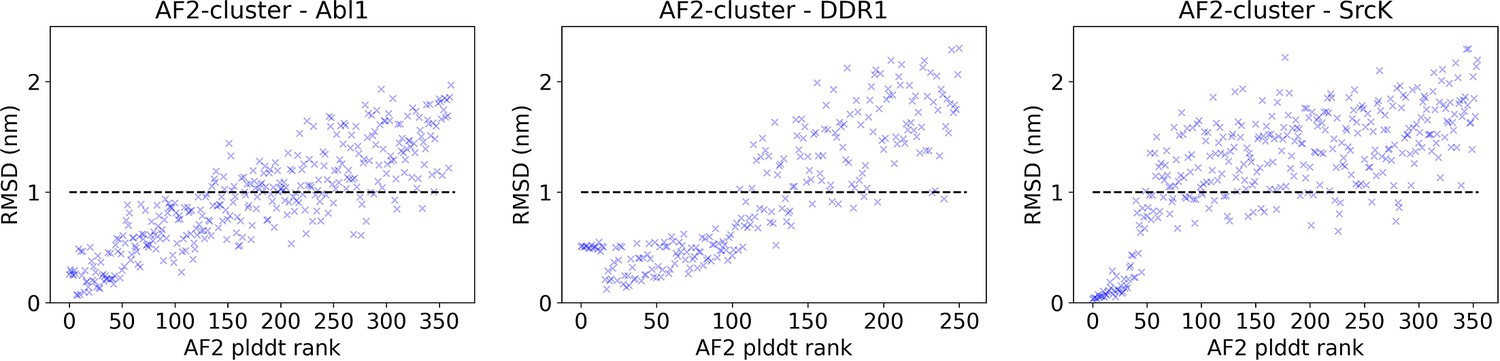
The AlphaFold2 (AF2) pLDDT rank is plotted against the CA RMSDs from the AF2 structure for each structure in the AF2-cluster ensemble for Abl1, DDR1, or SrcK.
An RMSD cutoff of 10 Å (dashed black line) is applied to filter out unphysical structures with large RMSD from the native structure. After the RMSD filter, 197 out of 362 structures remain for Abl1, 134 out of 251 structures remain for DDR1, and 93 out of 355 structures remain for SrcK.
Figure 3—figure supplement 4
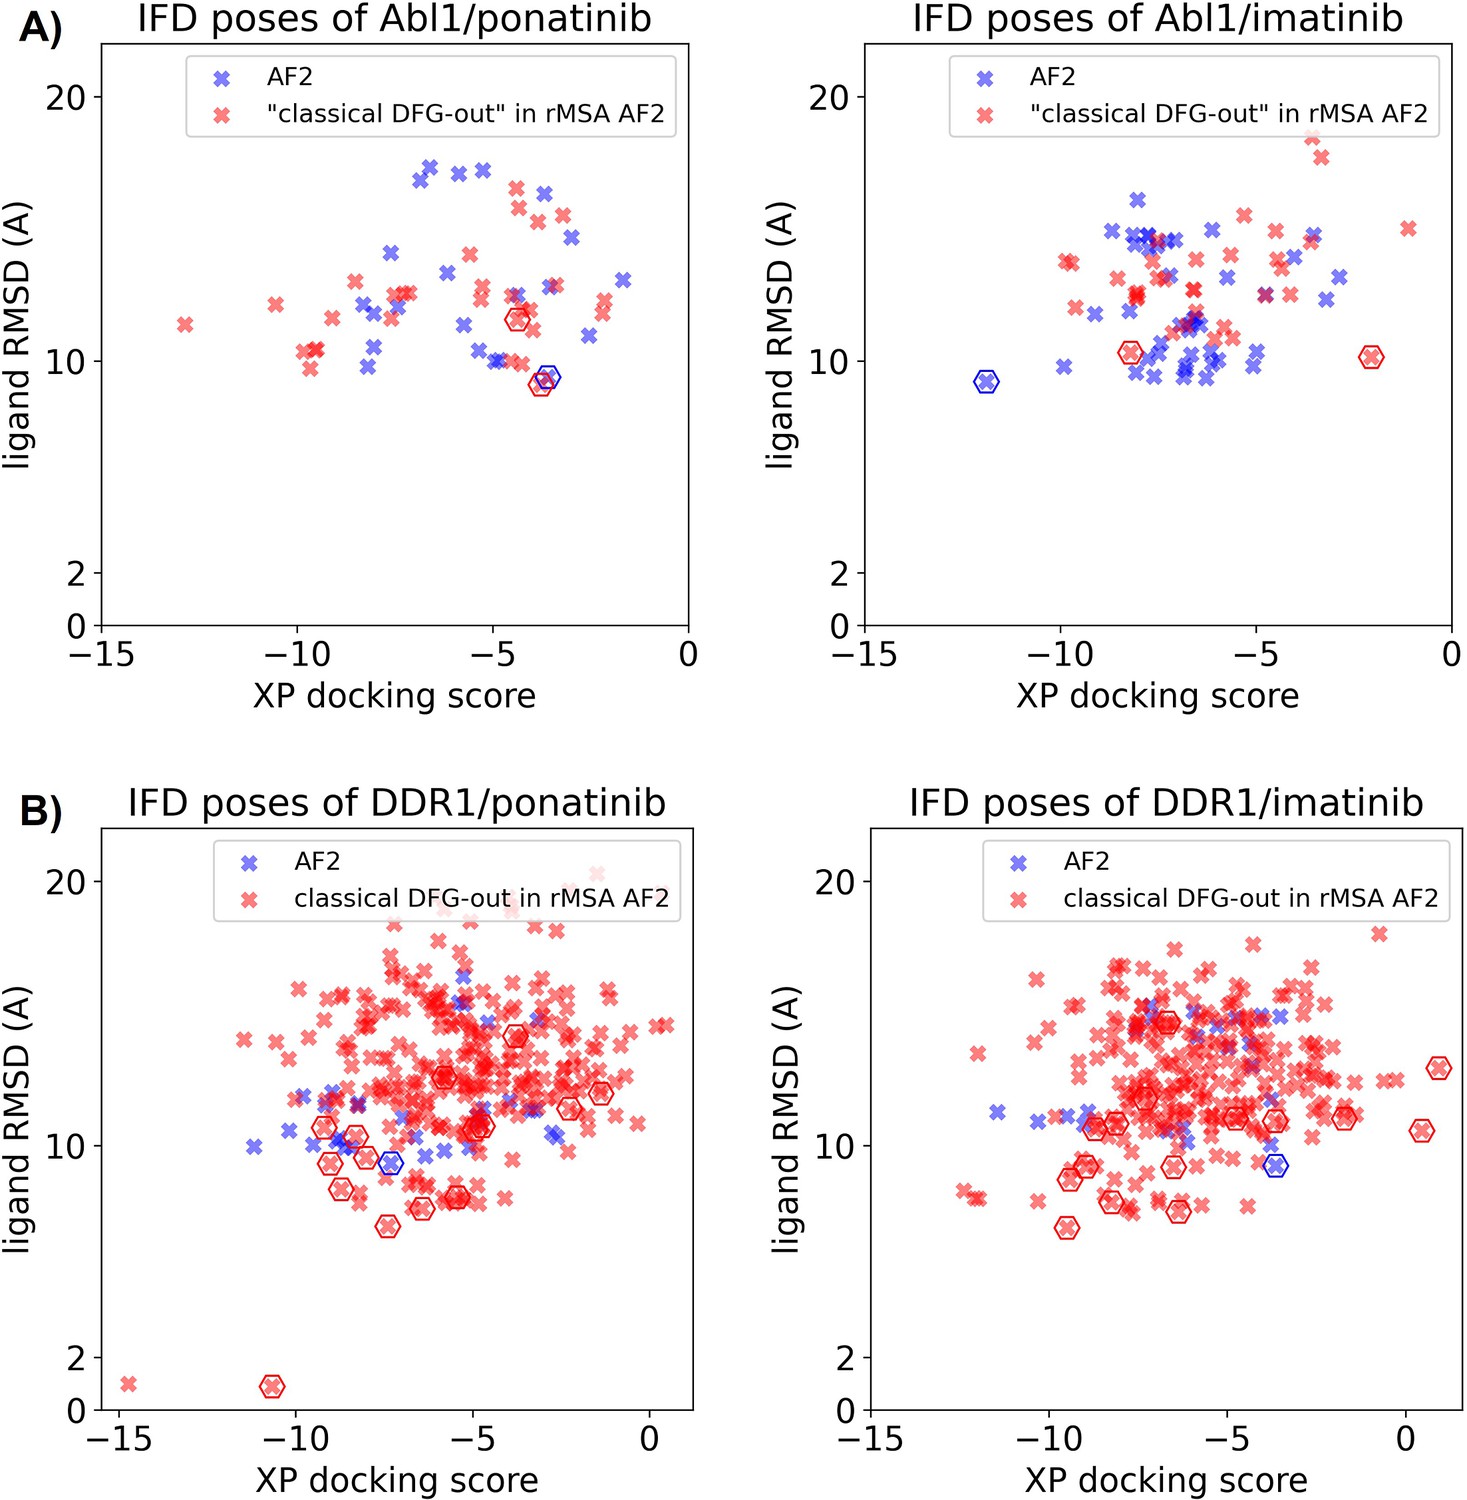
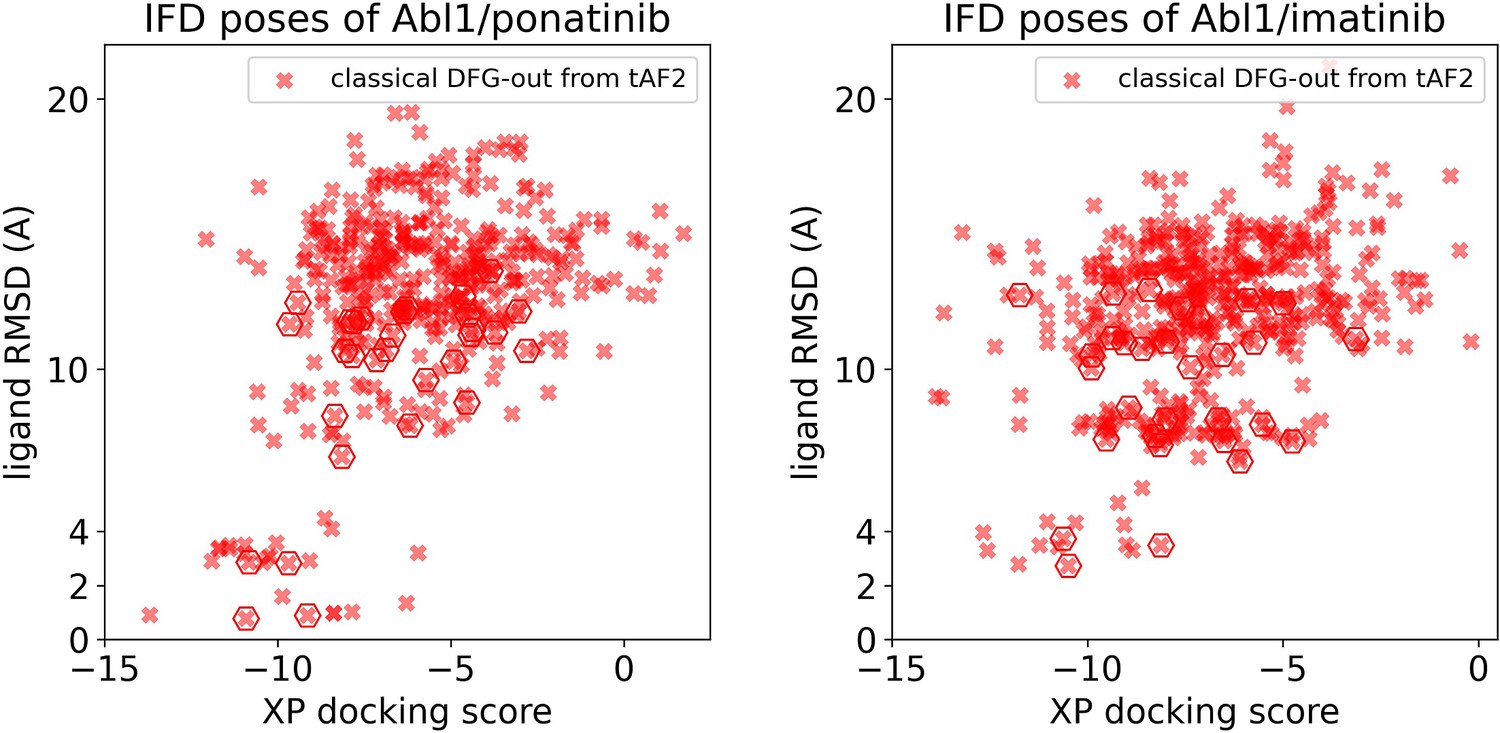
Ligand RMSDs are plotted against the docking scores for the Induced Fit docking (IFD) poses of type II inhibitors (ponatinib and imatinib) against AlphaFold2 (AF2) structure (blue) or classical DFG-out structures in reduced multiple sequence alignment (rMSA) AF2 ensembles (red).
(A) IFD results for Abl1. (B) IFD results for DDR1. The pose with the lowest ligand RMSD from each input structure is marked by hexagon.
Figure 3—figure supplement 5
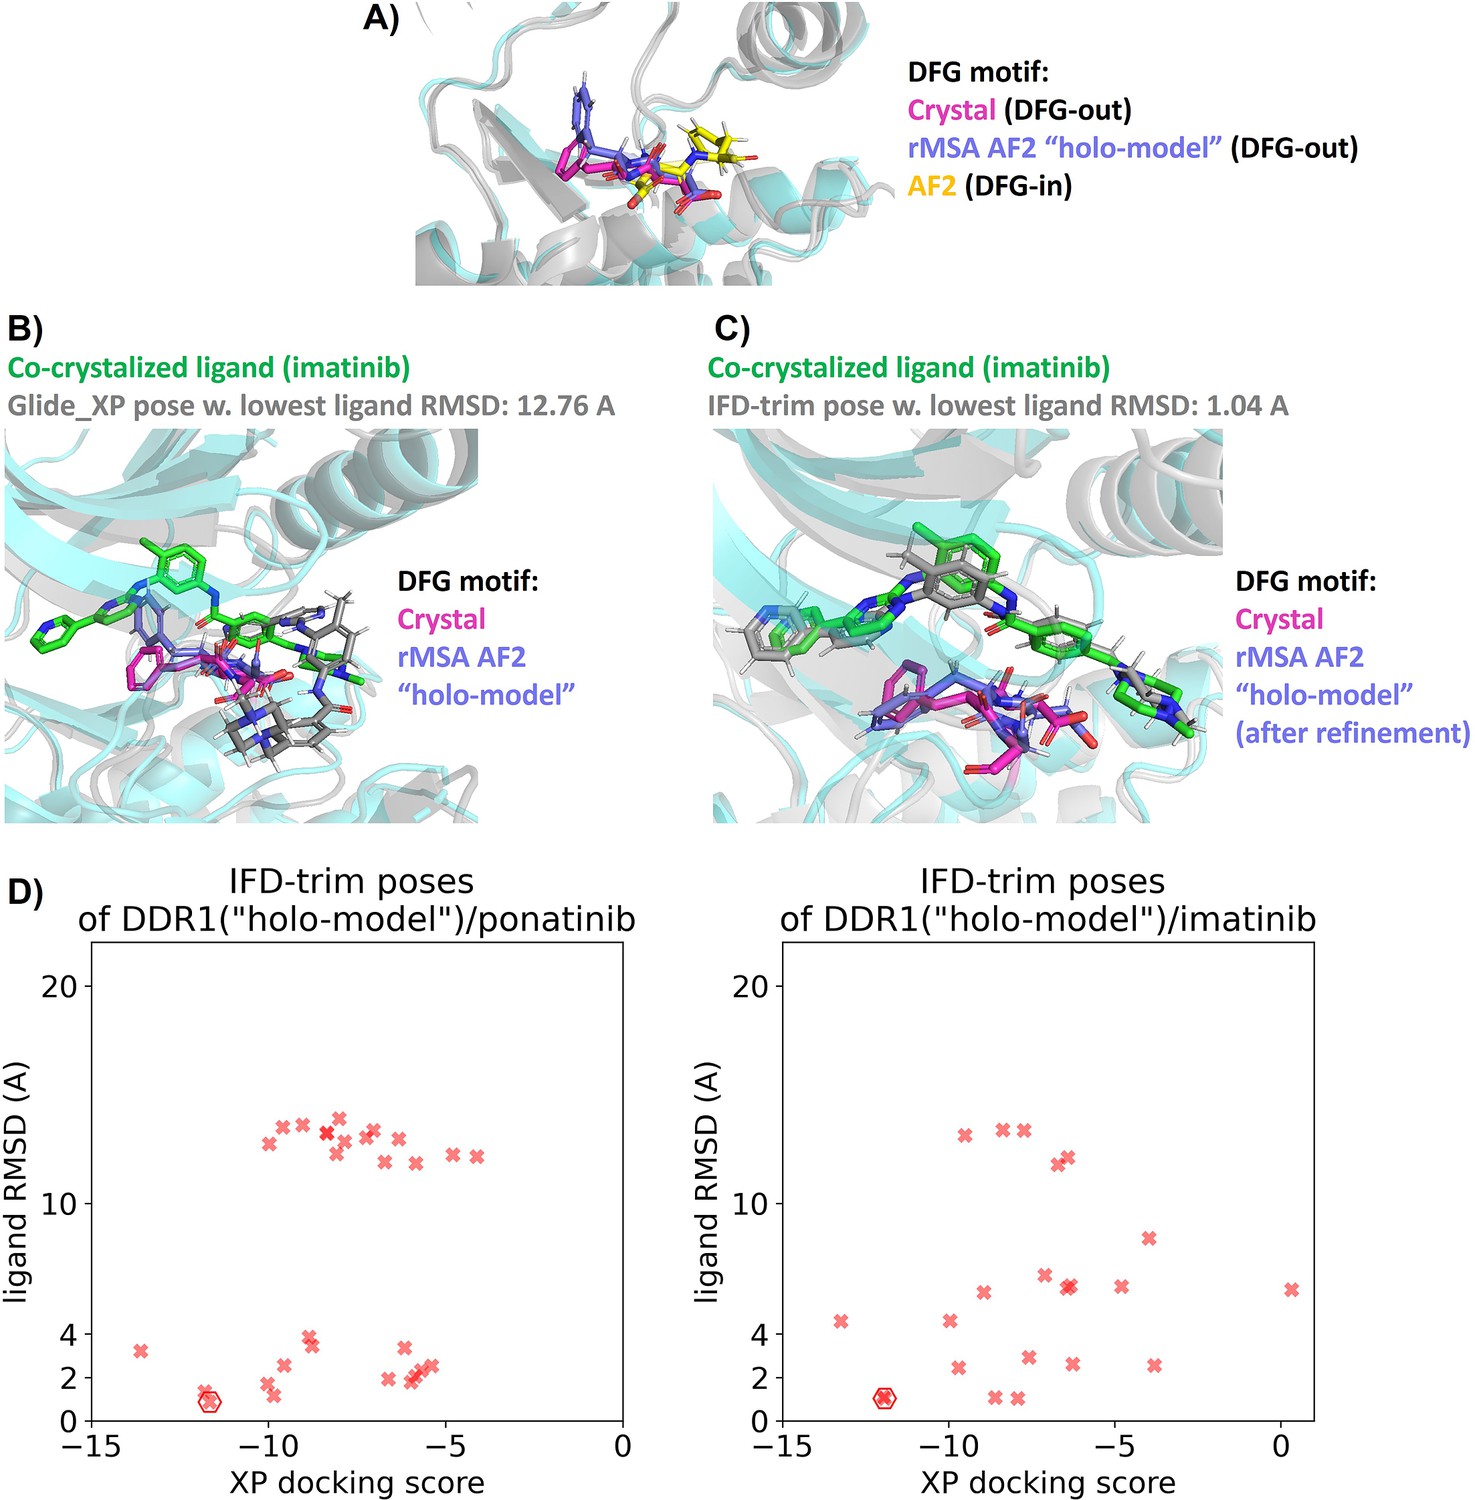
Docking studies on holo-model from rMSA AF2 for DDR1 kinase.
(A) Comparison of the DFG motif for DDR1 in its co-crystalized structure with imatinib (Protein Data Bank [PDB] 4BKJ), its ‘holo-model’ structure, and its AlphaFold2 (AF2) structure. (B and C) In the ‘holo-model’ structure, the Phe residue in the DFG motif requires rotation to prevent steric clashes with imatinib. Proteins from crystal structure are shown as cyan cartoon, while all the other proteins are shown as gray cartoon. (D) Ligand RMSDs are plotted against the docking scores for the IFD-trim docking poses of type II inhibitors (ponatinib and imatinib) against the ‘holo-model’ structure in DDR1 reduced multiple sequence alignment (rMSA) AF2 ensembles. The pose with the lowest ligand RMSD is marked by hexagon.
Figure 3—figure supplement 6
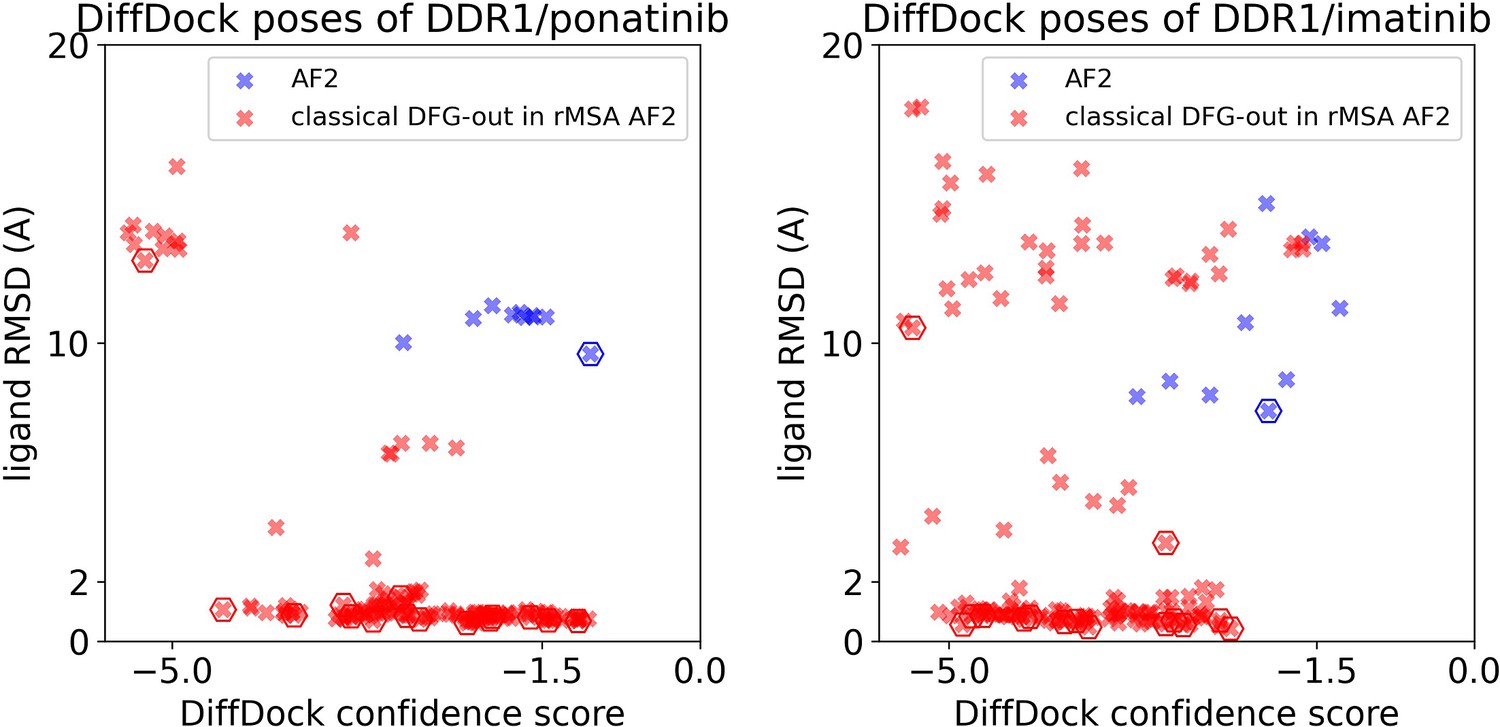
Ligand RMSDs are plotted against the DiffDock confidence scores for the DiffDock poses of type II inhibitors (ponatinib and imatinib) against DDR1 AlphaFold2 (AF2) structure (blue) or the classical DFG-out structures in DDR1 reduced multiple sequence alignment (rMSA) AF2 ensemble (red).
The pose with the lowest ligand RMSD from each input structure is marked by hexagon.
Figure 4 with 6 supplements
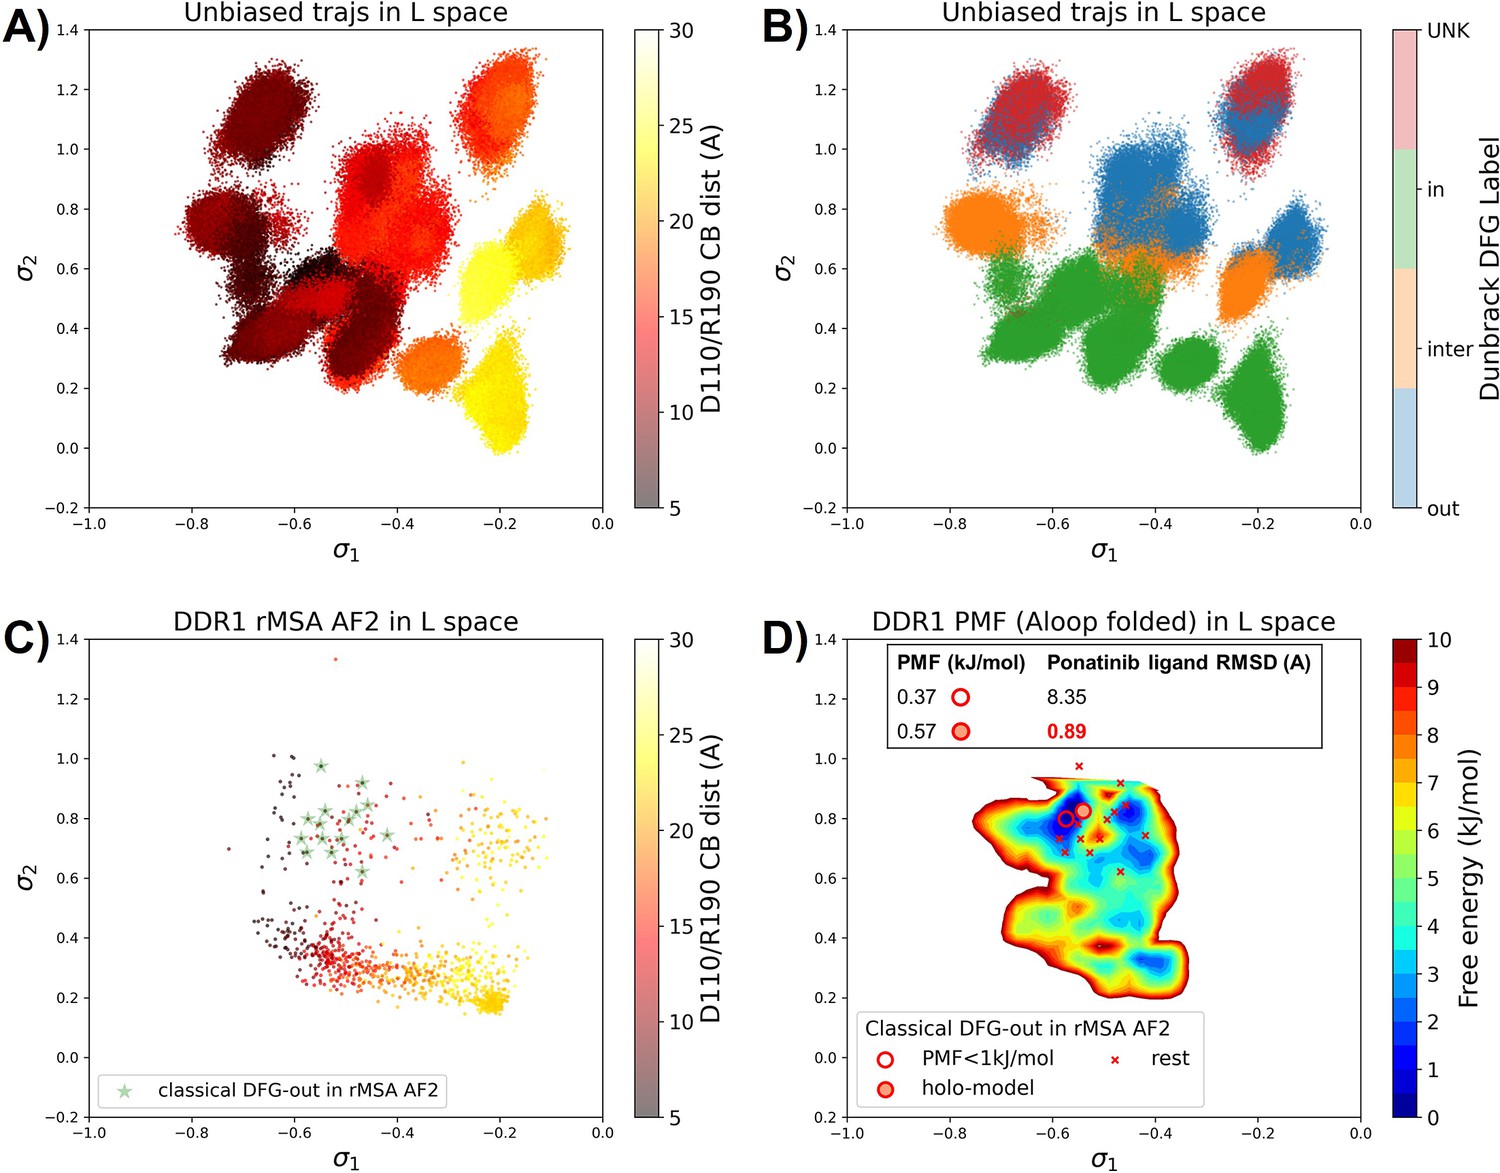
Ranking the DDR1 structures using AF2RAVE protocol on the learnt latent space.
(A or B) The unbiased molecular dynamics (MD) trajectories of DDR1 are projected onto the learnt state predictive information bottleneck model (SPIB) latent space. In plot (A), the colors of sample points represent the A-loop location, while in plot (B), they depict the Dunbrack DFG state. The first SPIB coordinate, , correlates with the A-loop location, and the second SPIB coordinate, , correlates with configuration of the DFG motif. (C) The reduced multiple sequence alignment (rMSA) AlphaFold2 (AF2) structures of DDR1 are projected onto the latent space. Sample points are color-coded based on the A-loop location. Light green stars highlight the 15 classical DFG-out structures selected based on prior information in Figure 3. (D) Free energy profile in the A-loop folded region of the latent space, calculated from umbrella sampling simulations. The 15 classical DFG-out structures from rMSA AF2 are shown as red cross and circles (structures with free energy less than 1 kJ/mol). The ‘holo-model’ structure is emphasized using a red circle filled with red. The embedding table shows the lowest ligand RMSD in IFD poses of the rMSA AF2 structure with ponatinib. The ‘holo-model’ is among the two structures selected by AF2RAVE (potential of mean force [PMF]<1 kJ/mol).
Figure 4—figure supplement 1
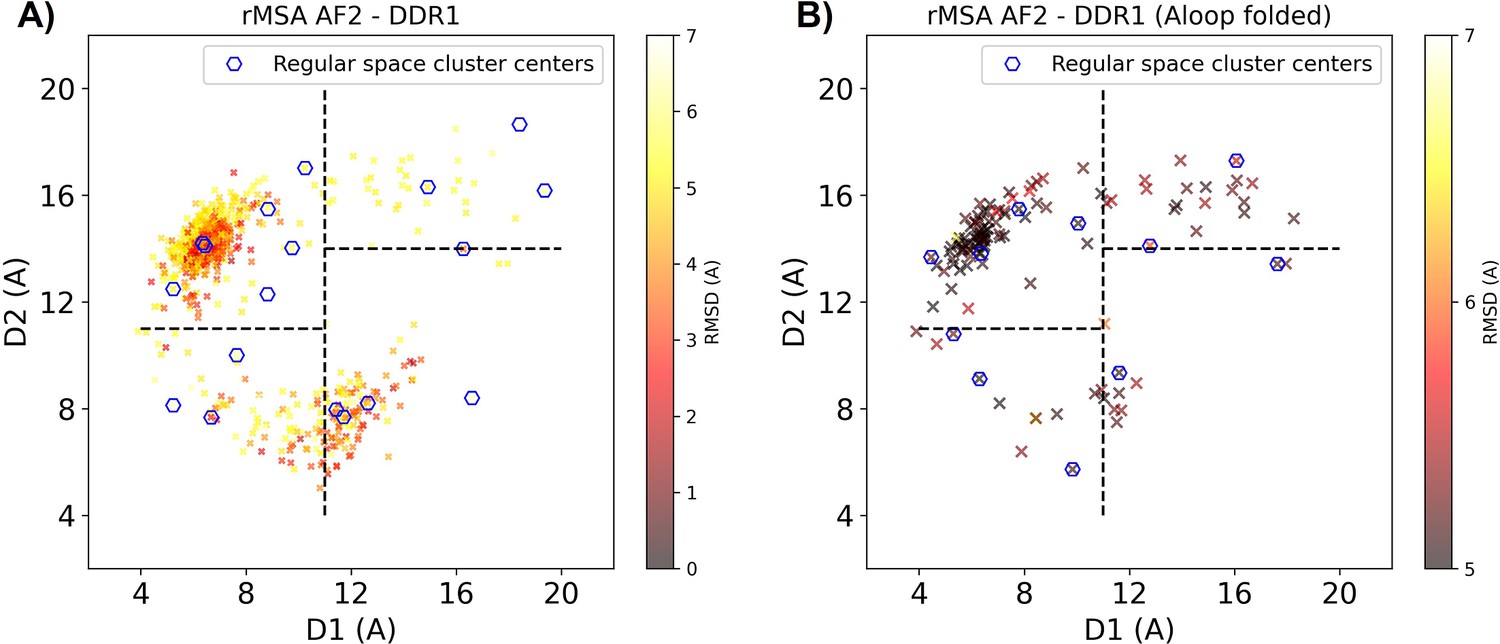
Reduced MSA AF2 generated DDR1 kinase structures on the Dunbrack space.
(A) The reduced multiple sequence alignment (rMSA) AlphaFold2 (AF2) ensemble for DDR1 is projected in the Dunbrack space. Sample points are color-coded based on the CA RMSD from the AF2 structure with the highest pLDDT. Regular space cluster centers are marked by blue hexagons. For each DFG type (in, inter, or out), top two cluster centers with the lowest CA RMSD are selected as AF2RAVE initial structures. (B) To take account of the underrepresented A-loop folded configurations, an extra regular space clustering is conducted only for the A-loop folded structures in the rMSA AF2 ensemble. The color code, notation, and the way to select initial structures are the same as plot A. Combining AF2RAVE initial structures from both plots (A and B), there are 12 initial structures in total.
Figure 4—figure supplement 2
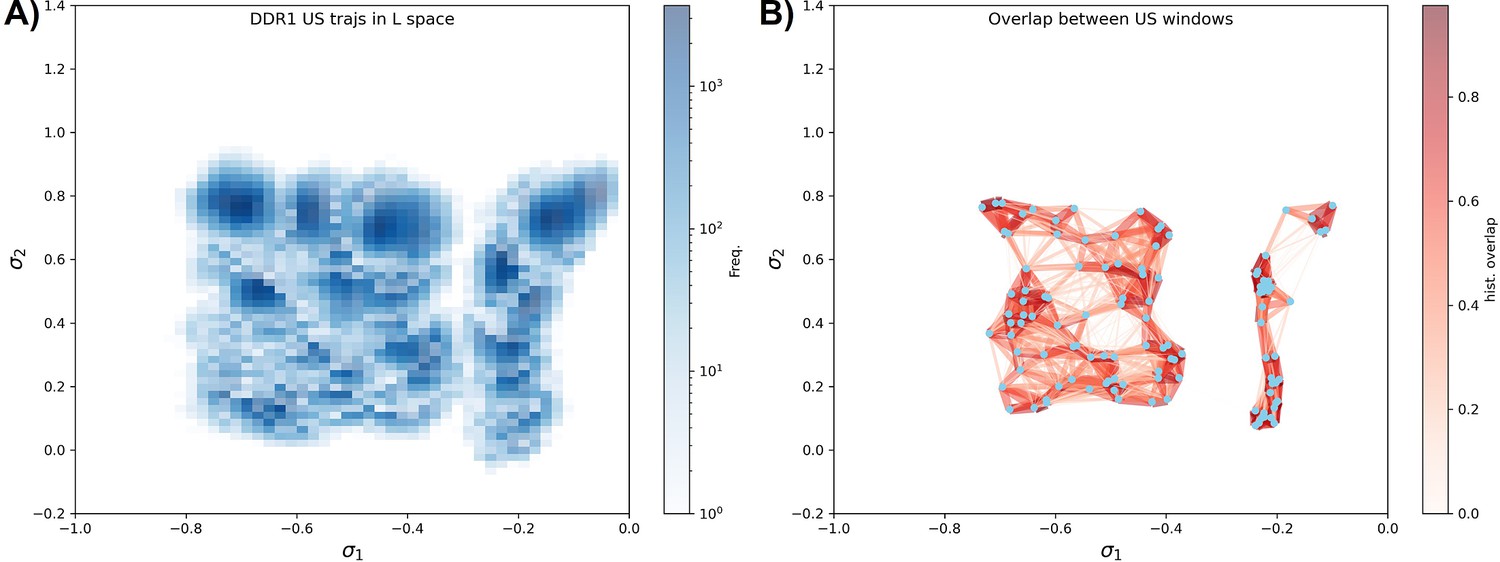
Umbrella sampling for DDR1 kinase.
(A) Distributions from different umbrella sampling windows in the latent space. (B) The distribution overlap graph for all the umbrella sampling windows. The mean value of each distribution is shown as blue dots. Each distribution’s 2D histogram is flattened into 1D vectors, and the cosine similarity between two distributions is then indicated by the width and color of the edge connecting the respective dots. Windows from the A-loop folded region are not overlapped well with the windows from the A-loop extended region, while windows inside the A-loop folded region (the left part of the graph) are well connected and are used for the local potential of mean force (PMF) calculation in Figure 4D.
Figure 4—figure supplement 3

DDR1 potential of mean force (PMF) calculated with all the umbrella sampling windows.
Hanson et al., 2019, found the A-loop folded DFG-out state to be more stable than the A-loop folded DFG-in/inter state for DDR1; Vani et al., 2024, reported that the A-loop extended DFG-out state is more stable than the A-loop extended DFG-in/inter state for DDR1. Although our umbrella sampling setup is not sufficient to sample the A-loop movement, the observed relative stability corresponds with the findings of Hanson et al. and Vani et al.
Figure 4—figure supplement 4
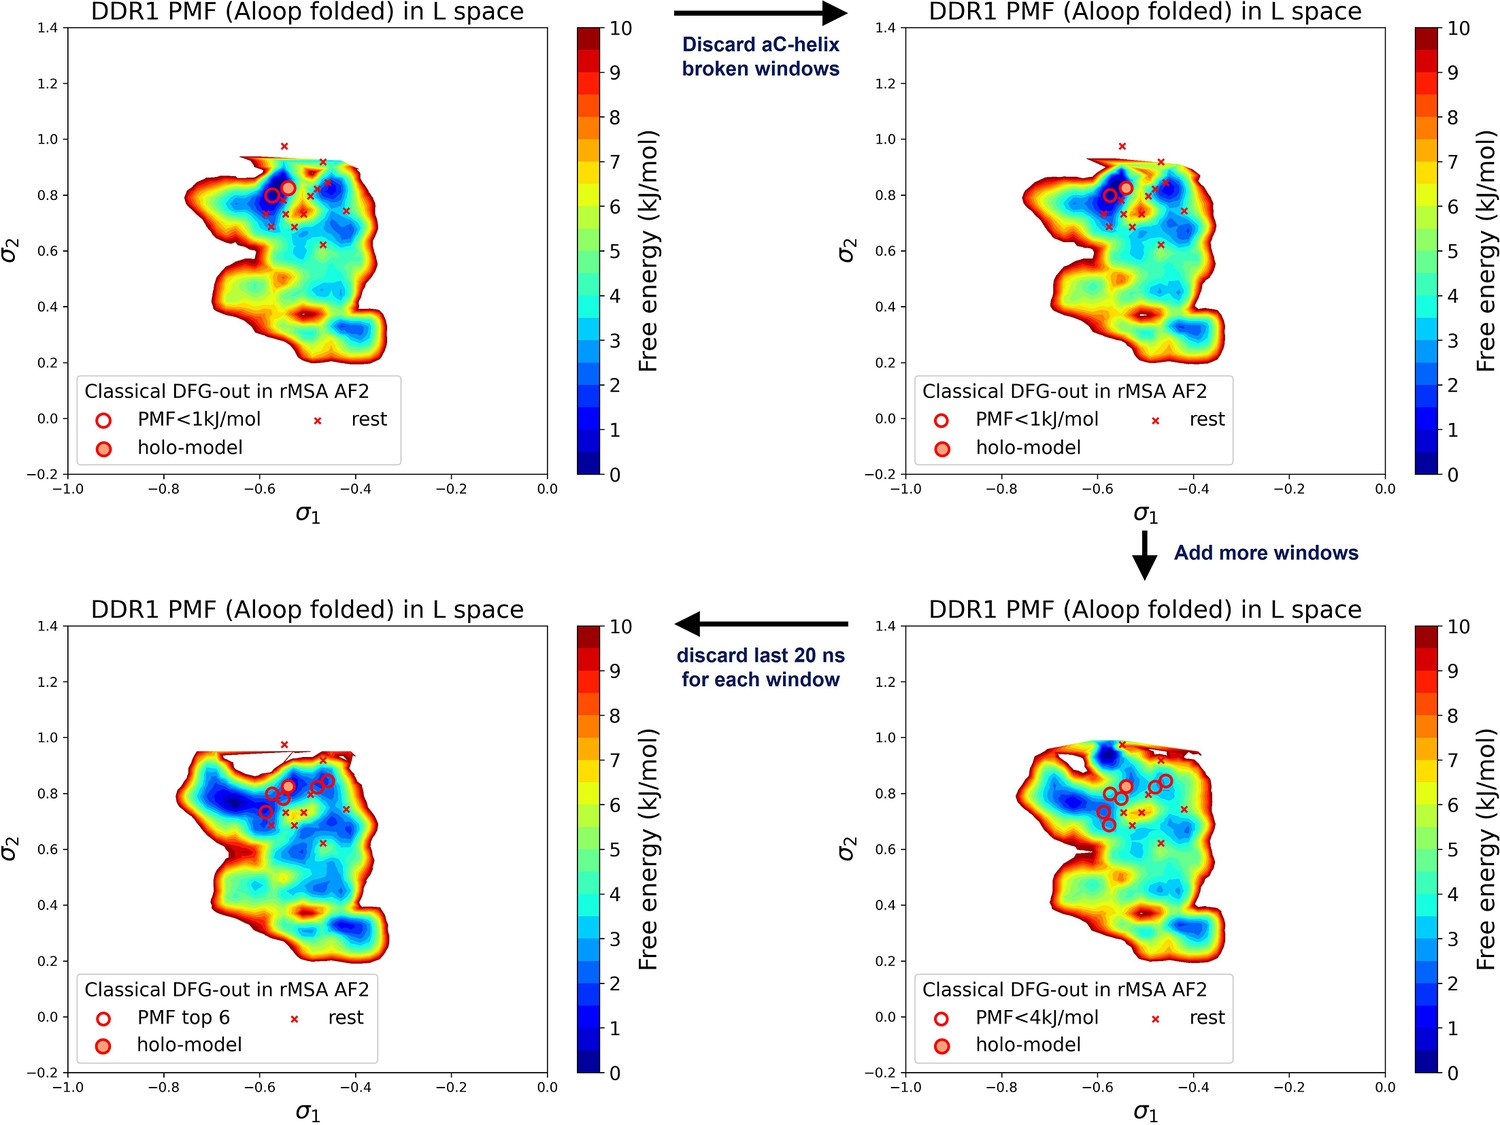
Potential of mean force (PMF) values and Boltzmann ranks of candidate structures fluctuate with the selection of the umbrella sampling windows and the simulation length of umbrella sampling trajectories, demonstrated with the DDR1 system.
Figure 4—figure supplement 5

Free energy profile for DDR1 in the latent space, calculated from unbiased molecular dynamics (MD) simulations.
The 15 DDR1 classical DFG-out structures in reduced multiple sequence alignment (rMSA) AlphaFold2 (AF2) are shown as red cross and circles (top 5 structures ranked by free energy values). The ‘holo-model’ structure is emphasized using a red circle filled with red.
Figure 4—figure supplement 6
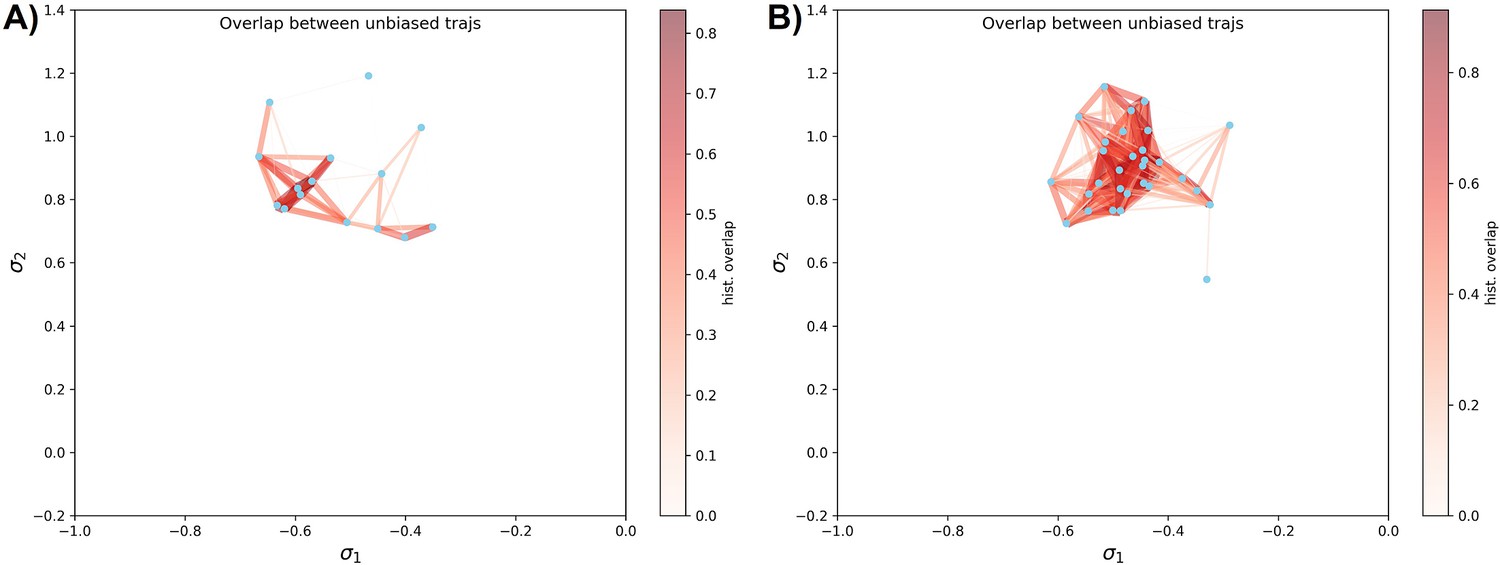
Unbiased simulation coverage study on DDR1 and Abl1 kinase.
(A) The distribution overlap graph for all the unbiased molecular dynamics (MD) trajectories starting from 15 classical DFG-out structures in DDR1 reduced multiple sequence alignment (rMSA) AlphaFold2 (AF2) ensemble. (B) The distribution overlap graph for all the unbiased MD trajectories starting from 30 Abl1 tAF2 structures in classical DFG-out state. The color code is the same as Figure 4—figure supplement 4.
Figure 5 with 7 supplements
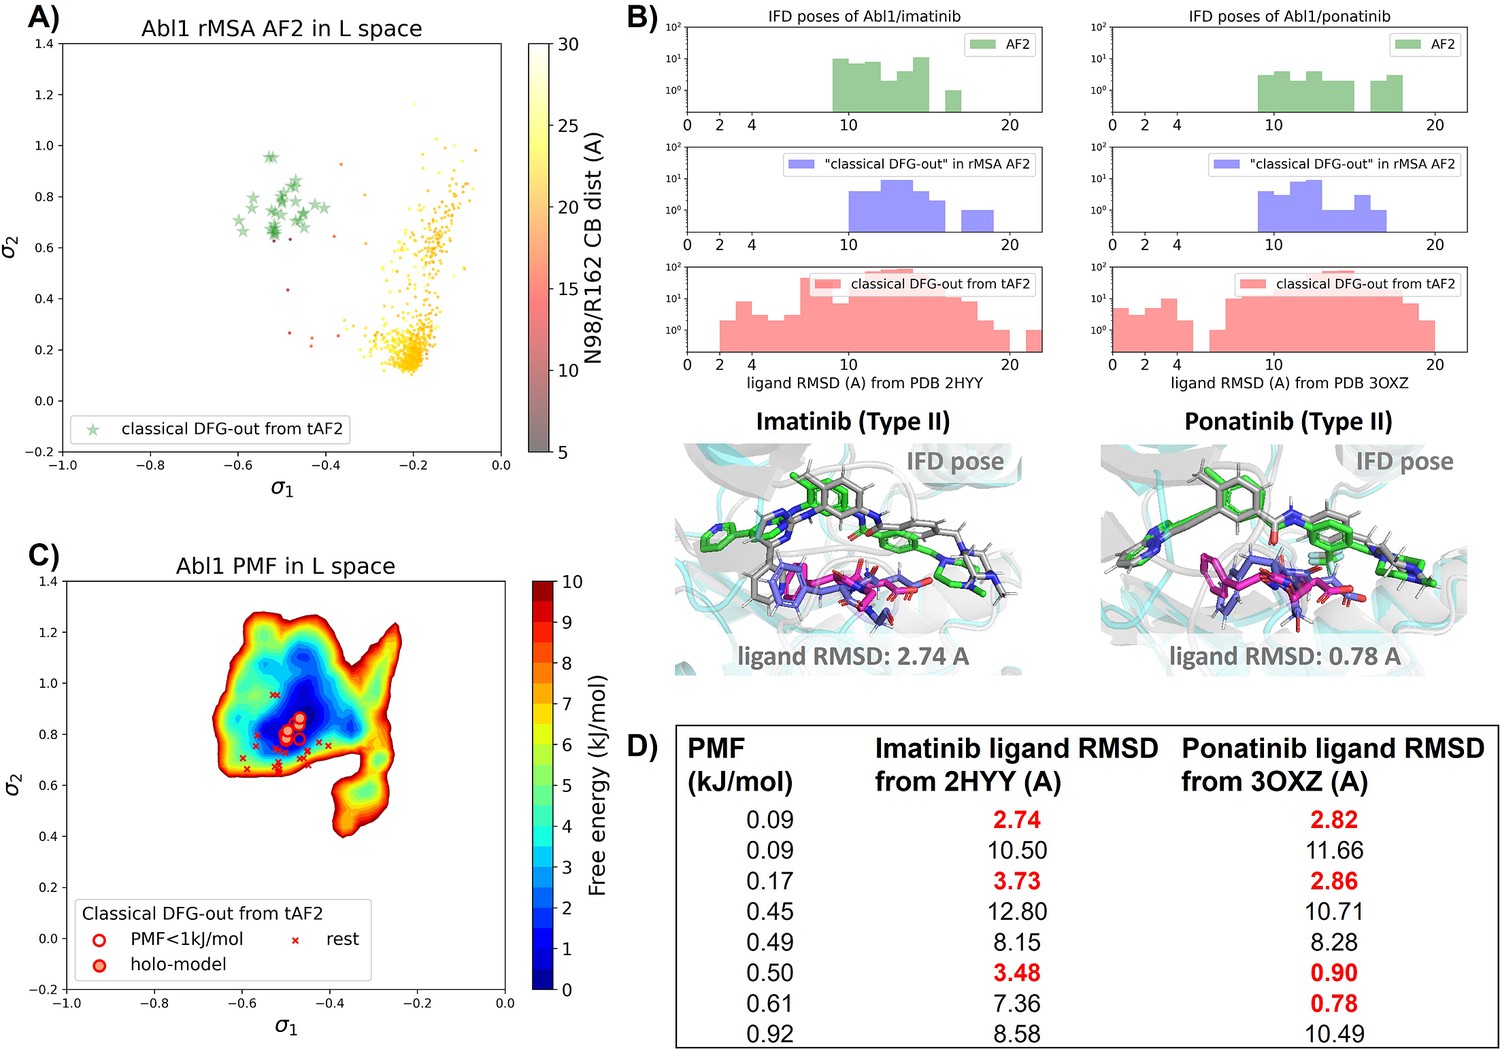
Transferrable learning of holo-like structure for Abl1 kinase.
(A) The reduced multiple sequence alignment (MSA) AlphaFold2 (AF2) structures of Abl1 are projected onto the latent space. Sample points are color-coded based on the A-loop location. Light green stars highlight the 30 AF2-template Abl1 structures modeled from the 15 DDR1 classical DFG-out structures. (B) Upper panel: the distribution of ligand RMSD for the Induced Fit docking (IFD) poses of Abl1 structures and two type II ligands. Lower panel: IFD poses with the lowest ligand RMSD for Abl1 AF2-template structures and two type II ligands. The color code is the same as Figure 2. (C) Free energy profile in the latent space, calculated from unbiased molecular dynamics (MD) simulations. The 30 Abl1 classical DFG-out structures from AF2-template are shown as red cross and circles (structures with free energy less than 1 kJ/mol). The ‘holo-model’ structures are emphasized using red circles filled with red. (D) The table shows the lowest ligand RMSD in IFD poses of the AF2-template structures with two type II inhibitors. All the four ‘holo-models’ are among the eight structures selected by AF2RAVE (potential of mean force [PMF]<1 kJ/mol).
Figure 5—figure supplement 1
Ligand RMSDs are plotted against the docking scores for the Induced Fit docking (IFD) poses of type II inhibitors (ponatinib and imatinib) against Abl1 tAF2 structures.
The pose with the lowest ligand RMSD from each input structure is marked by hexagon.
Figure 5—figure supplement 2
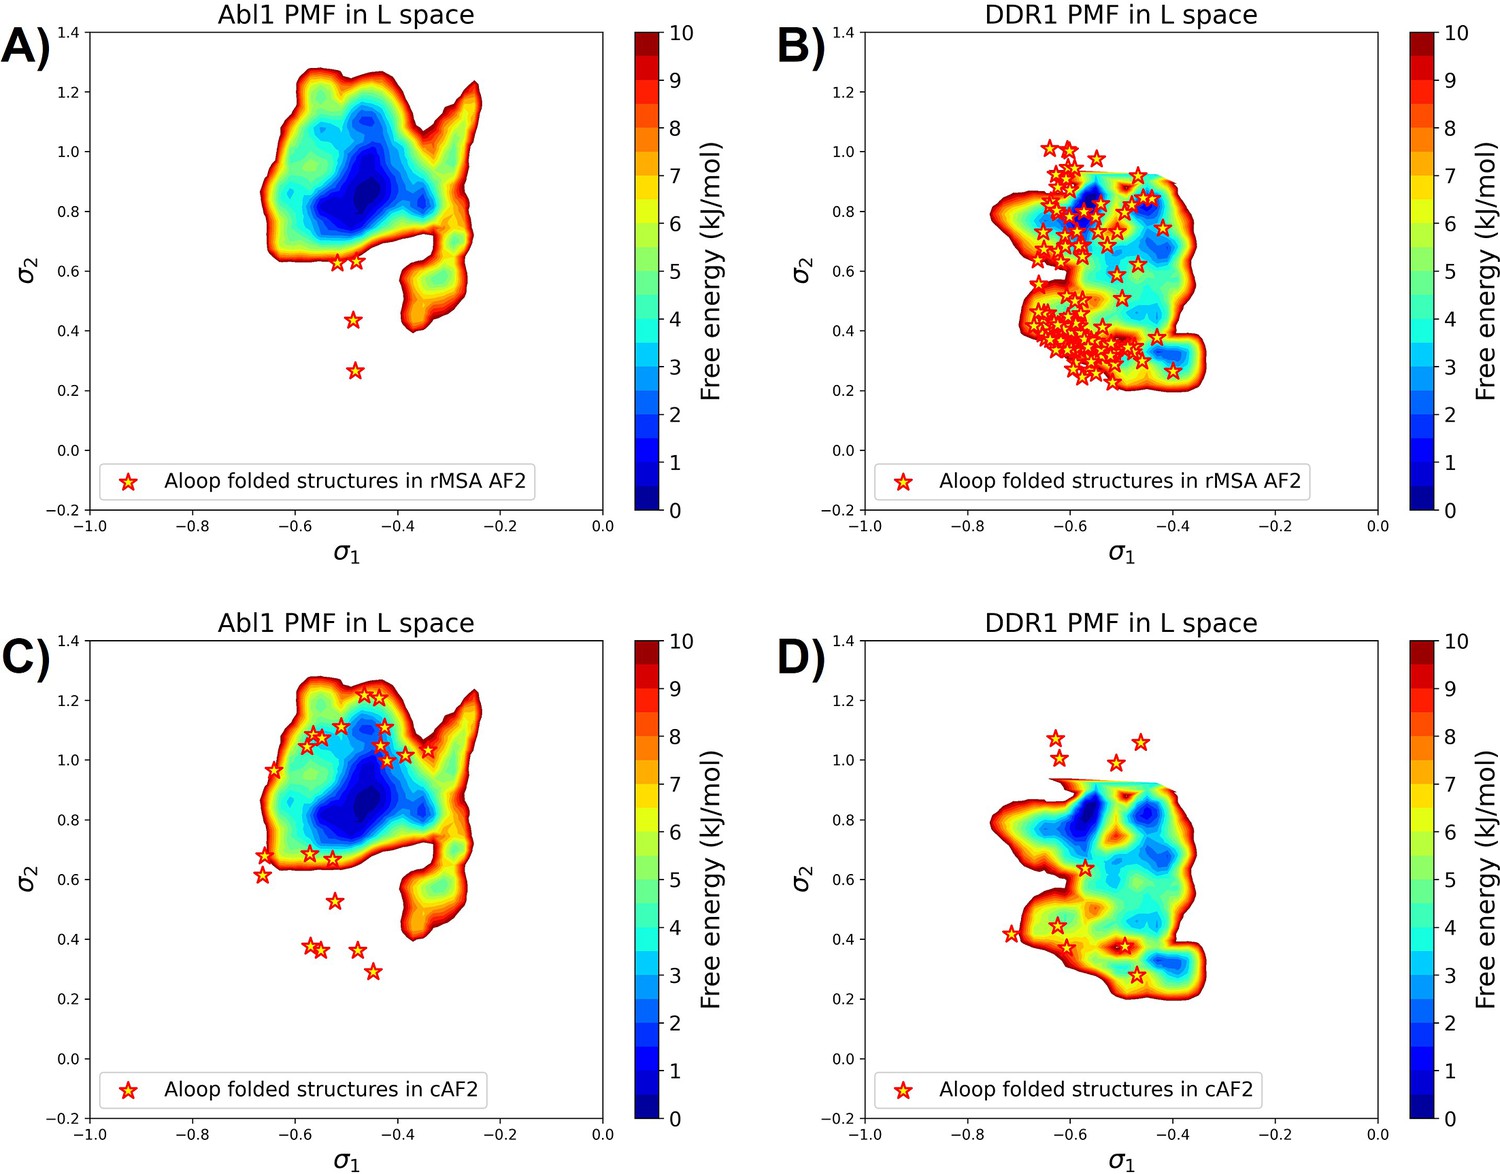
The projection of A-loop folded structures from the reduced multiple sequence alignment (rMSA) AlphaFold2 (AF2) ensemble or the AF2-cluster ensemble (cAF2) on the AF2RAVE potential of mean force (PMF) for Abl1 or DDR1.
Figure 5—figure supplement 3
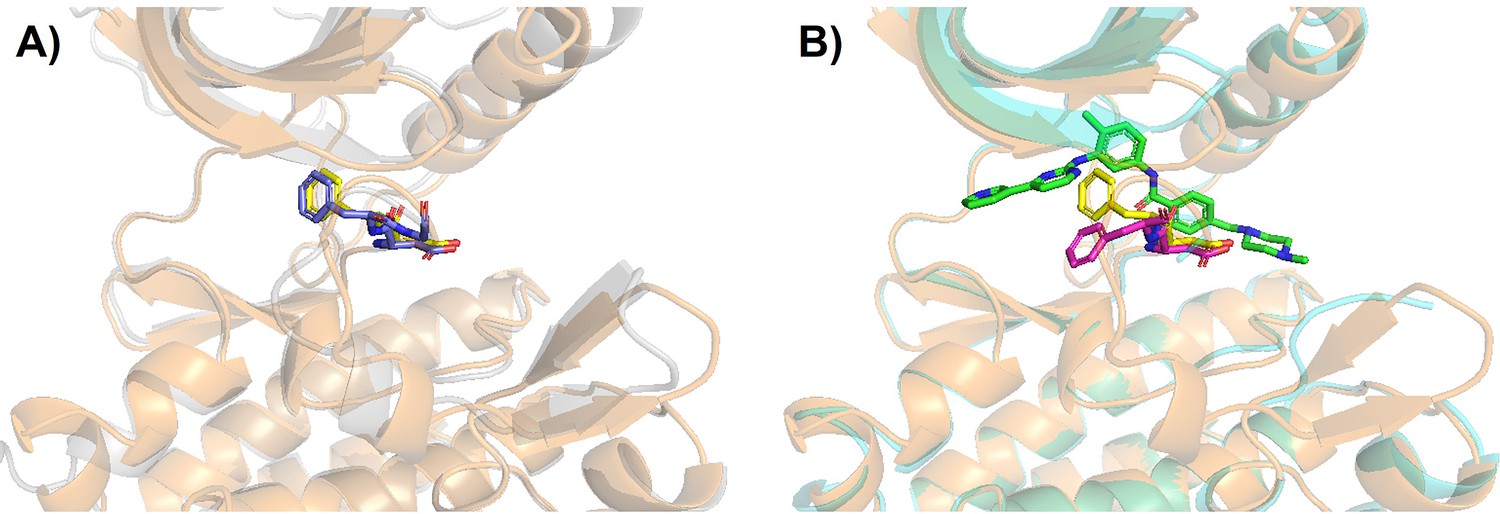
Structural visualization of tAF2 generated classical DFG-out Src kinase.
(A) The AlphaFold2 (AF2)-template structure for Src kinase is superimposed with its template structure (classical DFG-out in DDR1 reduced multiple sequence alignment [rMSA] AF2 ensemble, ‘holo-model’). The tAF2 structure of Src is shown as light-orange cartoon (protein) and yellow sticks (DFG motif), while DDR1 template is shown as light-gray cartoon (protein) and blue sticks (DFG motif). (B) The AF2-template structure for Src kinase is again superimposed with Src/imatinib co-crystallized structure (Protein Data Bank [PDB] 2OIQ). Crystal structure is shown as light-cyan cartoon (protein), green sticks (ligand), and magenta sticks (DFG motif).
Figure 5—figure supplement 4
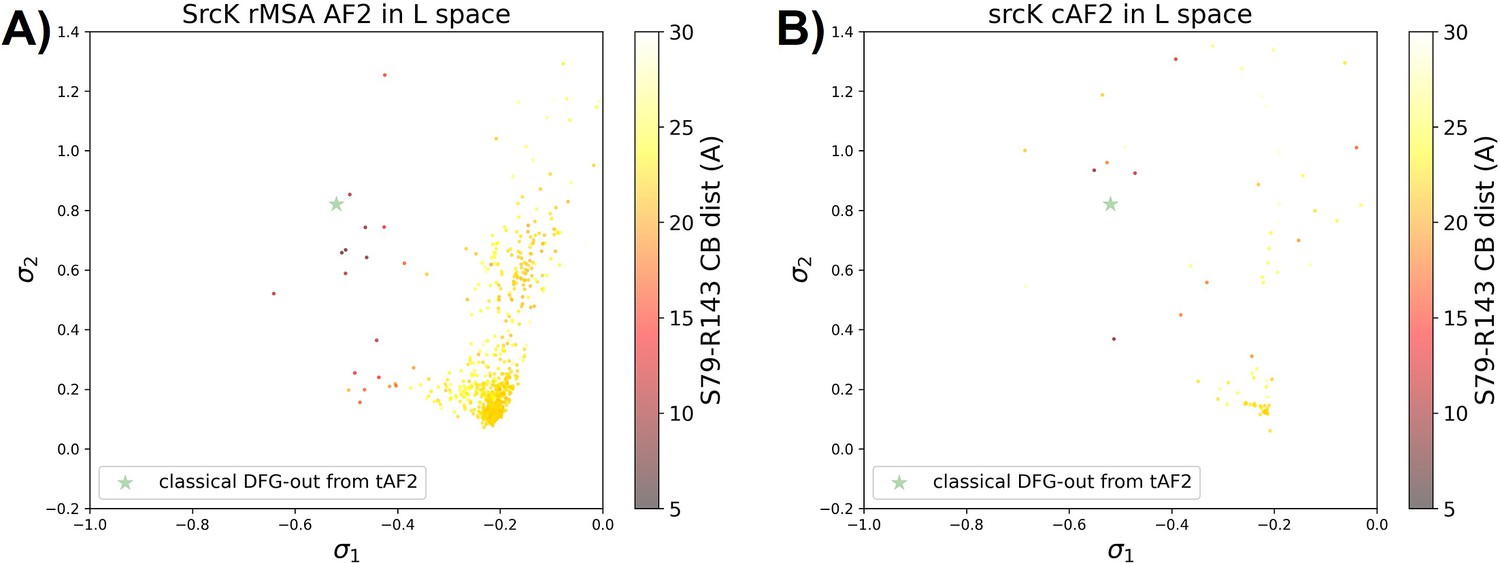
Comparison between performance of rMSA AF2 and AF2-cluster on Src kinase.
The projection of (A) the reduced multiple sequence alignment (rMSA) AlphaFold2 (AF2) ensemble or (B) the AF2-cluster ensemble on the AF2RAVE latent space for SrcK. The classical DFG-out SrcK structure generated from AF2-template in Figure 5—figure supplement 5 is shown as the green star. The color code shows the A-loop location.
Figure 5—figure supplement 5
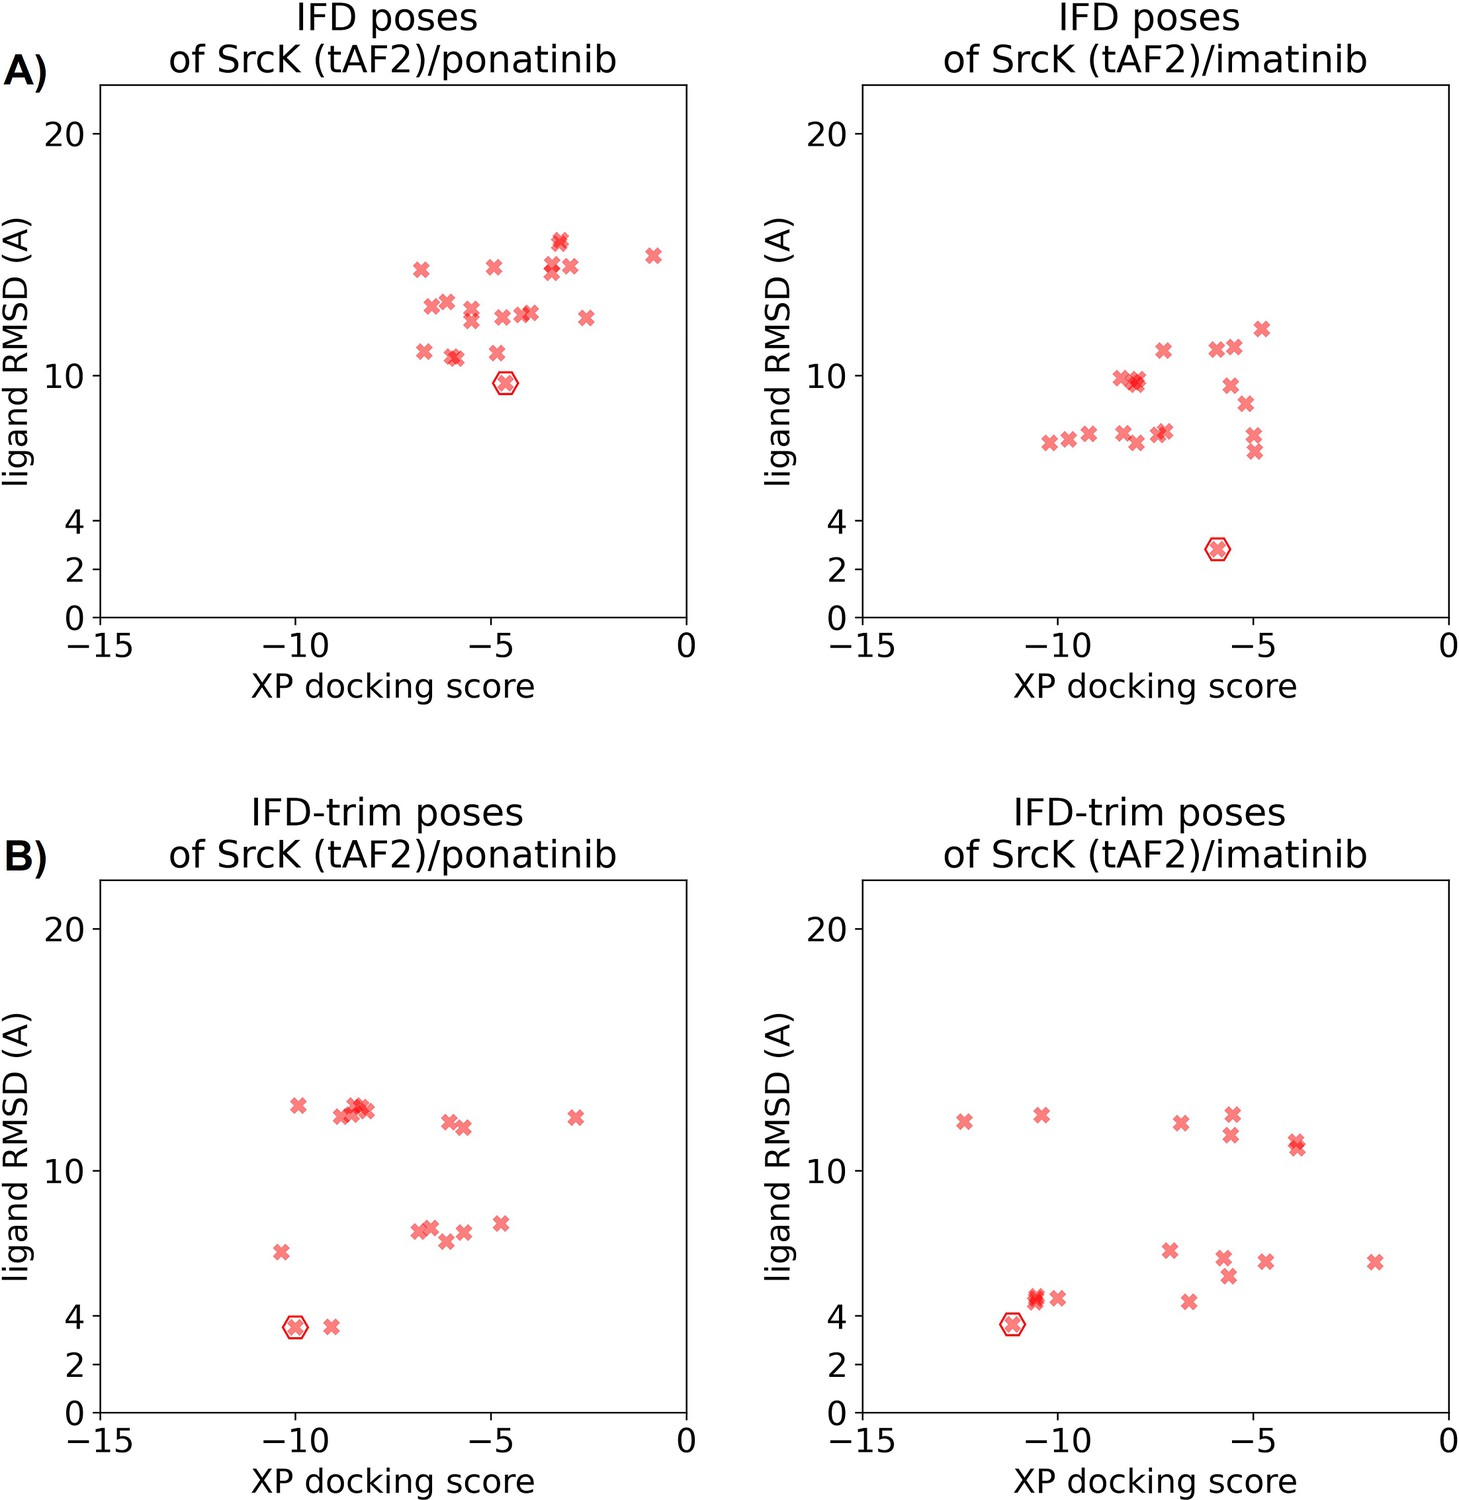
Ligand RMSDs are plotted against the docking scores for the Induced Fit docking (IFD)/IFD-trim docking poses of type II inhibitors (ponatinib and imatinib) against the SrcK tAF2 structure.
The pose with the lowest ligand RMSD from each input structure is marked by hexagon.
Figure 5—figure supplement 6
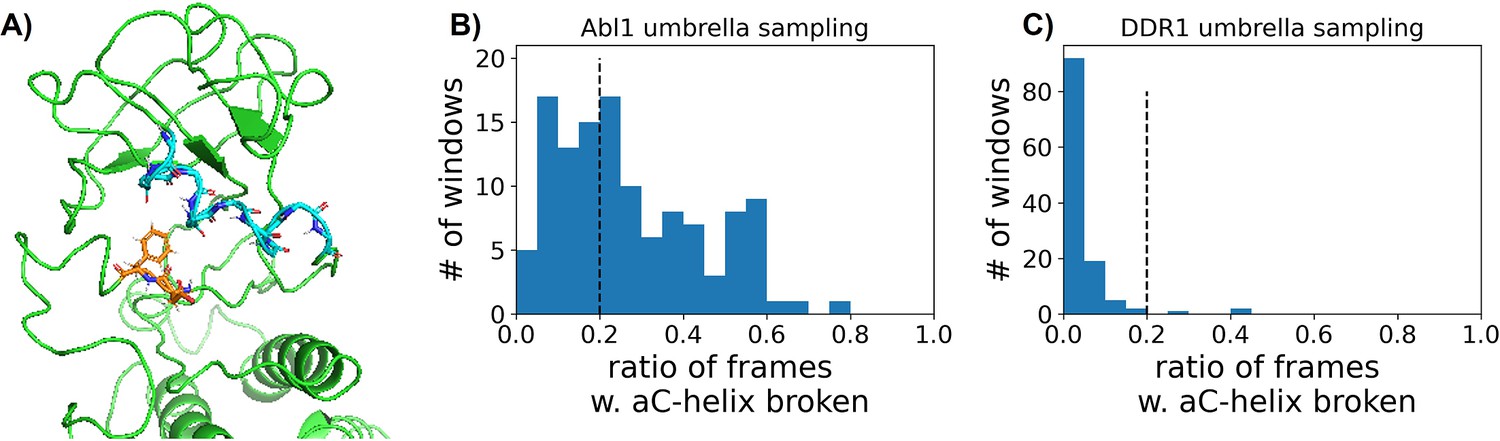
Accounting for broken αC helix during umbrella sampling of DDR1 and Abl1 kinase.
(A) One representative frame with αC helix broken in Abl1 umbrella sampling trajectories. The backbone of the αC helix is shown with cyan sticks, while the DFG motif is shown as orange sticks. (B or C) The distribution of the ratios of frames with αC helix broken in each umbrella sampling window for Abl1 or DDR1.
Figure 5—figure supplement 7

Abl1 potential of mean force (PMF) calculated from umbrella sampling after discarding windows with αC helix broken.
The four holo-like structures (‘holo-models’) are enriched to the top six based on PMF values.
Tables
Table 1
Comparing the Induced Fit docking (IFD) performance of various structure generation methods for docking type II kinase inhibitors.
| Source-protein (# of structures) | Lowest imatinib ligand RMSD (Å) | Lowest ponatinib ligand RMSD (Å) | Ratio of structs. w. ligand RMSD <3 Å |
|---|---|---|---|
| AF2-Abl1 (1) | 9.22 | 9.4 | 0/1 |
| AF2-DDR1 (1) | 9.24 | 9.33 | 0/1 |
| rMSA AF2-Abl1 (2) | 10.14 | 9.11 | 0/2 |
| rMSA AF2-DDR1 (15) | 1.04* | 0.89 | 1/15 |
| tAF2-Abl1 (30) | 2.74 | 0.78 | 4/30 |
| AF2RAVE-DDR1 (2) | 1.04* | 0.89 | 1/2 |
| AF2RAVE-Abl1 (8) | 2.74 | 0.78 | 4/8 |
-
*
Result from IFD-trim.
Additional files
-
MDAR checklist
- https://cdn.elifesciences.org/articles/99702/elife-99702-mdarchecklist1-v1.pdf
-
Supplementary file 1
Comparison between AF2RAVE ranks and DiffDock confidence scores.
Confidence score for the DiffDock pose aligns with AF2RAVE potential of mean force (PMF) values. The DiffDock confidence score of the pose with the lowest ligand RMSD (marked in red/bold) from each classical DFG-out structure in DDR1 reduced multiple sequence alignment (rMSA) AlphaFold2 (AF2) ensemble is compared with the AF2RAVE PMF value for corresponding structure (marked in red/bold).
- https://cdn.elifesciences.org/articles/99702/elife-99702-supp1-v1.xlsx
Download links
A two-part list of links to download the article, or parts of the article, in various formats.
Downloads (link to download the article as PDF)
Open citations (links to open the citations from this article in various online reference manager services)
Cite this article (links to download the citations from this article in formats compatible with various reference manager tools)
Empowering AlphaFold2 for protein conformation selective drug discovery with AlphaFold2-RAVE
eLife 13:RP99702.
https://doi.org/10.7554/eLife.99702.3


