Unraveling CRP/cAMP-mediated metabolic regulation in Escherichia coli persister cells
- Department of Chemical and Biomolecular Engineering, University of Houston, United States
- Department of Biology, Monmouth University, United States
Figures
Figure 1 with 8 supplements
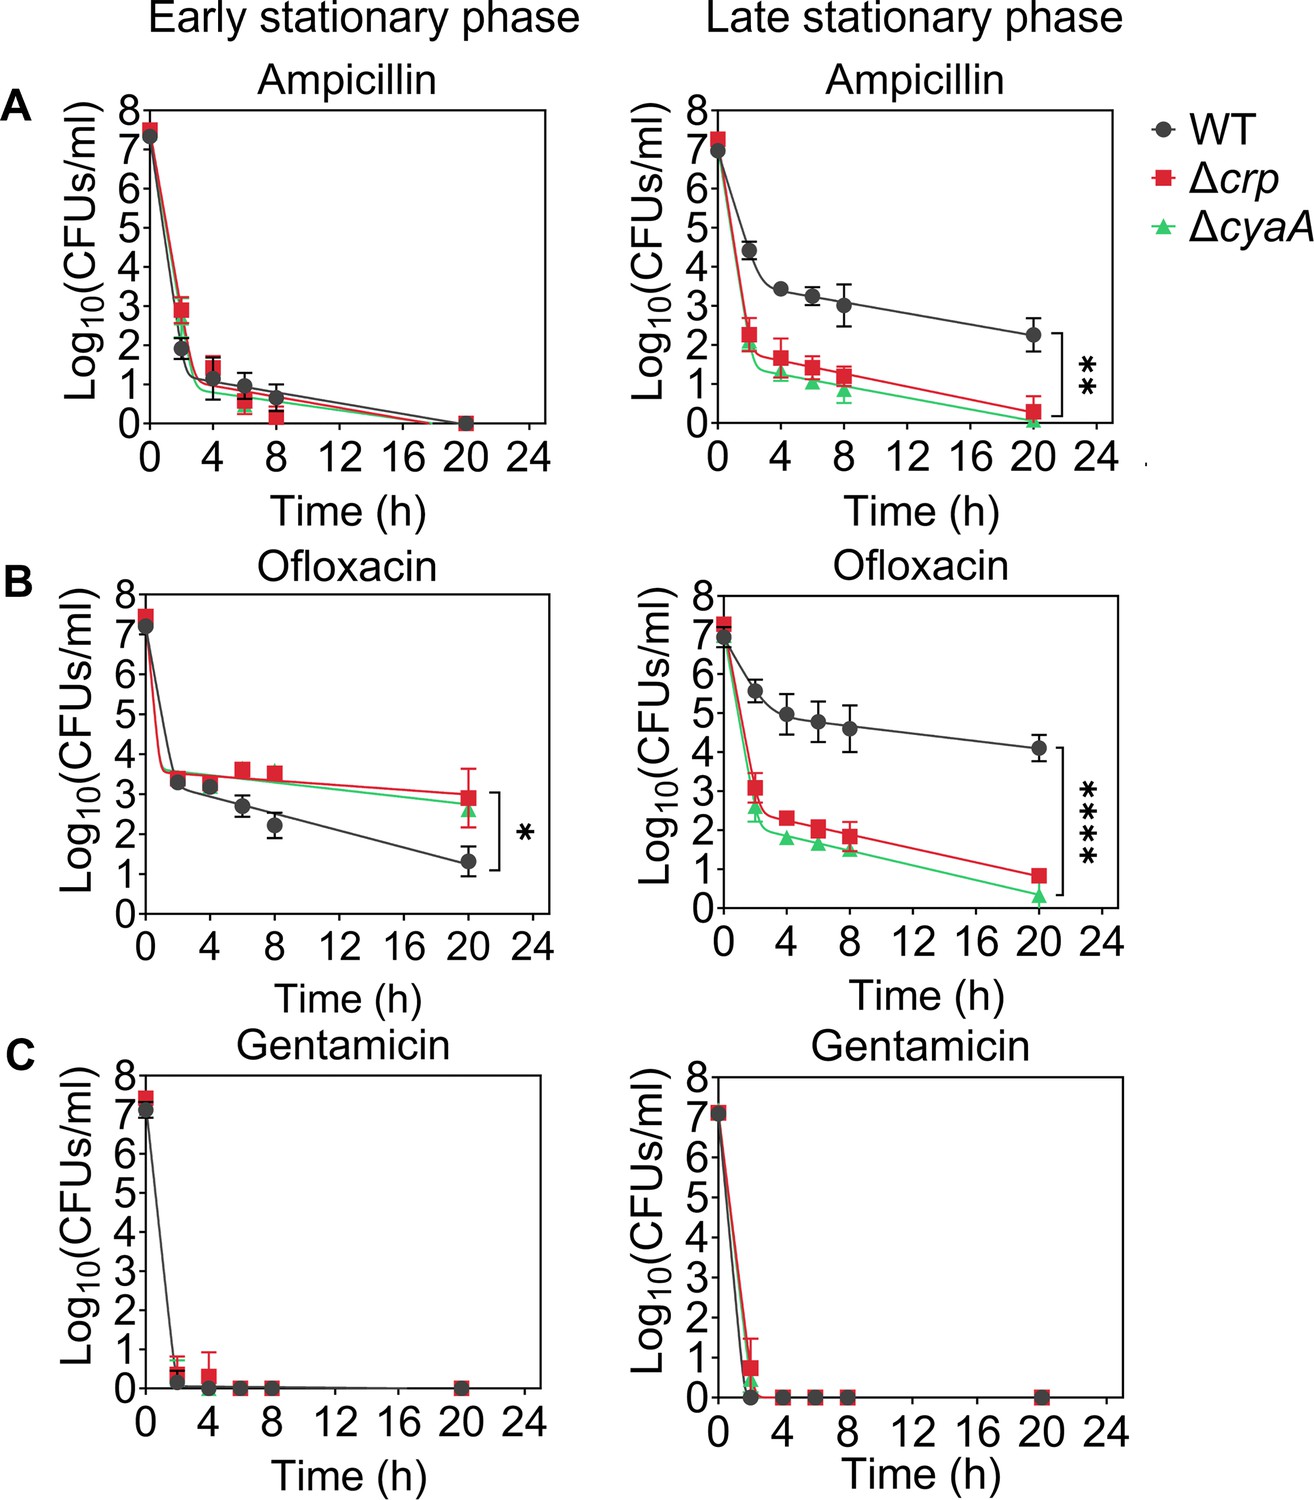
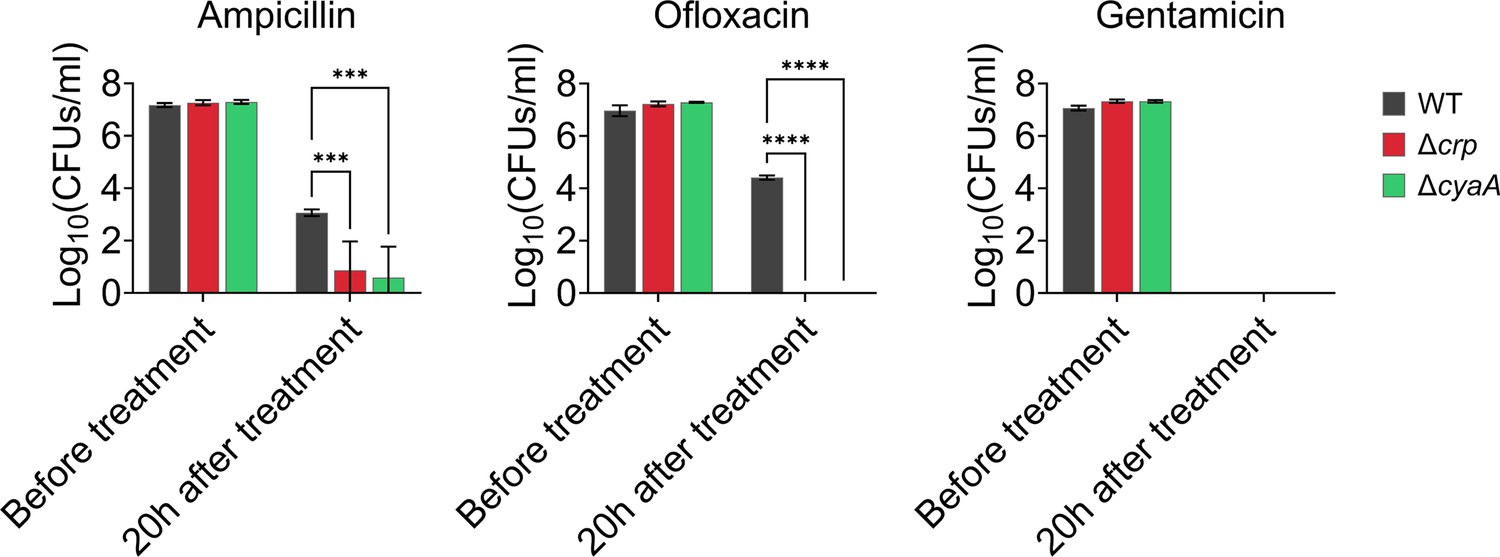
Crp/cAMP regulation of persister cell formation in the stationary phase.
E. coli K-12 MG1655 WT and mutant cells at early (t=5 hr) and late (t=24 hr) stationary phases were transferred to fresh medium with antibiotics for persister cell quantification. At time points 0, 2, 4, 6, 8, and 20 hr, 1 mL of the treated culture was washed with 1 X phosphate-buffered saline (PBS) to remove antibiotics. It was then serially diluted and plated on an agar plate to count the colony-forming units (CFUs). (A) Persister levels of ampicillin-treated culture with an antibiotic concentration of 200 μg/mL. (B) Persister levels of ofloxacin-treated culture with an antibiotic concentration of 5 μg/mL. (C) Persister levels of gentamicin-treated culture with an antibiotic concentration of 50 μg/mL. The number of biological replicates is n=4 for all panels. Biphasic kill curves were generated using a non-linear model (see Materials and methods). Statistical significance tests were conducted using F-statistics (*p < 0.05, **p < 0.01, ****p < 0.0001). The data for each time point represent the mean value ± standard deviation.
Figure 1—figure supplement 1
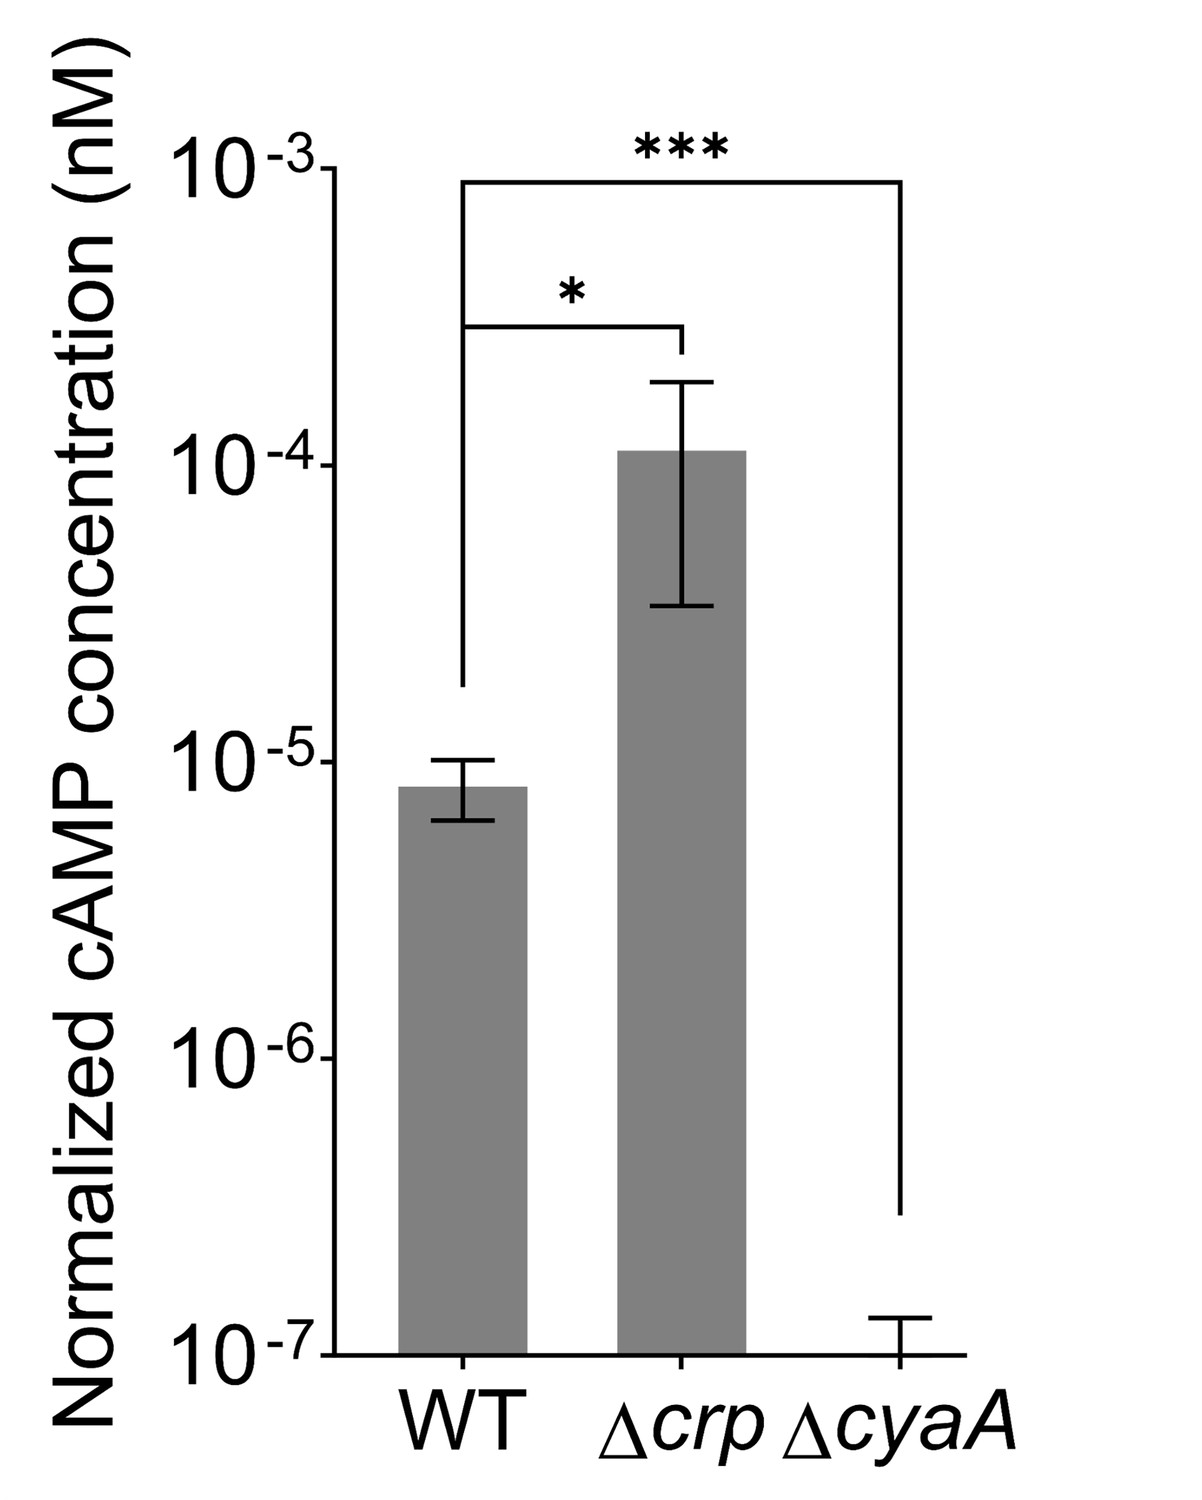
cAMP concentrations normalized to cell numbers for E. coli K-12 MG1655 WT, Δcrp, and ΔcyaA.
The cAMP levels were measured in late stationary phase cultures at 450 nm using the Cyclic AMP XP Assay Kit (Cell Signaling Technology). n=4. Statistical significance was observed between control and mutant strains (*p<0.05, ***p<0.001, One-way ANOVA with Dunnett’s multiple comparisons test). The data for each time point represent the mean value ± standard deviation.
Figure 1—figure supplement 2
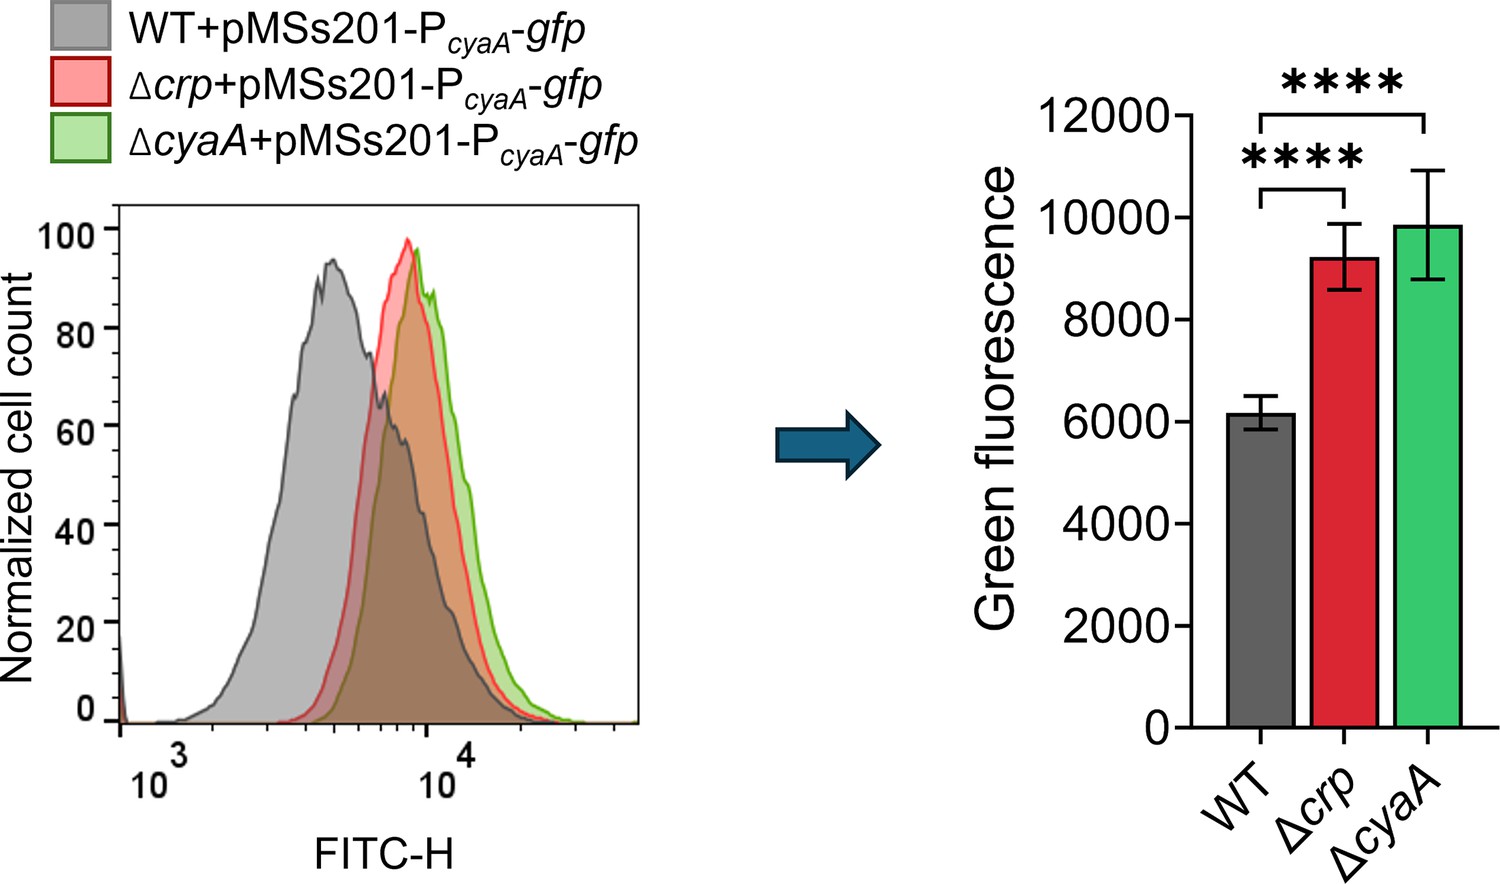
Genetic perturbation of Crp/cAMP enhanced PcyaA promoter activity, resulting in increased gfp expression.
Overnight cultures of E. coli K-12 MG1655 WT, Δcrp, and ΔcyaA strains harboring the pMSs201 plasmid, which encodes green fluorescent protein (GFP) under the control of the PcyaA promoter, were diluted 1:1000 into fresh LB medium and incubated at 37 °C with shaking at 250 rpm for 24 hr. Cells at the late stationary phase were then collected, diluted in 1 X PBS, and analyzed by flow cytometry. n=4. Statistical significance was observed between control and mutant strains (****p<0.0001, One-way ANOVA with Dunnett’s multiple comparisons test). The data for each time point represent the mean value ± standard deviation.
Figure 1—figure supplement 3
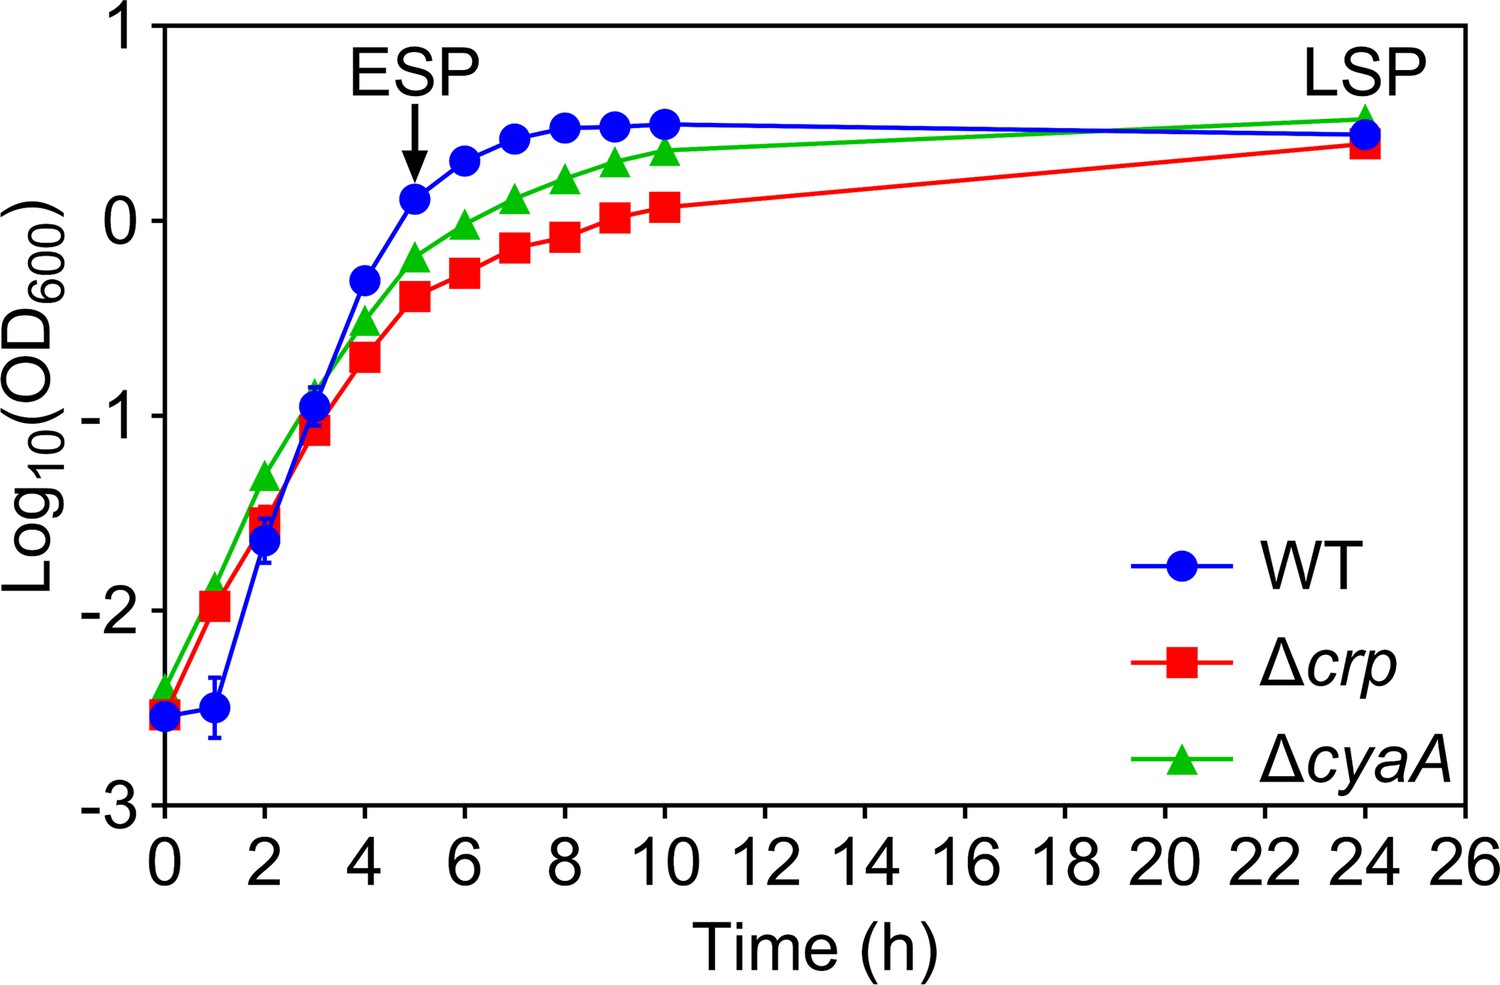
Growth curves of E. coli K-12 MG1655 WT, Δcrp, and ΔcyaA.
Optical densities of cell cultures at 600 nm (OD600) were measured every hour using a plate reader. n=3. The data for each time point represent the mean value ± standard deviation.
Figure 1—figure supplement 4
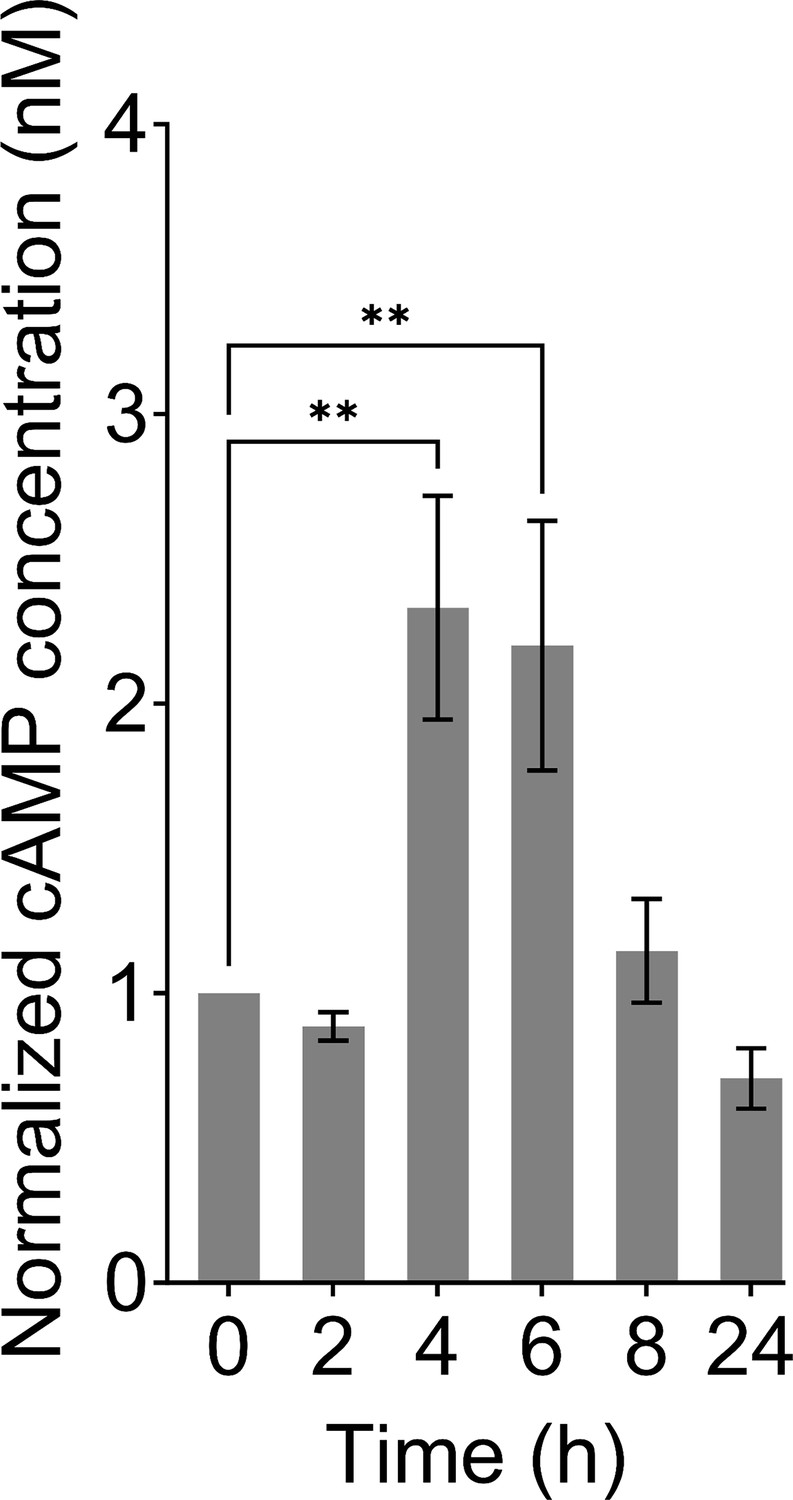
Normalized cAMP concentrations of E. coli K-12 MG1655 WT.
The cAMP concentrations were measured in growth cultures at the indicated time points. First, the cAMP concentrations were normalized to the number of cells. Subsequently, the data were further normalized based on the time point 0 to mitigate errors associated with batch-to-batch assay kit variations and to capture the trend in cAMP levels across the time points. n=8. Statistical significance was observed between time points (**p<0.01, One-way ANOVA with Dunnett’s multiple comparisons test). The data for each time point represent the mean value ± standard error.
Figure 1—figure supplement 5
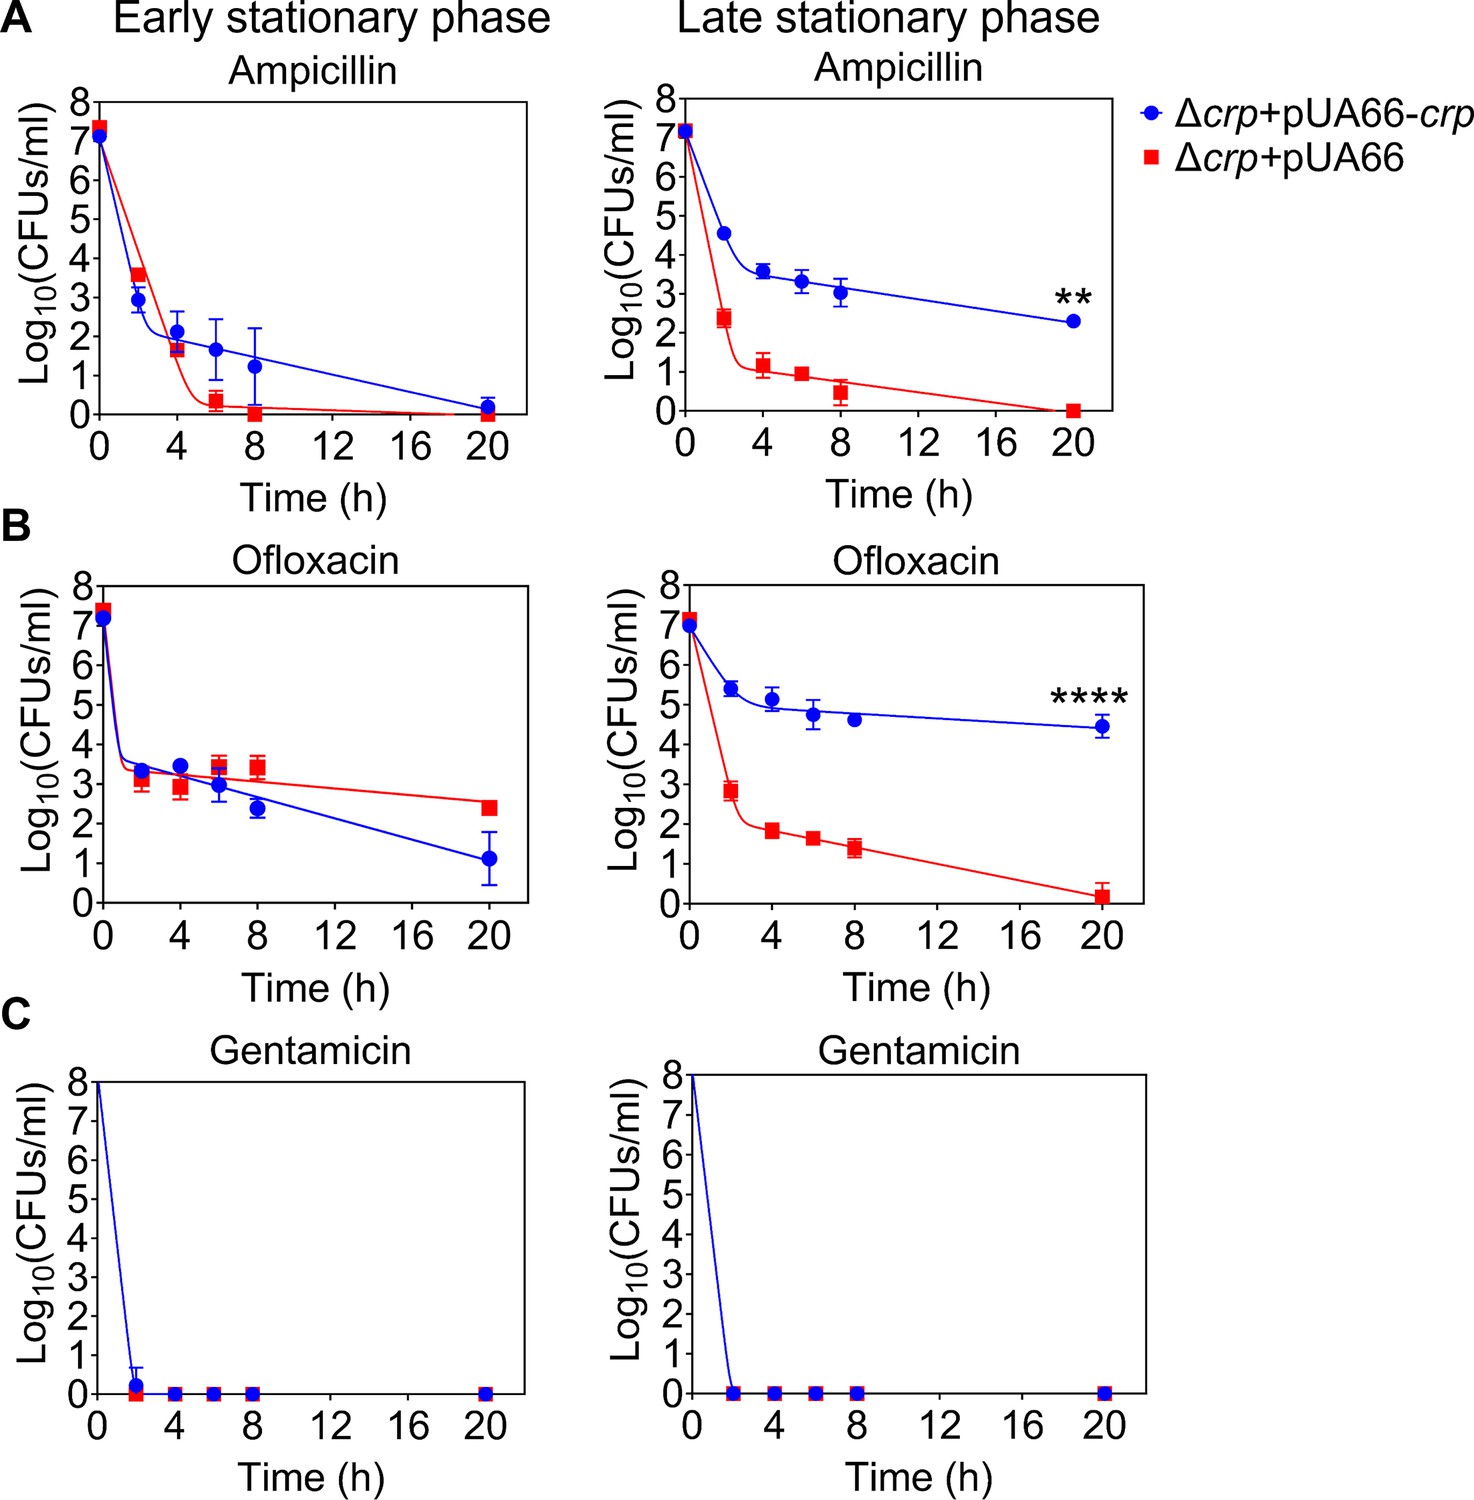
Persister levels of cells carrying the Crp expression system.
Cells at early (t=5 hr) and late (t=24 hr) stationary phases were transferred to fresh media with antibiotics for persister cell quantification. At time points 0, 2, 4, 6, 8, and 20 hr, 1 mL of the treated culture underwent two washes with 1 X PBS to remove antibiotics. It was then serially diluted and plated on an agar plate to count the CFUs. (A) Persister levels of ampicillin-treated culture (200 μg/mL). (B) Persister levels of ofloxacin-treated cultures (5 μg/mL). (C) Persister levels of gentamicin-treated culture (50 μg/mL). n=4. Biphasic kill curves were generated using a non-linear model (see Materials and methods). Statistical significance tests were conducted using F-statistics (**p < 0.01 and ****p < 0.0001). The data for each time point represent the mean value ± standard deviation.
Figure 1—figure supplement 6
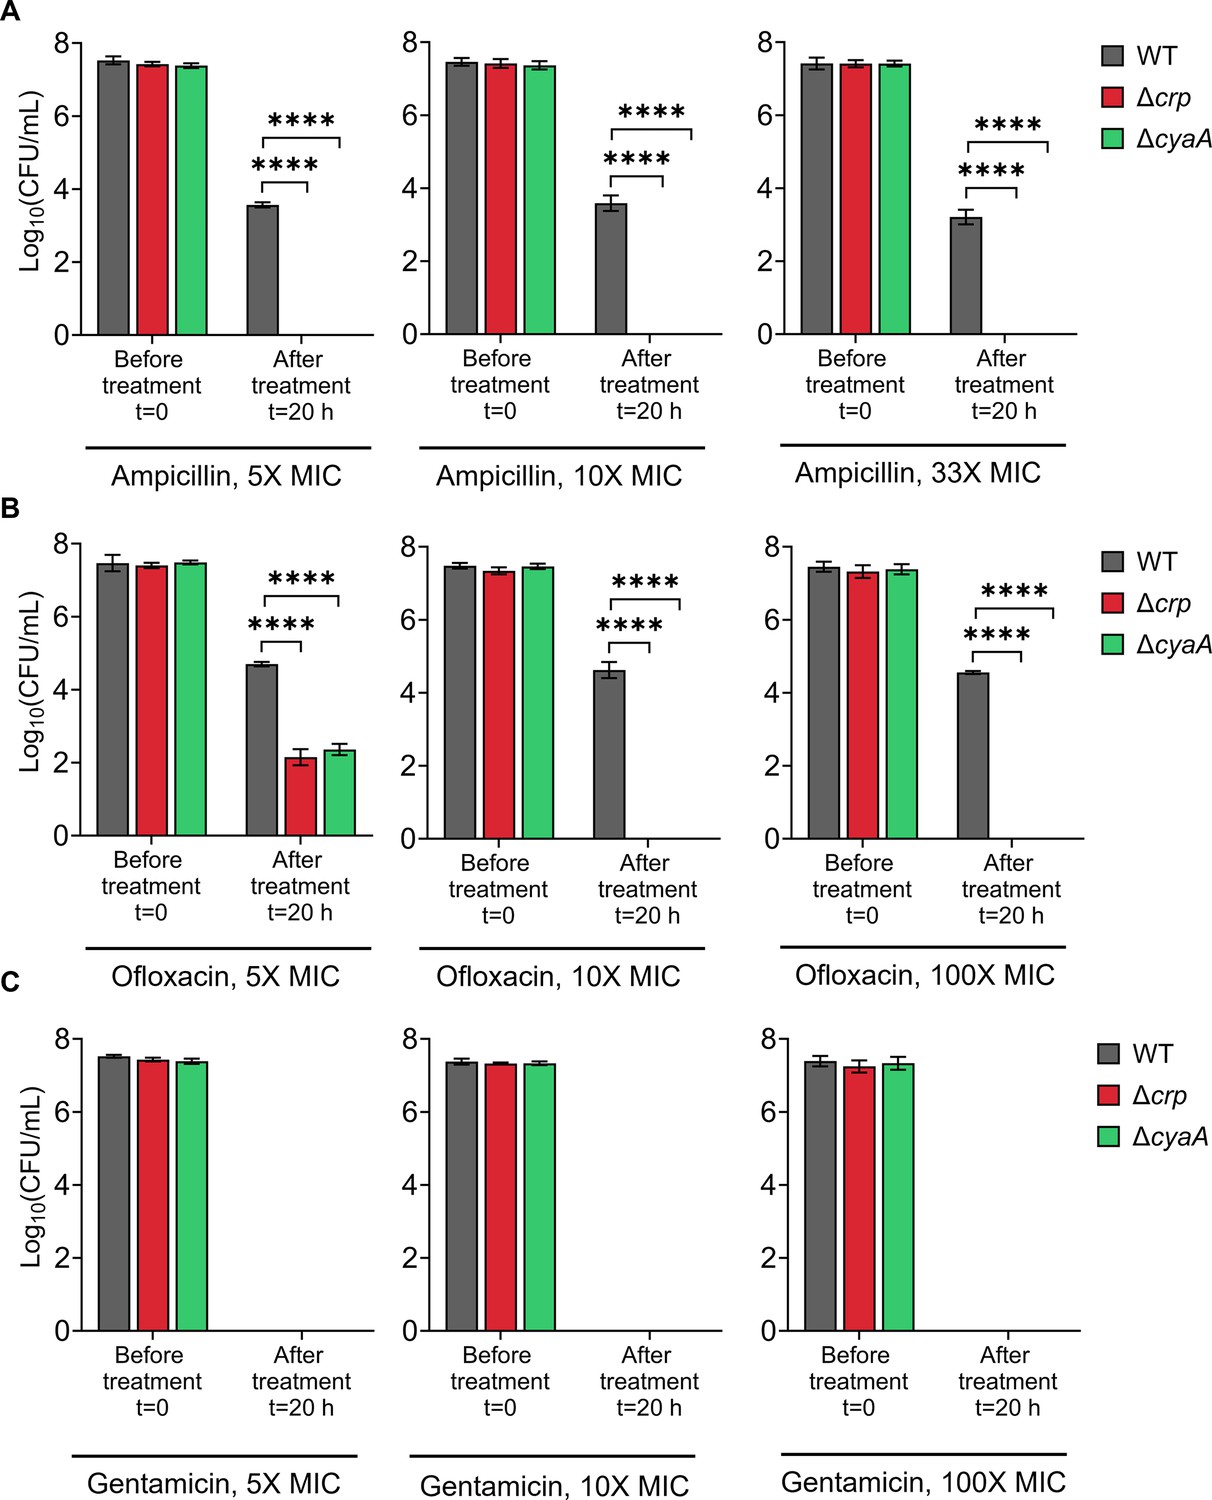
Persister levels of E. coli K-12 MG1655 WT, Δcrp, and ΔcyaA strains at normalized antibiotic concentrations.
Panels show survival following treatment with (A) ampicillin, (B) ofloxacin, and (C) gentamicin. After treatment, samples were washed six times with 1 X PBS to minimize antibiotic carryover. Antibiotic concentrations were normalized to MICs to ensure valid comparisons across strains (The concentrations of 33×MIC for ampicillin and 100×MIC for ofloxacin and gentamicin match those used in Figure 1). n=4. Statistical significance was observed between control and mutant strains (****p<0.0001, One-way ANOVA with Dunnett’s multiple comparisons test). The data for each time point represent the mean value ± standard deviation.
Figure 1—figure supplement 7
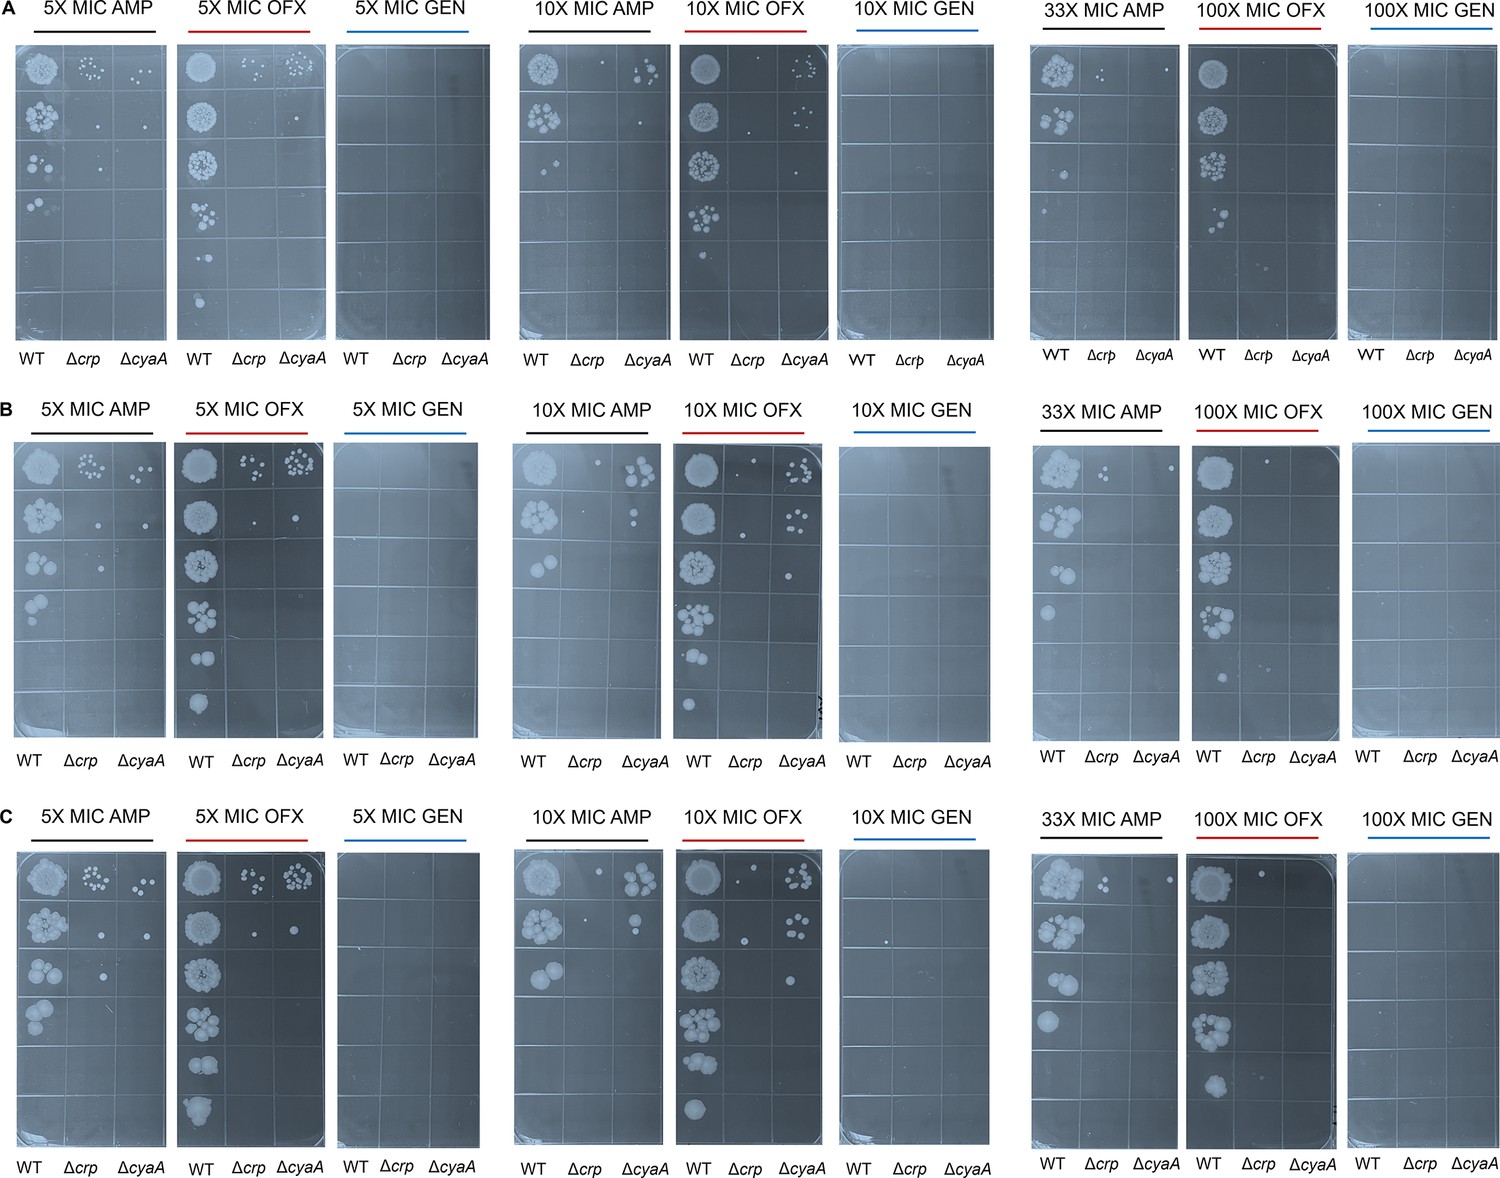
Agar plates showing E. coli K-12 MG1655 WT, Δcrp, and ΔcyaA strains following treatment with antibiotics at normalized concentrations.
After treatment, cells were washed and subjected to 10-fold serial dilutions, then plated on agar. Plates were incubated for (A) 16 hr, (B) 48 hr, and (C) 72 hr to assess colony formation over time. The panel is a representative biological replicate. Consistent results were seen across all three biological replicates.
Figure 1—figure supplement 8
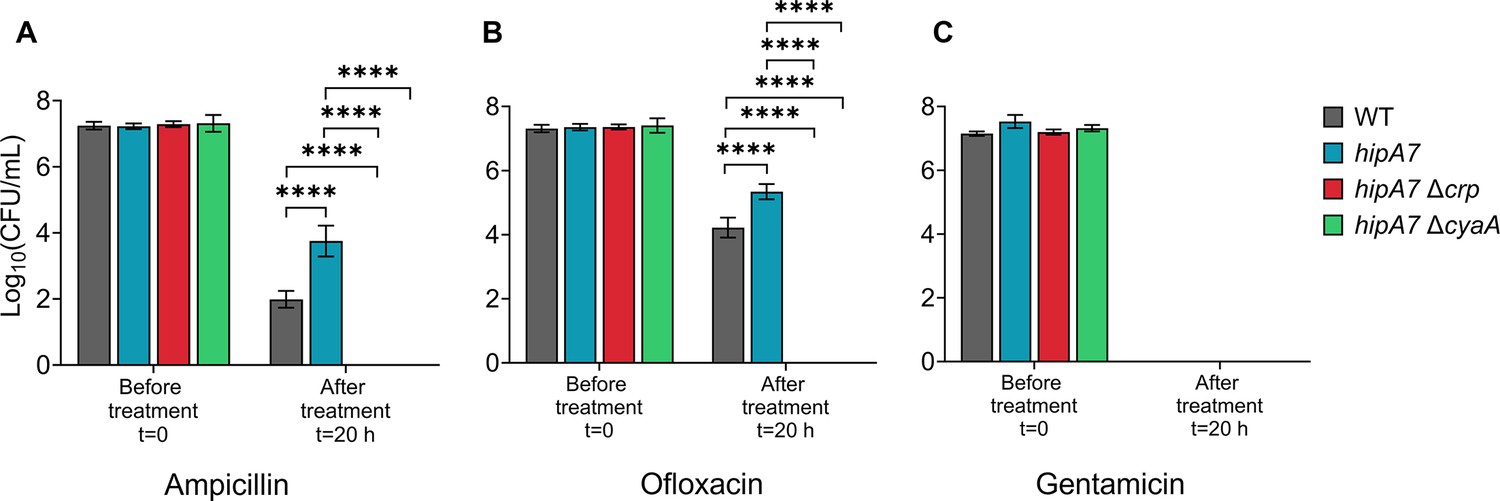
Deletion of crp and cyaA reduces ampicillin and ofloxacin persistence in the hipA7 strain.
Persistence levels were assessed by exposing E. coli K-12 MG1655 WT, hipA7, hipA7Δcrp, and hipA7ΔcyaA strains in the late stationary phase to the specified antibiotics, followed by CFU quantification at designated time points. (A) Ampicillin (200 µg/ml), (B) Ofloxacin (5 µg/ml) and (C) Gentamicin (50 µg/ml). n=4. Statistical significance was observed between control and mutant strains (****p<0.0001, One-way ANOVA with Dunnett’s multiple comparisons test). The data for each time point represent the mean value ± standard deviation.
Figure 2 with 3 supplements
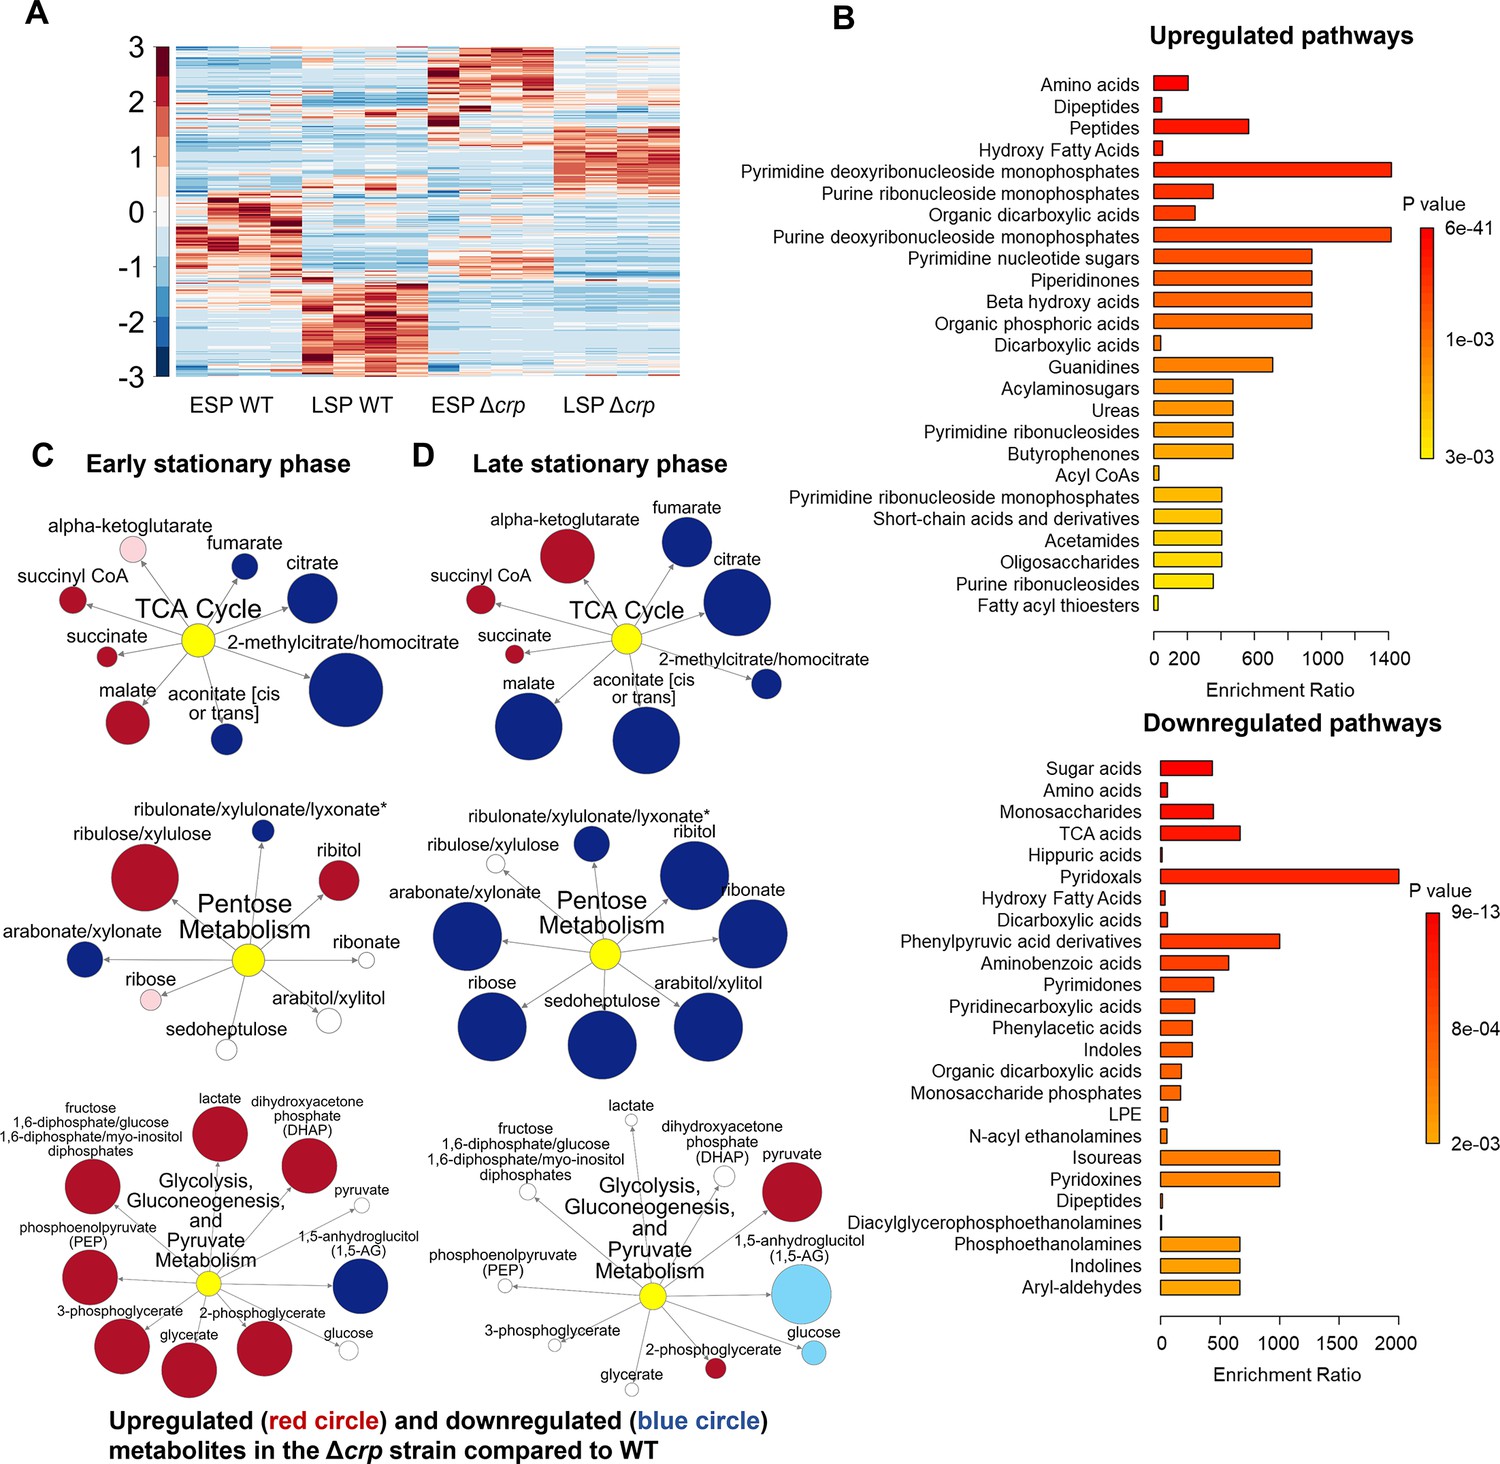
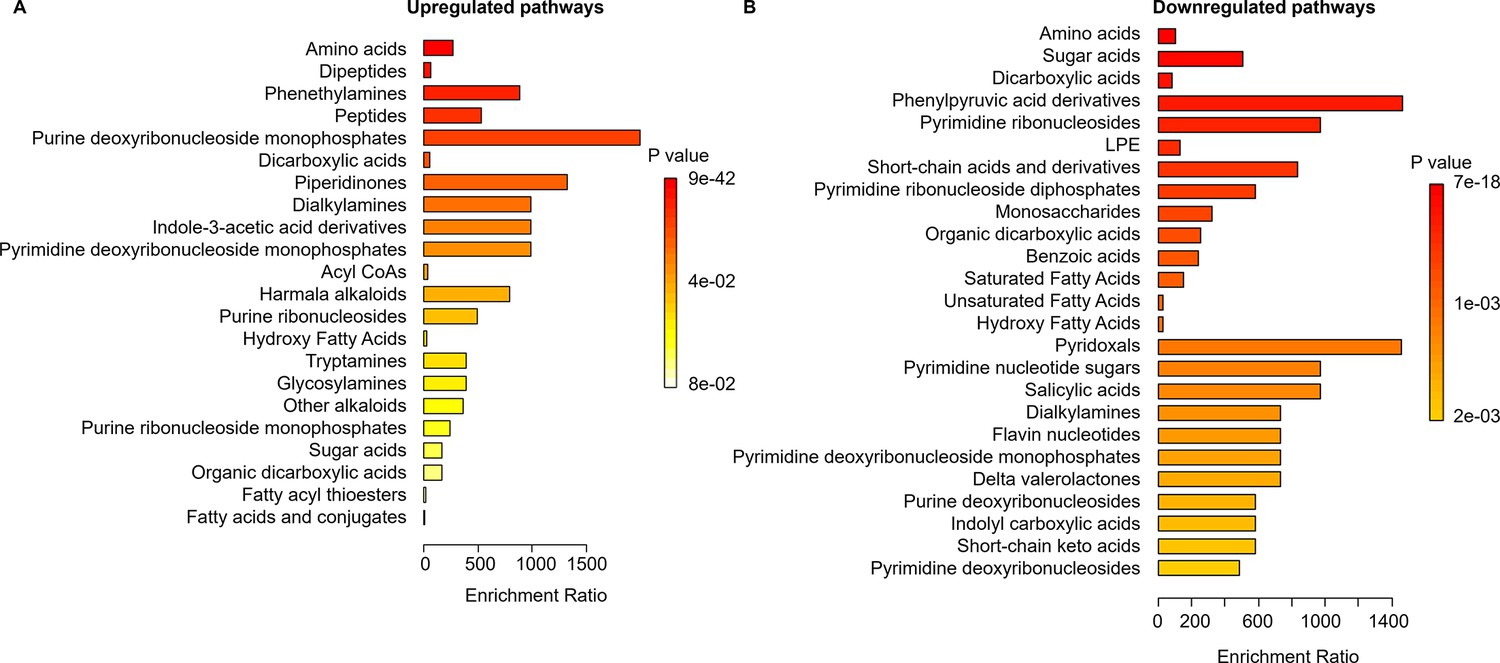
The effect of Crp/cAMP on persister cell metabolism during stationary phase.
(A) MS analysis of E. coli K-12 MG1655 WT, and Δcrp at early (t=5 hr) and late (t=24 hr) stationary phases. Unsupervised hierarchical clustering was applied to standardized metabolic data. Each column represents a biological replicate. n=4. (B) Pathway enrichment analysis was conducted using MetaboAnalyst (Lu et al., 2023). Upregulated and downregulated pathways of the Δcrp strain compared to WT in the late stationary growth phase were provided in this figure. (C, D) Pathway enrichment maps comparing metabolites of the TCA cycle, pentose phosphate metabolism, glycolysis, gluconeogenesis, and pyruvate metabolism in Δcrp versus WT for early and late stationary phase conditions, respectively. Circle size corresponds to the ratio of normalized metabolite intensities between mutant and control cells. Blue (p ≤ 0.05 for dark blue; 0.05 < p < 0.10 for light blue) and red (p ≤ 0.05 for dark red; 0.05 < p < 0.10 for light red) indicate significantly downregulated or upregulated metabolites in the mutant compared to the control. White signifies no significant difference. n=4 for all panels. ESP: Early stationary phase, LSP: Late stationary phase.
-
Figure 2—source data 1
Normalized metabolomics data of early and late stationary phases of wild-type and mutant crp across three biological replicates.
Data collected and analyzed by Metabolon Inc (Morrisville, NC).
- https://cdn.elifesciences.org/articles/99735/elife-99735-fig2-data1-v1.xlsx
Figure 2—figure supplement 1
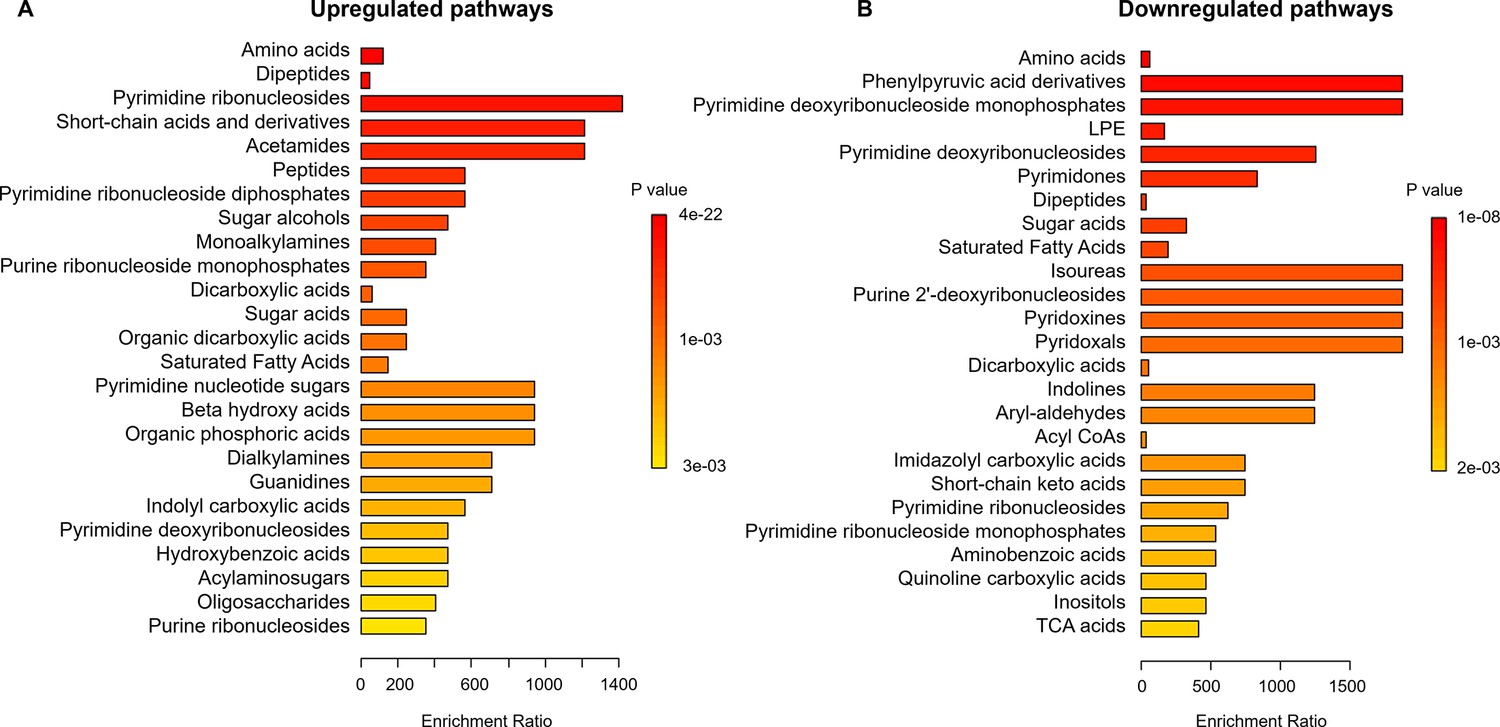
The pathway enrichment analysis comparing WT and Δcrp strains during the early stationary phase cultures.
The analysis was conducted using MetaboAnalyst, with a threshold ratio (Δcrp/WT) set at ≤0.5 for downregulation and ≥2 for upregulation. (A) Upregulated and (B) Downregulated pathways in the Δcrp strain compared to WT during the early stationary growth phase (ESP).
Figure 2—figure supplement 2
The pathway enrichment analysis for the WT strain.
The analysis was conducted using MetaboAnalyst, with a threshold ratio (LSP/ESP) set at ≤0.5 for downregulation and ≥2 for upregulation. (A) Upregulated and (B) Downregulated pathways of the WT strain in the late stationary growth phase (LSP) compared to the WT strain in the early stationary phase (ESP).
Figure 2—figure supplement 3
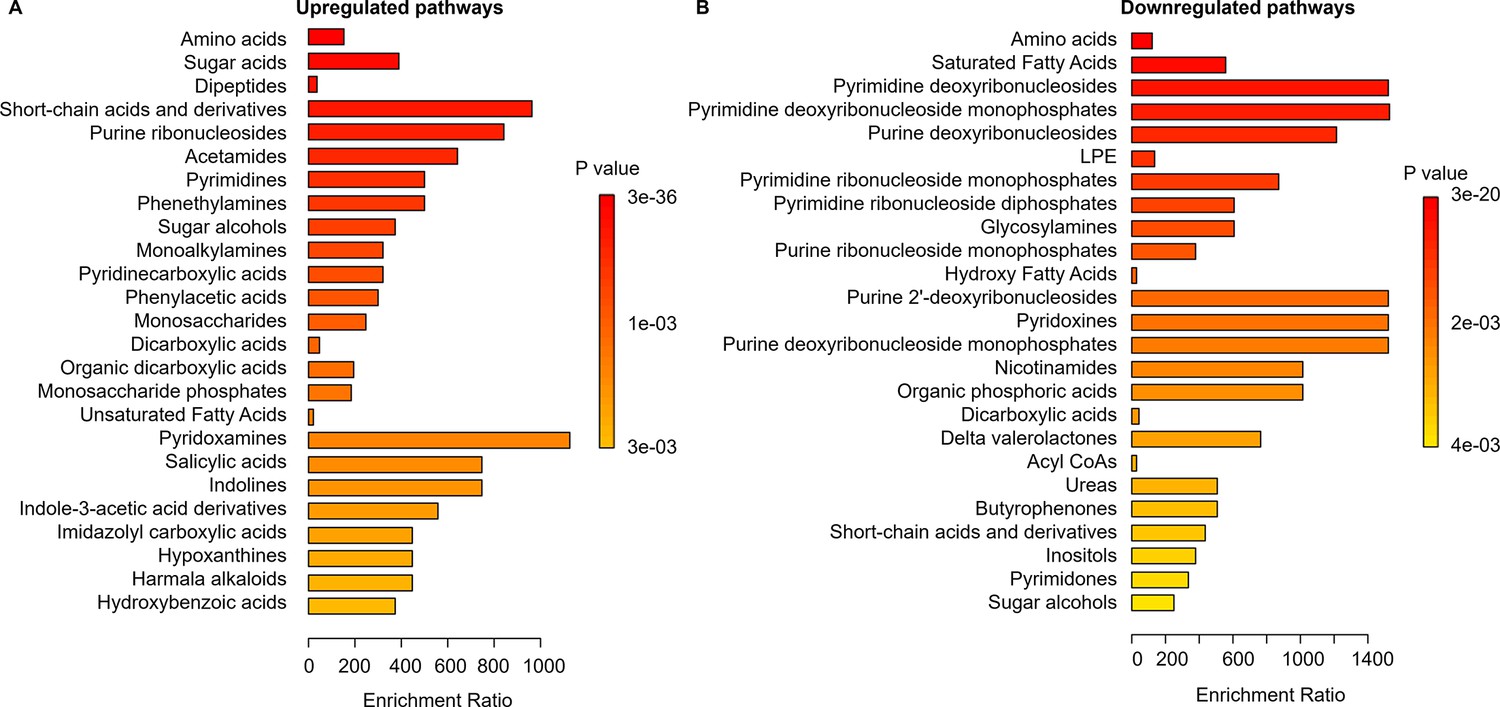
The pathway enrichment analysis for the Δcrp strain.
The analysis was conducted using MetaboAnalyst, with a threshold ratio (LSP/ESP) set at ≤0.5 for downregulation and ≥2 for upregulation. (A) Upregulated and (B) Downregulated pathways of the Δcrp strain in the late stationary growth phase (LSP) compared to the Δcrp strain in the early stationary phase (ESP).
Figure 3 with 1 supplement
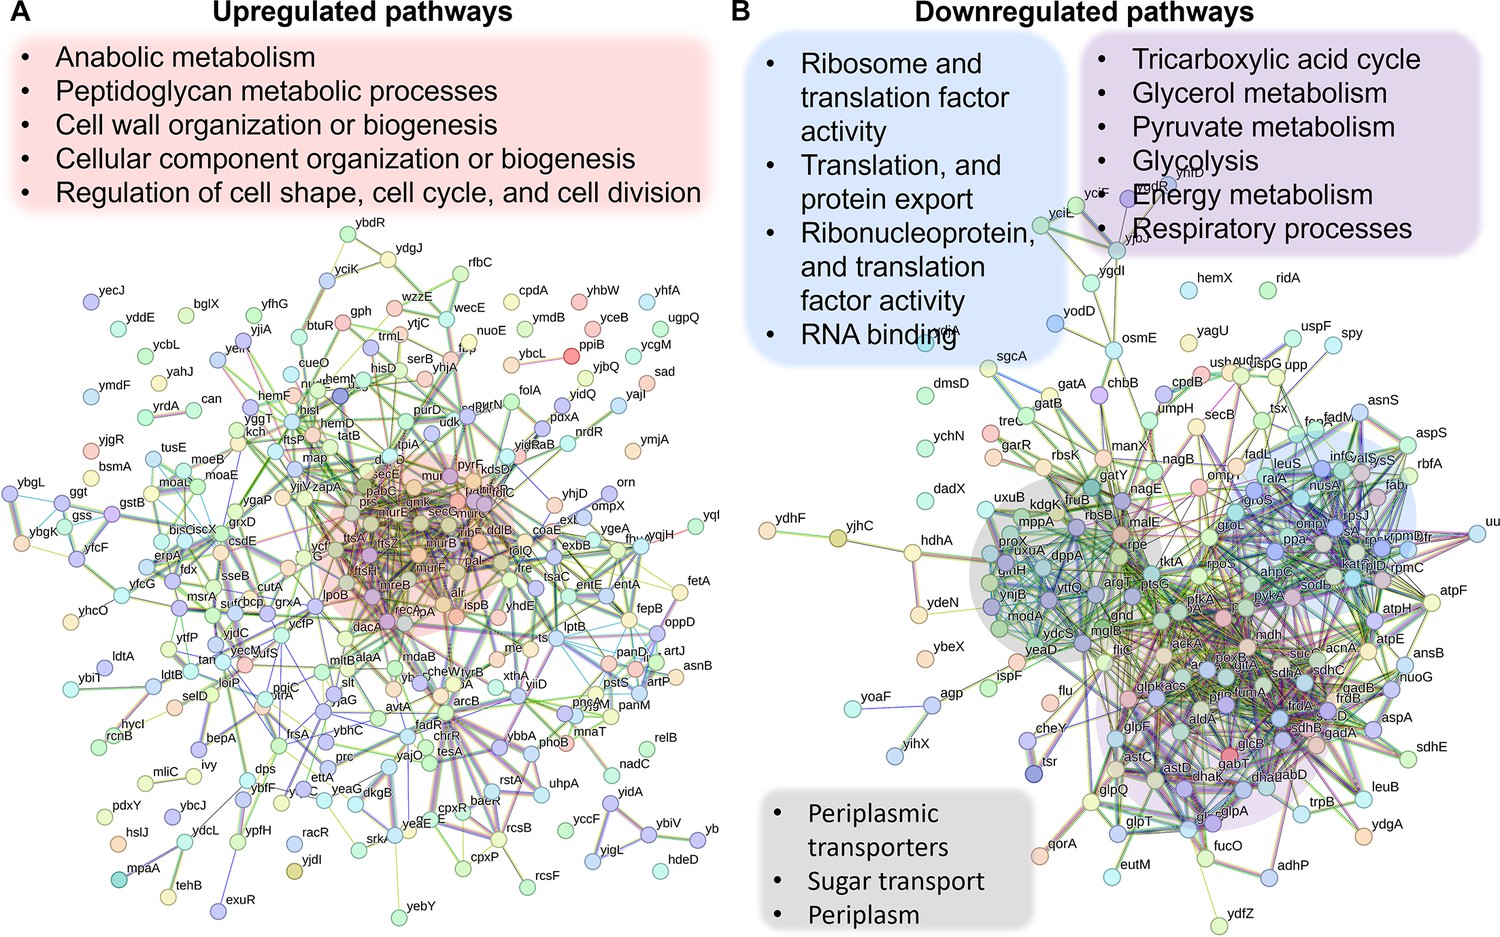
Validation of Crp/cAMP-mediated metabolic state in persister cells through proteomics analysis.
Pathway enrichment analysis was conducted in STRING (Szklarczyk et al., 2021; Szklarczyk et al., 2023) for upregulated (A) and downregulated (B) proteins. Genes highlighted in red are linked with the upregulated protein networks, while genes in blue, gray, and purple correspond to those in the downregulated protein network. The visual network in STRING illustrates protein interactions. In evidence mode, color in the network represents the interaction evidence of data support, derived from curated databases, experimental data, gene neighborhood, gene fusions, co-occurrence, co-expression, protein homology, and text mining (Szklarczyk et al., 2021; Szklarczyk et al., 2023).
-
Figure 3—source data 1
Normalized proteomics data of the late stationary phase of wild-type and mutant crp across three biological replicates.
Data collected by UT Health’s Clinical and Translational Proteomics Service Center (Houston, TX).
- https://cdn.elifesciences.org/articles/99735/elife-99735-fig3-data1-v1.xlsx
Figure 3—figure supplement 1
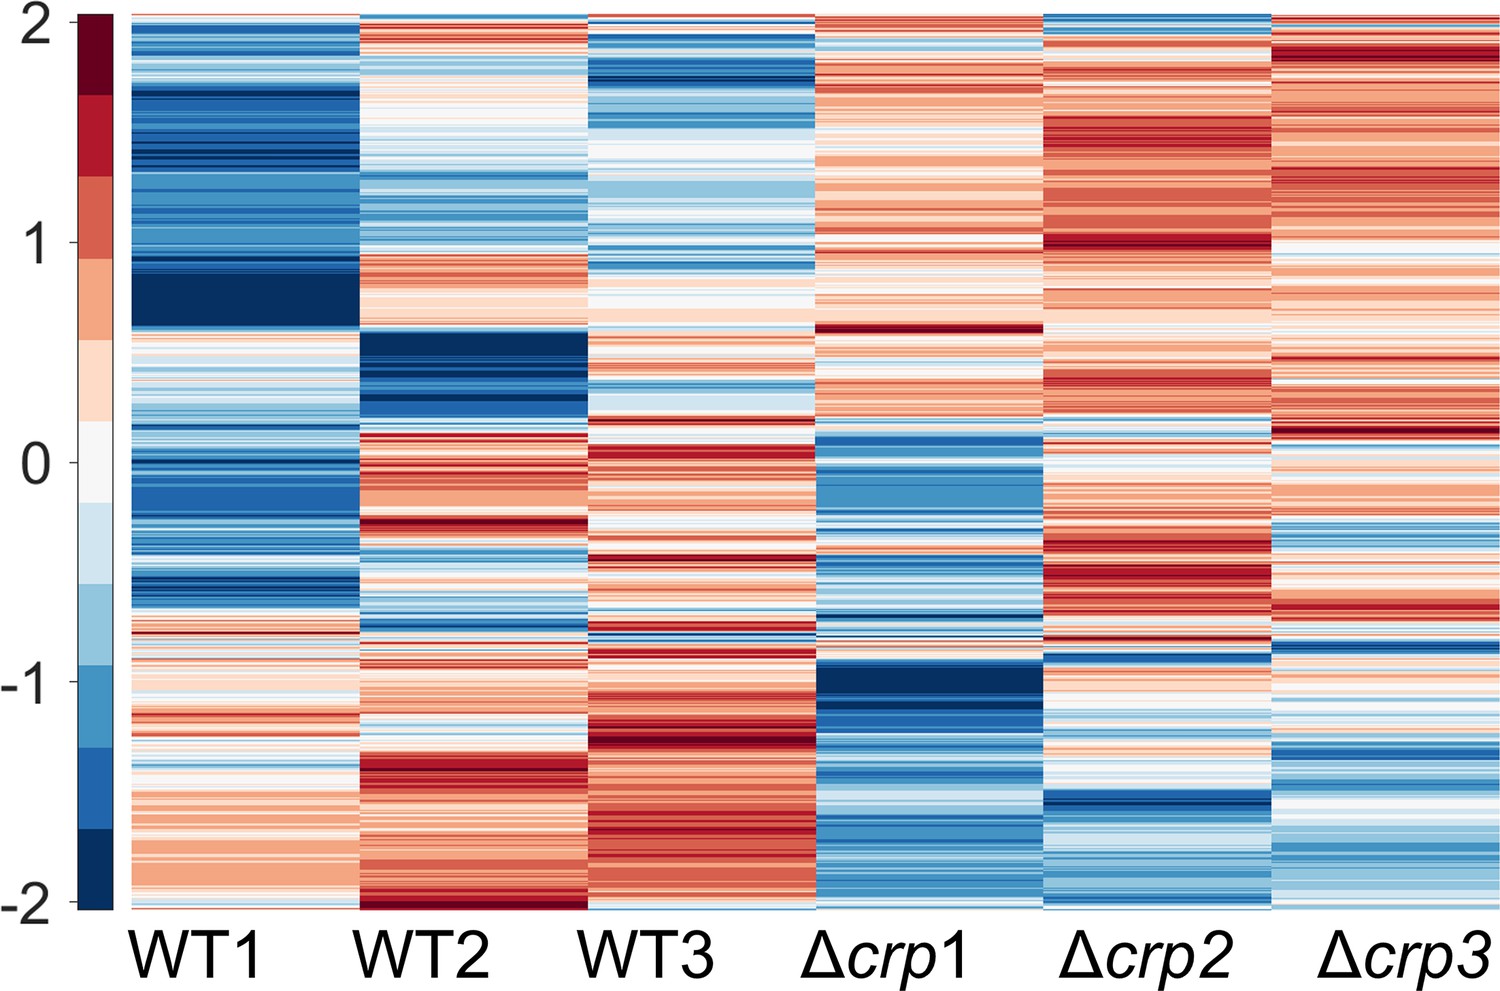
The MS analysis of proteins from both WT and Δcrp strains at the late stationary phase.
The proteomic data were subjected to unsupervised hierarchical clustering. Each column in the figure represents a biological replica. n=3.
Figure 4 with 2 supplements
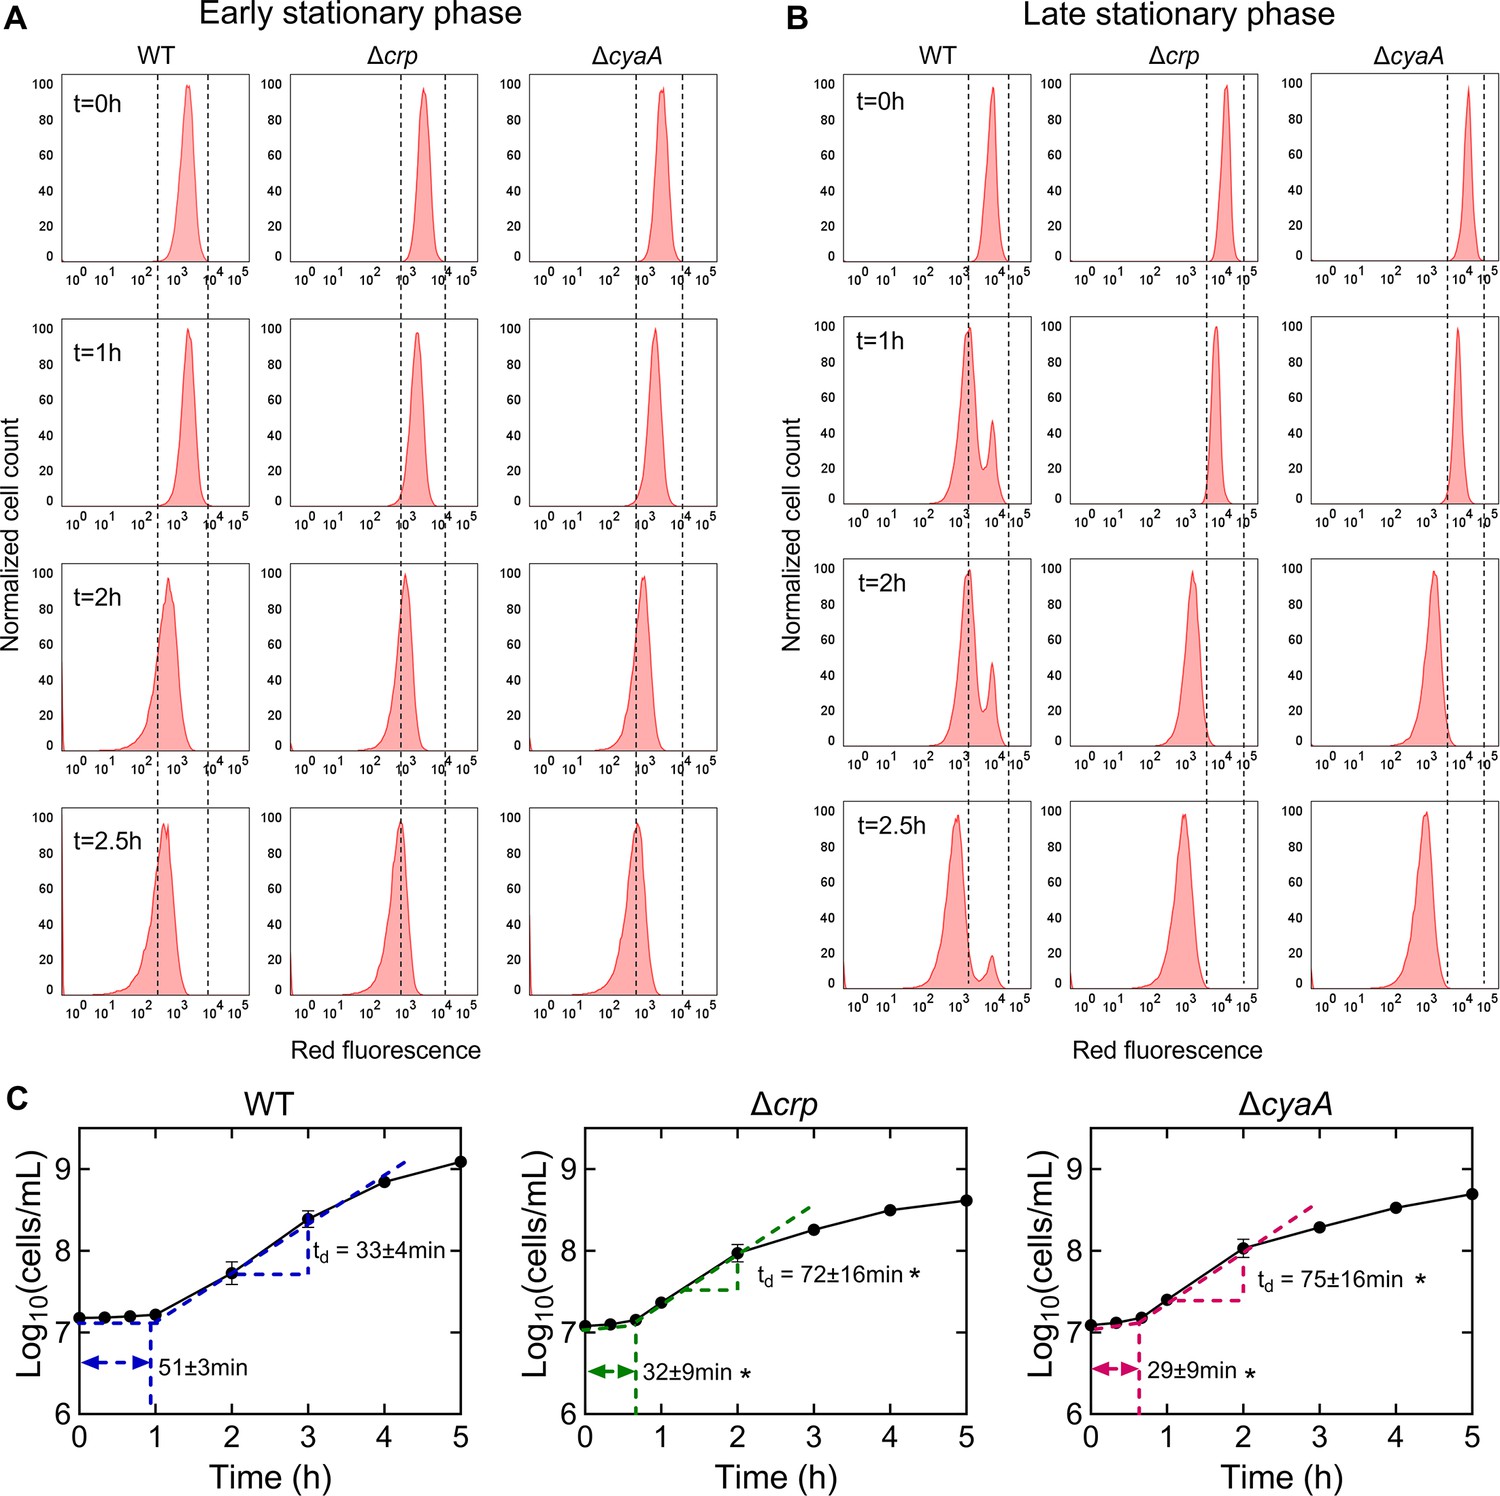
The role of Crp/cAMP in non-growing cell formation.
(A, B) Flow cytometry histograms depict mCherry expression in E. coli K-12 MG1655 WT, Δcrp, and ΔcyaA at early (t=5 hr) and late (t=24 hr) stationary phases, respectively. Cells containing an IPTG-inducible mCherry expression system were cultivated with IPTG. After washing and dilution of early and late stationary phase cells in IPTG-free fresh media, fluorescence was tracked in non-growing and growing cells for 2.5 hr. The panel is a representative biological replicate. Consistent results were seen across all three biological replicates. (C) Growth curves of WT, Δcrp, and ΔcyaA cultures were determined using flow cytometry to calculate lag and doubling times. Lag times were calculated using the ‘Microbial lag phase duration calculator’ (Opalek et al., 2022). Doubling times were computed using the formula td=Δt/(3.3xLog10(N/No)). n=3. *Statistical significance observed between control and mutant strains (p<0.05, two-tailed t-test). The data for each time point represent the mean value ± standard deviation.
Figure 4—figure supplement 1
Persister levels of E. coli WT, Δcrp, and ΔcyaA cells with the integrated mCherry expression system.
Late stationary phase cultures (t=24 hr) were transferred to fresh media and treated with ampicillin (200 μg/mL), ofloxacin (5 μg/mL), and gentamicin (50 μg/mL) for 20 hr. Subsequently, 1 mL of the treated culture underwent two washes with 1 X PBS to remove antibiotics. It was then serially diluted and plated on an agar plate to count the CFUs. The levels of ofloxacin and gentamicin persisters in the mutant strains were below the limit of detection. n=4. Statistical significance was observed between control and mutant strains (***p<0.001, ****p<0.0001, Two-way ANOVA with Tukey’s multiple comparisons test). The data for each time point represent the mean value ± standard deviation.
Figure 4—figure supplement 2
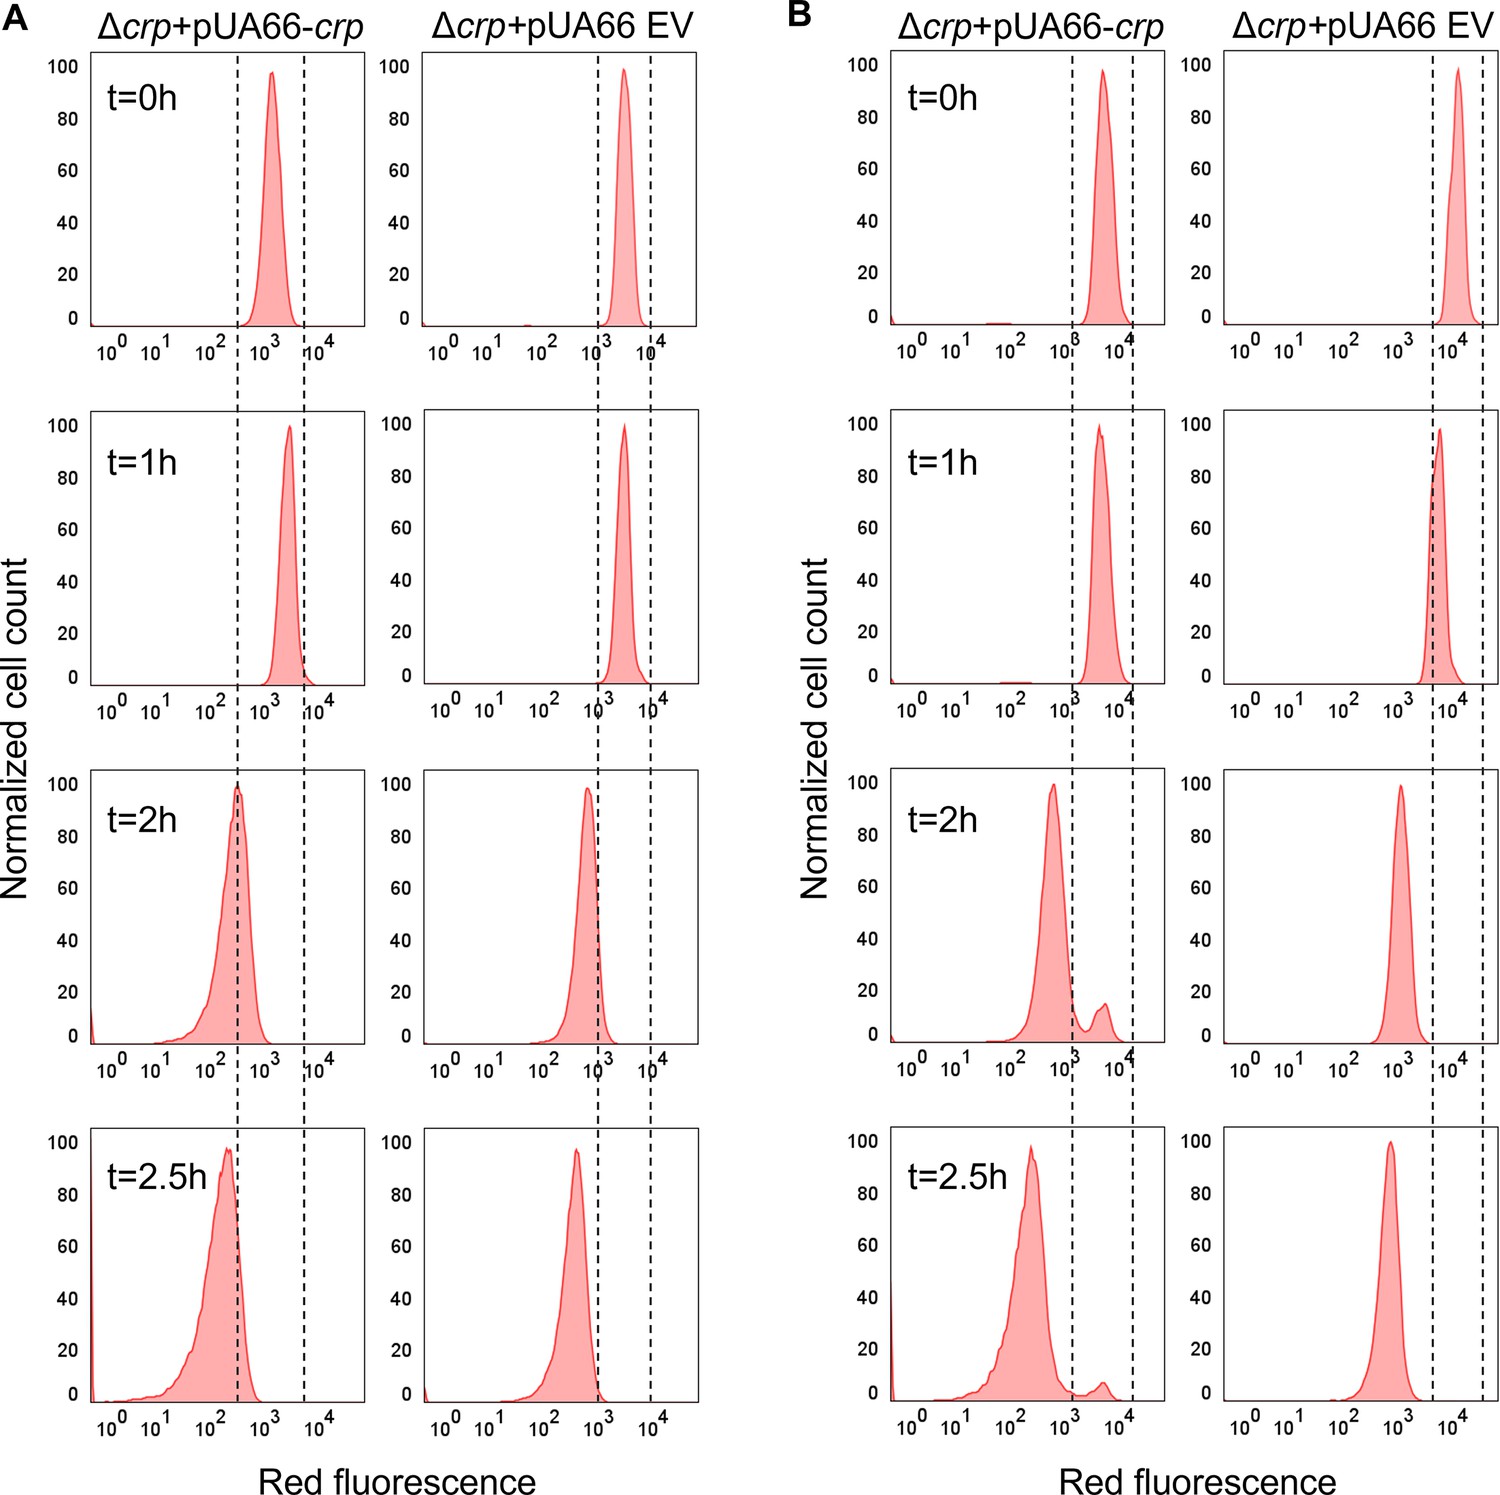
Non-growing cell levels in the E. coli strain carrying the Crp expression system.
(A, B) Flow cytometry histograms depict mCherry expression in Δcrp +pUA66 crp, and Δcrp +pUA66 EV at early (t=5 hr) and late (t=24 hr) stationary phases, respectively. Cells containing an IPTG-inducible mCherry expression system were cultivated with IPTG. After washing and dilution of early and late stationary phase cells in IPTG-free fresh media, fluorescence was tracked in non-growing and growing cells for 2.5 hr. The panel is a representative biological replicate. Consistent results were seen across all three biological replicates.
Figure 5 with 4 supplements
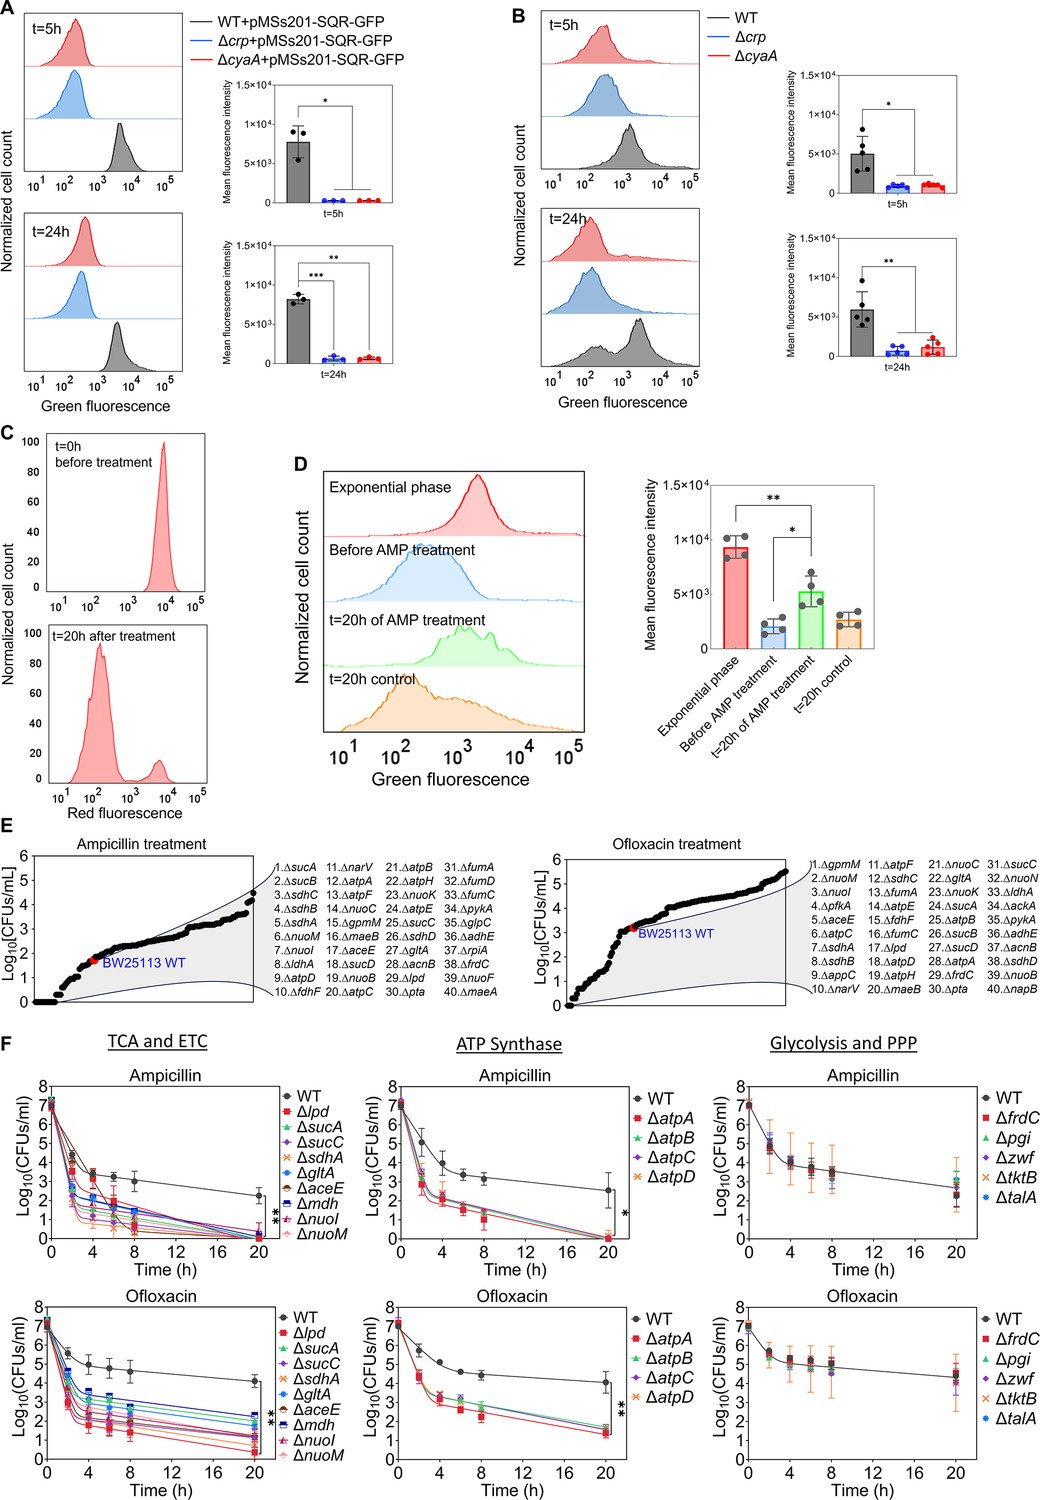
Crp/cAMP-mediated metabolic state of persister cells.
(A) GFP reporter plasmid introduced into E. coli K-12 MG1655 WT, Δcrp, and ΔcyaA cells to monitor SQR gene activity. Flow cytometry was used to detect activity at early (t=5 hr) and late (t=24 hr) stationary phases. The panel on the left represents a biological replicate, and the results are consistent across all three replicates, as demonstrated in the panel on the right. Statistical significance observed between control and mutant groups (*p<0.05, **p<0.01, ***p<0.001, two-tailed t-test). (B) Redox activities of E. coli K-12 MG1655 WT, Δcrp, and ΔcyaA cells were measured at early (t=5 hr) and late (t=24 hr) stationary phases by flow cytometry using a RSG dye. This dye fluoresces green after reduction by bacterial reductases. A representative biological replicate is shown (left), with consistent results across all five replicates (right). Statistical significance observed between control and mutant groups (*p<0.05, **p<0.01, two-tailed t-test). (C) E. coli cells with integrated mCherry expression system used to validate cellular respiration. Cells were diluted into fresh media and treated with ampicillin (200 μg/mL) for 20 hr. Flow cytometry measured the red fluorescence of intact surviving cells. A representative biological replicate is shown, with consistent results across all three replicates. (D) RSG levels of cells (carrying the mCherry expression system) at exponential phase (t=3 hr); cells before ampicillin treatment; non-lysed (intact) cells after 20 hr of ampicillin treatment; and untreated cells after 20 hr of culturing. A representative biological replicate is shown (left), with consistent results across all four replicates (right). Statistical significance observed between intact antibiotic-treated cells and others (*p<0.05, **p<0.01, two-tailed t-test). (E) High-throughput screening of mutants from the Keio collection. The mutant strains selected are associated with central metabolism. Stationary phase cells were diluted 100-fold in fresh medium and treated with ampicillin (200 μg/mL) or ofloxacin (5 μg/mL) for 20 hr. Treated cultures were washed, serially diluted, and plated on agar plates to quantify CFUs. (F) Genes related to the TCA cycle, ETC, ATP synthase, glycolysis, and pentose phosphate pathway (PPP) were knocked out and then treated with ampicillin (200 μg/mL) or ofloxacin (5 μg/mL) to enumerate CFUs. n=4. Biphasic kill curves were generated using a non-linear model. Statistical significance tests were conducted using F-statistics (*p < 0.05, and **p < 0.01). Each data point represents the mean value ± standard deviation.
Figure 5—figure supplement 1
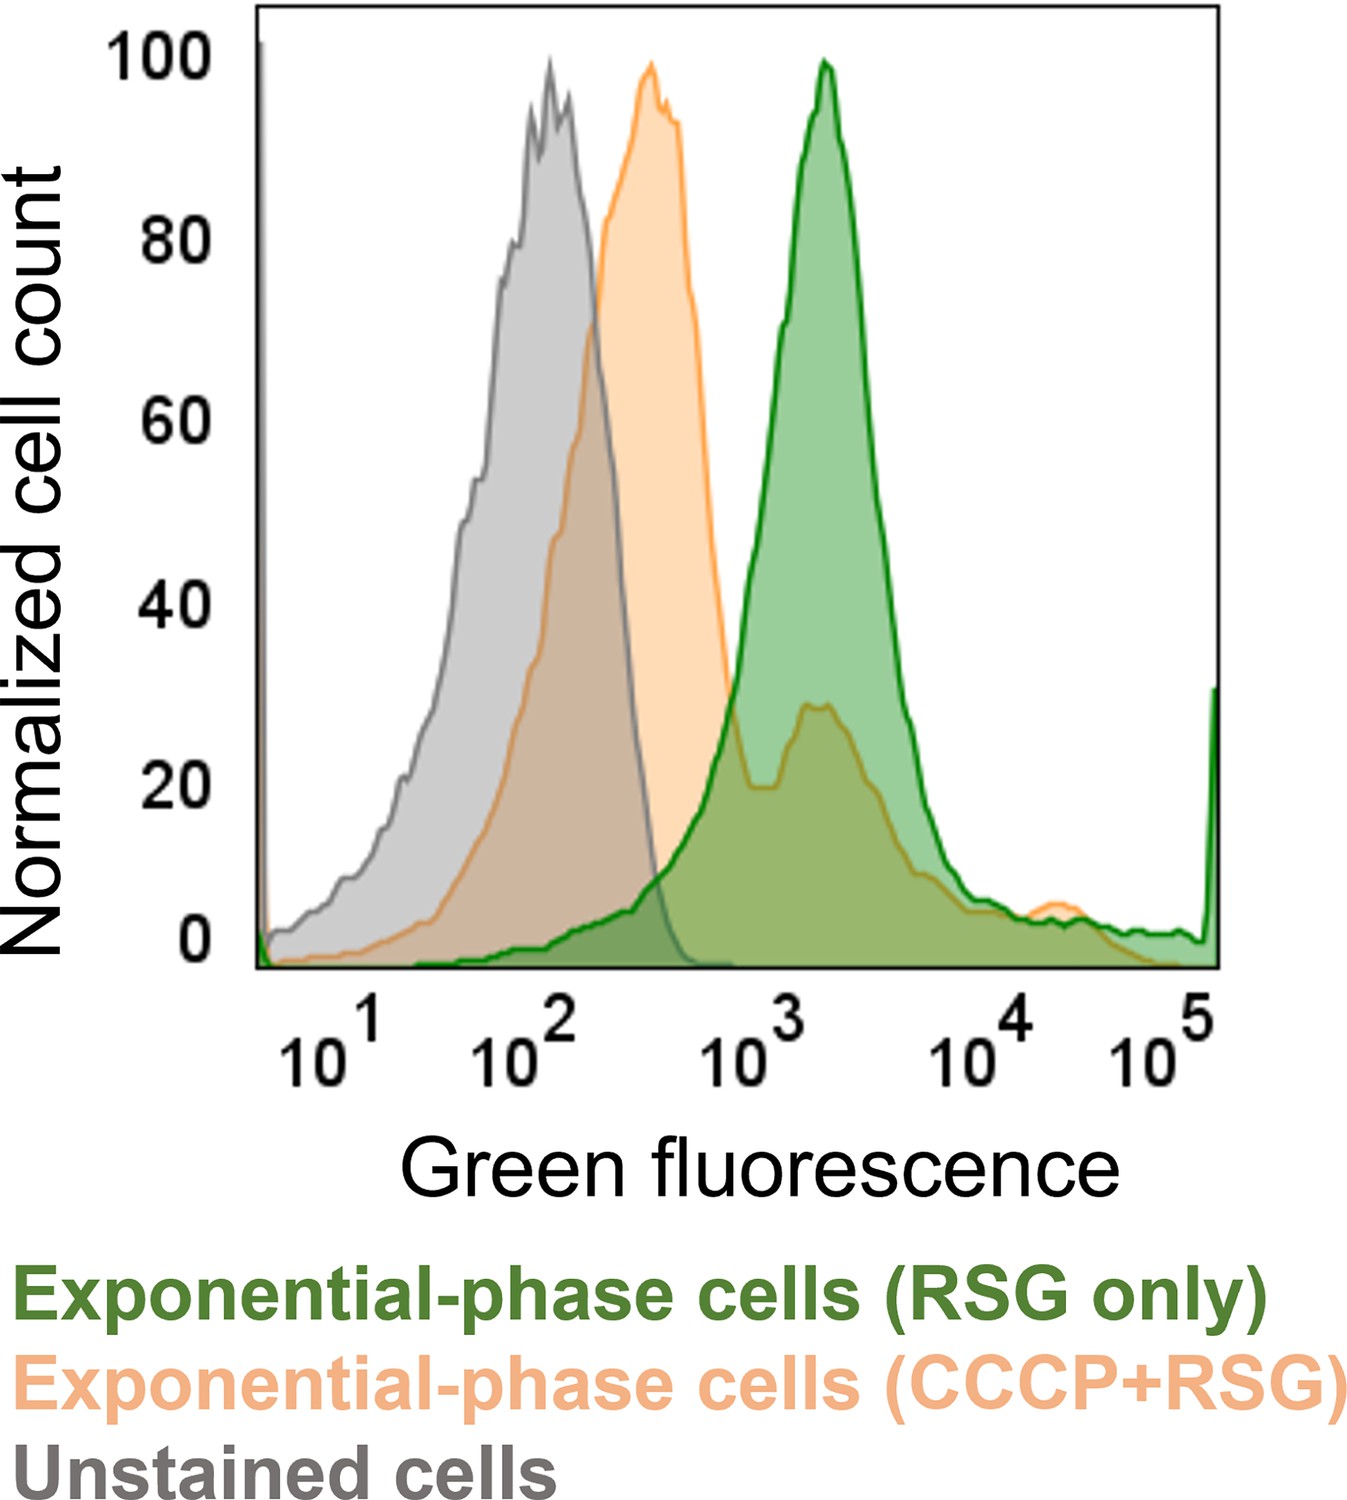
RSG staining control for bacterial metabolic activities.
Exponential phase (t=3 hr) cells were stained with 1 μM RSG for 10 min at 37 °C before analyzing by flow cytometry. Unstained cells and cells treated with 20 μM CCCP +1 μM RSG were used as control. CCCP was expected to reduce cellular redox activities. The panel is a representative biological replicate. Consistent results were seen across all three biological replicates.
Figure 5—figure supplement 2
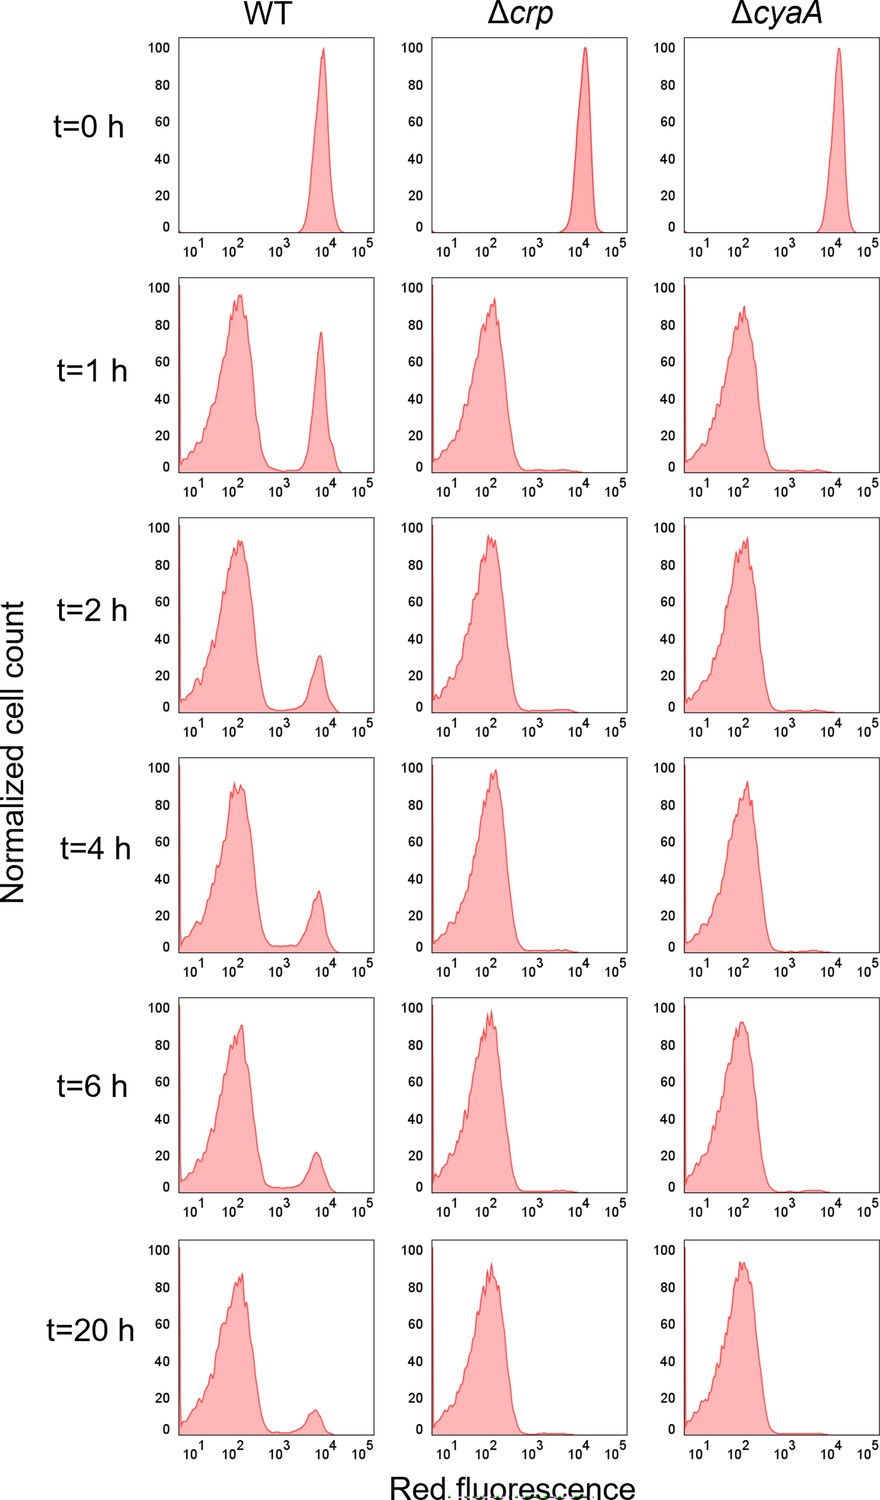
Intact (non-lysed) cell levels of E. coli WT, Δcrp, and ΔcyaA cells with the integrated mCherry expression system.
mCherry-positive cells were diluted into fresh media and treated with ampicillin (200 μg/mL) for 20 hr. Flow cytometry was used to measure the red fluorescence of intact surviving cells at time points t=0, 1, 2, 4, 6, and 20 hr. A representative biological replicate is shown, with consistent results across all three replicates.
Figure 5—figure supplement 3
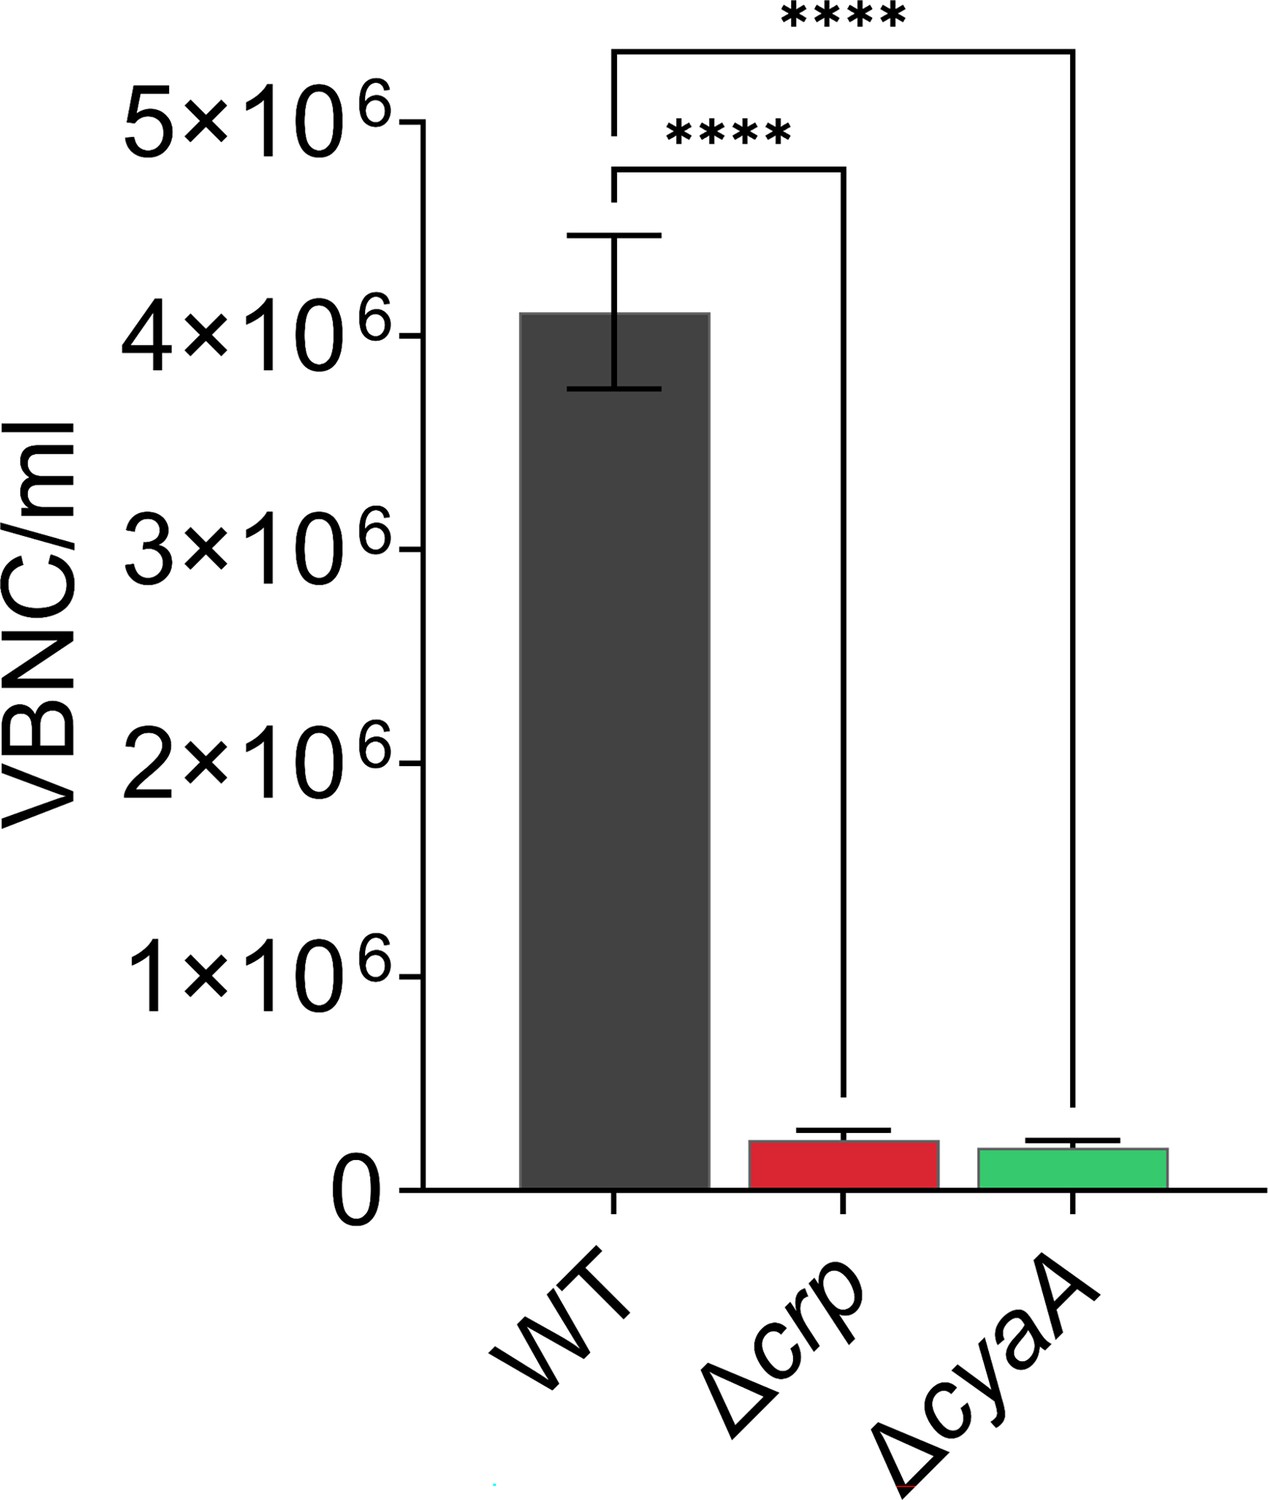
VBNC levels of E. coli WT, Δcrp, and ΔcyaA cells with the integrated mCherry expression system.
Flow cytometry was employed to quantify intact surviving cells. Persister cells were quantified by plating the cells on agar media. Viable but nonculturable (VBNC) cells were enumerated by subtracting persister levels from the intact cell levels. n=4. Statistical significance was observed between control and mutant strains (****p<0.0001, One-way ANOVA using Dunnett’s multiple comparisons test). The data for each time point represent the mean value ± standard deviation.
Figure 5—figure supplement 4
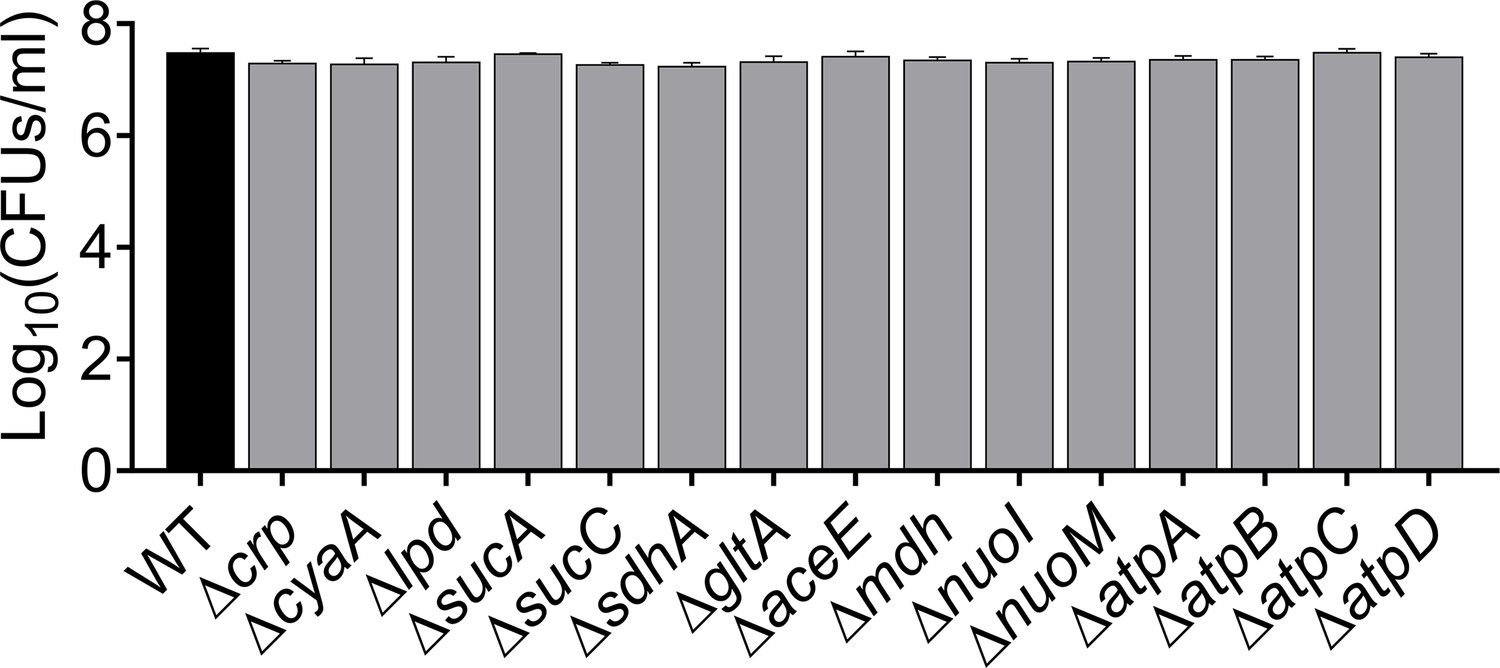
Cell counts of E. coli K-12 MG1655 WT and mutant strains using flow cytometry at late stationary phase.
Cells were diluted 100-fold into 1 mL of 1 X PBS. n=4. The data for each time point represent the mean value ± standard deviation.
Author response image 1

Persister levels of E. coli K-12 MG1655 WT, Δcrp, and Δcrp strains in late stationary phase.
Cells were treated with ampicillin (5× MIC for 4 h), ofloxacin (5× MIC for 2.5 h), and gentamicin (3× MIC for 1 h). Concentrations and treatment durations were selected based on (Zeng et al., 2022).
Author response image 2
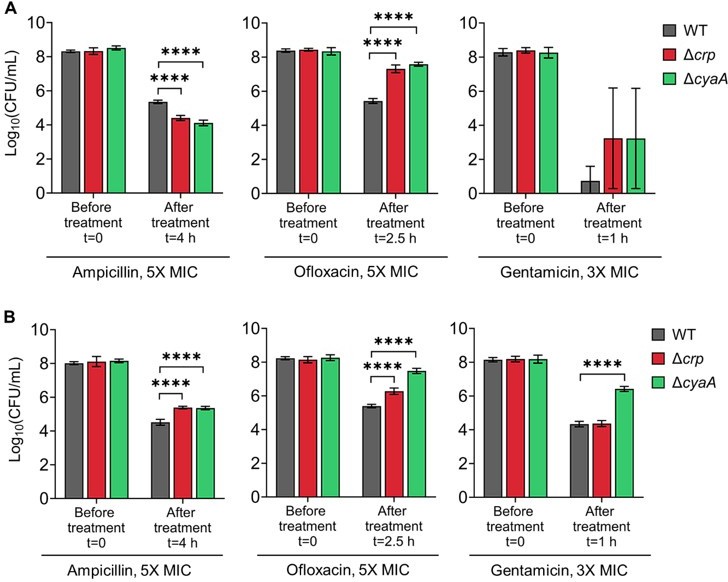
Persister levels of E. coli K-12 MG1655 (Panel A) and BW25113 (Panel B) WT, Δcrp, and Δcrp strains in the exponential growth phase.
Cells were treated at mid-exponential phase (OD600 ~0.25) with ampicillin (5× MIC for 4 h), ofloxacin (5× MIC for 2.5 h), and gentamicin (3× MIC for 1 h). Treatment concentrations and durations were based on conditions described in (Zeng et al., 2022).
Tables
Appendix 1—key resources table
| Reagent type (species) or resource | Designation | Source or reference | Identifiers | Additional information |
|---|---|---|---|---|
| Strain, strain background (Escherichia coli) | K-12 MG1655 Wild Type | Gift from Dr. Mark P. Brynildsen | ||
| Strain, strain background (E. coli) | K-12 MG1655 hipA7 | Gift from Dr. Mark P. Brynildsen | ||
| Strain, strain background (E. coli) | K-12 MG1655 hipA7Δcrp | This study | ||
| Strain, strain background (E. coli) | K-12 MG1655 hipA7ΔcyaA | This study | ||
| Strain, strain background (E. coli) | K-12 BW25113 Wild Type | Keio collection | Catalog # OEC5042 | |
| Strain, strain background (E. coli) | K-12 MG1655 MO | Gift from Dr. Mark P. Brynildsen | ||
| Strain, strain background (E. coli) | K-12 MG1655 MO Δcrp | This study | ||
| Strain, strain background (E. coli) | K-12 MG1655 MO ΔcyaA | This study | ||
| Strain, strain background (E. coli) | K-12 MG1655 Δcrp | This study | ||
| Strain, strain background (E. coli) | K-12 MG1655 ΔcyaA | This study | ||
| Strain, strain background (E. coli) | K-12 MG1655 ΔsucA | This study | ||
| Strain, strain background (E. coli) | K-12 MG1655 Δlpd | This study | ||
| Strain, strain background (E. coli) | K-12 MG1655 ΔsucC | This study | ||
| Strain, strain background (E. coli) | K-12 MG1655 ΔsdhA | This study | ||
| Strain, strain background (E. coli) | K-12 MG1655 ΔgltA | This study | ||
| Strain, strain background (E. coli) | K-12 MG1655 ΔaceE | This study | ||
| Strain, strain background (E. coli) | K-12 MG1655 ΔtktB | This study | ||
| Strain, strain background (E. coli) | K-12 MG1655 Δmdh | This study | ||
| Strain, strain background (E. coli) | K-12 MG1655 ΔnuoI | This study | ||
| Strain, strain background (E. coli) | K-12 MG1655 ΔnuoM | This study | ||
| Strain, strain background (E. coli) | K-12 MG1655 ΔatpA | This study | ||
| Strain, strain background (E. coli) | K-12 MG1655 ΔatpB | This study | ||
| Strain, strain background (E. coli) | K-12 MG1655 ΔatpC | This study | ||
| Strain, strain background (E. coli) | K-12 MG1655 ΔatpD | This study | ||
| Strain, strain background (E. coli) | K-12 MG1655 ΔfrdC | This study | ||
| Strain, strain background (E. coli) | K-12 MG1655 Δpgi | This study | ||
| Strain, strain background (E. coli) | K-12 MG1655 Δzwf | This study | ||
| Strain, strain background (E. coli) | K-12 MG1655 ΔtalA | This study | ||
| Strain, strain background (E. coli) | K-12 BW25113 ΔacnB | Keio collection | Catalog # OEC4988 | |
| Strain, strain background (E. coli) | K-12 BW25113 ΔsucA | Keio collection | Catalog # OEC4988 | |
| Strain, strain background (E. coli) | K-12 BW25113 ΔsucB | Keio collection | Catalog # OEC4988 | |
| Strain, strain background (E. coli) | K-12 BW25113 ΔsucC | Keio collection | Catalog # OEC4988 | |
| Strain, strain background (E. coli) | K-12 BW25113 ΔsdhD | Keio collection | Catalog # OEC4988 | |
| Strain, strain background (E. coli) | K-12 BW25113 ΔsdhC | Keio collection | Catalog # OEC4988 | |
| Strain, strain background (E. coli) | K-12 BW25113 ΔsdhB | Keio collection | Catalog # OEC4988 | |
| Strain, strain background (E. coli) | K-12 BW25113 ΔsdhA | Keio collection | Catalog # OEC4988 | |
| Strain, strain background (E. coli) | K-12 BW25113 ΔaceF | Keio collection | Catalog # OEC4988 | |
| Strain, strain background (E. coli) | K-12 BW25113 ΔtalB | Keio collection | Catalog # OEC4988 | |
| Strain, strain background (E. coli) | K-12 BW25113 ΔcyoA | Keio collection | Catalog # OEC4988 | |
| Strain, strain background (E. coli) | K-12 BW25113 ΔcyoB | Keio collection | Catalog # OEC4988 | |
| Strain, strain background (E. coli) | K-12 BW25113 ΔcyoC | Keio collection | Catalog # OEC4988 | |
| Strain, strain background (E. coli) | K-12 BW25113 ΔcyoD | Keio collection | Catalog # OEC4988 | |
| Strain, strain background (E. coli) | K-12 BW25113 ΔacnA | Keio collection | Catalog # OEC4988 | |
| Strain, strain background (E. coli) | K-12 BW25113 Δicd | Keio collection | Catalog # OEC4988 | |
| Strain, strain background (E. coli) | K-12 BW25113 ΔfumA | Keio collection | Catalog # OEC4988 | |
| Strain, strain background (E. coli) | K-12 BW25113 ΔfumB | Keio collection | Catalog # OEC4988 | |
| Strain, strain background (E. coli) | K-12 BW25113 ΔfumC | Keio collection | Catalog # OEC4988 | |
| Strain, strain background (E. coli) | K-12 BW25113 Δmdh | Keio collection | Catalog # OEC4988 | |
| Strain, strain background (E. coli) | K-12 BW25113 Δpgi | Keio collection | Catalog # OEC4988 | |
| Strain, strain background (E. coli) | K-12 BW25113 ΔpfkA | Keio collection | Catalog # OEC4988 | |
| Strain, strain background (E. coli) | K-12 BW25113 ΔtpiA | Keio collection | Catalog # OEC4988 | |
| Strain, strain background (E. coli) | K-12 BW25113 ΔgpmM | Keio collection | Catalog # OEC4988 | |
| Strain, strain background (E. coli) | K-12 BW25113 ΔppsA | Keio collection | Catalog # OEC4988 | |
| Strain, strain background (E. coli) | K-12 BW25113 ΔpykF | Keio collection | Catalog # OEC4988 | |
| Strain, strain background (E. coli) | K-12 BW25113 ΔpykA | Keio collection | Catalog # OEC4988 | |
| Strain, strain background (E. coli) | K-12 BW25113 ΔmaeB | Keio collection | Catalog # OEC4988 | |
| Strain, strain background (E. coli) | K-12 BW25113 Δpck | Keio collection | Catalog # OEC4988 | |
| Strain, strain background (E. coli) | K-12 BW25113 ΔrpiB | Keio collection | Catalog # OEC4988 | |
| Strain, strain background (E. coli) | K-12 BW25113 Δrpe | Keio collection | Catalog # OEC4988 | |
| Strain, strain background (E. coli) | K-12 BW25113 ΔtktB | Keio collection | Catalog # OEC4988 | |
| Strain, strain background (E. coli) | K-12 BW25113 ΔtalA | Keio collection | Catalog # OEC4988 | |
| Strain, strain background (E. coli) | K-12 BW25113 Δzwf | Keio collection | Catalog # OEC4988 | |
| Strain, strain background (E. coli) | K-12 BW25113 Δgnd | Keio collection | Catalog # OEC4988 | |
| Strain, strain background (E. coli) | K-12 BW25113 Δppc | Keio collection | Catalog # OEC4988 | |
| Strain, strain background (E. coli) | K-12 BW25113 ΔfrdA | Keio collection | Catalog # OEC4988 | |
| Strain, strain background (E. coli) | K-12 BW25113 ΔfrdB | Keio collection | Catalog # OEC4988 | |
| Strain, strain background (E. coli) | K-12 BW25113 ΔfrdC | Keio collection | Catalog # OEC4988 | |
| Strain, strain background (E. coli) | K-12 BW25113 ΔfrdD | Keio collection | Catalog # OEC4988 | |
| Strain, strain background (E. coli) | K-12 BW25113 ΔadhE | Keio collection | Catalog # OEC4988 | |
| Strain, strain background (E. coli) | K-12 BW25113 ΔpflB | Keio collection | Catalog # OEC4988 | |
| Strain, strain background (E. coli) | K-12 BW25113 ΔaceB | Keio collection | Catalog # OEC4988 | |
| Strain, strain background (E. coli) | K-12 BW25113 ΔaceA | Keio collection | Catalog # OEC4988 | |
| Strain, strain background (E. coli) | K-12 BW25113 ΔglcB | Keio collection | Catalog # OEC4988 | |
| Strain, strain background (E. coli) | K-12 BW25113 ΔnuoA | Keio collection | Catalog # OEC4988 | |
| Strain, strain background (E. coli) | K-12 BW25113 ΔnuoH | Keio collection | Catalog # OEC4988 | |
| Strain, strain background (E. coli) | K-12 BW25113 ΔnuoJ | Keio collection | Catalog # OEC4988 | |
| Strain, strain background (E. coli) | K-12 BW25113 ΔnuoK | Keio collection | Catalog # OEC4988 | |
| Strain, strain background (E. coli) | K-12 BW25113 ΔnuoL | Keio collection | Catalog # OEC4988 | |
| Strain, strain background (E. coli) | K-12 BW25113 ΔnuoM | Keio collection | Catalog # OEC4988 | |
| Strain, strain background (E. coli) | K-12 BW25113 ΔnuoN | Keio collection | Catalog # OEC4988 | |
| Strain, strain background (E. coli) | K-12 BW25113 ΔnuoB | Keio collection | Catalog # OEC4988 | |
| Strain, strain background (E. coli) | K-12 BW25113 ΔnuoE | Keio collection | Catalog # OEC4988 | |
| Strain, strain background (E. coli) | K-12 BW25113 ΔnuoF | Keio collection | Catalog # OEC4988 | |
| Strain, strain background (E. coli) | K-12 BW25113 ΔnuoG | Keio collection | Catalog # OEC4988 | |
| Strain, strain background (E. coli) | K-12 BW25113 ΔnuoI | Keio collection | Catalog # OEC4988 | |
| Strain, strain background (E. coli) | K-12 BW25113 ΔappC | Keio collection | Catalog # OEC4988 | |
| Strain, strain background (E. coli) | K-12 BW25113 ΔappB | Keio collection | Catalog # OEC4988 | |
| Strain, strain background (E. coli) | K-12 BW25113 ΔgltA | Keio collection | Catalog # OEC4988 | |
| Strain, strain background (E. coli) | K-12 BW25113 Δlpd | Keio collection | Catalog # OEC4988 | |
| Strain, strain background (E. coli) | K-12 BW25113 Δfbp | Keio collection | Catalog # OEC4988 | |
| Strain, strain background (E. coli) | K-12 BW25113 ΔaceE | Keio collection | Catalog # OEC4988 | |
| Strain, strain background (E. coli) | K-12 BW25113 ΔtktA | Keio collection | Catalog # OEC4988 | |
| Strain, strain background (E. coli) | K-12 BW25113 Δpta | Keio collection | Catalog # OEC4988 | |
| Strain, strain background (E. coli) | K-12 BW25113 ΔackA | Keio collection | Catalog # OEC4988 | |
| Strain, strain background (E. coli) | K-12 BW25113 ΔldhA | Keio collection | Catalog # OEC4988 | |
| Strain, strain background (E. coli) | K-12 BW25113 Δdld | Keio collection | Catalog # OEC4988 | |
| Strain, strain background (E. coli) | K-12 BW25113 ΔcydB | Keio collection | Catalog # OEC4988 | |
| Strain, strain background (E. coli) | K-12 BW25113 ΔpoxB | Keio collection | Catalog # OEC4988 | |
| Strain, strain background (E. coli) | K-12 BW25113 ΔglpX | Keio collection | Catalog # OEC4988 | |
| Strain, strain background (E. coli) | K-12 BW25113 ΔybhA | Keio collection | Catalog # OEC4988 | |
| Strain, strain background (E. coli) | K-12 BW25113 ΔcydX | Keio collection | Catalog # OEC4988 | |
| Strain, strain background (E. coli) | K-12 BW25113 ΔfumE | Keio collection | Catalog # OEC4988 | |
| Strain, strain background (E. coli) | K-12 BW25113 ΔyggF | Keio collection | Catalog # OEC4988 | |
| Strain, strain background (E. coli) | K-12 BW25113 Δccp | Keio collection | Catalog # OEC4988 | |
| Strain, strain background (E. coli) | K-12 BW25113 ΔyieF | Keio collection | Catalog # OEC4988 | |
| Strain, strain background (E. coli) | K-12 BW25113 ΔwrbA | Keio collection | Catalog # OEC4988 | |
| Strain, strain background (E. coli) | K-12 BW25113 ΔatpC | Keio collection | Catalog # OEC4988 | |
| Strain, strain background (E. coli) | K-12 BW25113 ΔatpD | Keio collection | Catalog # OEC4988 | |
| Strain, strain background (E. coli) | K-12 BW25113 ΔfdhF | Keio collection | Catalog # OEC4988 | |
| Strain, strain background (E. coli) | K-12 BW25113 ΔnrfD | Keio collection | Catalog # OEC4988 | |
| Strain, strain background (E. coli) | K-12 BW25113 ΔnrfC | Keio collection | Catalog # OEC4988 | |
| Strain, strain background (E. coli) | K-12 BW25113 ΔnrfA | Keio collection | Catalog # OEC4988 | |
| Strain, strain background (E. coli) | K-12 BW25113 ΔputA | Keio collection | Catalog # OEC4988 | |
| Strain, strain background (E. coli) | K-12 BW25113 ΔdmsC | Keio collection | Catalog # OEC4988 | |
| Strain, strain background (E. coli) | K-12 BW25113 ΔtorC | Keio collection | Catalog # OEC4988 | |
| Strain, strain background (E. coli) | K-12 BW25113 ΔtorA | Keio collection | Catalog # OEC4988 | |
| Strain, strain background (E. coli) | K-12 BW25113 ΔhyaA | Keio collection | Catalog # OEC4988 | |
| Strain, strain background (E. coli) | K-12 BW25113 ΔhyaB | Keio collection | Catalog # OEC4988 | |
| Strain, strain background (E. coli) | K-12 BW25113 ΔhyaC | Keio collection | Catalog # OEC4988 | |
| Strain, strain background (E. coli) | K-12 BW25113 ΔkefF | Keio collection | Catalog # OEC4988 | |
| Strain, strain background (E. coli) | K-12 BW25113 ΔnarV | Keio collection | Catalog # OEC4988 | |
| Strain, strain background (E. coli) | K-12 BW25113 ΔnarI | Keio collection | Catalog # OEC4988 | |
| Strain, strain background (E. coli) | K-12 BW25113 ΔkduI | Keio collection | Catalog # OEC4988 | |
| Strain, strain background (E. coli) | K-12 BW25113 ΔeutE | Keio collection | Catalog # OEC4988 | |
| Strain, strain background (E. coli) | K-12 BW25113 ΔhycE | Keio collection | Catalog # OEC4988 | |
| Strain, strain background (E. coli) | K-12 BW25113 ΔhycG | Keio collection | Catalog # OEC4988 | |
| Strain, strain background (E. coli) | K-12 BW25113 Δedd | Keio collection | Catalog # OEC4988 | |
| Strain, strain background (E. coli) | K-12 BW25113 Δeda | Keio collection | Catalog # OEC4988 | |
| Strain, strain background (E. coli) | K-12 BW25113 ΔfdnG | Keio collection | Catalog # OEC4988 | |
| Strain, strain background (E. coli) | K-12 BW25113 ΔfdnI | Keio collection | Catalog # OEC4988 | |
| Strain, strain background (E. coli) | K-12 BW25113 ΔglpD | Keio collection | Catalog # OEC4988 | |
| Strain, strain background (E. coli) | K-12 BW25113 ΔglpA | Keio collection | Catalog # OEC4988 | |
| Strain, strain background (E. coli) | K-12 BW25113 ΔglpB | Keio collection | Catalog # OEC4988 | |
| Strain, strain background (E. coli) | K-12 BW25113 ΔglpC | Keio collection | Catalog # OEC4988 | |
| Strain, strain background (E. coli) | K-12 BW25113 ΔhybO | Keio collection | Catalog # OEC4988 | |
| Strain, strain background (E. coli) | K-12 BW25113 ΔhybC | Keio collection | Catalog # OEC4988 | |
| Strain, strain background (E. coli) | K-12 BW25113 ΔnarY | Keio collection | Catalog # OEC4988 | |
| Strain, strain background (E. coli) | K-12 BW25113 ΔnarZ | Keio collection | Catalog # OEC4988 | |
| Strain, strain background (E. coli) | K-12 BW25113 ΔnapG | Keio collection | Catalog # OEC4988 | |
| Strain, strain background (E. coli) | K-12 BW25113 ΔnapH | Keio collection | Catalog # OEC4988 | |
| Strain, strain background (E. coli) | K-12 BW25113 ΔnapA | Keio collection | Catalog # OEC4988 | |
| Strain, strain background (E. coli) | K-12 BW25113 ΔatpA | Keio collection | Catalog # OEC4988 | |
| Strain, strain background (E. coli) | K-12 BW25113 ΔpurT | Keio collection | Catalog # OEC4988 | |
| Strain, strain background (E. coli) | K-12 BW25113 ΔfdoG | Keio collection | Catalog # OEC4988 | |
| Strain, strain background (E. coli) | K-12 BW25113 ΔfdoI | Keio collection | Catalog # OEC4988 | |
| Strain, strain background (E. coli) | K-12 BW25113 ΔatpB | Keio collection | Catalog # OEC4988 | |
| Strain, strain background (E. coli) | K-12 BW25113 ΔatpE | Keio collection | Catalog # OEC4988 | |
| Strain, strain background (E. coli) | K-12 BW25113 ΔatpF | Keio collection | Catalog # OEC4988 | |
| Strain, strain background (E. coli) | K-12 BW25113 ΔatpH | Keio collection | Catalog # OEC4988 | |
| Strain, strain background (E. coli) | K-12 BW25113 ΔphoA | Keio collection | Catalog # OEC4988 | |
| Strain, strain background (E. coli) | K-12 BW25113 ΔadhP | Keio collection | Catalog # OEC4988 | |
| Strain, strain background (E. coli) | K-12 BW25113 ΔeutD | Keio collection | Catalog # OEC4988 | |
| Strain, strain background (E. coli) | K-12 BW25113 ΔdmsA | Keio collection | Catalog # OEC4988 | |
| Strain, strain background (E. coli) | K-12 BW25113 ΔhybB | Keio collection | Catalog # OEC4988 | |
| Strain, strain background (E. coli) | K-12 BW25113 ΔnapB | Keio collection | Catalog # OEC4988 | |
| Strain, strain background (E. coli) | K-12 BW25113 ΔatpI | Keio collection | Catalog # OEC4988 | |
| Strain, strain background (E. coli) | K-12 BW25113 ΔmaeA | Keio collection | Catalog # OEC4988 | |
| Strain, strain background (E. coli) | K-12 BW25113 ΔpfkB | Keio collection | Catalog # OEC4988 | |
| Strain, strain background (E. coli) | K-12 BW25113 ΔfbaB | Keio collection | Catalog # OEC4988 | |
| Strain, strain background (E. coli) | K-12 BW25113 ΔrpiA | Keio collection | Catalog # OEC4988 | |
| Strain, strain background (E. coli) | K-12 BW25113 ΔfumD | Keio collection | Catalog # OEC4988 | |
| Strain, strain background (E. coli) | K-12 BW25113 ΔsucD | Keio collection | Catalog # OEC4988 | |
| Strain, strain background (E. coli) | K-12 BW25113 ΔfdnH | Keio collection | Catalog # OEC4988 | |
| Strain, strain background (E. coli) | K-12 BW25113 ΔdmsB | Keio collection | Catalog # OEC4988 | |
| Strain, strain background (E. coli) | K-12 BW25113 Δndh | Keio collection | Catalog # OEC4988 | |
| Strain, strain background (E. coli) | K-12 BW25113 ΔnarG | Keio collection | Catalog # OEC4988 | |
| Strain, strain background (E. coli) | K-12 BW25113 ΔnarH | Keio collection | Catalog # OEC4988 | |
| Strain, strain background (E. coli) | K-12 BW25113 ΔtdcE | Keio collection | Catalog # OEC4988 | |
| Strain, strain background (E. coli) | K-12 BW25113 ΔhycB | Keio collection | Catalog # OEC4988 | |
| Strain, strain background (E. coli) | K-12 BW25113 ΔhycC | Keio collection | Catalog # OEC4988 | |
| Strain, strain background (E. coli) | K-12 BW25113 ΔhycD | Keio collection | Catalog # OEC4988 | |
| Strain, strain background (E. coli) | K-12 BW25113 ΔfdoH | Keio collection | Catalog # OEC4988 | |
| Strain, strain background (E. coli) | K-12 BW25113 ΔhybA | Keio collection | Catalog # OEC4988 | |
| Strain, strain background (E. coli) | K-12 BW25113 ΔnuoC | Keio collection | Catalog # OEC4988 | |
| Strain, strain background (E. coli) | K-12 BW25113 ΔatpG | Keio collection | Catalog # OEC4988 | |
| Recombinant DNA reagent | pMSs201 (kanR) | Dharmacon Promoter Library | Catalog # OEC4988 | |
| Recombinant DNA reagent | pUA66-EV (empty vector) | Gift from Dr. Mark P. Brynildsen | A DNA fragment including T5 promoter, KanR gene, pUA66 origin of replication and lacIq was amplified from the pUA66-gfp plasmid with primers having BspHI cut sites. The amplified DNA fragment was digested with BspHI, and then self-ligated to obtain the modified pUA66-EV that does not have the gfp gene. | |
| Recombinant DNA reagent | pUA66-crp | This study | The crp gene with its promoter was amplified from the genomic DNA of E. coli, using forward and reverse primers with BglII and ScaI restriction enzyme cut sites, respectively. The pUA66-gfp plasmid was double digested with BglII and ScaI to remove T5 promoter region and gfp gene. Then, the digested crp gene with its promoter and plasmid were ligated to generate pUA66-crp. | |
| Strain, strain background (E. coli) | K-12 MG1655 pMSs201 PsdhABCD-gfp | This study | ||
| Strain, strain background (E. coli) | K-12 MG1655 Δcrp pMSs201 PsdhABCD-gfp | This study | ||
| Strain, strain background (E. coli) | K-12 MG1655 ΔcyaA pMSs201 PsdhABCD-gfp | This study | ||
| Strain, strain background (E. coli) | K-12 MG1655 pMSs201 PcyaA-gfp | This study | ||
| Strain, strain background (E. coli) | K-12 MG1655 Δcrp pMSs201 PcyaA-gfp | This study | ||
| Strain, strain background (E. coli) | K-12 MG1655 ΔcyaA pMSs201 PcyaA-gfp | This study | ||
| Strain, strain background (E. coli) | K-12 MG1655 Δcrp pUA66-EV | This study | ||
| Strain, strain background (E. coli) | K-12 MG1655 Δcrp pUA66-crp | This study | ||
| Software, algorithm | Prism (version 10.3.0) | GraphPad | RRID:SCR_002798 | http://www.graphpad.com/ |
| Software, algorithm | FlowJo (version 10.8.1) | Becton, Dickinson & Company | RRID:SCR_008520 | https://www.flowjo.com/ |
| Software, algorithm | MATLAB (version R2020b) | MathWorks | RRID:SCR_001622 | https://www.mathworks.com/ |
| Sequence-based reagent | Forward Primer (5’ to 3’) Δcrp::KAN(R) | This study | Integrated DNA Technologies, Inc. | TCTGGCTCTGGAGAAAGCTTATAACAGAGGATAACCGCGCGTGTAGGCTGGAGCTGCTTC |
| Sequence-based reagent | Reverse Primer (5’ to 3’) Δcrp::KAN(R) | This study | Integrated DNA Technologies, Inc. | AAAATGGCGCGCTACCAGGTAACGCGCCACTCCGACGGGATTAACGGCTGACATGGGAAT |
| Sequence-based reagent | Forward Primer (5’ to 3’) ΔcyaA::KAN(R) | This study | Integrated DNA Technologies, Inc. | GAATCACAGTCATGACGGGTAGCAAATCAGGCGATACGTCGTGTAGGCTGGAGCTGCTTC |
| Sequence-based reagent | Reverse Primer (5’ to 3’) ΔcyaA::KAN(R) | This study | Integrated DNA Technologies, Inc. | AGATTGCATGCCGGATAAGCCTCGCTTTCCGGCACGTTCATTAACGGCTGACATGGGAAT |
| Sequence-based reagent | Forward Primer (5’ to 3’) ΔsucA::KAN(R) | This study | Integrated DNA Technologies, Inc. | ACGGCGAAGTAAGCATAAAAAAGATGCTTAAGGGATCACGGTGTAGGCTGGAGCTGCTTC |
| Sequence-based reagent | Reverse Primer (5’ to 3’) ΔsucA::KAN(R) | This study | Integrated DNA Technologies, Inc. | GGTCAGGGACCAGAATATCTACGCTACTCATTGTGTAT CCTTTATTTAACGGCTGACATGGGAAT |
| Sequence-based reagent | Forward Primer (5’ to 3’) Δlpd::KAN(R) | This study | Integrated DNA Technologies, Inc. | GACGGGTATGACCGCC GGAGATAAATATATAGAGGTCATGGTGTAGGCTGGAGCTGCTTC |
| Sequence-based reagent | Reverse Primer (5’ to 3’) Δlpd::KAN(R) | This study | Integrated DNA Technologies, Inc. | GCCGCTTTTTTAATTGCCGGATGTTCCGGCAAACGAAAAATTAACGGCTGACATGGGAAT |
| Sequence-based reagent | Forward Primer (5’ to 3’) ΔsucC::KAN(R) | This study | Integrated DNA Technologies, Inc. | GGTTTAAAAGATAACGATTACTGAAGGATGGACAGAACACGTGTAGGCTGGAGCTGCTTC |
| Sequence-based reagent | Reverse Primer (5’ to 3’) ΔsucC::KAN(R) | This study | Integrated DNA Technologies, Inc. | TGGCAGATAACCTTGGTG TTTTTATCGATTAAAATGGACATTAACGGCTGACATGGGAAT |
| Sequence-based reagent | Forward Primer (5’ to 3’) ΔsdhA::KAN(R) | This study | Integrated DNA Technologies, Inc. | TTTACGTGATTTATG GATTCGTTGTGGTGT GGGGTGTGTGGTGTA GGCTGGAGCTGCTTC |
| Sequence-based reagent | Reverse Primer (5’ to 3’) ΔsdhA::KAN(R) | This study | Integrated DNA Technologies, Inc. | GATAAATTGAAAACT CGAGTCTCATTTTCC TGTCTCCGCATTAAC GGCTGACATGGGAAT |
| Sequence-based reagent | Forward Primer (5’ to 3’) ΔgltA::KAN(R) | This study | Integrated DNA Technologies, Inc. | TAAGTTCCGGCAGTCTTACGCAATAAGGCGCTAAG GAGACCTTAAGTGTAGGCTGGAGCTGCTTC |
| Sequence-based reagent | Reverse Primer (5’ to 3’) ΔgltA::KAN(R) | This study | Integrated DNA Technologies, Inc. | CCCGCCATATGAACGGCGGGTTAAAATATTTACAACTTAGCAATCAACCATTAACGGCTGACATGGGAAT |
| Sequence-based reagent | Forward Primer (5’ to 3’) ΔaceE::KAN(R) | This study | Integrated DNA Technologies, Inc. | GGTTCCAGAAAACTCAACGTTATTAGATAGATAAGGAATAACCCGTGTAGGCTGGAGCTGCTTC |
| Sequence-based reagent | Reverse Primer (5’ to 3’) ΔaceE::KAN(R) | This study | Integrated DNA Technologies, Inc. | GCCCCGATGTCCGGTACTTTGATTTCGATAGCCATTATTCTTTTACCTCTTAACGGCTGACATGGGAAT |
| Sequence-based reagent | Forward Primer (5’ to 3’) Δmdh::KAN(R) | This study | Integrated DNA Technologies, Inc. | GCGGAGCAACATATCTTAGTTTATCAATATAATAAGGAGTTTAGGGTGTAGGCTGGAGCTGCTTC |
| Sequence-based reagent | Reverse Primer (5’ to 3’) Δmdh::KAN(R) | This study | Integrated DNA Technologies, Inc. | CCGGAGTCTGTGCTCCGGTTTTTTATTATCCGCTAATCAATTAACGGCTGACATGGGAAT |
| Sequence-based reagent | Forward Primer (5’ to 3’) ΔnuoI::KAN(R) | This study | Integrated DNA Technologies, Inc. | CTGTCATTCTCTGGCAGGCGCAATAAGGGGCAATAAGACCGTGTAGGCTGGAGCTGCTTC |
| Sequence-based reagent | Reverse Primer (5’ to 3’) ΔnuoI::KAN(R) | This study | Integrated DNA Technologies, Inc. | AGGCCACAGATATAAAAAGC GAACTCCATTGCCCCTCTCCTT AACGGCTGACATGGGAAT |
| Sequence-based reagent | Forward Primer (5’ to 3’) ΔnuoM::KAN(R) | This study | Integrated DNA Technologies, Inc. | TCCGGTCCTGACGGGACTTTTACAAGGAATAAAGATCGCCGTGTAGGCTGGAGCTGCTTC |
| Sequence-based reagent | Reverse Primer (5’ to 3’) ΔnuoM::KAN(R) | This study | Integrated DNA Technologies, Inc. | GCAGTGCGATCAGGTTTTGTGGAGTTATTGTCATGGCGATTTAACGGCTGACATGGGAAT |
| Sequence-based reagent | Forward Primer (5’ to 3’) ΔatpA::KAN(R) | This study | Integrated DNA Technologies, Inc. | GCGCCTTGCAGACGTCTTGCAGTCTTAAGGGGACTGGAGCGTGTAGGCTGGAGCTGCTTC |
| Sequence-based reagent | Reverse Primer (5’ to 3’) ΔatpA::KAN(R) | This study | Integrated DNA Technologies, Inc. | TCAATGCCTTGCGGCCTGCCCTAAGGCAAGCCGCCAGACGTTAACGGCTGACATGGGAAT |
| Sequence-based reagent | Forward Primer (5’ to 3’) ΔatpB::KAN(R) | This study | Integrated DNA Technologies, Inc. | TGGCACCGGCTGTAATTAA CAACAAAGGGTAAAAGGCATCGTGTAGGCTGGAGCTGCTTC |
| Sequence-based reagent | Reverse Primer (5’ to 3’) ΔatpB::KAN(R) | This study | Integrated DNA Technologies, Inc. | CTCCAGTTTGTTTCAGTTAAAACGTAGTAGTGTTGGTAAATTAACGGCTGACATGGGAAT |
| Sequence-based reagent | Forward Primer (5’ to 3’) ΔatpC::KAN(R) | This study | Integrated DNA Technologies, Inc. | GGAAAAAGCCAAAAAACTTTAACGCCTTAATCGGAGGGTGATGTGTAGGCTGGAGCTGCTTC |
| Sequence-based reagent | Reverse Primer (5’ to 3’) ΔatpC::KAN(R) | This study | Integrated DNA Technologies, Inc. | GCCTGTTTCCAGACTGGCTTTTGTGCTTTTCAAGCCGGTGTTAACGGCTGACATGGGAAT |
| Sequence-based reagent | Forward Primer (5’ to 3’) ΔatpD::KAN(R) | This study | Integrated DNA Technologies, Inc. | CCGCCGCGGTTTAAACAGGTT ATTTCGTAGAGGATTTAAGGTGTA GGCTGGAGCTGCTTC |
| Sequence-based reagent | Reverse Primer (5’ to 3’) ΔatpD::KAN(R) | This study | Integrated DNA Technologies, Inc. | AGGTGGTAAGTCATTGCCATAT CACCCTCCGATTAAGGCGTTAAC GGCTGACATGGGAAT |
| Sequence-based reagent | Forward Primer (5’ to 3’) ΔfrdC::KAN(R) | This study | Integrated DNA Technologies, Inc. | TTTCTTATCGCGACCCTGAAACCACGCTAAGGAGTGCAACGTG TAGGCTGGAGCTGCTTC |
| Sequence-based reagent | Reverse Primer (5’ to 3’) ΔfrdC::KAN(R) | This study | Integrated DNA Technologies, Inc. | GTCAGAACGCTTTGGATTTGG ATTAATCATCTCAGGCTCCTTAAC GGCTGACATGGGAAT |
| Sequence-based reagent | Forward Primer (5’ to 3’) Δpgi::KAN(R) | This study | Integrated DNA Technologies, Inc. | GCTACAATCTTCCAAAGTCACA ATTCTCAAAATCAGAAGAGTATTGC TAGTGTAGGCTGGAGCTGCTTC |
| Sequence-based reagent | Reverse Primer (5’ to 3’) Δpgi::KAN(R) | This study | Integrated DNA Technologies, Inc. | GCGGCGTGAACGCCTTATCC GGCCTACATATCGACGATGATTAACGGCTGACATGGGAAT |
| Sequence-based reagent | Forward Primer (5’ to 3’) Δzwf::KAN(R) | This study | Integrated DNA Technologies, Inc. | CTGGCTTAAGTACCGGGTTAG TTAACTTAAGGAGAATGACGTGTA GGCTGGAGCTGCTTC |
| Sequence-based reagent | Reverse Primer (5’ to 3’) Δzwf::KAN(R) | This study | Integrated DNA Technologies, Inc. | GCGCAAGATCATGTTACC GGTAAAATAACCATAAAGGA TAAGCGCAGATATTAACGGC TGACATGGGAAT |
| Sequence-based reagent | Forward Primer (5’ to 3’) ΔtktB::KAN(R) | This study | Integrated DNA Technologies, Inc. | CTTCTTGCCGCCAAACT ATAAACCAGCCACGGAGTG TTATGTGTAGGCTGGAGCTG CTTC |
| Sequence-based reagent | Reverse Primer (5’ to 3’) ΔtktB::KAN(R) | This study | Integrated DNA Technologies, Inc. | GTCAGCGTCGCATCCGGCAA TCAGCATCCGGCAATCACCATTA ACGGCTGACATGGGAAT |
| Sequence-based reagent | Forward Primer (5’ to 3’) ΔtalA::KAN(R) | This study | Integrated DNA Technologies, Inc. | CGCACTCATCTAACACTTTACT TTTCAAGGAGTATTTCCTGTGTAGG CTGGAGCTGCTTC |
| Sequence-based reagent | Reverse Primer (5’ to 3’) ΔtalA::KAN(R) | This study | Integrated DNA Technologies, Inc. | GGCAAGGTCTTTTCGGGAC ATATAACACTCCGTGGCTGGT TTAACGGCTGACATGGGAAT |
| Sequence-based reagent | Forward Primer (5’ to 3’) pUA66-crp | This study | Integrated DNA Technologies, Inc. | GCGCTCAGATCTTGATC CGAAAGCTATGCTAAAACAGT |
| Sequence-based reagent | Reverse Primer (5’ to 3’) pUA66-crp | This study | Integrated DNA Technologies, Inc. | GCGCTCAGTACTttaAC GAGTGCCGTAAACGA |
Additional files
-
Supplementary file 1
MIC of antibiotics and concentrations of bactericidal antibiotics used in persister assays.
- https://cdn.elifesciences.org/articles/99735/elife-99735-supp1-v1.docx
-
Supplementary file 2
Analyzed metabolomics data.
- https://cdn.elifesciences.org/articles/99735/elife-99735-supp2-v1.docx
-
Supplementary file 3
Analyzed proteomics data.
- https://cdn.elifesciences.org/articles/99735/elife-99735-supp3-v1.docx
-
Supplementary file 4
Analyzed persister survival fraction data.
- https://cdn.elifesciences.org/articles/99735/elife-99735-supp4-v1.docx
-
Supplementary file 5
The knockout strains generated using the E. coli K-12 MG1655 background in this study.
- https://cdn.elifesciences.org/articles/99735/elife-99735-supp5-v1.docx
-
Supplementary file 6
Persister levels of E. coli K-12 MG1655 WT, Δcrp, and ΔcyaA strains in late stationary phase.
- https://cdn.elifesciences.org/articles/99735/elife-99735-supp6-v1.docx
-
Supplementary file 7
Persister levels of E. coli K-12 MG1655 (A) and BW25113 (B) WT, Δcrp, and ΔcyaA strains in the exponential growth phase.
- https://cdn.elifesciences.org/articles/99735/elife-99735-supp7-v1.docx
-
MDAR checklist
- https://cdn.elifesciences.org/articles/99735/elife-99735-mdarchecklist1-v1.docx
Download links
A two-part list of links to download the article, or parts of the article, in various formats.
Downloads (link to download the article as PDF)
Open citations (links to open the citations from this article in various online reference manager services)
Cite this article (links to download the citations from this article in formats compatible with various reference manager tools)
Unraveling CRP/cAMP-mediated metabolic regulation in Escherichia coli persister cells
eLife 13:RP99735.
https://doi.org/10.7554/eLife.99735.3


