Unanticipated mechanisms of covalent inhibitor and synthetic ligand cobinding to PPARγ
- Department of Integrative Structural and Computational Biology, Scripps Research and The Herbert Wertheim UF Scripps Institute for Biomedical Innovation & Technology, United States
- School of Basic Medical Sciences, Guangzhou Laboratory, Guangzhou Medical University, China
- Department of Biochemistry, Vanderbilt University, United States
- Center for Structural Biology, Vanderbilt University, United States
- Vanderbilt Institute of Chemical Biology, Vanderbilt University, United States
- Center for Applied AI in Protein Dynamics, Vanderbilt University, United States
Figures
Figure 1
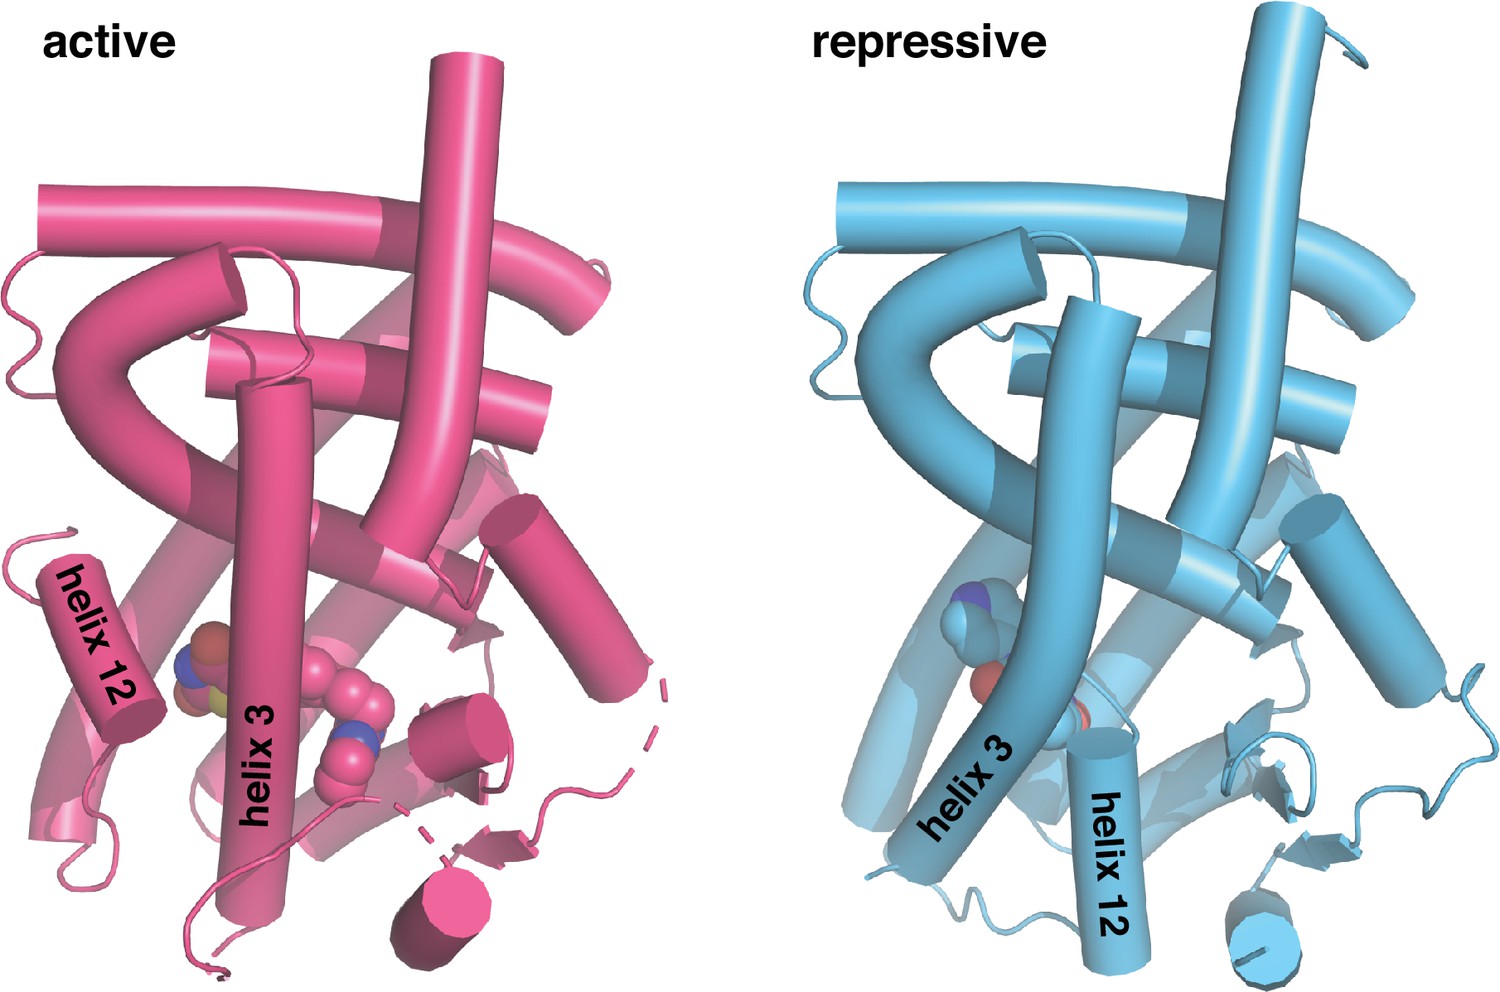
Crystal structures of PPARγ LBD in the transcriptionally active and repressive conformations.
The active LBD (PDB 6ONJ) is stabilized by agonist (rosiglitazone) and coactivator peptide (TRAP220/MED1), whereas the repressive LBD (PDB 6ONI) is stabilized by covalent inverse agonist (T0070907) and corepressor peptide (NCoR1).
Figure 2
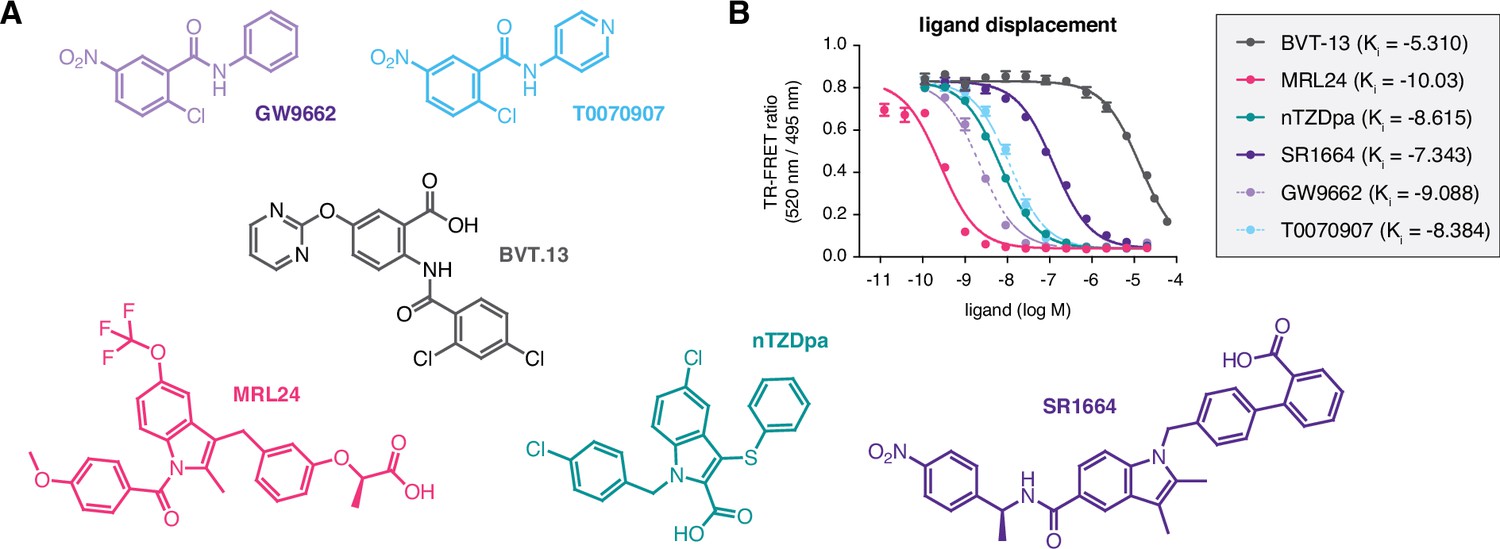
Compounds used in the study and relative affinities in a ligand displacement assay.
(A) Chemical structures of the compounds. (B) TR-FRET ligand displacement data for the compounds (n=3; mean ±s.d.).
Figure 3 with 1 supplement
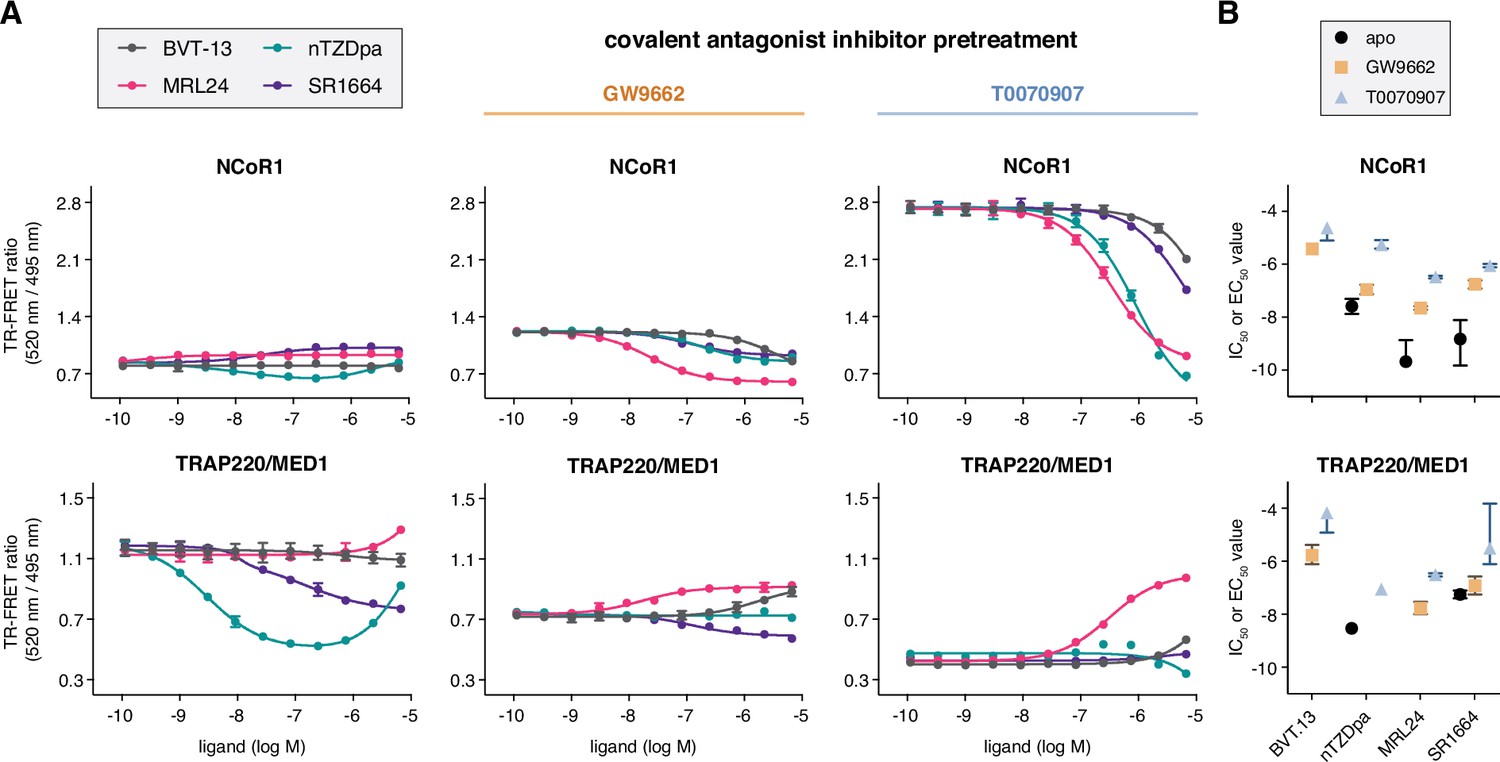
Ligand cobinding functional profiling in TR-FRET coregulator interaction assays.
(A) TR-FRET coregulator interaction assays performed using PPARγ LBD protein with or without preincubation of GW9662 or T0070907 to determine how the non-covalent synthetic ligands influence recruitment of peptides derived from NCoR1 corepressor protein and TRAP220/MED1 coactivator protein fit to a sigmoidal dose response equation or biphasic dose response equation for select cases where a biphasic response is observed (n=3; mean ± s.d.). (B) IC50 and EC50 values extracted from the TR-FRET coregulator interaction data. For curves showing a biphasic response, the higher affinity value is displayed; no value is displayed in cases where the dose response is flat. Error bars when present represent the fitted errors; some fits did not converge to a well-fitted error. See Figure 3—source data 1.
-
Figure 3—source data 1
TR-FRET coregulator interaction assay data.
- https://cdn.elifesciences.org/articles/99782/elife-99782-fig3-data1-v2.xlsx
Figure 3—figure supplement 1
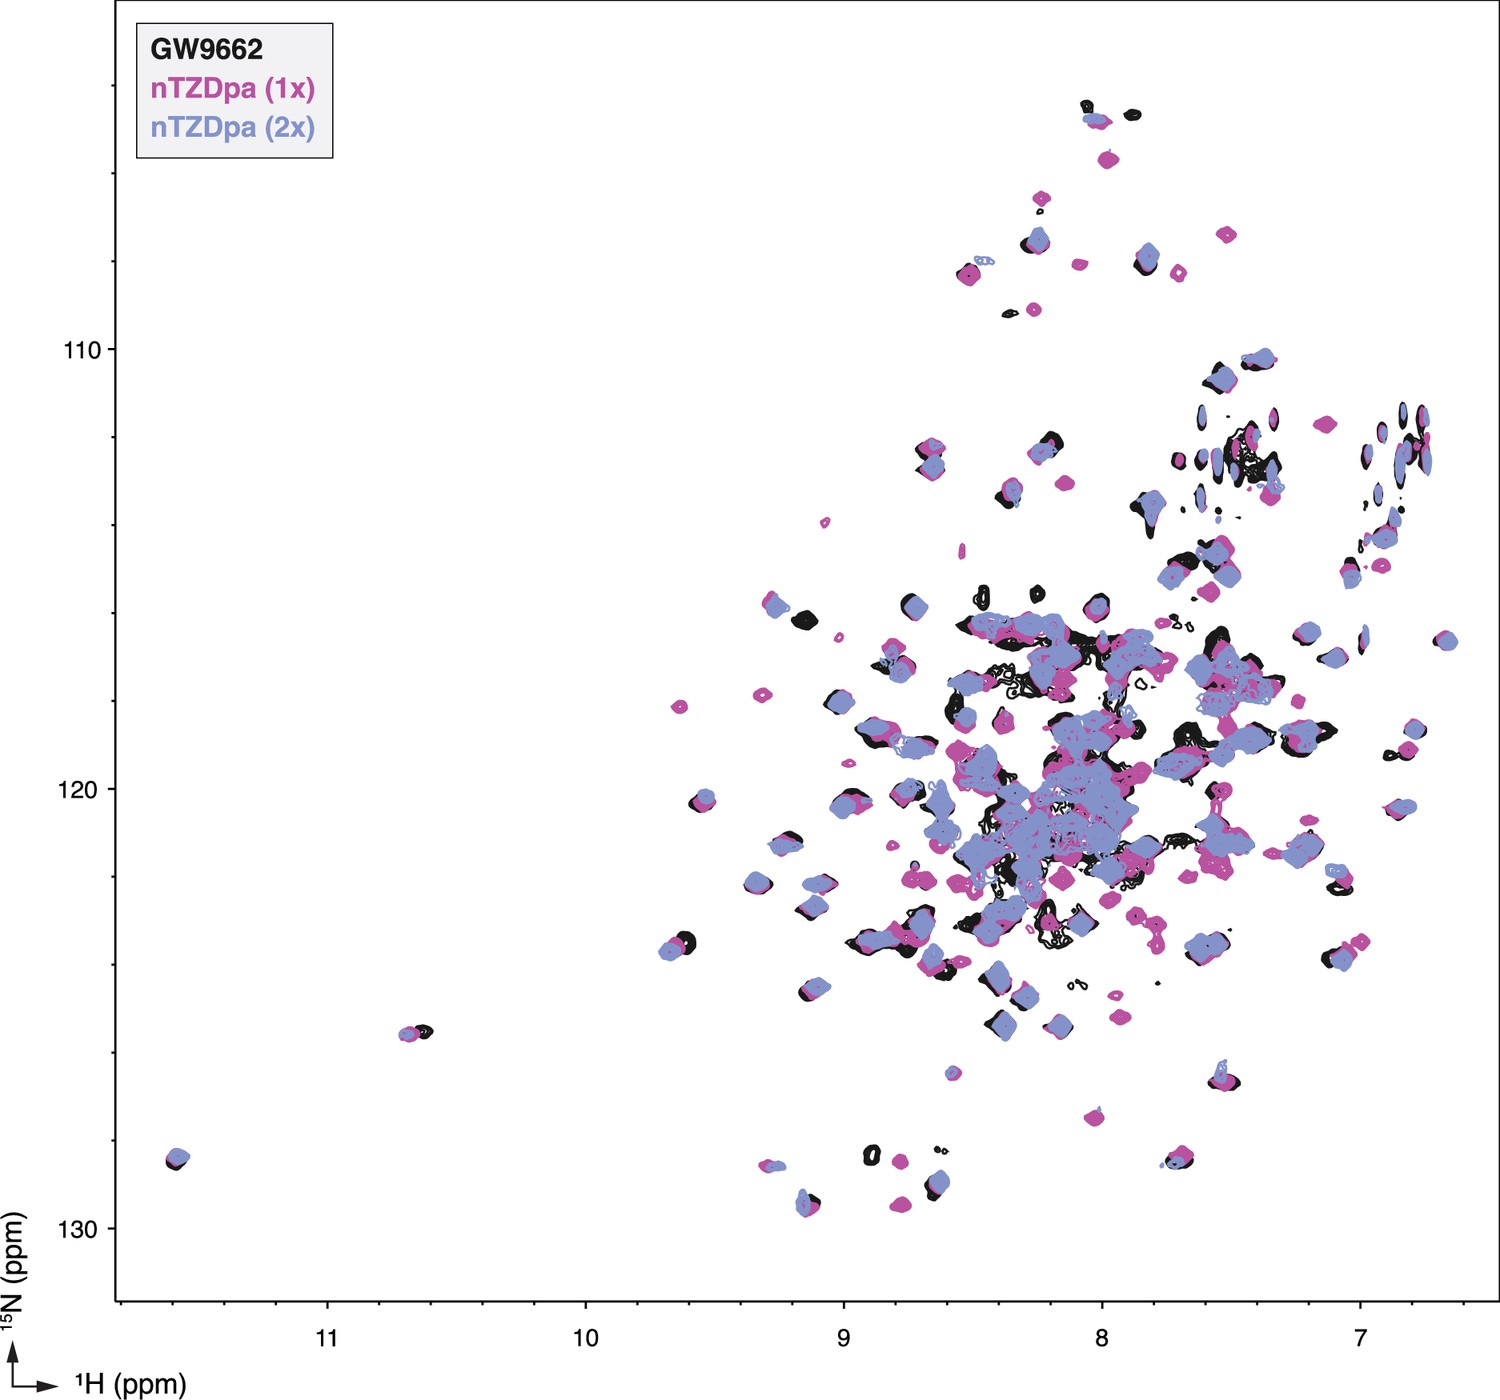
NMR analysis reveals PPARγ LBD binds more than one equivalent of nTZDpa.
2D [1H,15N]-TROSY-HSQC NMR data of 15N-labeled PPARγ LBD in the absence or presence of nTZDpa added at the indicated molar equivalents.
Figure 4 with 1 supplement
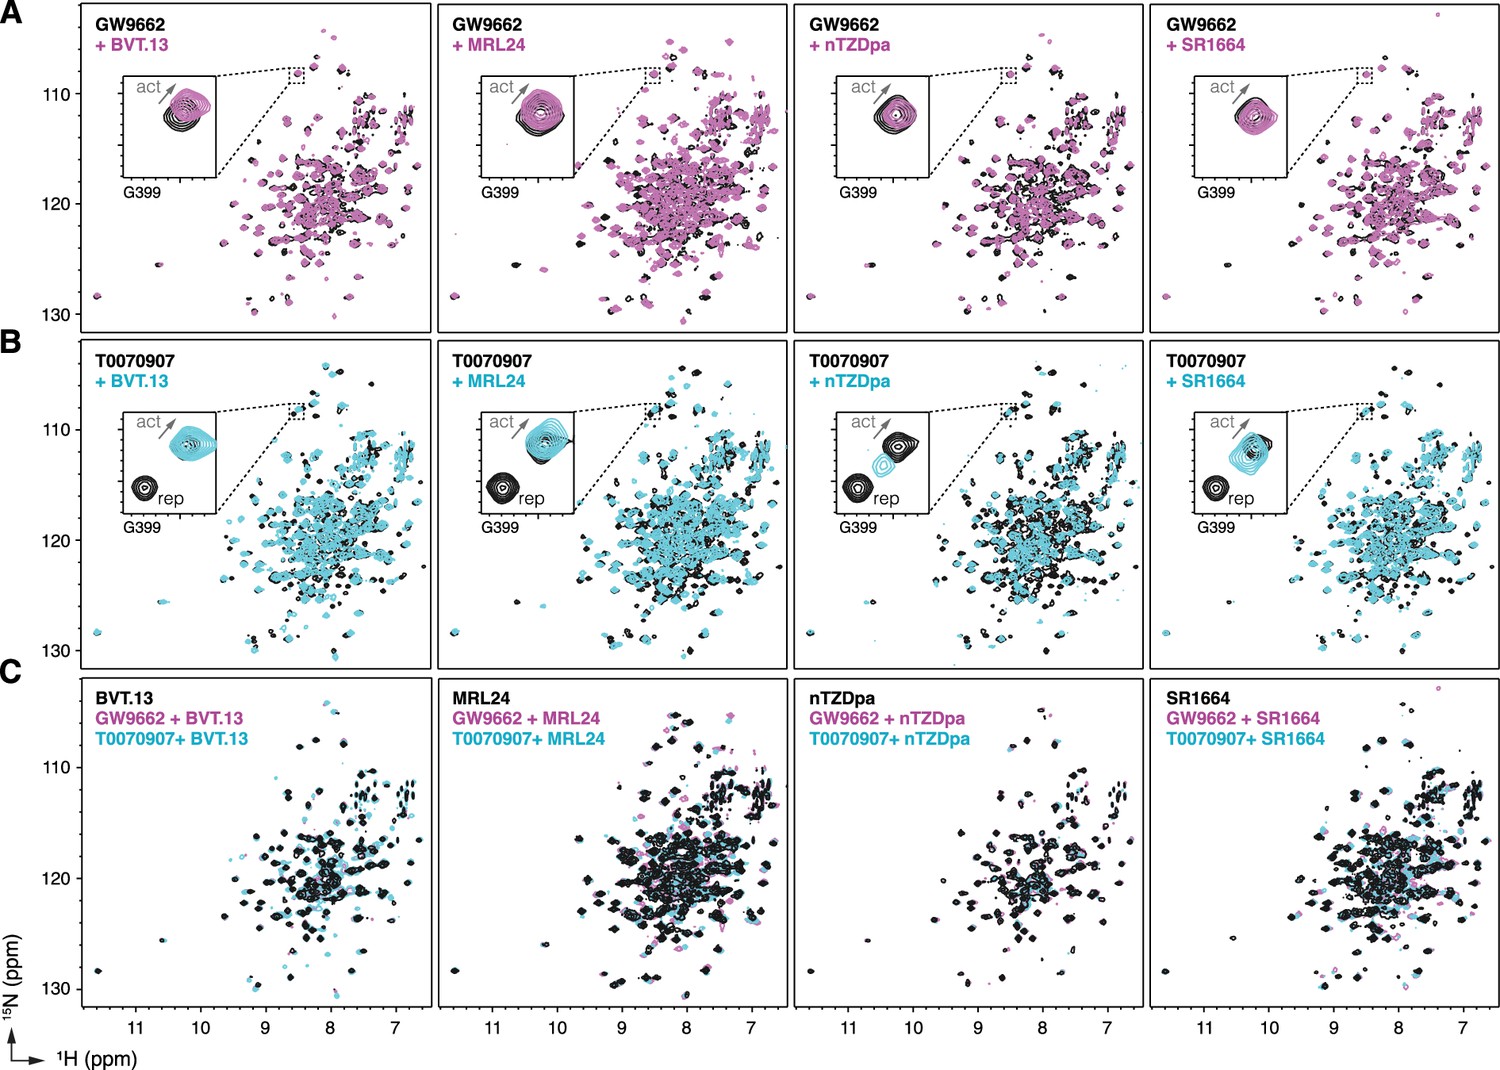
NMR implicates covalent inhibitor-induced stabilization of a repressive LBD conformation in the mechanism of weakening non-covalent synthetic ligand cobinding.
Overlays of 2D [1H,15N]-TROSY-HSQC NMR data of 15N-labeled PPARγ LBD preincubated with covalent inhibitor, (A) GW9662 or (B) T0070907, in the absence or presence of the indicated non-covalent synthetic ligands added at 2 molar equivalents. (C) Overlays of 2D [1H,15N]-TROSY-HSQC NMR data of 15N-labeled PPARγ LBD in the presence of non-covalent synthetic ligands (singly bound state) compared to the cobound states with a covalent inhibitor.
Figure 4—figure supplement 1
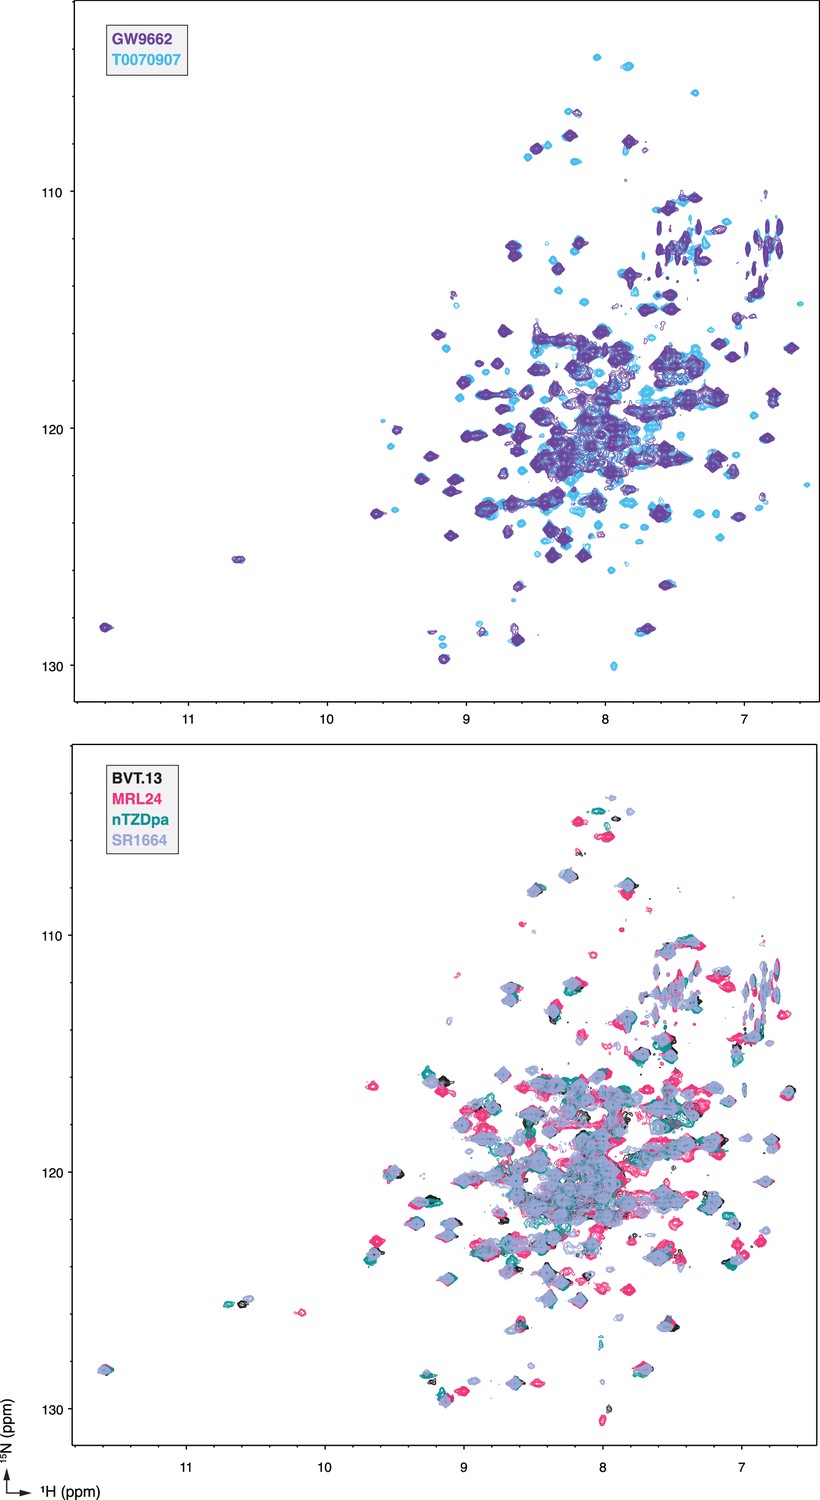
NMR spectral overlays show chemical shift perturbations (CSPs) between different single ligand-bound PPARγ LBD states.
2D [1H,15N]-TROSY-HSQC NMR data of 15N-labeled PPARγ LBD in the presence of the indicated ligands added at 2 molar equivalents.
Figure 5 with 1 supplement
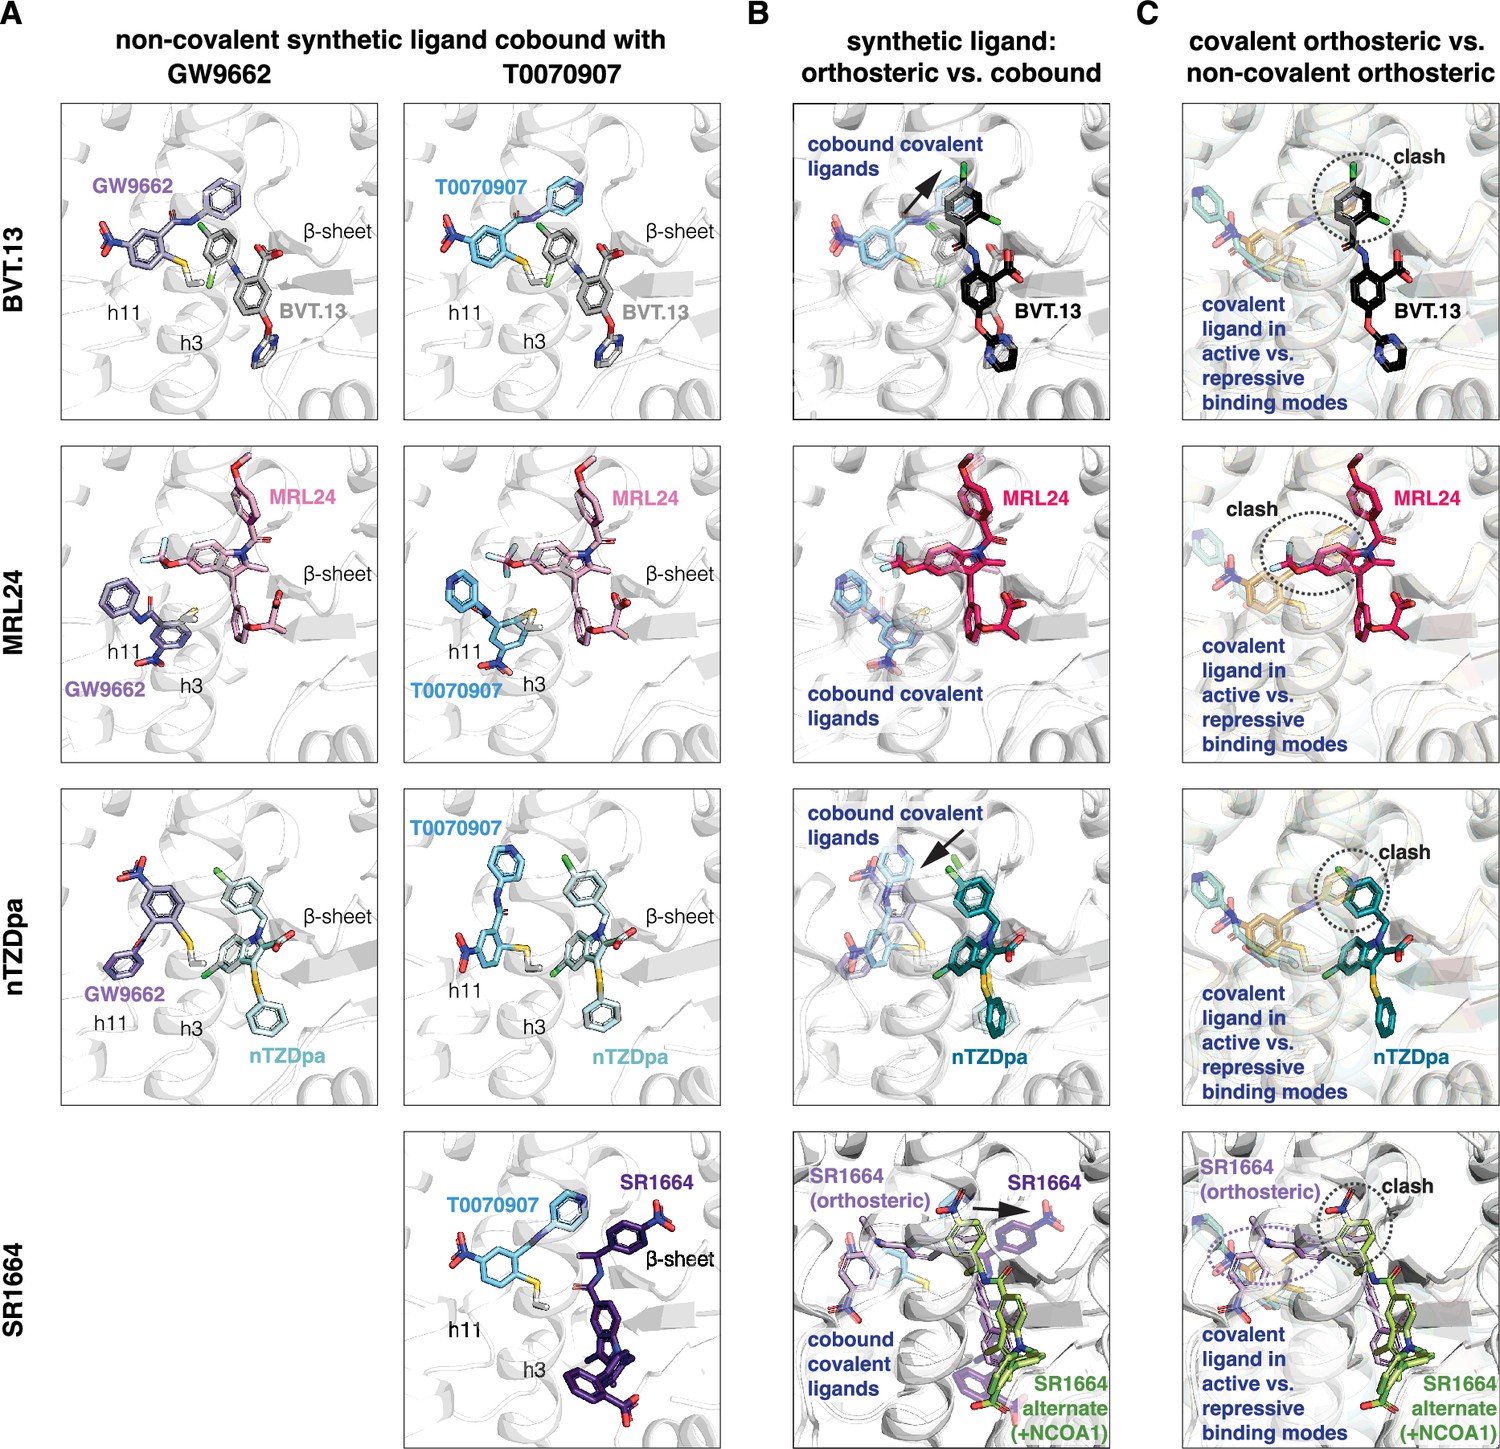
Non-covalent synthetic ligands adopt orthosteric binding modes when cobound with a covalent inhibitor.
(A) Ligand cobinding modes in crystal structures of PPARγ LBD. (B) Comparison of the non-covalent synthetic ligand orthosteric binding mode (singly bound) and ligand cobinding mode with a covalent inhibitor (transparent sticks). Differences between these binding modes are indicated with a black arrow. (C) Structural clashes observed between the covalent inhibitor orthosteric binding mode (transparent sticks) and the non-covalent synthetic ligand binding mode. PDB codes for crystal structures used in the overlays are listed in the Materials and methods section.
Figure 5—figure supplement 1
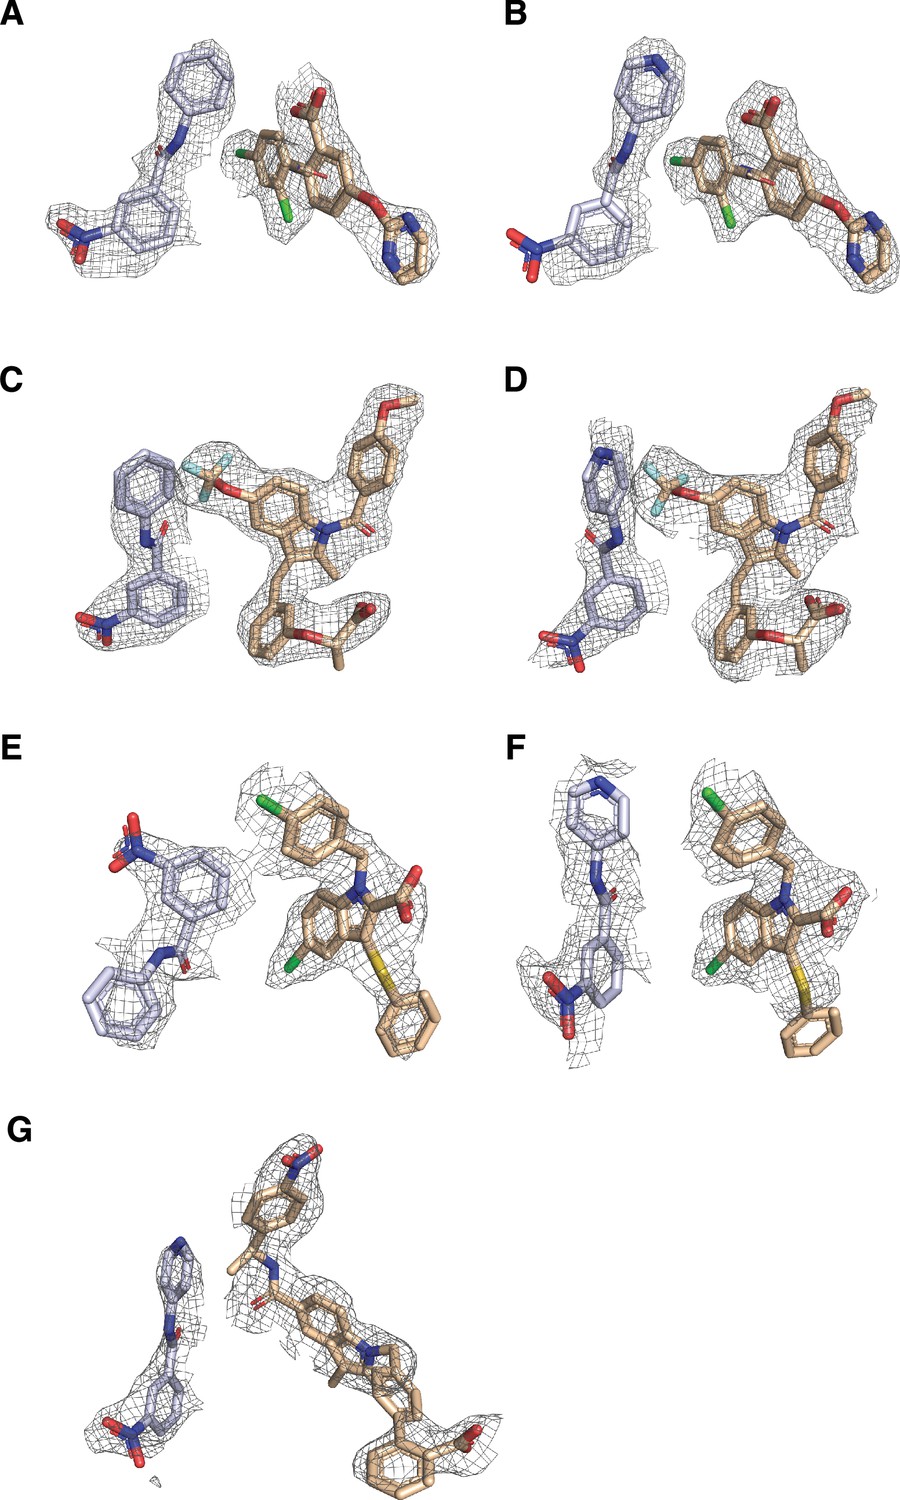
Electron density is shown from composite omit 2Fo-Fc maps (contoured at 0.8-1σ) of ligands for PPARγ LBD cobound to non-covalent ligands.
All densities are shown from chain B of the cobound structures for (A) GW9662 and BVT.13, (B) T0070907 and BVT.13, (C) GW9662 and MRL24, (D) T0070907 and MRL24, (E) GW9662 and nTZDpa, (F) T0070907 and nTZDpa, and (G) T0070907 and SR1664.
Figure 6
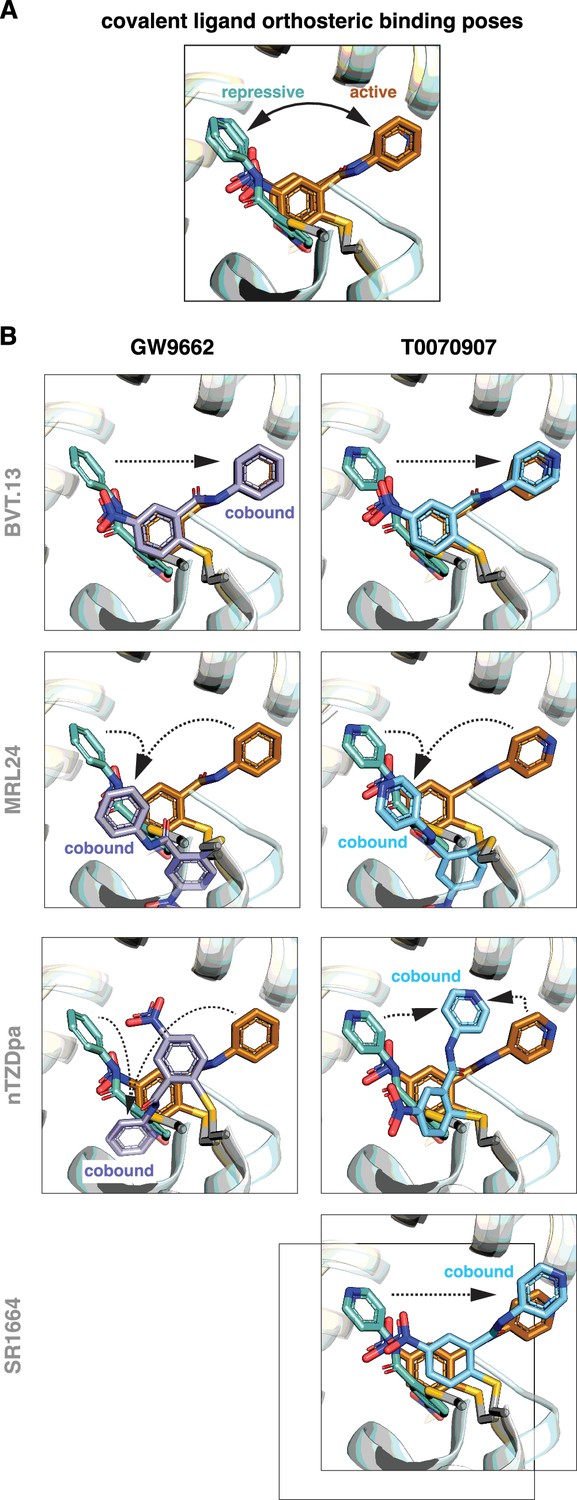
Covalent inhibitors adopt different binding modes to accommodate a cobound non-covalent synthetic ligand.
(A) Structural overlay showing the orthosteric binding modes of GW9662 and T0070907 in crystal structures of PPARγ LBD in active and repressive conformations. (B) Comparison of the covalent binding modes when singly bound (orthosteric) and cobound to a non-covalent synthetic ligand. Black arrows indicate the conformational differences between the orthosteric binding modes vs. cobinding modes. PDB codes for crystal structures used in the overlays are listed in the Materials and methods section.
Tables
Table 1
X-ray crystallography data collection and refinement statistics.
| PPARγ LBD bound to GW9662 and BVT.13 | PPARγ LBD bound to GW9662 and MRL24 | PPARγ LBD bound to GW9662 and nTZDpa | PPARγ LBD bound to T0070907 and BVT.13 | PPARγ LBD bound to T0070907 and MRL24 | PPARγ LBD bound to T0070907 and nTZDpa | PPARγ LBD bound to T0070907 and SR1664 | |
|---|---|---|---|---|---|---|---|
| Data collection* | |||||||
| Space group | C 1 2 1 | C 1 2 1 | C 1 2 1 | C 1 2 1 | C 1 2 1 | C 1 2 1 | C 1 2 1 |
| Cell dimensions | |||||||
| a, b, c (Å) | 92.19, 61.99, 118.84 | 91.84, 62.22, 119.24 | 92.75, 62.22, 119.08 | 92.64, 61.78, 119.13 | 92.42, 61.63, 119.55 | 93.02, 62.16, 119.46 | 93.88, 62.68, 121.04 |
| α, β, γ (°) | 90, 102.38, 90 | 90, 102.28, 90 | 90, 102.19, 90 | 90, 102.38, 90 | 90, 102.19, 90 | 90, 102.14, 90 | 90, 102.46, 90 |
| Resolution (Å) | 51.06–2.54 (2.63–2.54) | 49.06–2.48 (2.57–2.48) | 49.16–3.15 (3.26–3.15) | 51.02–2.49 (2.58–2.49) | 58.43–2.56 (2.65–2.56) | 58.39–2.73 (2.83–2.73) | 59.09–3.2 (3.31–3.2) |
| Rmerge | 0.088 (1.159) | 0.132 (1.791) | 0.043 (0.212) | 0.076 (1.083) | 0.087 (1.367) | 0.108 (1.621) | 0.046 (0.263) |
| I / σI | 12.06 (1.38) | 8.54 (1.04) | 15.02 (3.63) | 14.71 (1.76) | 12.80 (1.42) | 10.28 (1.21) | 10.70 (2.94) |
| Completeness (%) | 98.14 (96.97) | 98.41 (96.93) | 99.59 (100.00) | 99.14 (99.22) | 99.47 (98.55) | 98.79 (98.27) | 99.87 (100.00) |
| Redundancy | 6.6 (6.4) | 6.5 (6.5) | 2.0 (2.0) | 6.6 (6.6) | 6.6 (6.4) | 6.6 (6.7) | 2.0 (2.0) |
| Refinement | |||||||
| Resolution (Å) | 2.54 | 2.48 | 3.15 | 2.49 | 2.56 | 2.73 | 3.2 |
| No. unique reflections | 21761 | 23546 | 11672 | 23269 | 21415 | 17965 | 11555 |
| Rwork / Rfree | 25.2/31.6 | 24.2/29.8 | 21.6/29.8 | 23.6/29.5 | 23.7/27.8 | 25.0/30.4 | 20.6/28.3 |
| No. atoms | |||||||
| Protein | 4149 | 4065 | 3921 | 4123 | 4066 | 4096 | 4015 |
| Ligand/ion | 90 | 112 | 74 | 90 | 112 | 46 | 118 |
| Water | 35 | 82 | 2 | 43 | 21 | 18 | 0 |
| B-factors | |||||||
| Protein | 65.80 | 53.94 | 58.48 | 64.00 | 64.71 | 67.70 | 79.58 |
| Ligand/ion | 74.57 | 41.56 | 77.08 | 74.58 | 49.66 | 83.90 | 108.68 |
| Water | 55.23 | 46.34 | 46.73 | 51.89 | 50.58 | 55.19 | n/a |
| R.m.s. deviations | |||||||
| Bond lengths (Å) | 0.010 | 0.011 | 0.013 | 0.010 | 0.010 | 0.012 | 0.011 |
| Bond angles (°) | 1.33 | 1.45 | 1.43 | 1.21 | 1.38 | 1.35 | 1.31 |
| Ramachandran favored (%) | 92.90 | 96.77 | 94.33 | 96.63 | 96.57 | 95.01 | 92.61 |
| Ramachandran outliers (%) | 0.20 | 0.20 | 0.00 | 0.00 | 0.20 | 0.20 | 0.21 |
| PDB accession code | 8ZFN | 8ZFP | 8ZFO | 8ZFQ | 8ZFS | 8ZFR | 8ZFT |
-
*
Values in parentheses are for highest-resolution shell.
Table 2
Structural rmsd comparison of ligand cobound structures to the transcriptionally active PPARγ LBD conformation (PDB 6ONJ).
| PDB ID | rmsd |
|---|---|
| 8ZFP | 0.98 |
| 8ZFO | 0.77 |
| 8ZFQ | 0.97 |
| 8ZFS | 0.95 |
| 8ZFR | 0.92 |
| 8ZFT | 1.00 |
| 8ZFN | 1.03 |
Key resources table
| Reagent type (species) or resource | Designation | Source or reference | Identifiers | Additional information |
|---|---|---|---|---|
| Gene | PPARG (Homo sapiens) | UniPro | P37231 | Protein sequence |
| Strain, strain background (Escherichia coli) | BL21(DE3) | Sigma-Aldrich | CMC0016 | Electrocompetent cells |
| Chemical compound | T0070907 | Cayman Chemical | 10026 | |
| Chemical compound | GW9662 | Cayman Chemical | 70785 | |
| Chemical compound | MRL-24 | MecChem Express | HY-122235 | |
| Chemical compound | nTZDpa | Tocris Bioscience | 2150 | |
| Chemical compound | SR1664 | Cayman Chemical | 11086 | |
| Chemical compound | BVT-13 | Sigma Aldrich | B4438 | |
| Recombinant DNA reagent | PPARγ LBD | Hughes et al., 2012 | Bacterial expression plasmid | |
| Antibody | LanthaScreen Elite Tb-anti-His antibody | Thermo Fisher | #PV5895 | |
| Peptide, recombinant protein | TRAP220/MED1 | LifeTein | synthesized | residues 638–656 (NTKNHPMLMNLLKDNPAQD) synthesized with or without a N-terminal FITC label with a six-carbon linker (Ahx) and an amidated C-terminus for stability |
| Peptide, recombinant protein | NCoR1 | LifeTein | synthesized | residues 2256–2,278 (DPASNLGLEDIIRKALMGSFDDK) synthesized with or without a N-terminal FITC label with a six-carbon linker (Ahx) and an amidated C-terminus for stability |
| Software | NMRFx | Norris et al., 2016 | Version 11.4 .x | |
| Software | Topspin | Bruker | Version 3 .x | |
| Software | Prism | GraphPad | Version 10 | |
| Software | CCP4 | Agirre et al., 2023 | ||
| Software | Phaser | McCoy et al., 2007 | ||
| Software | Phenix | Adams et al., 2010 | ||
| Software | COOT | Emsley and Cowtan, 2004 | ||
| Software | PyMOL | Schrödinger | Version 3 | |
| Software | jFATCAT | RCSB |
Additional files
Download links
A two-part list of links to download the article, or parts of the article, in various formats.
Downloads (link to download the article as PDF)
Open citations (links to open the citations from this article in various online reference manager services)
Cite this article (links to download the citations from this article in formats compatible with various reference manager tools)
Unanticipated mechanisms of covalent inhibitor and synthetic ligand cobinding to PPARγ
eLife 13:RP99782.
https://doi.org/10.7554/eLife.99782.3


