Ligand-coupled conformational changes in a cyclic nucleotide-gated ion channel revealed by time-resolved transition metal ion FRET
- Department of Physiology and Biophysics, University of Washington, United States
Figures
Figure 1

SthK as a model protein for characterizing the allosteric regulation in CNBD channels.
(A) Representative macroscopic A208V-cfSthK currents in inside-out patches from bacterial spheroplasts in response to voltage steps shown at the top, in the absence of cyclic nucleotide (top black traces), in saturating 1 mM cAMP (middle red traces), and in saturating 1 mM cGMP (bottom green traces). (B) Dose-response relation of A208V-cfSthK for cAMP at +80 mV (red circles, n=6), fit with the Hill Equation (red curve, : 0.27±0.01 µM, slope: 2.9±0.2, means ± SD). Fractional activation by 1 mM cGMP was 0.002±0.003 (mean ± SD; green diamond, n=6). (C) Diagram showing four states (either apo or holo, and either resting or active) of the CNBD and the associated ΔG’s for the transitions between states. (D) Theoretical fluorescence lifetime decays of a donor fluorophore in the time-domain showing basis of time-resolved tmFRET. A single exponential donor and mixtures of two single tmFRET distances (short and long) are shown. (E) Theoretical distance distributions showing two states with average distances, , heterogeneity within each conformational state as standard deviation, , and heterogeneity between conformational states as fractional area, A2, for apo (black) and holo (red) conditions.
-
Figure 1—source data 1
Excel data for representative electrophysiology traces (Figure 1A) and summary of cyclic nucleotide dose response (Figure 1B).
- https://cdn.elifesciences.org/articles/99854/elife-99854-fig1-data1-v1.xlsx
Figure 2

Expression, purification, and analysis of tetrameric SthKCterm.
(A) In-gel protein fluorescence showing selective Acd incorporation into SthKCterm in the absence and presence of S361Acd TAG site, Acd aminoacyl tRNA synthetase/tRNA (RS/tRNA), and unnatural amino acid Acd. (B) Structures of cysteine modified by acceptor compounds [Cu(TETAC)]2+ (cyan), [Fe(phenM)3]2+ (magenta), and [Ru(bpy)2phenM]2+ (orange) along with their corresponding Förster curves of FRET efficiency as a function of distance from Acd, and their R0 values specified and marked with dashed lines. (C) SthKCterm cartoon as tetramer and monomer showing WT subunits in gray and cysteine-containing Acd-labeled subunits in tan. (D) SEC traces (absorbance at 280 nm in black and 425 nm fluorescence emission for Acd in blue) of isolated WT-Acd-heterotetrameric protein (closed triangle) vs monomeric WT protein (open triangle). (E) Mass photometry histogram data showing primarily tetramers (*), with single Gaussian fits (blue, 29±7.3 kDa and 104.5±16.8 kDa , means ± SD).
-
Figure 2—source data 1
Original uncropped protein gel image (Figure 2A).
- https://cdn.elifesciences.org/articles/99854/elife-99854-fig2-data1-v1.zip
-
Figure 2—source data 2
Labeled cropped protein gel image (Figure 2A).
- https://cdn.elifesciences.org/articles/99854/elife-99854-fig2-data2-v1.zip
-
Figure 2—source data 3
Excel data for size exclusion chromatography (Figure 2D) and mass photometry data (Figure 2E).
- https://cdn.elifesciences.org/articles/99854/elife-99854-fig2-data3-v1.xlsx
Figure 3 with 1 supplement
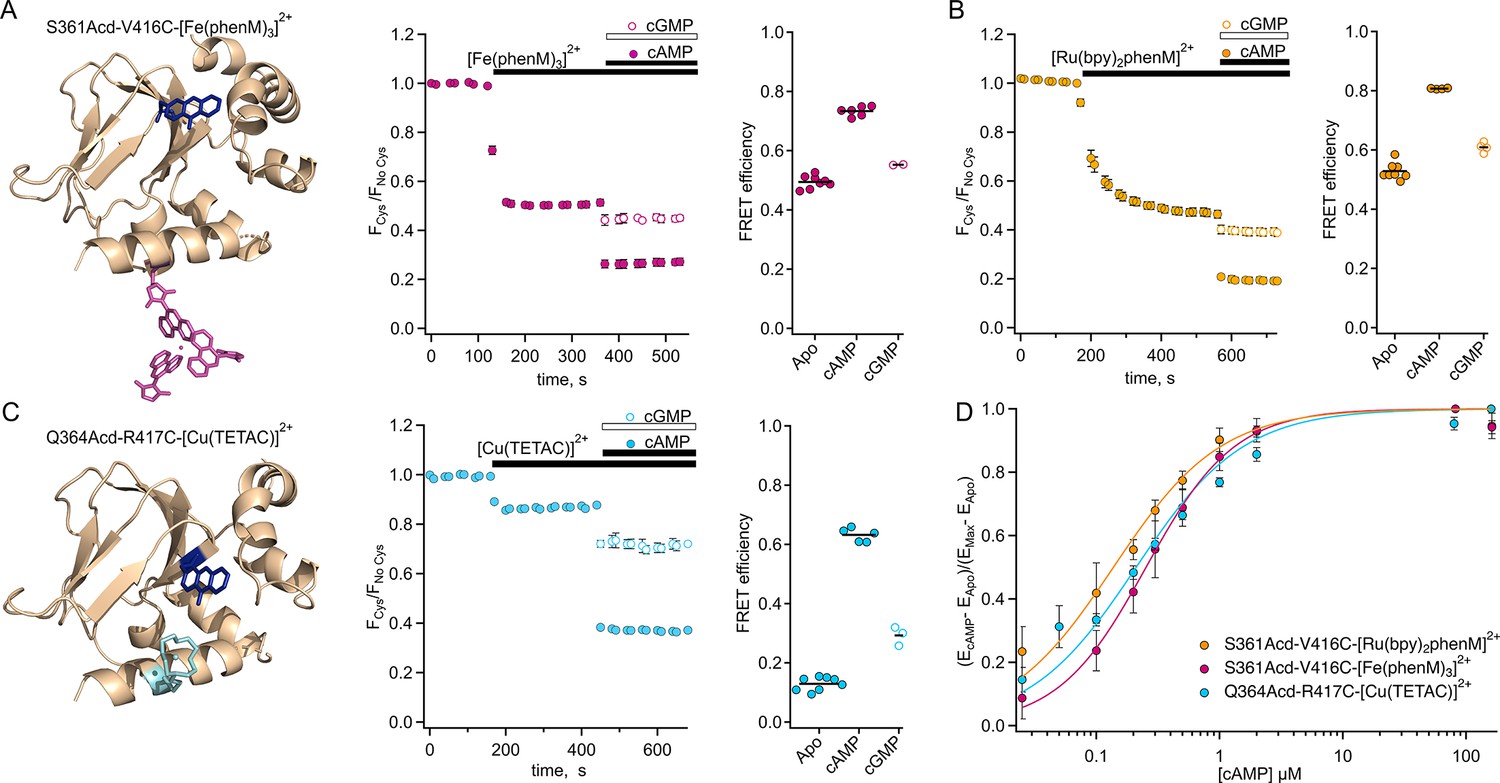
Steady-state tmFRET data from tetrameric SthKCterm.
(A) Left: structure of one subunit of SthKCterm-S361Acd with [Fe(phenM)3]2+ acceptor incorporated at V416C (adapted from PDB: 4D7T; Kesters et al., 2015). Middle: Time course of average fluorescence upon addition of [Fe(phenM)3]2+ and then cAMP or cGMP (apo, n=8; cAMP n=6; and cGMP, n=2). Right: summary of the FRET efficiencies from individual experiments, with mean values as horizontal lines. (B) Left: Time course of average fluorescence for same site upon addition of [Ru(bpy)2phenM]2+ acceptor and then cAMP or cGMP (apo, n=8; cAMP, n=4; and cGMP, n=4). Right: summary of FRET efficiencies, with mean values as horizontal lines. (C) Left: structure of one subunit of SthKCterm-Q364Acd-417C with [Cu(TETAC)]2+ acceptor incorporated at R417C. Middle: Time course of averaged fluorescence upon addition of [Cu(TETAC)]2+ then cAMP or cGMP (apo, n=8; cAMP, n=5; and cAMP, n=3). Right: summary of FRET efficiencies, with mean values as horizontal lines. (D) Dose response relations of FRET efficiency change as a function of cAMP concentration normalized for comparison and fit with Hill equations (: 0.25±0.01 µM, 0.14±0.01 µM, 0.21±0.02 µM, and h:1.2±0.07, 1, and 1 for [Fe(phenM)3]2+, magenta; [Ru(bpy)2phenM]2+, orange; and [Cu(TETAC)]2+, cyan respectively, ± SD).
-
Figure 3—source data 1
Excel data for time courses and dot plots of steady-state FRET efficiencies and dose response (Figure 3A–D).
- https://cdn.elifesciences.org/articles/99854/elife-99854-fig3-data1-v1.xlsx
Figure 3—figure supplement 1

Steady-state tmFRET of monomeric and tetrameric SthKCterm.
(A) SEC chromatogram showing separation of monomeric (empty triangle, blue area) and tetrameric protein (solid triangle, gray area) fractions for SthKCterm-I359Acd and SthKCterm-I359Acd-R417C (no WT SthKC-term present) on a Superdex 75 increase 10/300 column (GE Healthcare). (B) Structure showing SthKCterm-I359Acd with [Cu(TETAC)]2+ acceptor at R417C (PDB:4D7T). (C) Fluorescence time-course of SthKCterm-I359Acd-417C upon addition of [Cu(TETAC)]2+, cAMP and TCEP in tetrameric protein (closed diamonds) and monomeric protein (open triangles). (D) Summary of FRET efficiencies for monomer and tetramer, with mean values shown as horizontal lines. Left: SthKCterm-I359Acd-R417C-[Cu(TETAC)]2+ (apo, *p=0.0005, cAMP, p=0.06). Right: SthKCterm-S361Acd-V416C-[Fe(phenM)3]2+ (apo, *p=0.006, cAMP: p=0.9).
-
Figure 3—figure supplement 1—source data 1
Excel data for size exclusion chromatography traces, monomer and tetramer steady-state time courses, and FRET efficiency summaries (Figure 3—figure supplement 1A–D).
- https://cdn.elifesciences.org/articles/99854/elife-99854-fig3-figsupp1-data1-v1.xlsx
Figure 4

Distance distribution predictions with chiLife.
(A) Structure of resting state (left, PDB:7RSH) (Gao et al., 2022), and cAMP-bound active state (right, PDB:4D7T) (Kesters et al., 2015) with rotameric clouds predicted by chiLife for the labels (Acd, blue; [Fe(phenM)3]2+, magenta; and [Cu(TETAC)]2+, cyan). Gray surface indicates location of adjacent WT subunits in tetramer. (B) Distance distributions predicted by chiLife for SthKCterm-S361Acd-V416C-[Fe(phenM)3]2+, SthKCterm-S361Acd-V416C-[Ru(bpy)2phenM]2+ and SthKCterm-Q364Acd-R417C-[Cu(TETAC)]2+ (intra-subunit distances: resting, black curves; active, red curves; and inter-subunit distances: resting, grey curves; active, pink curves). Average steady-state tmFRET distance measurements are overlayed as vertical lines for data from Figure 3 (apo, solid black, and cAMP, solid red) and adjusted assuming a 10% unlabeled protein (dashed black and red vertical lines).
-
Figure 4—source data 1
Excel data for chiLife distance distributions (Figure 4B).
- https://cdn.elifesciences.org/articles/99854/elife-99854-fig4-data1-v1.xlsx
Figure 5 with 2 supplements

Lifetime measurements of SthKCterm-S361Acd-V416C with [Fe(phenM)3]2+ and [Ru(bpy)2phenM]2+.
Chemical structures of acceptors and legends for all plots shown on top. (A–B) Representative Weber plots of phase delay and modulation ratio for SthKCterm-S361Acd-V416C labeled with [Fe(phenM)3]2+ (A) and [Ru(bpy)2phenM]2+(B). Fits of the data using the single Gaussian model are shown with phase delay as solid curves and modulation ratio as dashed curves. (C–D) Spaghetti plots showing distance distributions from the model fits with apo (thin black curves, n=4), with 1.23 mM cAMP (thin red curves, n=4) and 1.23 mM cGMP (thin green curves, n=4) for [Fe(phenM)3]2+ (C) and [Ru(bpy)2phenM]2+(D). Distributions predicted by chiLife are overlayed in dashed curves. (E–F) Summary of Gaussian fit standard deviations, , versus average distances, , for [Fe(phenM)3]2+ (E) and [Ru(bpy)2phenM]2+ (F), with average values as cross marks.
-
Figure 5—source data 1
Excel data for Weber plots, spaghetti plots and summary of Gaussian fit scatter plots (Figure 5A–F).
- https://cdn.elifesciences.org/articles/99854/elife-99854-fig5-data1-v1.xlsx
Figure 5—figure supplement 1

Representative Weber plot of measured lifetimes of SthKCterm-S361Acd donor-only (grey), then in the presence of [Fe(phenM)3]2+ (black), and after the addition of 1.23 mM cAMP (red), showing no change in lifetimes in the absence of a cysteine residue.
-
Figure 5—figure supplement 1—source data 1
Excel data for fluorescence lifetimes Weber plot.
- https://cdn.elifesciences.org/articles/99854/elife-99854-fig5-figsupp1-data1-v1.xlsx
Figure 5—figure supplement 2

Parameters used in the lifetimes fitting model for both the single and sum of two Gaussian approaches, shown in blue.
(A) Graph of donor-only fluorescence-lifetime decay with two exponential components with time constants (, (B) FRET efficiency (E) plot as a function of distance (r) between donor and acceptor and the R0 values for 50% FRET transfer. (C) Probability distribution plot of donor and acceptor distances P(r) showing the sum of two Gaussian distributions, each with their own average distance ( and ), standard deviations ( and ) and relative amplitude of the second component (A2). The donor-only fraction () is modeled as a narrow Gaussian with mean distance of 150 Å and standard deviation of 0.1 Å, beyond a detectable amount of FRET. (D) The in-phase () and out-of-phase () components are plotted for the measured, corrected, and background fluorescence signal as a function of the excitation modulation frequency (ω), where is the fraction of the fluorescence intensity due to the background. (E) Plot of the phase delay () and modulation ratio () of the measured and corrected fluorescence response as a function of the modulation frequency (ω) where t0 is the time shift of the instrument response function.
Figure 6 with 2 supplements

Analysis of lifetime data with global fit model allowing sum of two Gaussian distance distributions.
(A) Representative phasor plot of measured lifetimes with [Fe(phenM)3]2+ acceptor, where markers on universal circle indicate single-exponential time constants (in nanoseconds). Data shown are donor-only (grey), apo (black), cAMP (red) and cGMP (green). (B) Representative Weber plot showing global fits for [Fe(phenM)3]2+ acceptor data (closed circles) and [Ru(Bpy)2phenM]2+ acceptor data (open diamonds) for apo (black), cAMP (red), and cGMP (green) conditions. (C) Spaghetti plot of distance distributions for each experiment (n=4) (thin lines). For comparison, chiLife distributions are overlayed (dashed curves). (D) Summary of Gaussian fit standard deviations, , versus average distances, , for apo and cAMP, with average values as cross marks. Colors correspond to conditions in (A–C). (E) Fit values and averages for fraction activation (A2) for each condition.
-
Figure 6—source data 1
Excel data for phasor plot coordinates, Weber plot, spaghetti plot and dot plot for summary of Gaussian fit parameters from global fits (Figure 6A–E).
- https://cdn.elifesciences.org/articles/99854/elife-99854-fig6-data1-v1.xlsx
Figure 6—figure supplement 1

Representative phasor plot of measured lifetimes of SthKCterm-S361Acd-V416C alone (donor-only, grey), in the presence of [Ru(bpy)2phenM]2+ (apo, black), in the presence of 1 µM cAMP (cyan) and presence of 1.23 mM cAMP (red).
-
Figure 6—figure supplement 1—source data 1
Excel data for phasor plot coordinates.
- https://cdn.elifesciences.org/articles/99854/elife-99854-fig6-figsupp1-data1-v1.xlsx
Figure 6—figure supplement 2

Identifiability of parameters in the sum of two Gaussian distributions model, with global fitting [Fe(phenM)3]2+ and [Ru(bpy)2phenM]2+ data.
(A–B) Minimization of values for the Gaussian average distance () (A) and standard deviation () (B) for the resting (black) and active states (red). (C) Minimization of values for parameter A2 for the conditions of apo, cAMP and cGMP. (D) Minimization of values for the fraction of donor-only component () in protein samples for each experiment of apo and cAMP for [Fe(phenM)3]2+, of apo and cAMP for [Ru(bpy)2phenM]2+, of cGMP for [Fe(phenM)3]2+, and of cGMP for [Ru(bpy)2phenM]2+.
-
Figure 6—figure supplement 2—source data 1
Excel data for surface graphs for different model parameters (Figure 6—figure supplement 2A–D).
- https://cdn.elifesciences.org/articles/99854/elife-99854-fig6-figsupp2-data1-v1.xlsx
Figure 7

Lifetime measurements in 150 mM KCl versus 500 mM KCl conditions.
(A) Normalized SEC traces of SthKCterm in 150 mM KCl (solid curve) and 500 mM KCl (dashed curve). (B) Representative Weber plot for [Fe(phenM)3]2+ lifetimes in 150 mM (open circles) and 500 mM KCl (closed triangles), in each ligand condition (apo, black; cGMP, green; cAMP; red). An additional lifetime trace is shown for an experiment where additional 300 mM KCl was added to the protein sample with 150 mM KCl in cGMP (closed green circles). (C) Comparison of Gaussian average distance, , and standard deviation, , between ionic concentrations using model global fitting of [Fe(phenM)3]2+ and [Ru(bpy)2phenM]2+ with the sum of two Gaussians (apo, black, and cAMP, red, n=4). (D) Fraction of active state in each condition (A2) for 150 mM KCl and 500 mM KCl using the sum of two Gaussian model fits (apo p=0.2, cGMP *p=0.0001).
-
Figure 7—source data 1
Excel data for size exclusion chromatography traces, Weber plot, and dot plots for summary of Gaussian fit parameters from global fits (Figure 7A–D).
- https://cdn.elifesciences.org/articles/99854/elife-99854-fig7-data1-v1.xlsx
Tables
Table 1
Calculated energetics of the four state model.
| Ligand condition | Ionic strength (mM KCl) | ∆G (kcal/mol) | ∆∆G (kcal/mol) |
|---|---|---|---|
| Apo | 150 | 1.14±0.03 | -- |
| 500 | 1.2±0.03 | -- | |
| cAMP | 150 | -- | -- |
| 500 | <–2.7±0 | <–3.9±0.03 | |
| cGMP | 150 | 0.67±0.03 | –0.47±0.04 |
| 500 | 0.38±0.02 | –0.82±0.04 |
-
Energies are reported in mean values ± SEM.
Key resources table
| Reagent type (species) or resource | Designation | Source or reference | Identifiers | Additional information |
|---|---|---|---|---|
| Strain, strain background (Escherichia coli) | B-95.ΔA E. coli | Addgene | Bacterial strain #197933 | |
| Recombinant DNA reagent | pDule2-Mj Acd A9 (plasmid) | Addgene | Plasmid #197652 | |
| Recombinant DNA reagent | MBP-S361TAG -ctermSthK-TEV-TWS.pETM11 (plasmid) | Addgene | Plasmid #231098 | |
| Recombinant DNA reagent | MBP- S361TAG -V416C-ctermSthK-TEV-TWS.pETM11 (plasmid) | Addgene | Plasmid #231099 | |
| Recombinant DNA reagent | MBP-Q364TAG -ctermSthK-TEV-TWS.pETM11 (plasmid) | Addgene | Plasmid #231100 | |
| Recombinant DNA reagent | MBP- Q364TAG -R417C-ctermSthK-TEV-TWS.pETM11 (plasmid) | Addgene | Plasmid #231101 | |
| Software, algorithm | FDlifetime_17_Igor_procedures.ipf | Zagotta, 2021 | https://github.com/zagotta/FDlifetime_program |
Additional files
Download links
A two-part list of links to download the article, or parts of the article, in various formats.
Downloads (link to download the article as PDF)
Open citations (links to open the citations from this article in various online reference manager services)
Cite this article (links to download the citations from this article in formats compatible with various reference manager tools)
Ligand-coupled conformational changes in a cyclic nucleotide-gated ion channel revealed by time-resolved transition metal ion FRET
eLife 13:RP99854.
https://doi.org/10.7554/eLife.99854.3


