Structural basis for molecular assembly of fucoxanthin chlorophyll a/c-binding proteins in a diatom photosystem I supercomplex
- Research Institute for Interdisciplinary Science and Graduate School of Environmental, Life, Natural Science and Technology, Okayama University, Japan
- Graduate School of Agriculture, Kyoto University, Japan
- Faculty of Agriculture, Shizuoka University, Japan
Figures
Figure 1 with 7 supplements
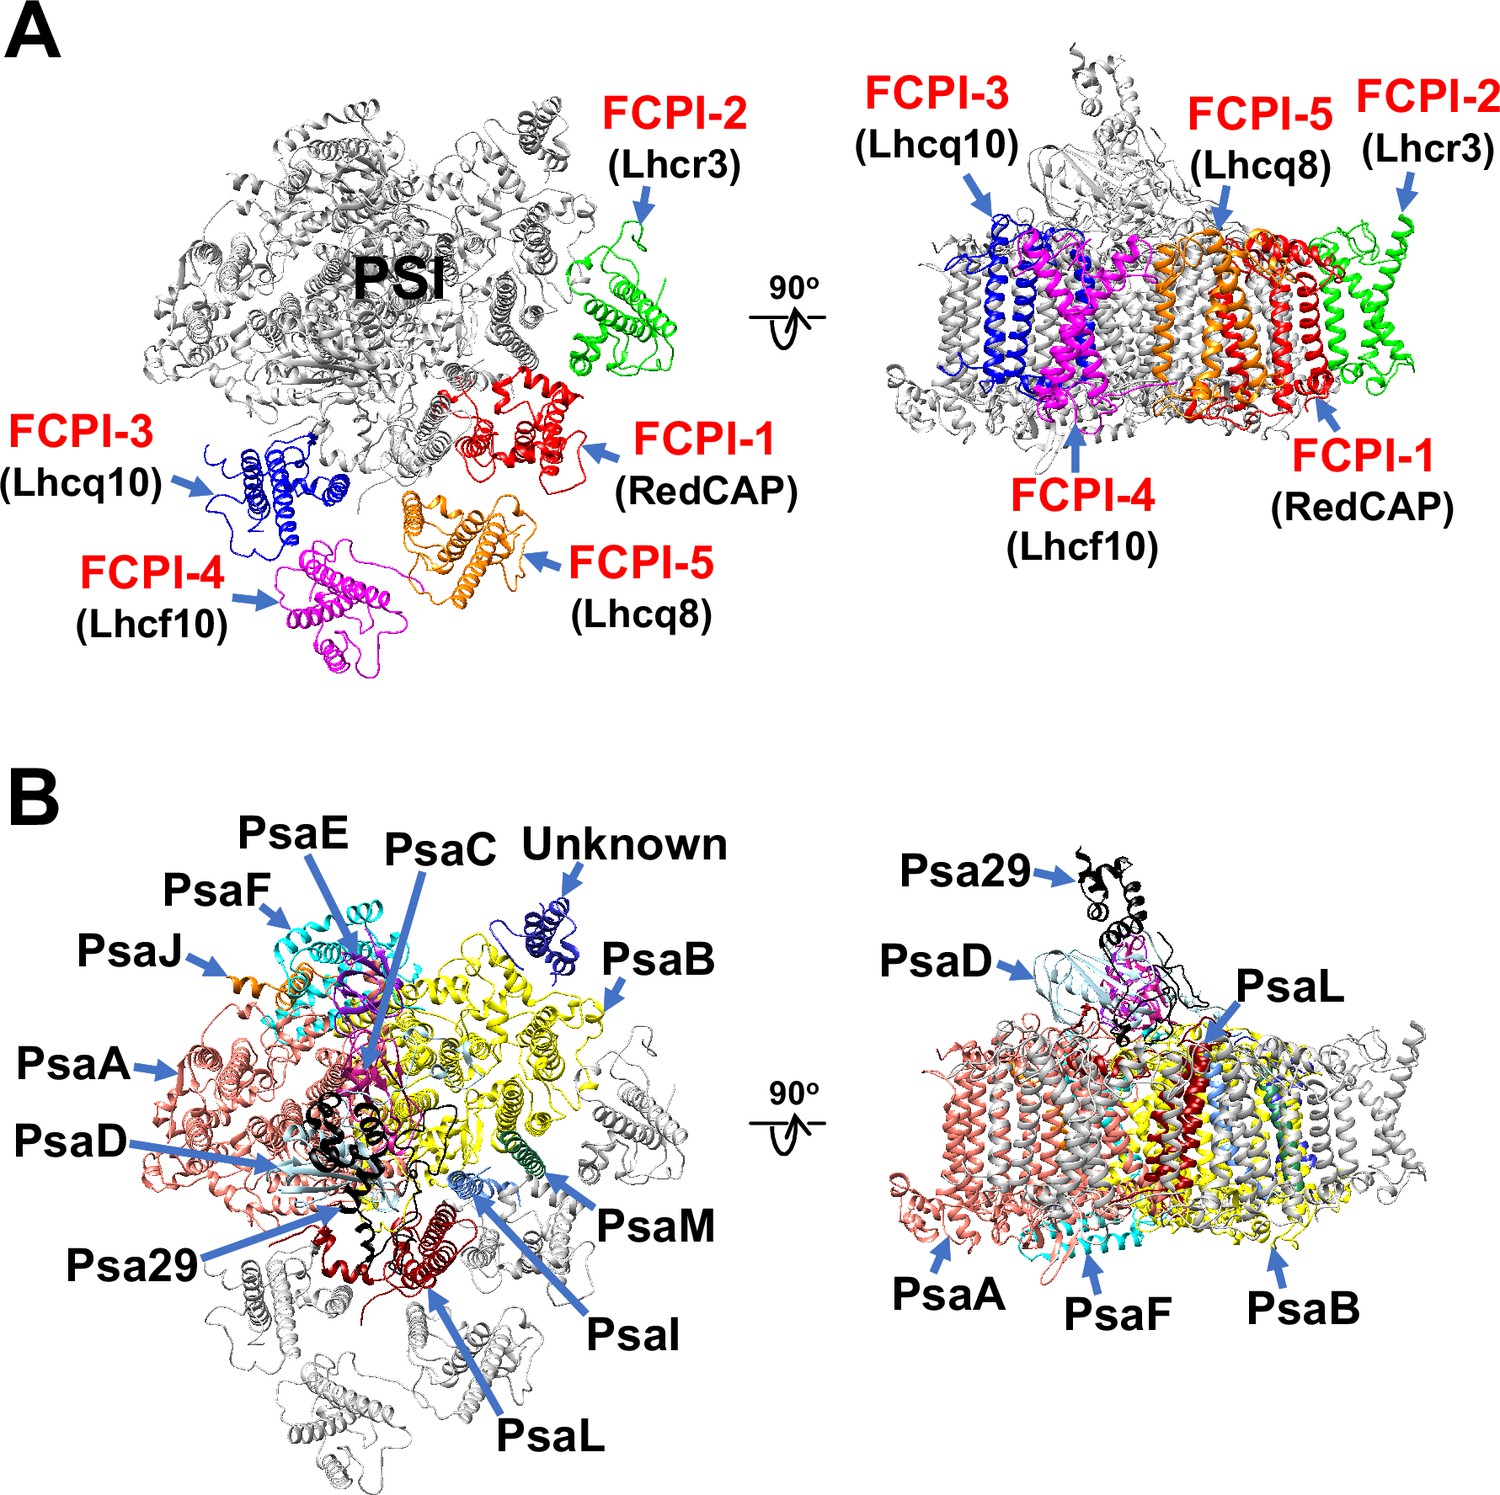
Overall structure of the PSI-FCPI supercomplex from T. pseudonana.
Structures are viewed from the stromal side (left panels) and from the direction perpendicular to the membrane normal (right panels). Only protein structures are depicted, with cofactors omitted for clarity. The FCPI (A) and PSI core (B) subunits are labeled and colored distinctly. The five FCPI subunits are labeled as FCPI-1–5 (red), with their corresponding gene products indicated in parentheses (black) in panel (A).
Figure 1—figure supplement 1

Isolation and characterization of the T. pseudonana PSI-FCPI supercomplex.
(A) Trehalose density gradient centrifugation. The red arrow indicates the PSI-FCPI fraction. (B) Sodium dodecyl sulfate–polyacrylamide gel electrophoresis (SDS–PAGE) analysis of PSI-FCPI. PsaA/B proteins were tentatively identified by comparing their apparent molecular weights with markers. (C) Absorption spectrum of PSI-FCPI measured at room temperature. Three measurements were averaged, and the resulting spectrum was normalized by the intensity of the Qy peak. (D) Fluorescence emission spectrum of PSI-FCPI measured at 77 K upon excitation at 430 nm. Three measurements were averaged, and the resulting spectrum was normalized by the maximum-peak intensity. (E) High-performance liquid chromatography (HPLC) analysis of pigments extracted from PSI-FCPI, monitored at 440 nm. Chl c2, chlorophyll c2; Chl c1, chlorophyll c1; Fx, fucoxanthin; Ddx, diadinoxanthin; Zx, zeaxanthin; Chl a, chlorophyll a; β-Car, β-carotene. Data in panels (A), (B), and (E) are representative of three independent experiments.
-
Figure 1—figure supplement 1—source data 1
PDF file containing the original SDS-PAGE gel for Figure 1—figure supplement 1B, with relevant bands indicated.
- https://cdn.elifesciences.org/articles/99858/elife-99858-fig1-figsupp1-data1-v1.zip
-
Figure 1—figure supplement 1—source data 2
Original file of the SDS-PAGE gel shown in Figure 1—figure supplement 1B.
- https://cdn.elifesciences.org/articles/99858/elife-99858-fig1-figsupp1-data2-v1.zip
Figure 1—figure supplement 2
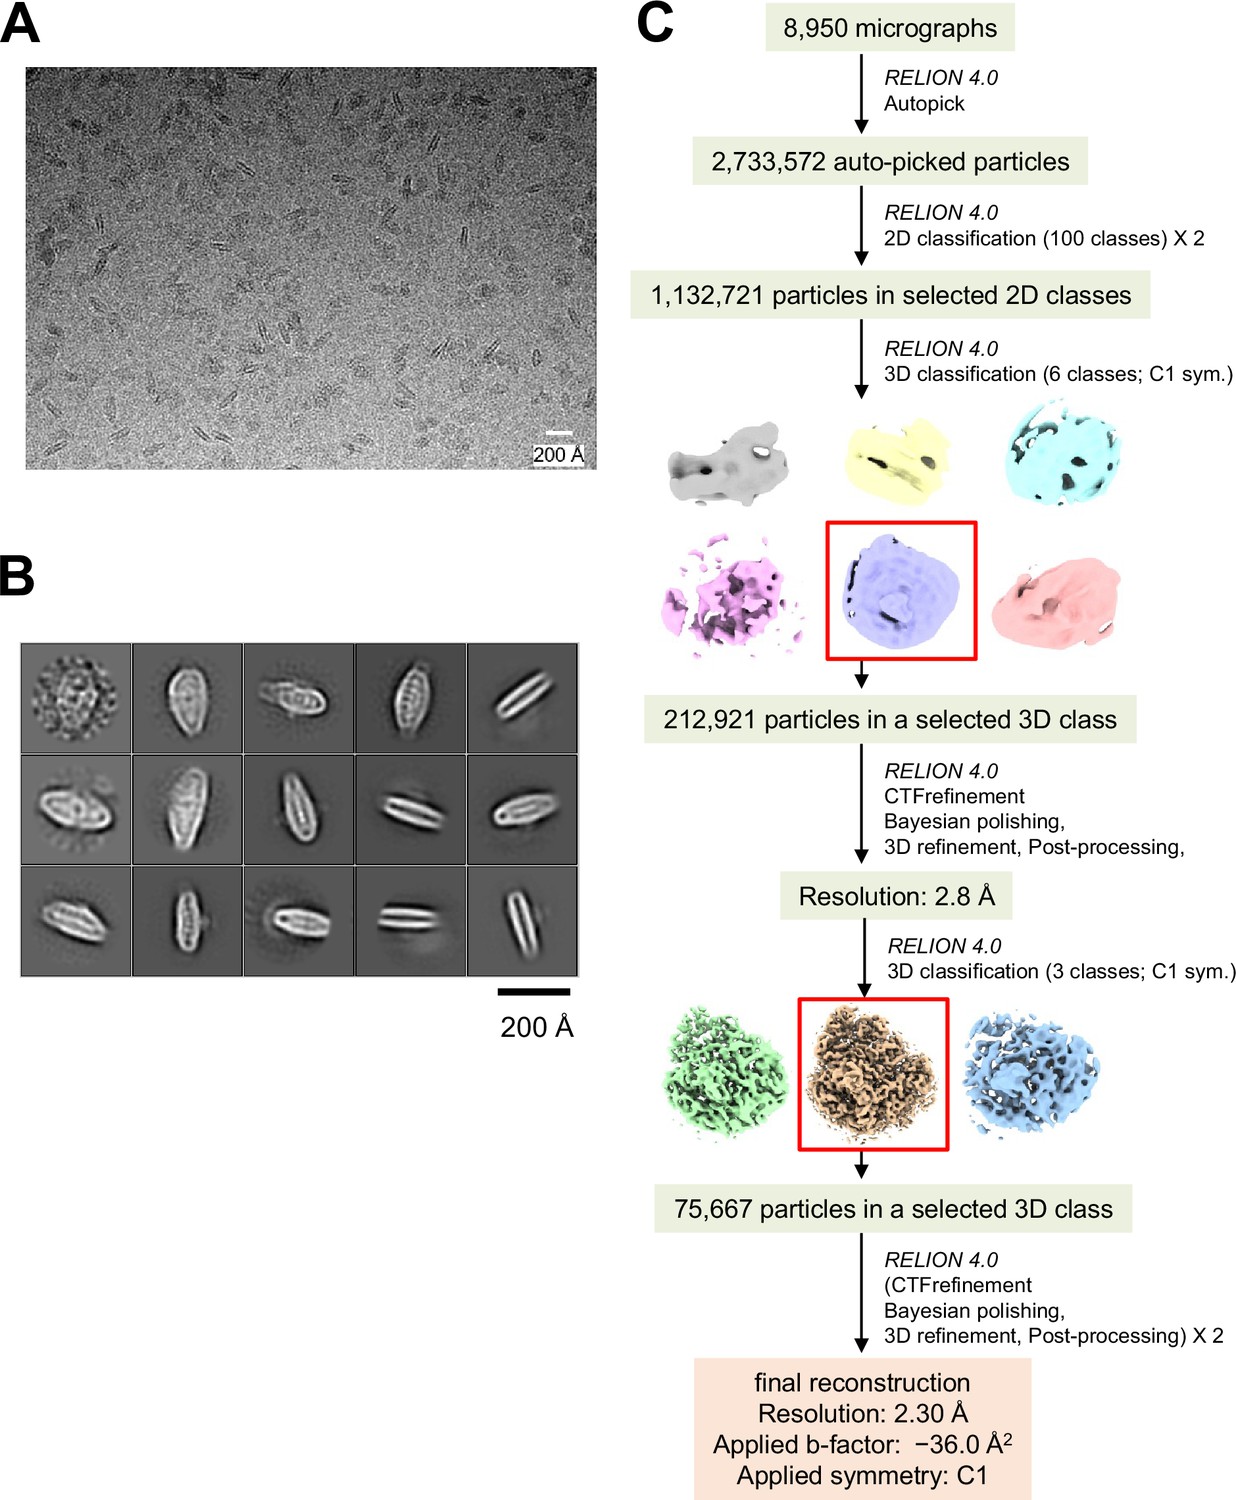
Cryo-electron microscopy (cryo-EM) data collection and processing of PSI-FCPI.
(A) A representative cryo-EM micrograph of PSI-FCPI from a total of 8,950 micrographs. (B) Representative 2D classes of PSI-FCPI. The box size is 300.8 Å. (C) Schematic flowchart illustrating the classification scheme and data processing for PSI-FCPI. Red boxes highlight selected particles from each 3D classification. The overall PSI-FCPI structure was reconstructed at a resolution of 2.30 Å from 75,667 particles. See the Methods section for further details.
Figure 1—figure supplement 3
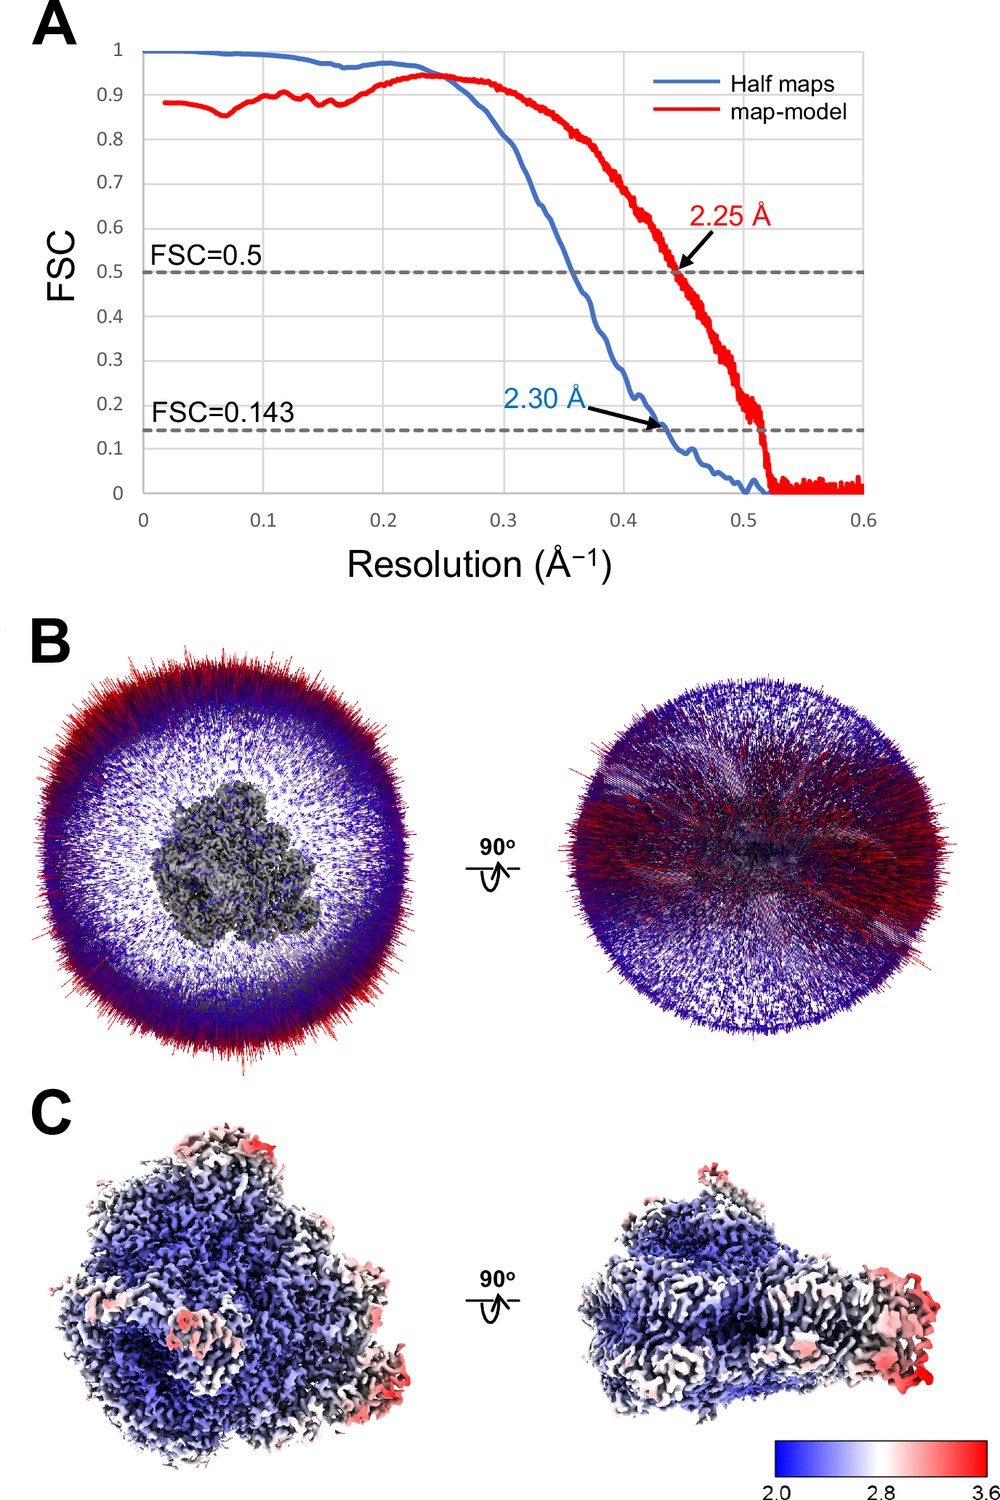
Evaluation of the cryo-electron microscopy (cryo-EM) map quality.
(A) FSC curves of PSI-FCPI for independently refined half maps (blue) and map-minus-model (red). (B) Angular distribution of the particles used for the reconstruction of PSI-FCPI. Each cylinder represents one view, and the height of the cylinder is proportional to the number of particles for that view. (C) Local resolution maps of PSI-FCPI.
Figure 1—figure supplement 4
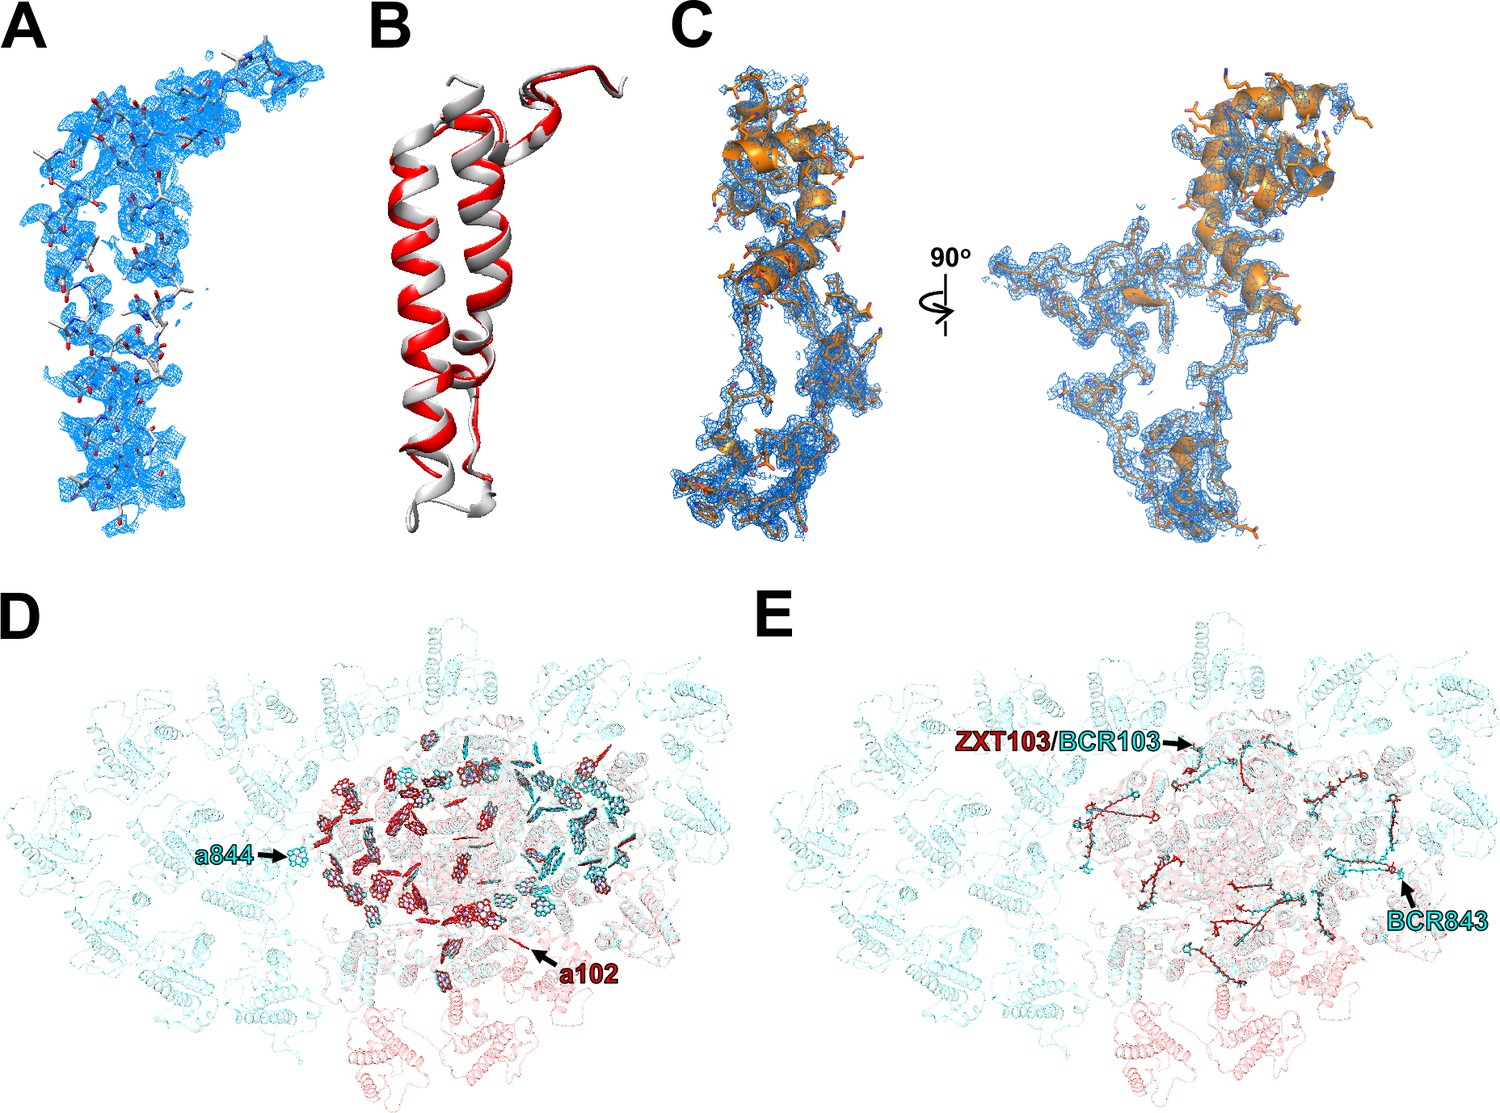
Characteristic structures of the PSI subunits and pigments in the PSI-FCPI structure.
(A) The cryo-electron microscopy (cryo-EM) density for the Unknown subunit and its corresponding model are shown as meshes and sticks, respectively. (B) Superposition of protein structures between Unknown of T. pseudonana (red) and Psa28 of C. gracilis (gray) (PDB: 6L4U). (C) The cryo-EM density for Psa29 and its corresponding model are shown as meshes and sticks, respectively. Comparison of Chls (D) and Cars (E) between T. pseudonana (red) and C. gracilis (cyan) PSI-FCPI structures. The T. pseudonana PSI-FCPI structure is superimposed on the C. gracilis PSI-FCPI structure (PDB: 6L4U), viewed from the stromal side. Chls and Cars are shown as sticks. Only rings of the Chl molecules are depicted. Characteristic pigments are labeled with red and cyan in the T. pseudonana and C. gracilis PSI-FCPI structures, respectively.
Figure 1—figure supplement 5
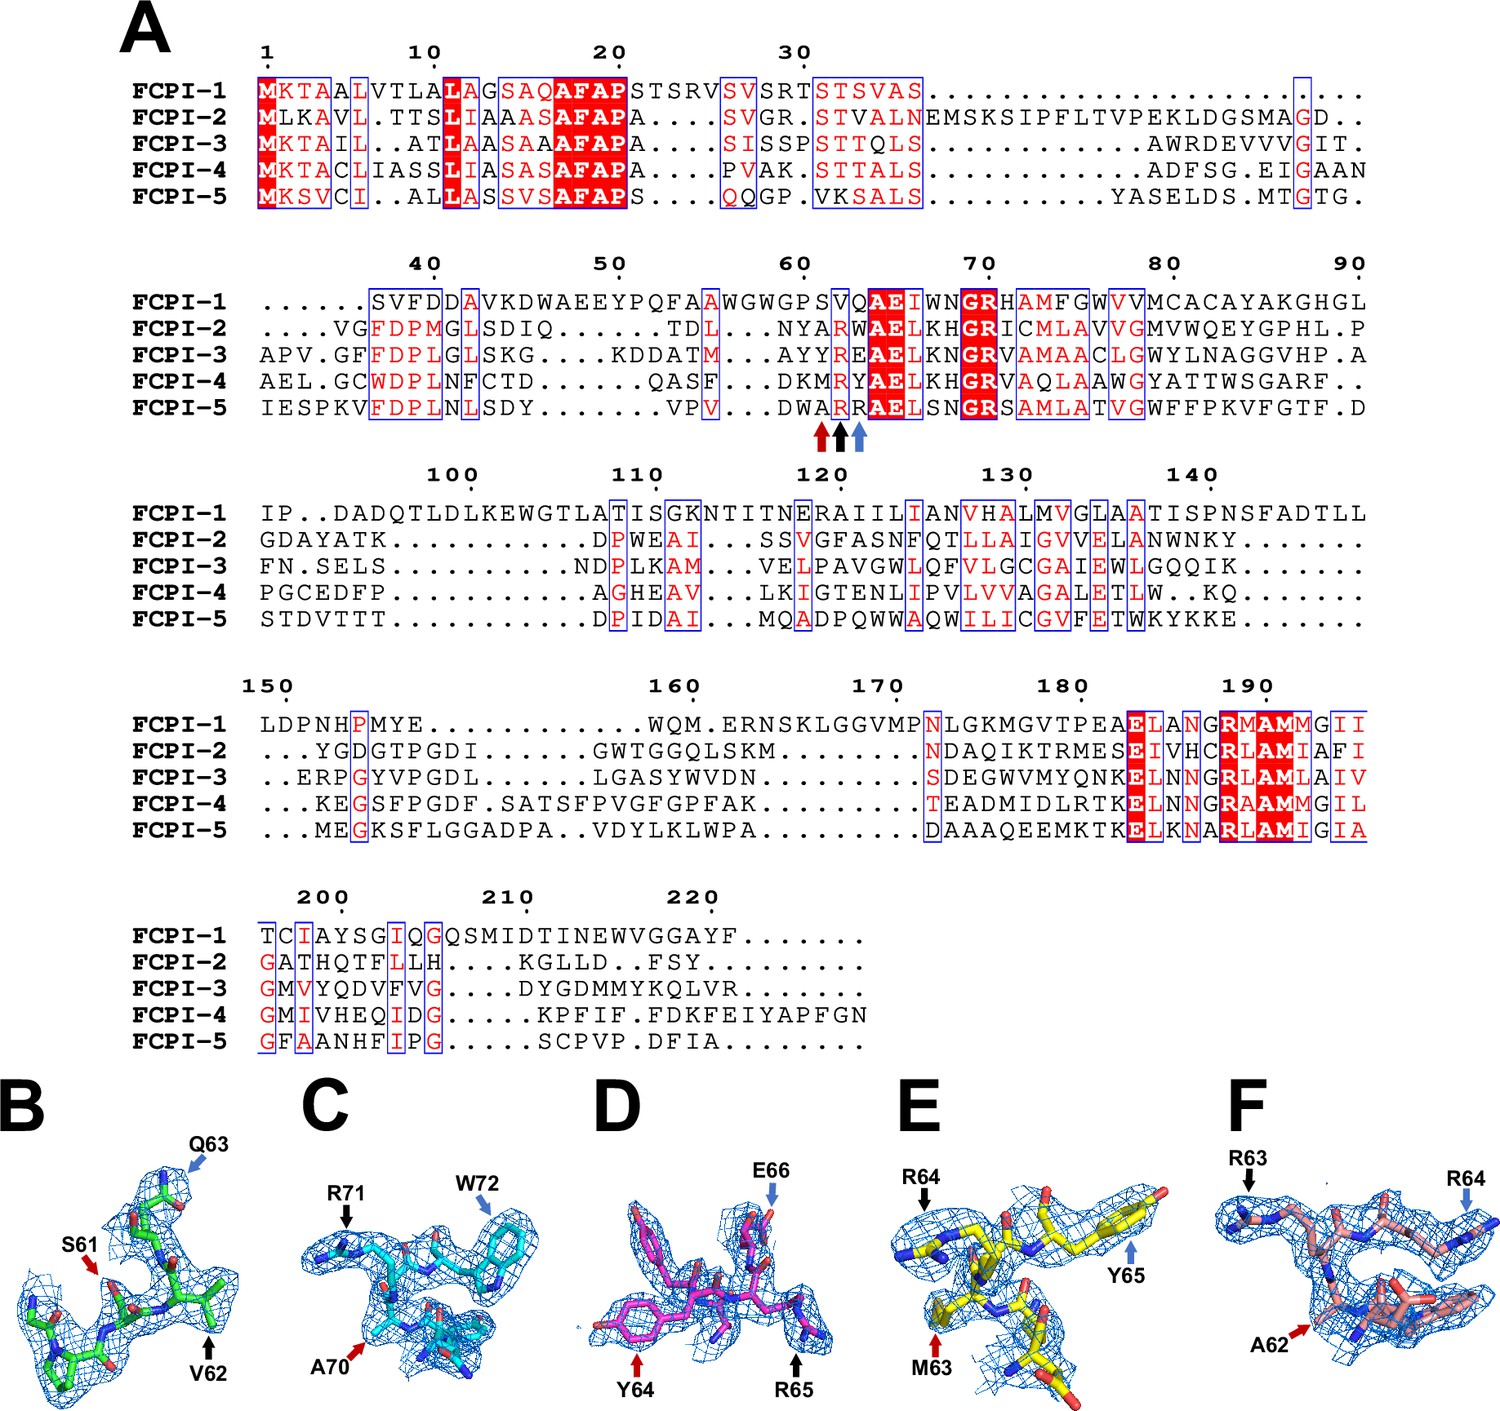
Characteristic amino acid residues used for the identification of each FCPI subunit.
(A) Multiple sequence alignment of FCPI proteins in T. pseudonana using PROMALS3D (http://prodata.swmed.edu/promals3d/promals3d.php) and ESPript (https://espript.ibcp.fr/ESPript/cgi-bin/ESPript.cgi). Unique residues are indicated by arrows in different colors, which were used to identify the various FCPI subunits. Characteristic maps and amino acid residues of FCPI-1 (B), FCPI-2 (C), FCPI-3 (D), FCPI-4 (E), and FCPI-5 (F), respectively. The densities and models are shown as meshes and sticks, respectively. The characteristic amino acids are labeled with arrows in the same color as in panel (A).
Figure 1—figure supplement 6
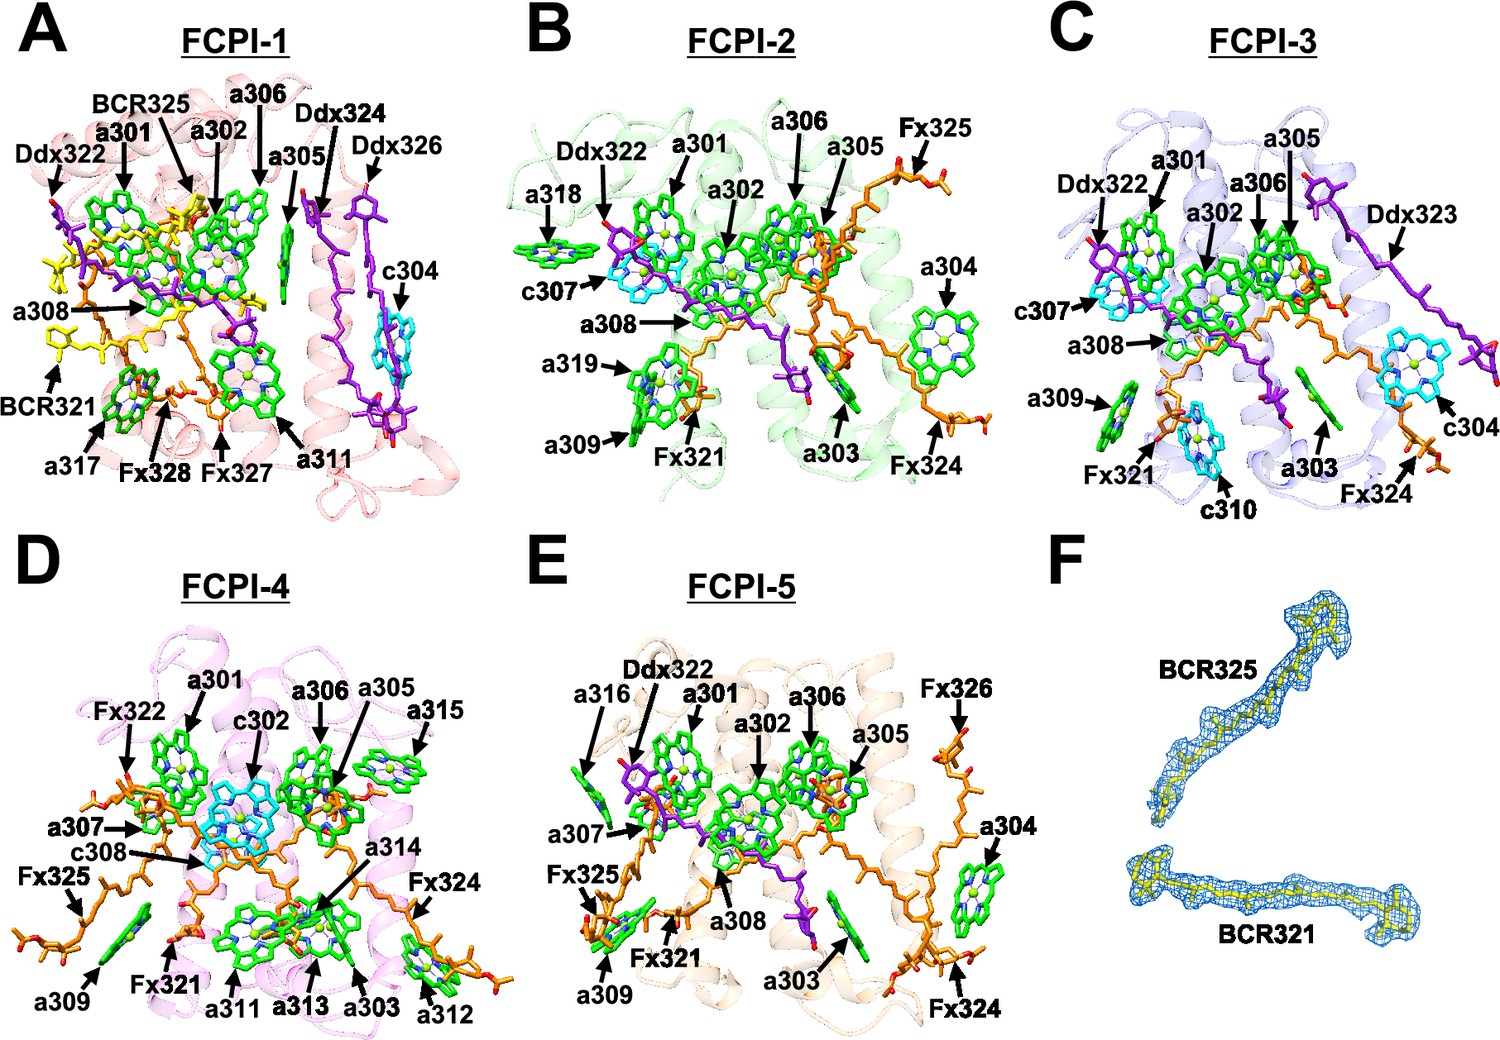
Structures of FCPIs.
(A–E) Structures of the five FCPI subunits from T. pseudonana, with proteins depicted as transparent cartoons and Chls and Cars shown as sticks in different colors.Only rings of the Chl molecules are depicted. Green, Chl a; cyan, Chl c; yellow, BCR; orange, Fx; purple, Ddx. (F) The cryo-electron microscopy (cryo-EM) densities for two BCRs in FCPI-1 and their corresponding models are shown as meshes and sticks, respectively.
Figure 1—figure supplement 7

Arrangement of pigment molecules within PSI-FCPI and possible excitation-energy-transfer pathways from FCPIs to PSI.
The structure of the T. pseudonana PSI-FCPI is viewed from the stromal side. Chls and Cars are shown as sticks. Only rings of the Chl molecules are depicted. Black arrows indicate excitation-energy-transfer pathways based on close physical interactions among labeled Chls; for example, a844/A and c304/3 mean Chl a844 of PsaA and Chl c304 of FCPI-3, respectively. A, PsaA; B, PsaB; I, PsaI; L, PsaL; 1, FCPI-1; 2, FCPI-2; 3, FCPI-3. Green, Chls a in PSI; orange, BCRs in PSI; yellow, ZXT; blue, Chls a in FCPIs; cyan, Chls c; gold, BCRs in FCPI-1; red, Fxs; magenta, Ddxs.
Figure 2
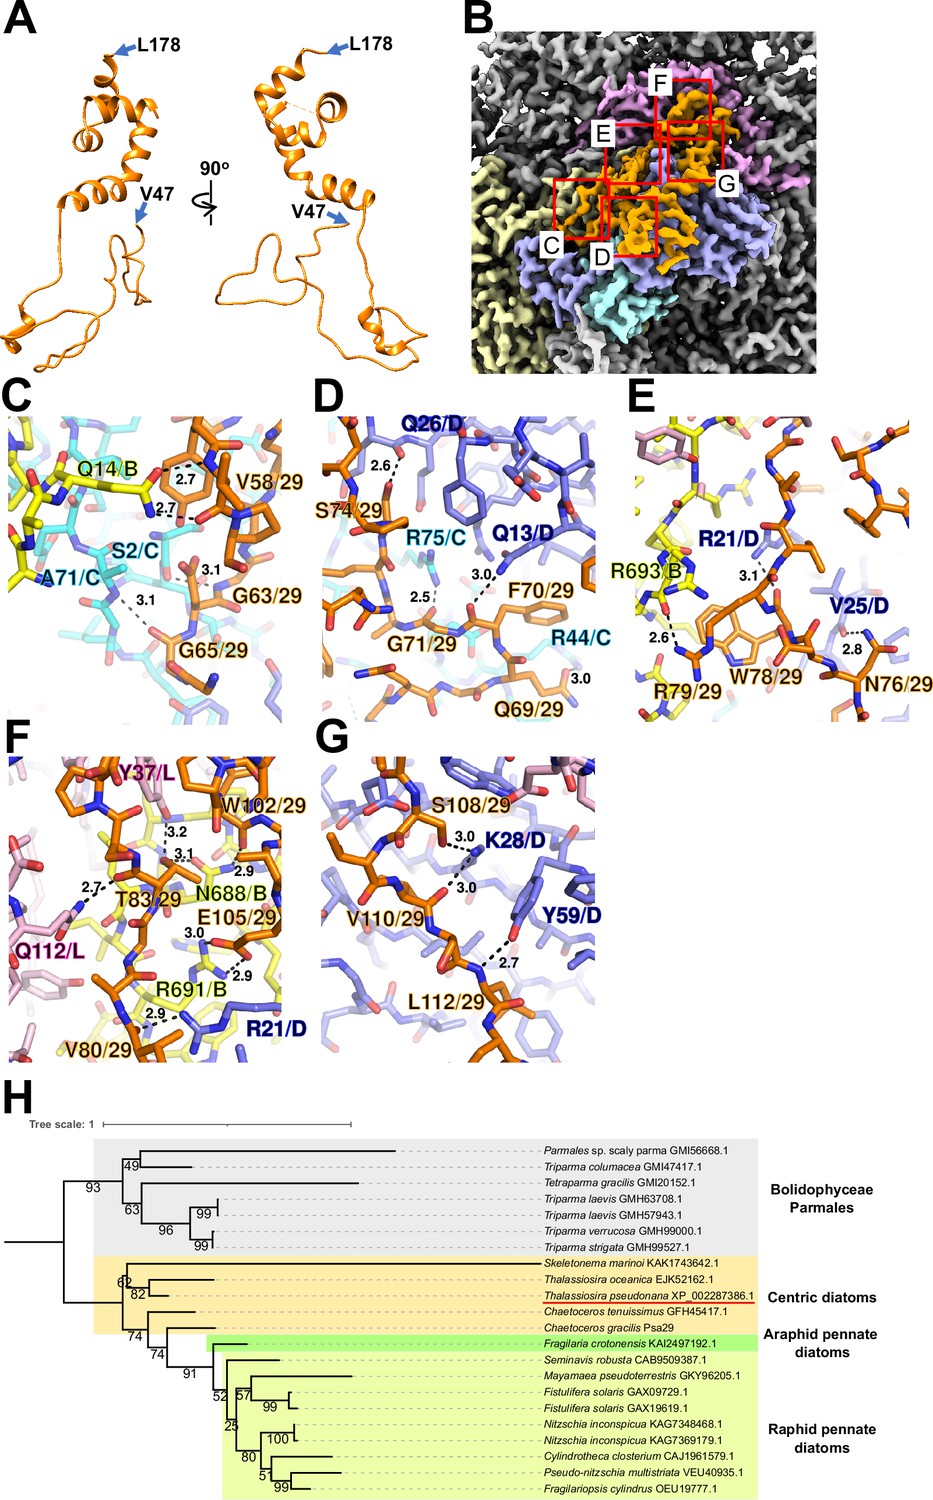
Structure and diversity of Psa29.
(A) Structure of Psa29 depicted as cartoons. Psa29 was modeled from V47 to L178. (B) Cryo-electron microscopy (Cryo-EM) map of Psa29 and its surrounding environment, viewed from the stromal side. The red-squared areas are enlarged in panels (C) - (G). Yellow, PsaB; cyan, PsaC; blue, PsaD; magenta, PsaL; orange, Psa29. Protein–protein interactions of Psa29 with PsaB/PsaC (C), PsaC/PsaD (D), PsaB/PsaD (E), PsaB/PsaD/PsaL (F), and PsaD (G). Interactions are indicated by dashed lines, and the numbers are distances in Å. Amino acid residues participating in the interactions are labeled; for example, A71/C indicates Ala71 of PsaC. B, PsaB; C, PsaC; D, PsaD, L, PsaL; 29, Psa29. (H) Phylogenetic analysis of Psa29 in photosynthetic organisms. A maximum-likelihood tree of Psa29 proteins was inferred using IQ-TREE v2.2.2.7 with the WAG+F+G4 model and a trimmed alignment of 22 sequences comprising 245 amino acid residues. Numbers at the nodes represent ultrafast bootstrap support (%) (1000 replicates). The tree was mid-point rooted between diatoms and Bolidophyceae Parmales. Psa29 of T. pseudonana CCMP1335 is indicated by a red underline.
Figure 3 with 1 supplement
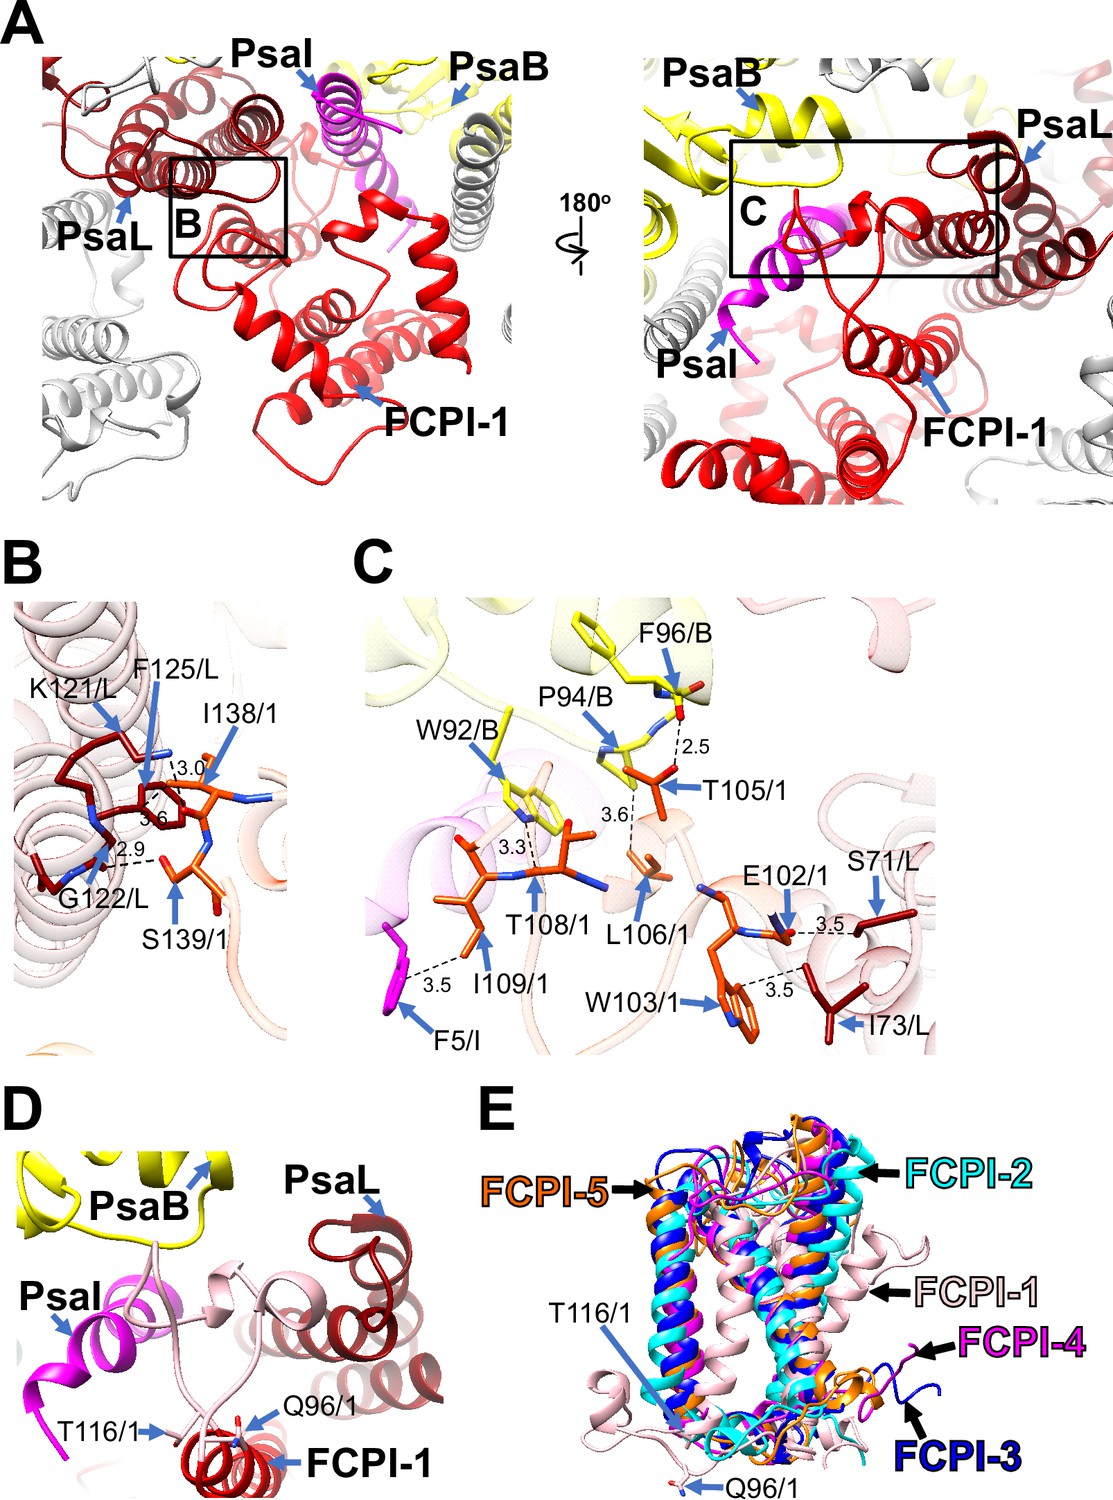
Structural characteristics of FCPI-1 (RedCAP).
(A) Interactions of FCPI-1 with PsaB, PsaI, and PsaL viewed from the stromal (left) and lumenal (right) sides. The areas encircled by black squares are enlarged in panels (B) and (C). Yellow, PsaB; magenta, PsaI; dark red, PsaL; red, FCPI-1. Protein–protein interactions of FCPI-1 with PsaL (B) and with PsaB/PsaI/PsaL (C). Interactions are indicated by dashed lines, and the numbers are distances in Å. Amino acid residues involved in the interactions are labeled; for example, S139/1 indicates Ser139 of FCPI-1. B, PsaB; I, PsaI; L, PsaL; 1, FCPI-1. (D) Characteristic loop structure from Q96 to T116 in FCPI-1, viewed from the lumenal side. Q96 and T116 are labeled with sticks, and the Q96–T116 loop is colored pink. (E) Superpositions of FCPI-1 with FCPI-2, FCPI-3, FCPI-4, and FCPI-5. Only proteins are depicted. Q96 and T116 in the Q96–T116 loop of FCPI-1 are shown with sticks.
Figure 3—figure supplement 1
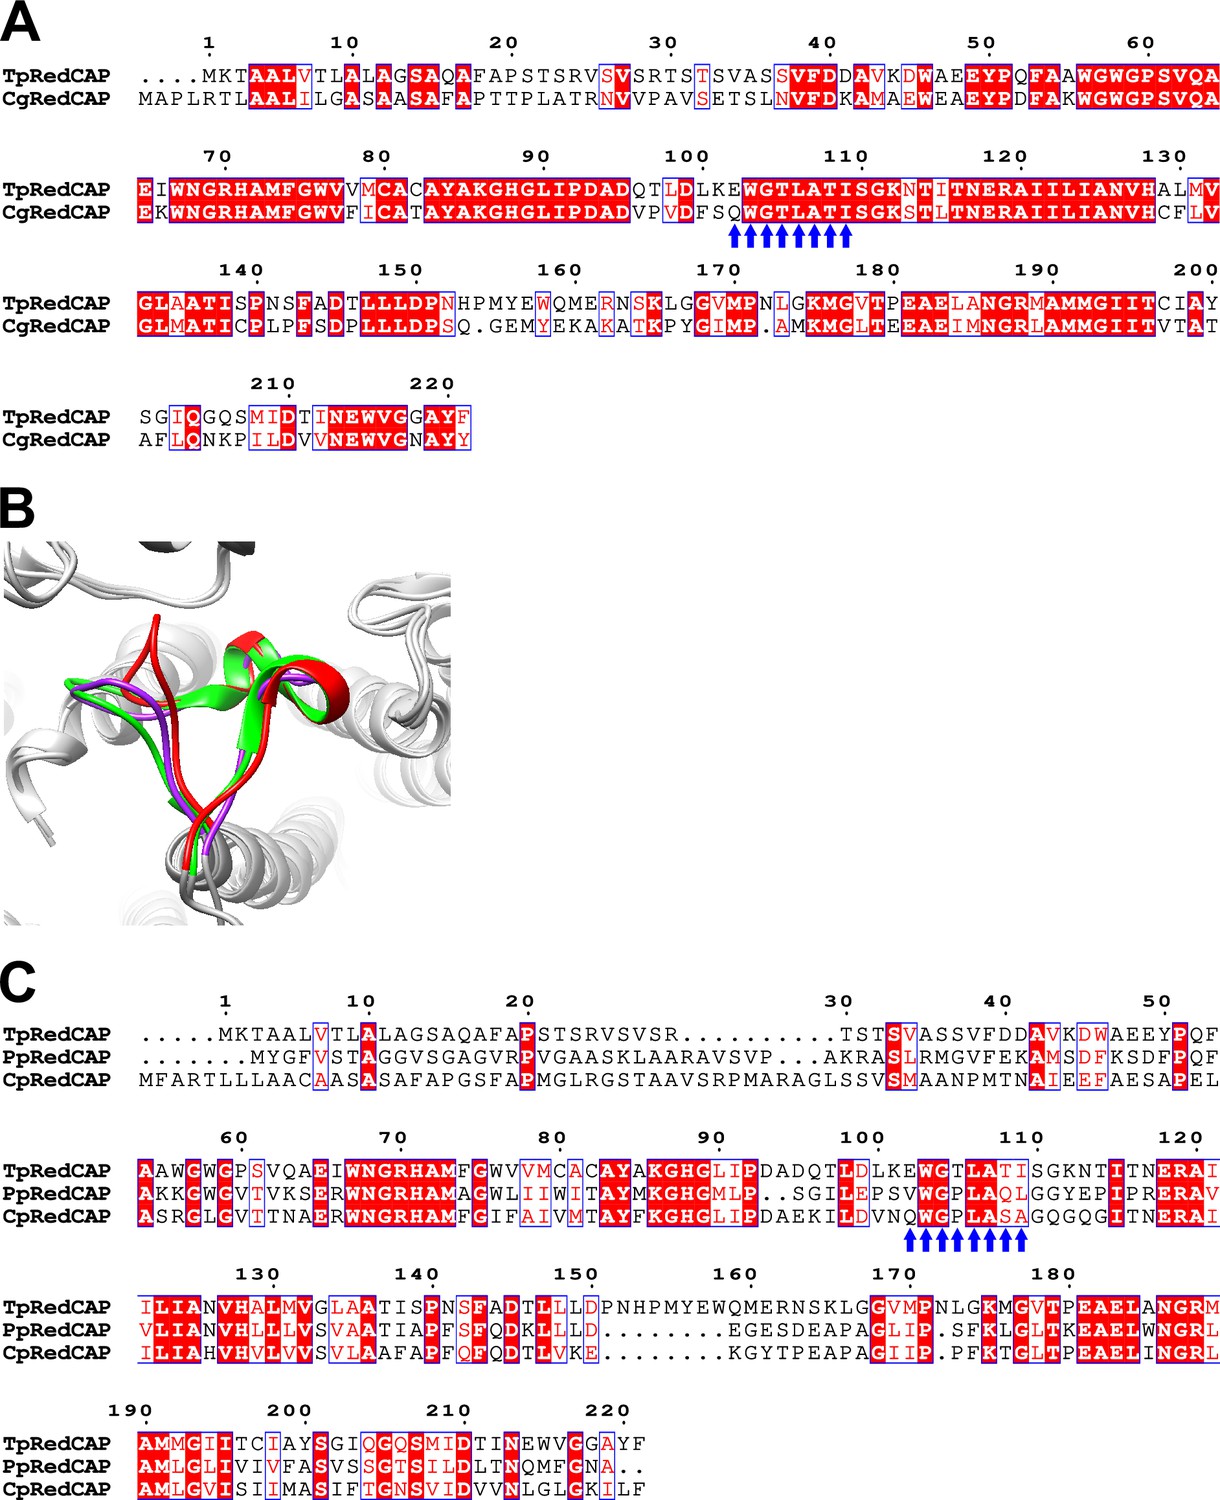
Characteristics of the sequences and structures of RedCAPs in the red-lineage algae.
(A) Sequence alignment of RedCAP of T. pseudonana (TpRedCAP) with that of C. gracilis CgRedCAP using ClustalW (https://www.genome.jp/tools-bin/clustalw) and ESPript. Blue arrows indicate characteristic protein motifs (see text). (B) Structural comparisons of the Q96–T116 loop of TpRedCAP (red) with the corresponding loop of RedCAPs of P. purpureum (PpRedCAP; purple) (PDB: 7Y5E) and C. placoidea (CpRedCAP; green) (PDB: 7Y7B), viewed from the stromal side. (C) Multiple sequence alignment of TpRedCAP with PpRedCAP and CpRedCAP. Blue arrows indicate characteristic protein motifs (see text).
Figure 4 with 1 supplement
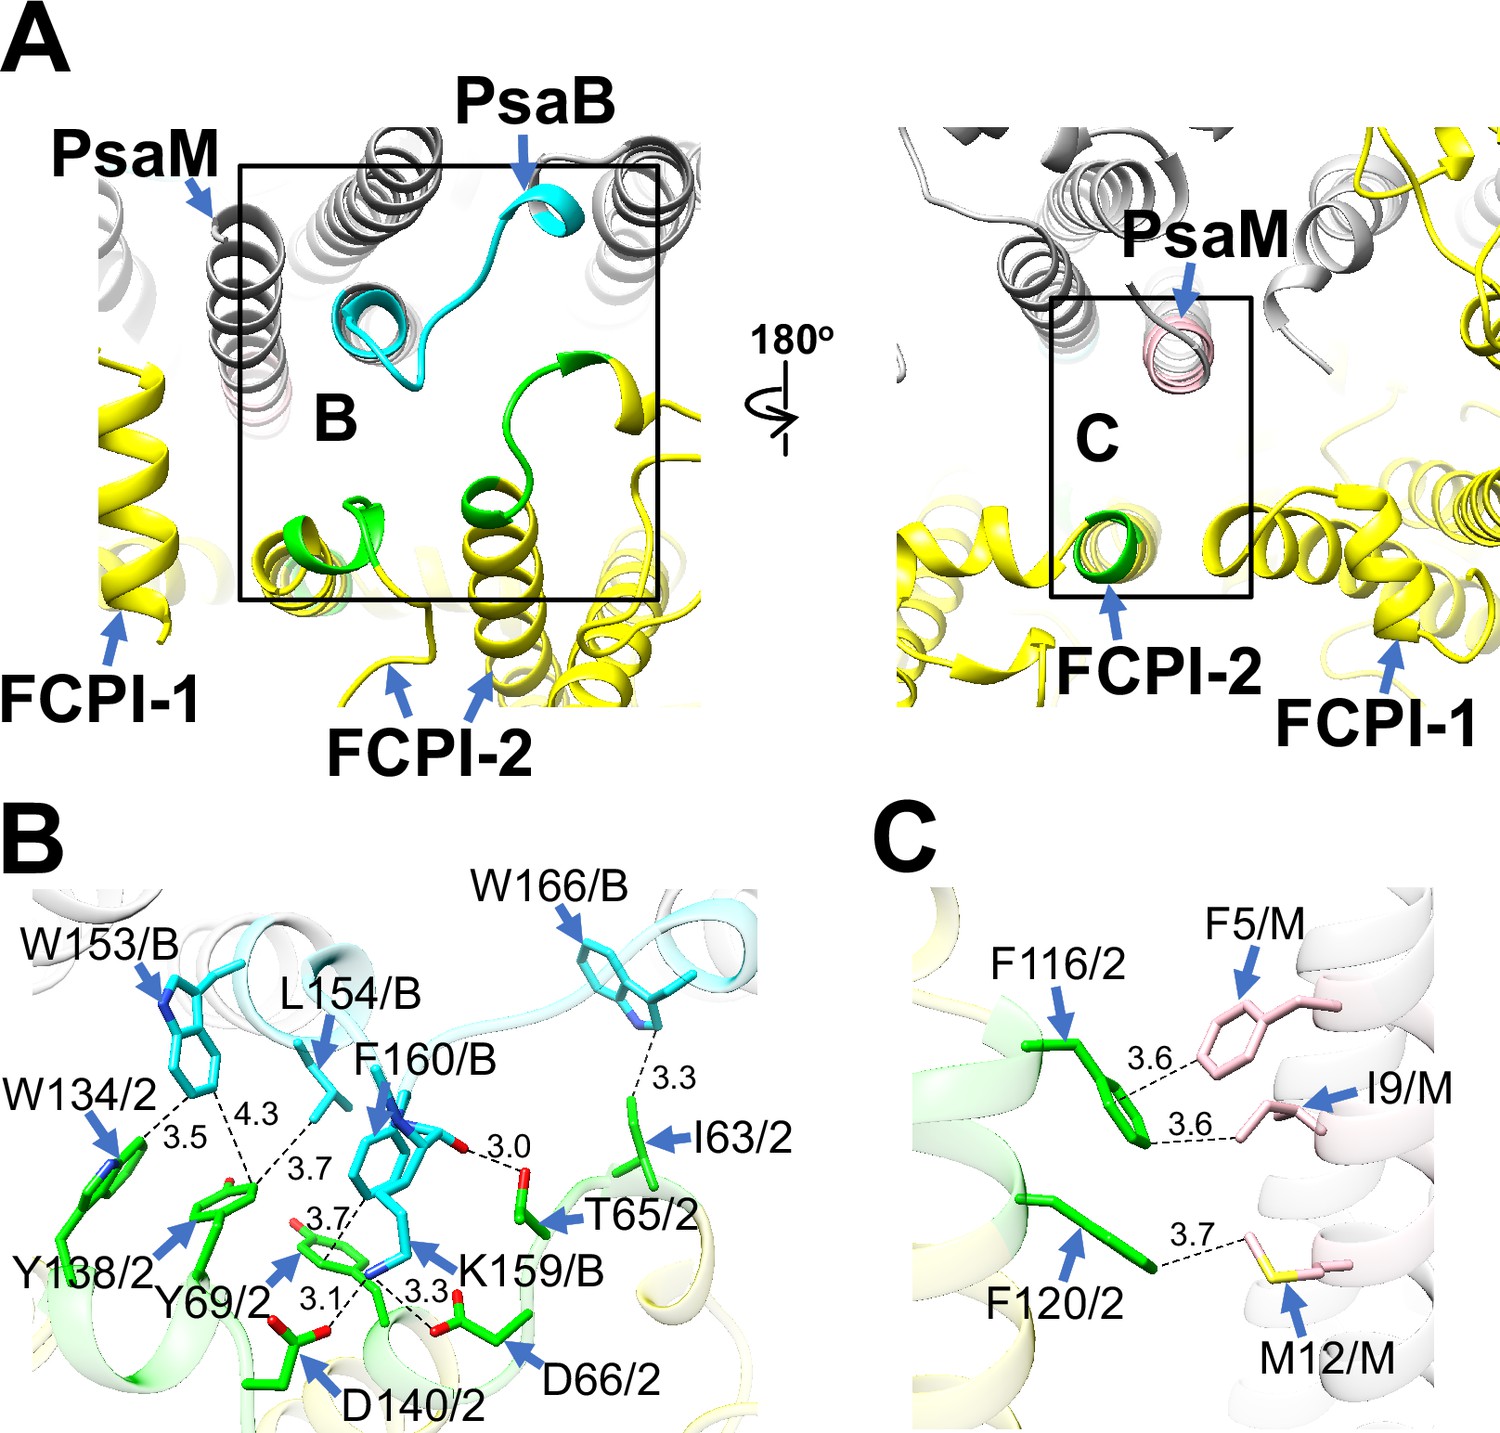
Structural characteristics of FCPI-2.
(A) Interactions of FCPI-2 with PsaB and PsaM viewed from the stromal (left) and lumenal (right) sides. The areas encircled by black squares are enlarged in panels (B) and (C). PSI subunits are colored gray, and FCPI subunits are colored yellow. Protein–protein interactions are shown in different colors: green, FCPI-2; cyan, PsaB; pink, PsaM. Protein–protein interactions of FCPI-2 with PsaB (B) and PsaM (C). Interactions are indicated by dashed lines, and the numbers represent distances in Å. Amino acid residues involved in the interactions are labeled; for example, Y138/2 indicates Tyr138 of FCPI-2. B, PsaB; M, PsaM; 2, FCPI-2.
Figure 4—figure supplement 1
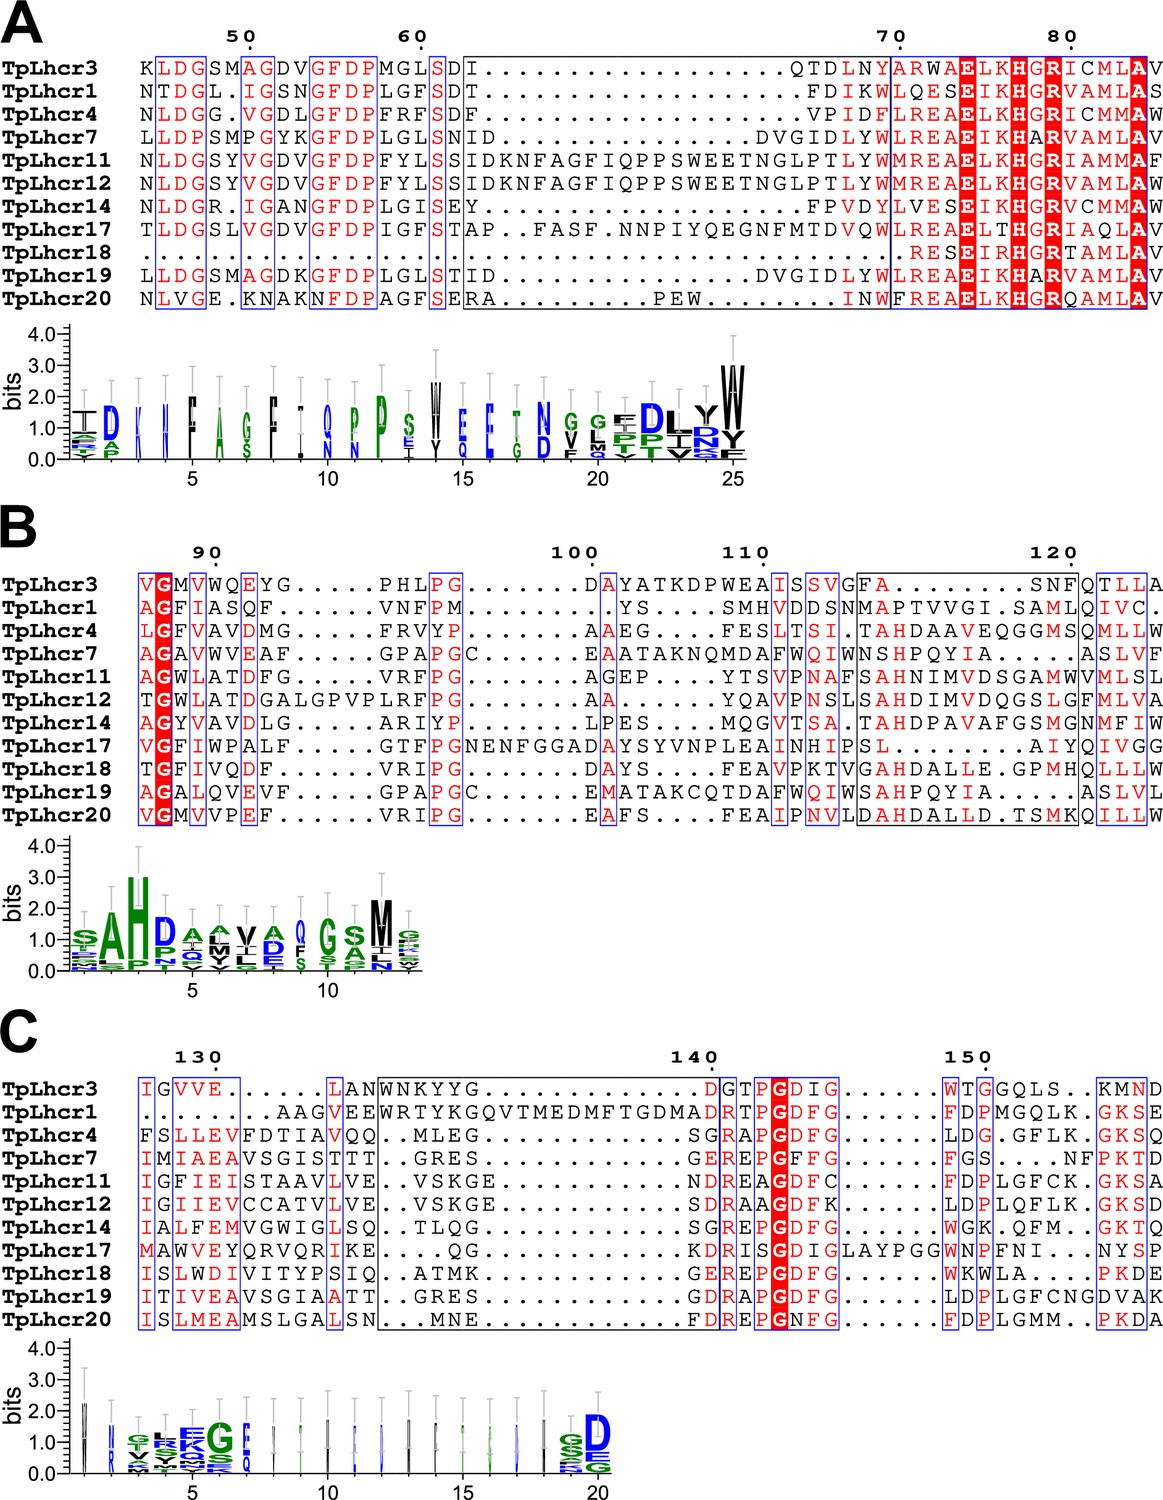
Comparisons of the sequence of Lhcr3 (FCPI-2) with those of the Lhcr subfamily in T. pseudonana.
Multiple sequence alignment of Lhcr3 of T. pseudonana (TpLhcr3) with the Lhcr subfamily (upper half of panels (A) - (C)). Amino acid residues I63–Y69 (A), F116–F120 (B), and W134–D140 (C) in Lhcr3, along with their corresponding residues in other Lhcrs, are highlighted with black boxes, and the consensus is displayed as sequence logos (lower half of each panel). Amino acid sequences were aligned using MAFFT E-INS-i v7.520 (https://mafft.cbrc.jp/alignment/software/). Sequence logos were generated by WebLogo v3.7.12 (https://weblogo.threeplusone.com/).
Figure 5 with 3 supplements
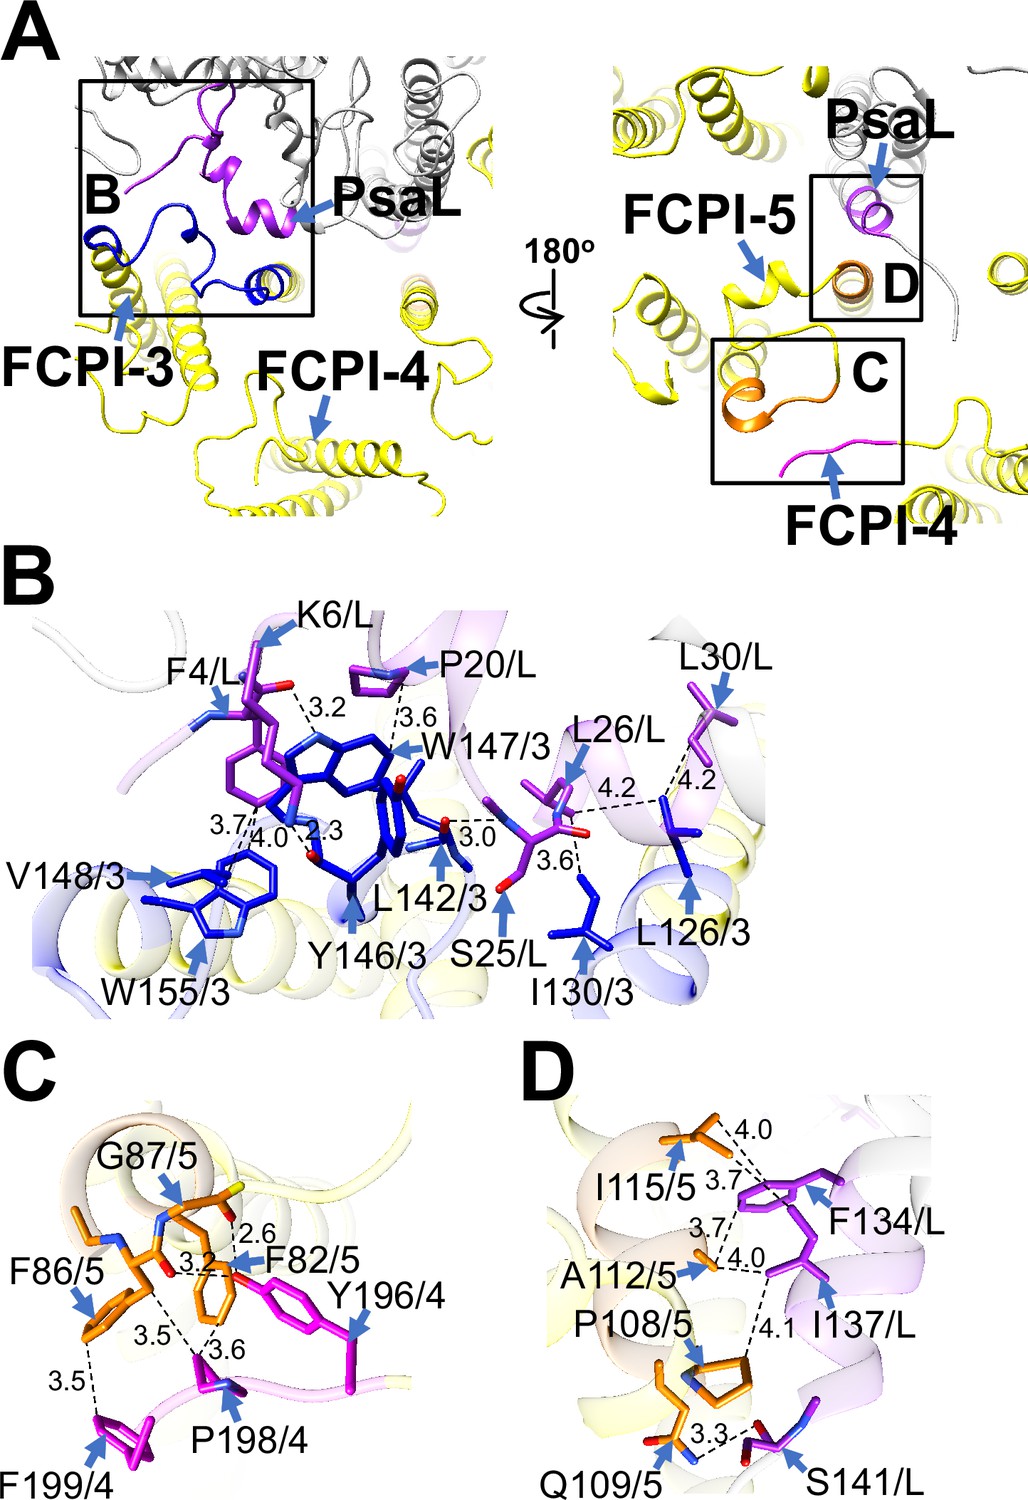
Structural characteristics of FCPI-3, 4, and 5.
(A) Interactions among FCPIs and between FCPIs and PsaL, viewed from the stromal (left) and lumenal (right) sides. The areas encircled by black squares are enlarged in panels (B)-(D). Photosystem I (PSI) subunits are colored gray, and FCPI subunits are colored yellow. Protein–protein interactions are shown in different colors: blue, FCPI-3; magenta, FCPI-4; orange, FCPI-5; purple, PsaL. Protein–protein interactions between FCPI-3 and PsaL (B), between FCPI-4 and FCPI-5 (C), and between FCPI-5 and PsaL (D). Interactions are indicated by dashed lines, and the numbers represent distances in Å. Amino acid residues involved in the interactions are labeled; for example, L126/3 indicates Leu126 of FCPI-3. L, PsaL; 3, FCPI-3; 4, FCPI-4; 5, FCPI-5.
Figure 5—figure supplement 1
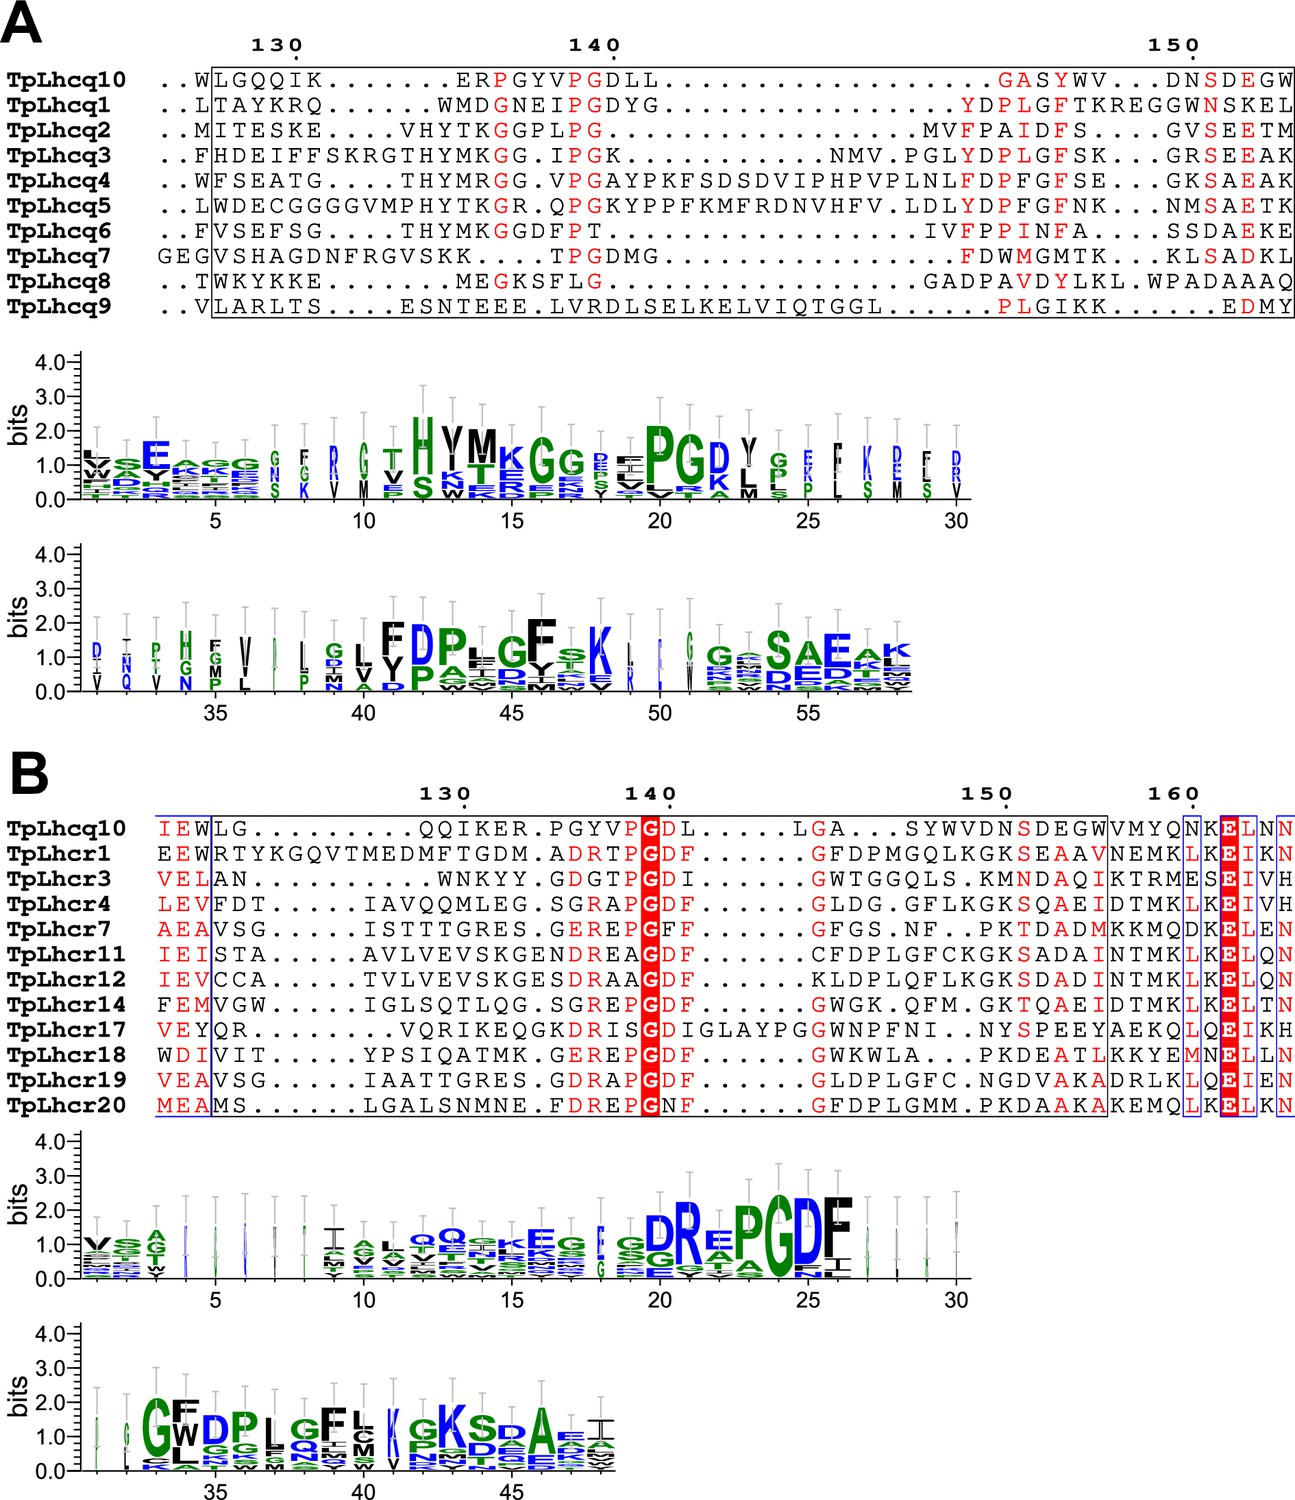
Comparisons of the sequence of Lhcq10 (FCPI-3) with those of the Lhcq and Lhcr subfamilies in T.pseudonana.
Multiple sequence alignments of Lhcq10 of T. pseudonana (TpLhcq10) with the Lhcq and Lhcr subfamilies (upper half of panels (A) and (B), respectively). Amino acid residues L126–W155 in Lhcq10, along with their corresponding residues in other Lhcqs and Lhcrs, are highlighted with black boxes, and the consensus is displayed as sequence logos (lower half of each panel). Amino acid sequences were aligned using MAFFT E-INS-i v7.520. Sequence logos were generated by WebLogo v3.7.12.
Figure 5—figure supplement 2
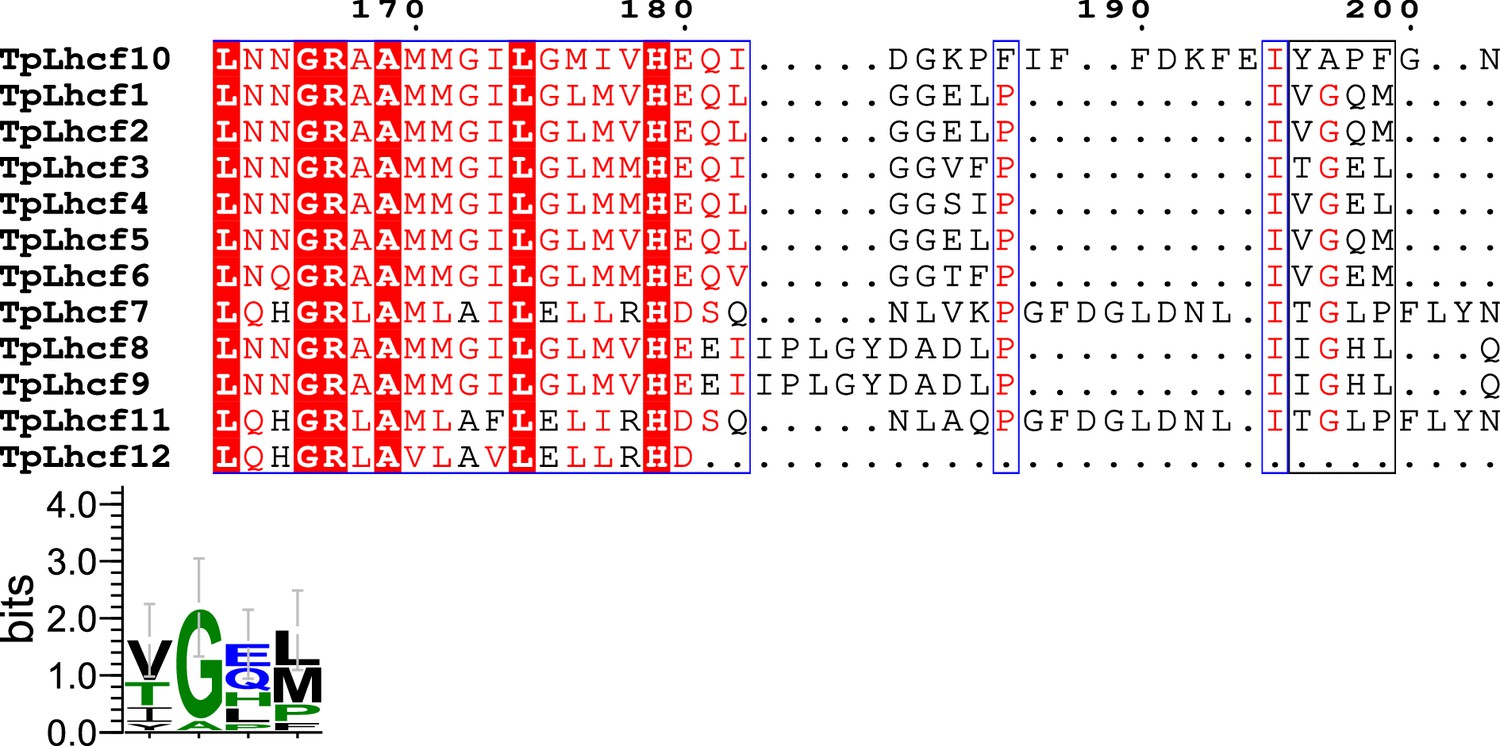
Comparisons of the sequence of Lhcf10 (FCPI-4) with those of the Lhcf subfamily in T. pseudonana.
Multiple sequence alignment of Lhcf10 of T. pseudonana (TpLhcf10) with the Lhcf subfamily (upper). Amino acid residues Y196–F199 in Lhcf10, along with their corresponding residues in other Lhcfs, are highlighted with a black box, and the consensus is displayed as sequence logos (lower). Amino acid sequences were aligned using MAFFT E-INS-i v7.520. Sequence logos were generated by WebLogo v3.7.12.
Figure 5—figure supplement 3
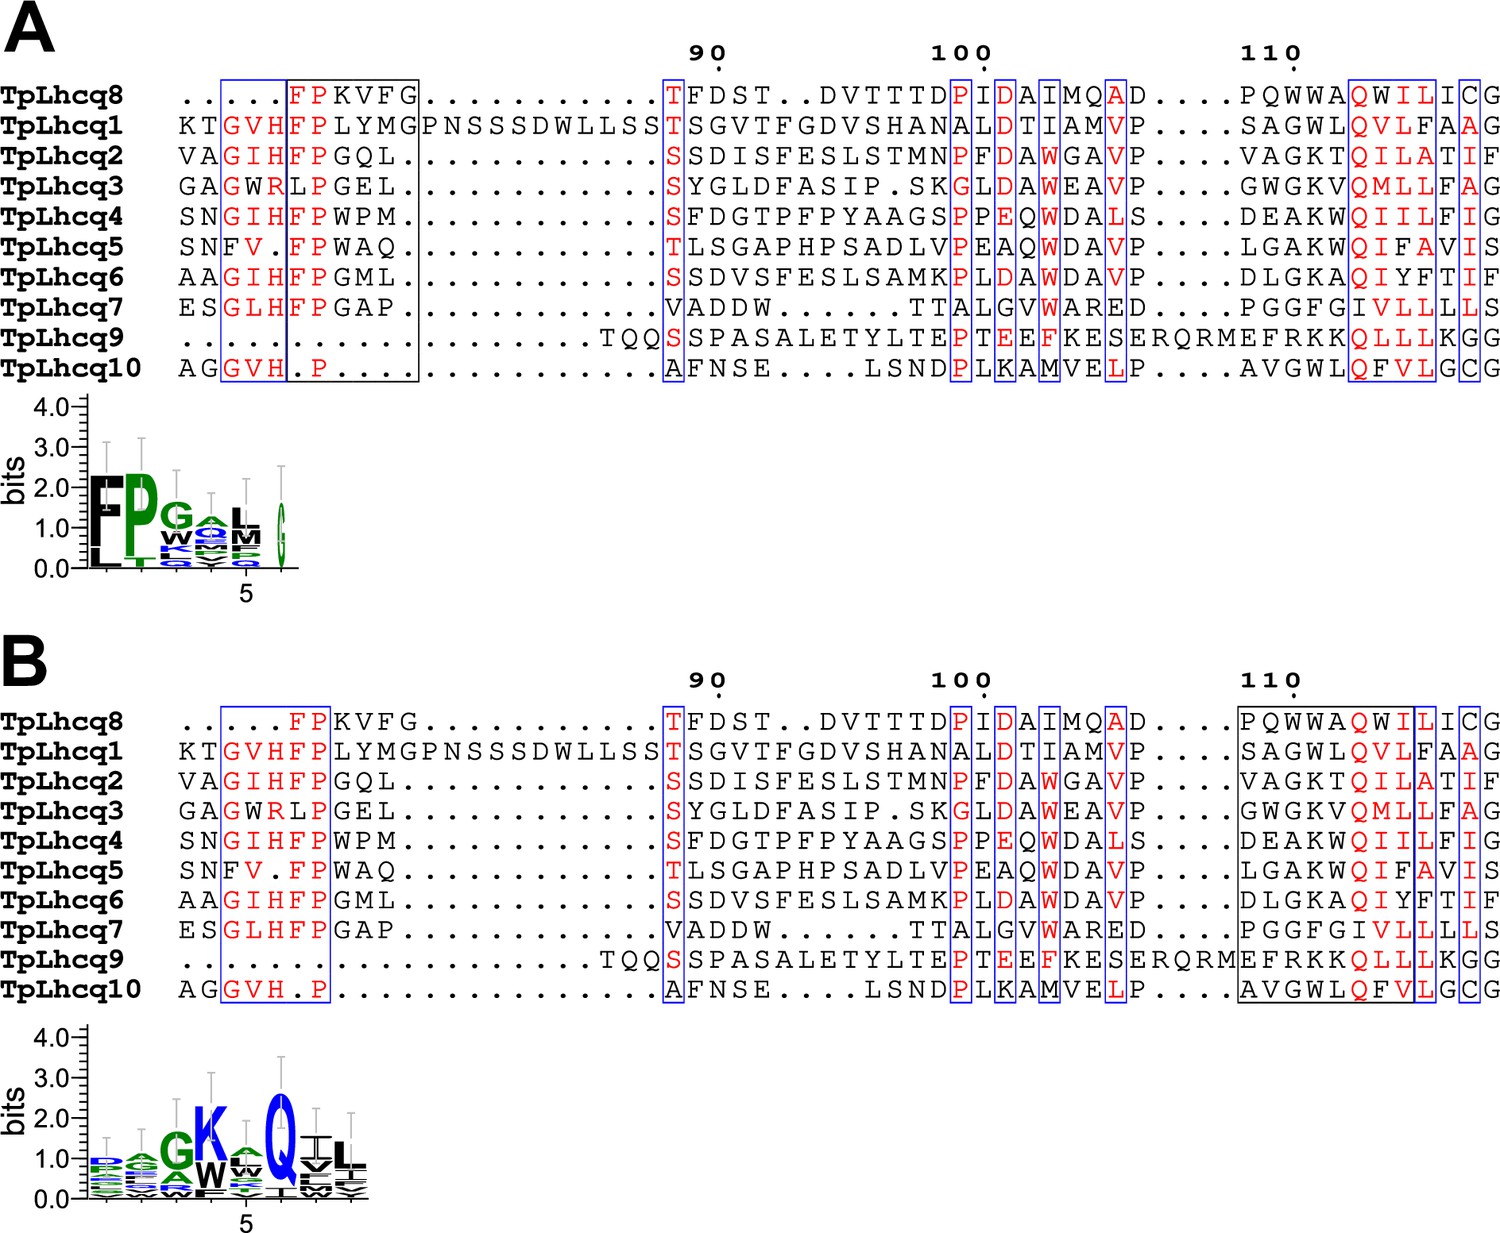
Comparisons of the sequence of Lhcq8 (FCPI-5) with those of the Lhcq subfamily in T. pseudonana.
Multiple sequence alignment of Lhcq8 of T. pseudonana (TpLhcq8) with the Lhcq subfamily upper half of panels (A) and (B). Amino acid residues F82–G87 and P107–I115 in Lhcq8, along with their corresponding residues in other Lhcqs, are highlighted with black boxes, and the consensus is displayed as sequence logos (lower half of each panel). Amino acid sequences were aligned using MAFFT E-INS-i v7.520. Sequence logos were generated by WebLogo v3.7.12.
Figure 6 with 2 supplements
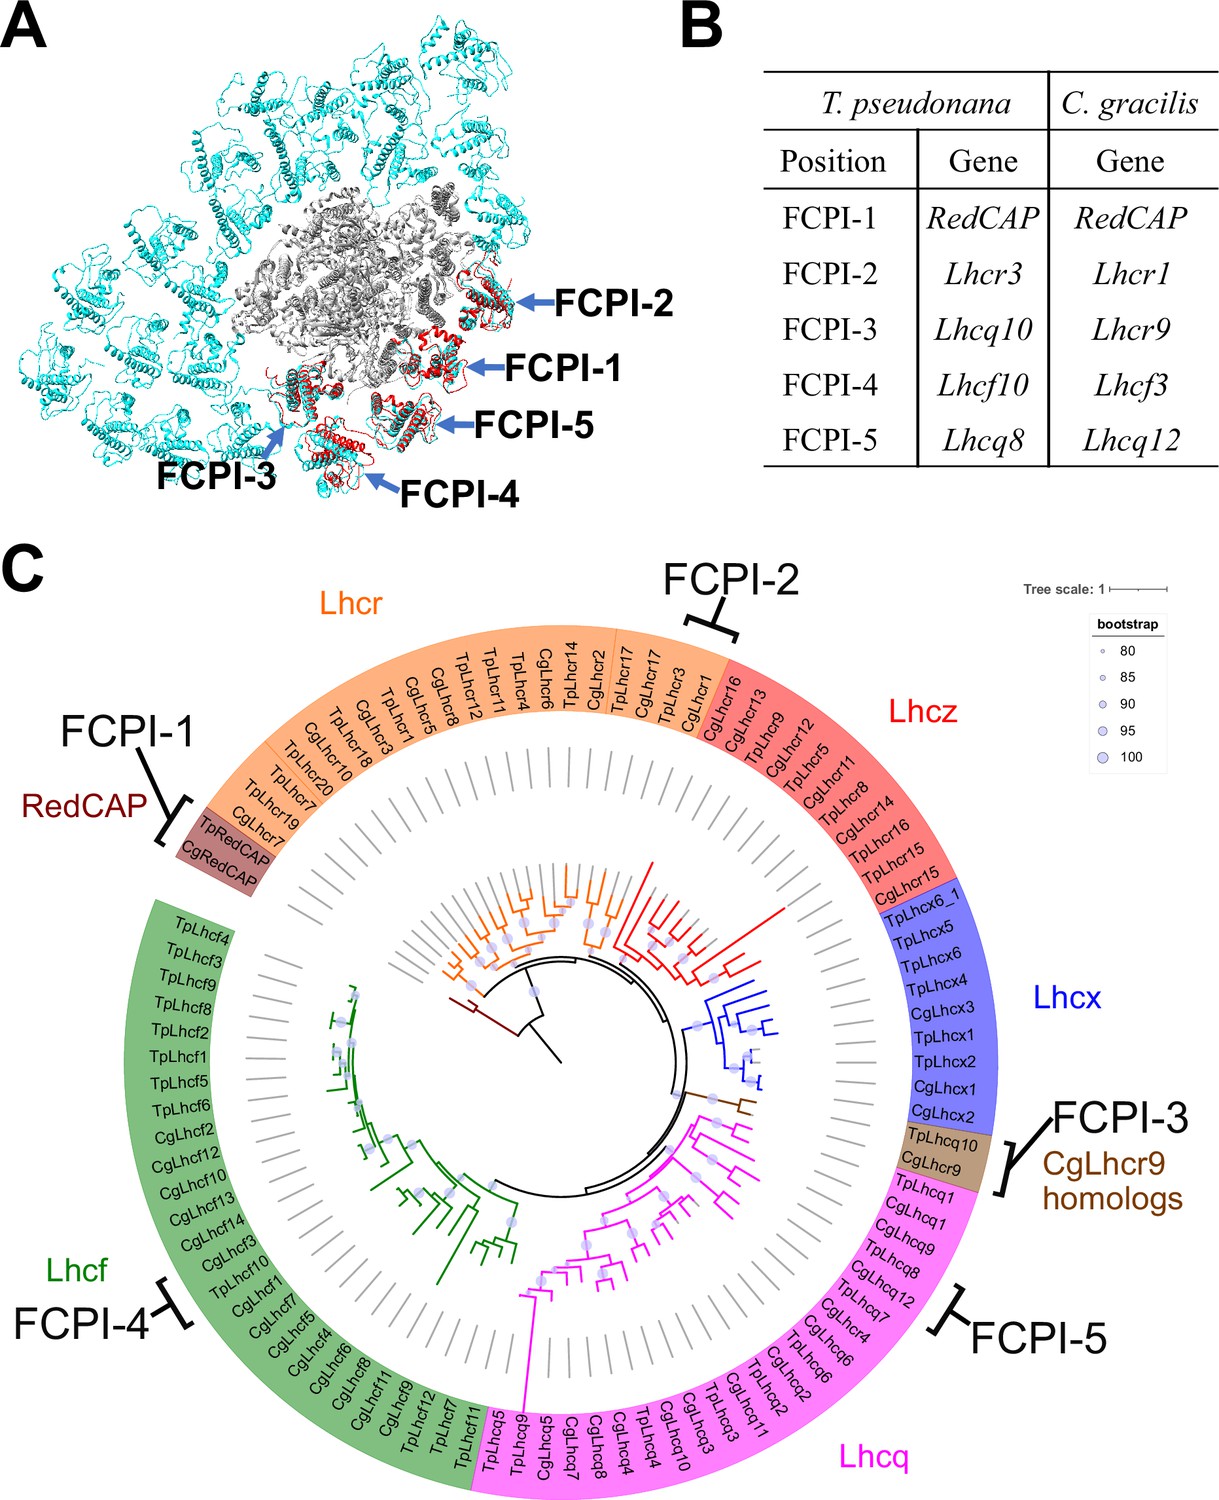
Comparisons of structures and sequences of FCPIs in the PSI-FCPI structures between T. pseudonana and C. gracilis.
(A) Superposition of the PSI-FCPI structures between T. pseudonana and C. gracilis (PDB: 6LY5). FCPI subunits from T. pseudonana and C. gracilis are colored red and cyan, respectively. The structures are viewed from the stromal side. The FCPI-1–5 sites are labeled. (B) Correlation of the names of FCPIs in the structures with their corresponding genes between T. pseudonana and C. gracilis. The FCPI genes are derived from Kumazawa et al., 2022 and Kato et al., 2024 for C. gracilis. (C) Phylogenetic analysis of FCPs and RedCAPs from T. pseudonana (Tp) and C. gracilis (Cg). In addition to the RedCAP family, 44 TpFCPs and 46 CgFCPs are grouped into five Lhc subfamilies and CgLhcr9 homologs. Maroon, RedCAP family; magenta, Lhcq subfamily; red, Lhcz subfamily; orange, Lhcr subfamily; brown, CgLhcr9 homologs; green, Lhcf subfamily; blue, Lhcx subfamily. The FCPs and RedCAPs located at the FCPI-1–5 sites are labeled. The tree was inferred using IQ-TREE 2 (Minh et al., 2020) with the Q.pfam + R4 model selected by ModelFinder (Kalyaanamoorthy et al., 2017). The light purple circular symbols on the tree represent bootstrap support (%).
Figure 6—figure supplement 1
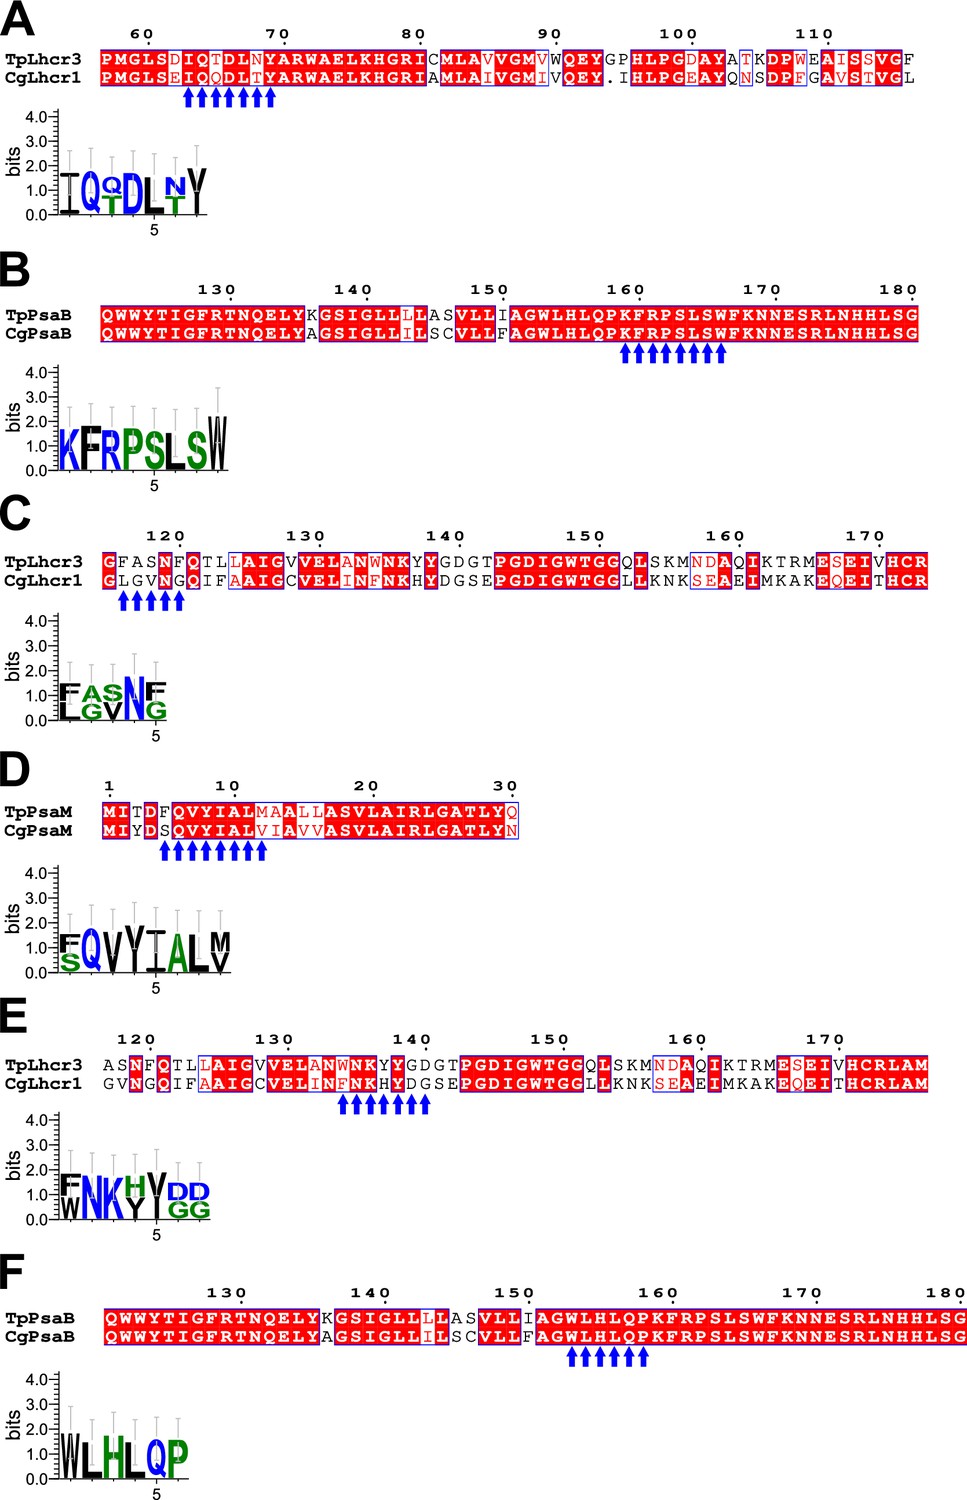
Comparisons of amino acid sequences between FCPs and photosystem I (PSI) proteins at the FCPI-2 site in the T. pseudonana PSI-FCPI structure.
Sequence alignments between TpLhcr3 and Lhcr1 of C. gracilis (CgLhcr1) upper half of panels (A), (C), and (E), between TpPsaB and CgPsaB upper half of panels (B) and (F), and between TpPsaM and CgPsaM (upper half of panel (D)). Blue arrows indicate protein motifs involved in protein–protein interactions between TpLhcr3/CgLhcr1 and PsaB (A, B), between TpLhcr3/CgLhcr1 and PsaM (C, D), and between TpLhcr3/CgLhcr1 and PsaB (E, F), and the consensus is displayed as sequence logos (lower half of each panel). Amino acid sequences were aligned using MAFFT E-INS-i v7.520. Sequence logos were generated by WebLogo v3.7.12.
Figure 6—figure supplement 2
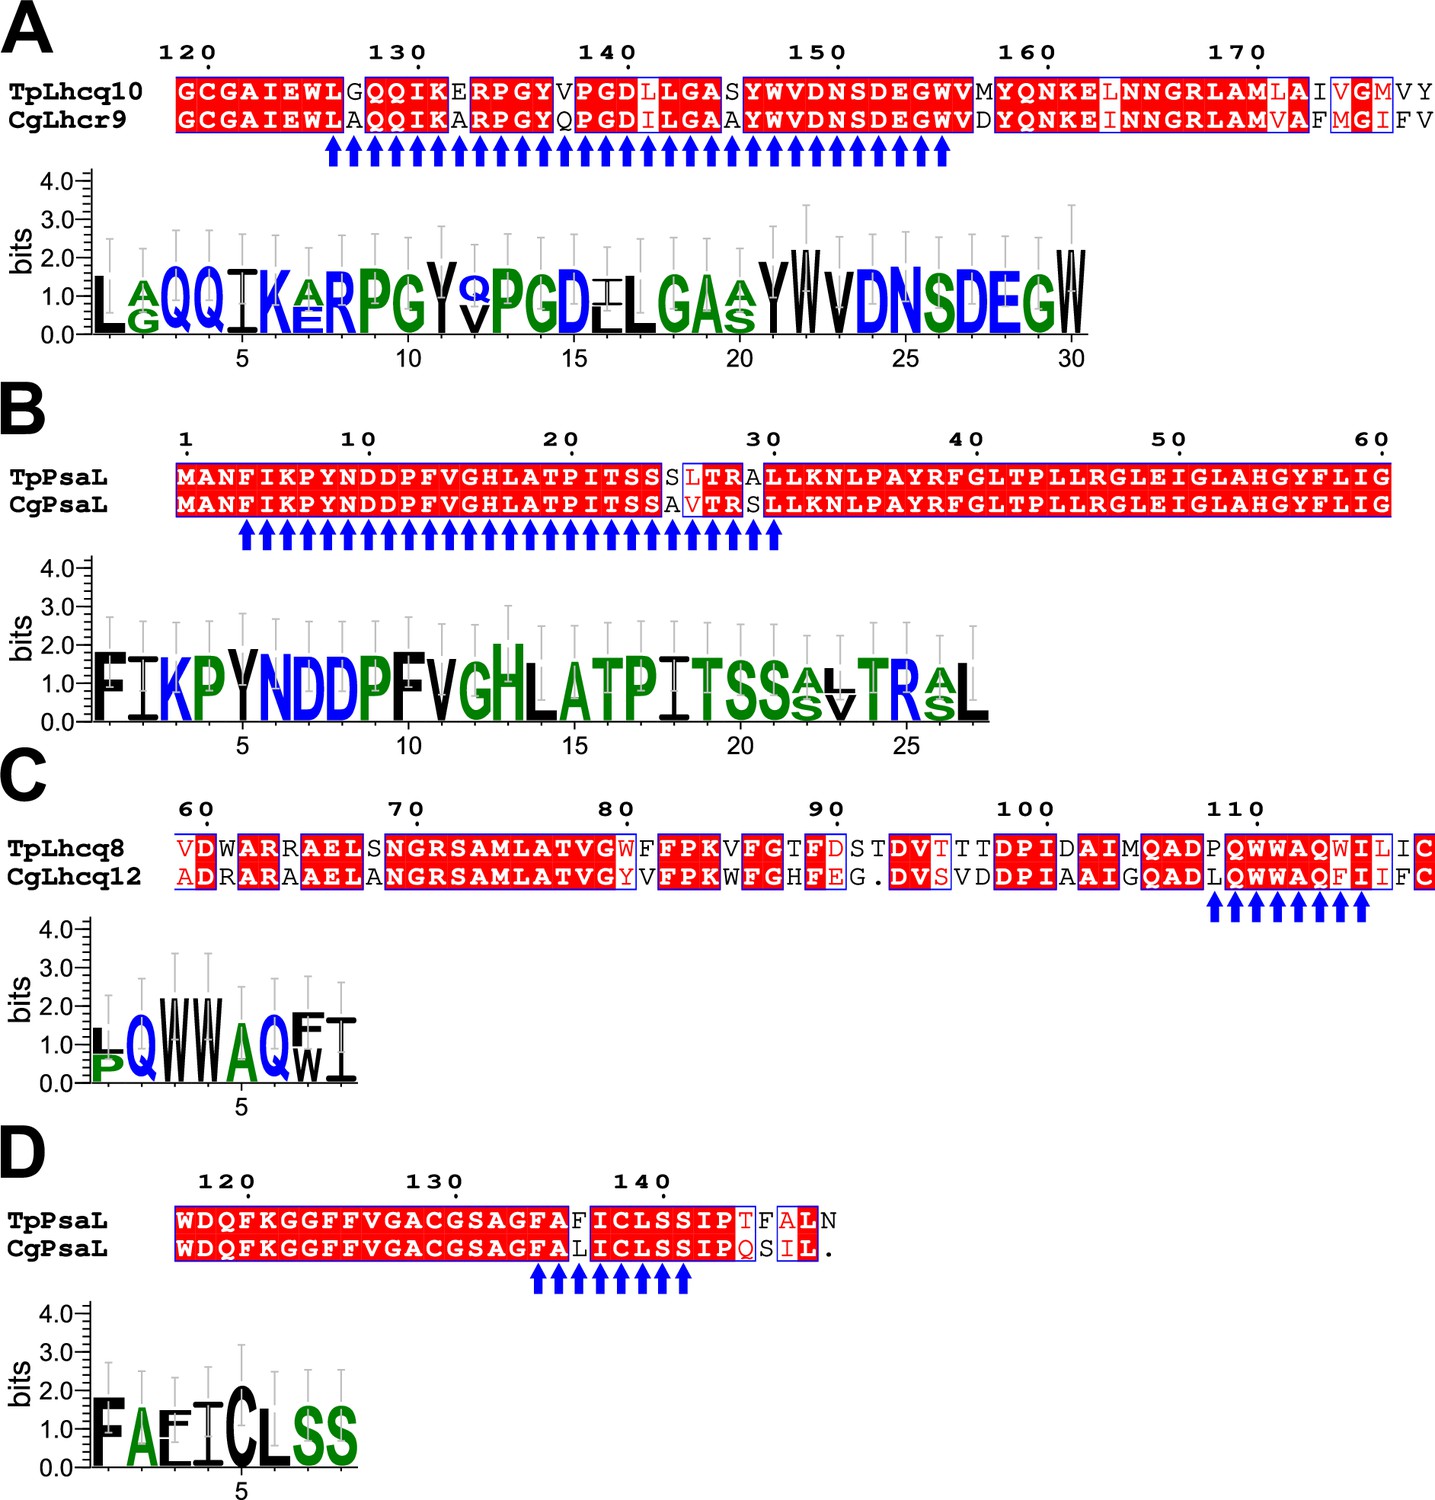
Comparisons of amino acid sequences between FCPs and PsaL proteins at the FCPI-3 and FCPI-5 sites in the T. pseudonana PSI-FCPI structure.
Sequence alignments between TpLhcq10 and CgLhcr9 (upper half of panel (A)), between TpPsaL and CgPsaL upper half of panels (B) and (D), and between TpLhcq8 and CgLhcq12 (upper half of panel (C)). Blue arrows indicate protein motifs involved in protein–protein interactions between TpLhcq10/CgLhcr9 and PsaL (A, B) and between TpLhcq8/CgLhcq12 and PsaL (C, D), and the consensus is displayed as sequence logos (lower half of each panel). Amino acid sequences were aligned using MAFFT E-INS-i v7.520. Sequence logos were generated by WebLogo v3.7.12.
Author response image 1

Tables
Table 1
Cryo-electron microscopy (cryo-EM) data collection and structural analysis statistics.
| Complex | PSI-FCPI |
|---|---|
| PDB ID | 8XLS |
| EMDB ID | EMD-38457 |
| Data collection and processing | |
| Magnification | 60,000 |
| Voltage (kV) | 300 |
| Electron exposure (e−/Å) | 50 |
| Defocus range (μm) | −1.8 to −1.2 |
| Pixel size (Å) | 0.752 |
| Symmetry imposed | C1 |
| Initial particle images (no.) | 2,733,572 |
| Final particle images (no.) | 75,667 |
| Map resolution (Å) | 2.30 |
| FSC threshold | 0.143 |
| Refinement | |
| Initial model used | De novo model building |
| Model resolution (Å) | 2.25 |
| FSC threshold | 0.5 |
| Map sharpening B factor (Å2) | −36.0 |
| Model composition | |
| Non-hydrogen atoms | 37,640 |
| Protein residues | 3129 |
| Ligand molecules | 372 |
| Water molecules | 922 |
| B factors (Å2) | |
| Protein | 59.2 |
| Ligand | 71.9 |
| Water | 54.7 |
| R.m.s. deviations | |
| Bond lengths (Å) | 0.025 |
| Bond angles (°) | 2.46 |
| Validation | |
| MolProbity score | 1.98 |
| Clashscore | 11.8 |
| Poor rotamers (%) | 3.04 |
| EMRinger score | 5.70 |
| Ramachandran plot | |
| Favored (%) | 97.90 |
| Allowed (%) | 2.07 |
| Disallowed (%) | 0.03 |
Table 2
Averaged Q-scores in each subunit.
| Subunit | Averaged Q-score | |
|---|---|---|
| Postprocessed map | Denoised map | |
| PsaA | 0.84 | 0.83 |
| PsaB | 0.84 | 0.83 |
| PsaC | 0.87 | 0.85 |
| PsaD | 0.83 | 0.83 |
| PsaE | 0.80 | 0.80 |
| PsaF | 0.81 | 0.81 |
| PsaI | 0.83 | 0.82 |
| PsaJ | 0.81 | 0.81 |
| PsaL | 0.83 | 0.83 |
| PsaM | 0.83 | 0.82 |
| Psa29 | 0.65 | 0.70 |
| Unknown | 0.45 | 0.55 |
| FCPI-1 | 0.76 | 0.78 |
| FCPI-2 | 0.67 | 0.72 |
| FCPI-3 | 0.74 | 0.76 |
| FCPI-4 | 0.77 | 0.79 |
| FCPI-5 | 0.74 | 0.76 |
Table 3
Cofactors assigned in each subunit of the PSI-FCPI structure.
| Protein | Chlorophyll | Carotenoid | Lipid | Other |
|---|---|---|---|---|
| PsaA | 43 Chl a 1 Chl a′ | 5 BCR | 2 LHG | 1 [4Fe-4S] cluster 1 phylloquinone |
| PsaB | 41 Chl a | 5 BCR | 1 LHG 1 DGD | 1 phylloquinone |
| PsaC | - | - | - | 2 [4Fe-4S] cluster |
| PsaD | - | - | - | - |
| PsaE | - | - | - | - |
| PsaF | 3 Chl a | 1 BCR | - | - |
| PsaI | 1 Chl a | 1 BCR | - | - |
| PsaJ | 1 Chl a | 1 BCR 1 ZXT | - | - |
| PsaL | 3 Chl a | 3 BCR | 1 LMG | - |
| PsaM | - | 1 BCR | 1 LHG | - |
| Psa29 | - | - | - | - |
| Unknown | 1 Chl a | 1 BCR | - | - |
| FCPI-1 | 7 Chl a 1 Chl c | 2 BCR 2 Fx 3 Ddx | 1 LHG | - |
| FCPI-2 | 10 Chl a 1 Chl c | 3 Fx 1 Ddx | - | - |
| FCPI-3 | 7 Chl a 3 Chl c | 2 Fx 2 Ddx | 1 LHG | - |
| FCPI-4 | 11 Chl a 2 Chl c | 4 Fx | 1 LHG | - |
| FCPI-5 | 10 Chl a | 4 Fx 1 Ddx | - | - |
| Total | 146 | 43 | 9 | 5 |
-
BCR, β-carotene; ZXT, zeaxanthin; Fx, fucoxanthin; Ddx, diadinoxanthin; Chl a, chlorophyll a; Chl a′, chlorophyll a epimer; Chl c, chlorophyll c; DGD, digalactosyl diacyl glycerol; LHG, dipalmitoyl phosphatidyl glycerol; LMG, distearoyl monogalactosyl diglyceride.
Table 4
FCPI proteins identified in the PSI-FCPI structure, their corresponding genes, and their root mean square deviation (RMSD) values compared with the FCPI-4 structure.
| Protein | Gene | RMSD (Å)/aligned Cα atoms |
|---|---|---|
| FCPI-1 | RedCAP | 3.73/95 |
| FCPI-2 | Lhcr3 | 2.01/139 |
| FCPI-3 | Lhcq10 | 2.02/139 |
| FCPI-4 | Lhcf10 | 0.00/167 |
| FCPI-5 | Lhcq8 | 1.91/128 |
Table 5
Chls and their ligands in each of the FCPI subunits.
| Protein | Chlorophyll/ligand |
|---|---|
| FCPI-1 | a301/E65, a302/N68, c304/H128, a305/H71, a306/E183, a308/N186, a311/w982*, a317/W215 |
| FCPI-2 | a301/E74, a302/H77, a303/Q91, a304/Q121, a305/E130, a306/E168, c307/-†, a308/H171, a309/Q185, a318/S35, a319/H184 |
| FCPI-3 | a301/E68, a302/N71, a303/w977*, c304/Q115, a305/E124, a306/E162, c307/w976*, a308/N165, a309/w978*, c310/D188 |
| FCPI-4 | a301/E67, c302/H70, a303/-†, a305/E122, a306/E162, a307/LHG330, c308/N165, a309/H179, a311/H100, a312/P91, a313/w980*, a314/Y196, a315/P142 |
| FCPI-5 | a301/E66, a302/N69, a303/w994*, a304/Q113, a305/E122, a306/E163, a307/E43, a308/N166, a309/S186, a316/E43 |
-
*
Water molecules.
-
†
The ligands of Chls may be water or lipid molecules which cannot be identified due to weak densities.
Table 6
Correspondence of the numbering of pigments in each PSI core subunit described in the text with those in the PDB file.
| PsaI | PsaJ | PsaL | |
|---|---|---|---|
| Chls in the text | PDB No. (Chain ID) | PDB No. (Chain ID) | PDB No. (Chain ID) |
| 102 | 301 (1)* | ||
| 203 | 204 (L) | ||
| Car in the text | |||
| 103 | 105 (J) |
-
*
Chain in the adjacent unit.
Table 7
Correspondence of the numbering of pigments in each FCPI subunit described in the text with those in the PDB file.
| FCPI-1 | FCPI-2 | FCPI-3 | FCPI-4 | FCPI-5 | |
|---|---|---|---|---|---|
| Chls in the text | PDB No. (Chain ID) | PDB No. (Chain ID) | PDB No. (Chain ID) | PDB No. (Chain ID) | PDB No. (Chain ID) |
| 301 | 303 (1) | 205 (2) | 202 (3) | 207 (5) | |
| 302 | 304 (1) | 206 (2) | 203 (3) | 208 (5) | |
| 303 | 207 (2) | 204 (3) | 209 (5) | ||
| 304 | 305 (1) | 208 (2) | 205 (3) | 210 (5) | |
| 305 | 306 (1) | 209 (2) | 206 (3) | 304 (4) | 211 (5) |
| 306 | 307 (1) | 210 (2) | 207 (3) | 305 (4) | 212 (5) |
| 307 | 211 (2) | 208 (3) | 306 (4) | 213 (5) | |
| 308 | 212 (2) | 209 (3) | 307 (4) | 214 (5) | |
| 309 | 213 (2) | 210 (3) | 308 (4) | 215 (5) | |
| 310 | 211 (3) | ||||
| 311 | 309 (1) | 309 (4) | |||
| 312 | 310 (4) | ||||
| 313 | 311 (4) | ||||
| 314 | 312 (4) | ||||
| 315 | 313 (4) | ||||
| 316 | 216 (5) | ||||
| 317 | 310 (1) | ||||
| 318 | 214 (2) | ||||
| 319 | 215 (2) | ||||
| Cars in the text | |||||
| 321 | 311 (1) | 216 (2) | 212 (3) | 314 (4) | 217 (5) |
| 322 | 312 (1) | 217 (2) | 213 (3) | 315 (4) | 218 (5) |
| 323 | 209 (L)* | ||||
| 324 | 313 (1) | 218 (2) | 214 (3) | 316 (4) | 219 (5) |
| 325 | 314 (1) | 219 (2) | 228 (3)* | 220 (5) | |
| 326 | 315 (1) | 221 (5) | |||
| 327 | 316 (1) | ||||
| 328 | 317 (1) |
-
*
Chain in the adjacent unit.
Table 8
Correspondence of the numbering of other cofactors described in the text with those in the PDB file.
| Waters in the text | PDB No. (Chain ID) |
|---|---|
| 976 | 317 (3) |
| 977 | 313 (3) |
| 978 | 316 (3) |
| 980 | 402 (4) |
| 982 | 425 (1) |
| 994 | 308 (5) |
| Lipid in the text | |
| 330 | 317 (4) |
Additional files
Download links
A two-part list of links to download the article, or parts of the article, in various formats.
Downloads (link to download the article as PDF)
Open citations (links to open the citations from this article in various online reference manager services)
Cite this article (links to download the citations from this article in formats compatible with various reference manager tools)
Structural basis for molecular assembly of fucoxanthin chlorophyll a/c-binding proteins in a diatom photosystem I supercomplex
eLife 13:RP99858.
https://doi.org/10.7554/eLife.99858.3


