Dysfunctional S1P/S1PR1 signaling in the dentate gyrus drives vulnerability of chronic pain-related memory impairment
- Jiangsu Province Key Laboratory of Anesthesiology, Xuzhou Medical University, China
- NMPA Key Laboratory for Research and Evaluation of Narcotic and Psychotropic Drugs, Xuzhou Medical University, China
- Jiangsu Province Key Laboratory of Anesthesia and Analgesia Application Technology, Xuzhou Medical University, China
- School of Public Health, Xuzhou Medical University, China
- Faculty of Health Sciences, University of Macau, China
- Department of Anesthesiology, the Affiliated Hospital of Xuzhou Medical University, China
Figures
Figure 1 with 4 supplements
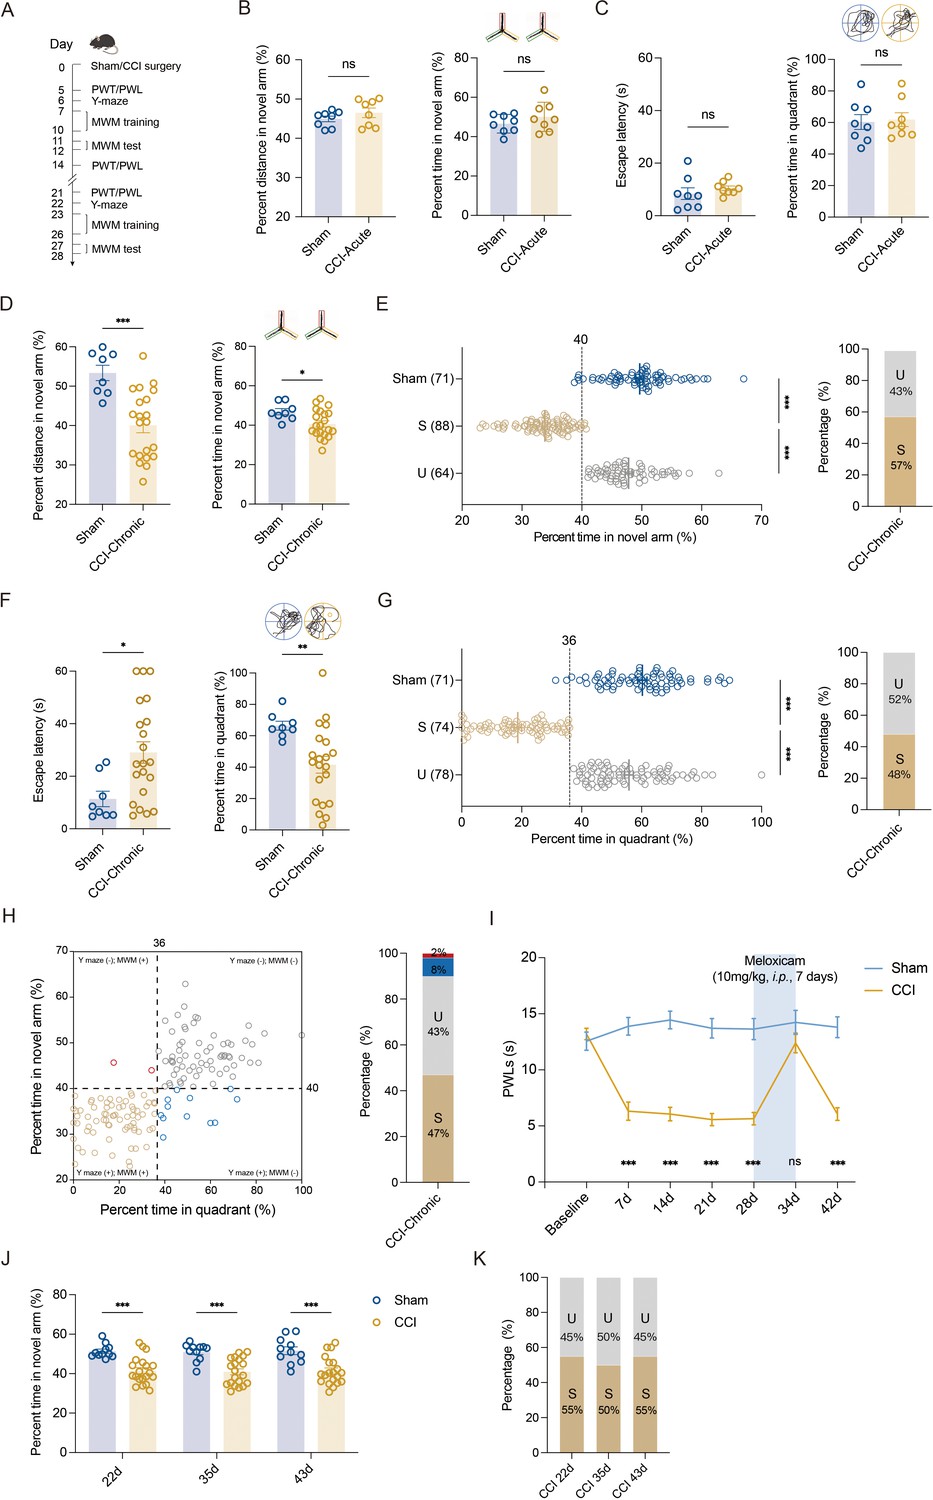
Segregation of mice with chronic pain into susceptible and unsusceptible subpopulations to memory impairment.
(A) Timeline of CCI surgery, pain threshold tests, Y-maze test, and MWM training. (B) Representative traveling traces and statistical results of Y-maze test showing distance and percent time in the novel arm (red) in CCI-Acute mice (6d post CCI, n = 8–21). (C) Representative traveling traces and statistical results of MWM training showing escape latency and percent time in the quadrant in CCI-Acute mice (11d post CCI, n = 8–21). (D) Representative traveling traces and statistical results of Y-maze test showing distance and percent time in the novel arm (red) in CCI-Chronic mice (22d post CCI, n = 8–21). (E) Horizontal scatterplot depicting the distribution of ratio of time in novel arm for Sham, susceptible (S), and unsusceptible (U) mice in Y-maze test. Bar graph represents the ratio of S and U mice in CCI-Chronic mice (22d post CCI, n = 71–152). (F) Representative traveling traces and statistical results of MWM training showing escape latency and percent time in the quadrant in CCI-Chronic mice (27d post CCI, n = 8–21). (G) Horizontal scatterplot depicting the distribution of ratio of time in the quadrant for Sham, S, and U mice in MWM training. Bar graph represents the ratio of S and U mice in CCI-Chronic mice (27d post CCI, n = 71–152). (H) Time in novel arm versus percent time in quadrant, for 152 CCI-Chronic mice. Each dot corresponds to one mouse. Colors of dots correspond to the groups of U in Y-maze test but S in MWM (red), U in both Y-maze and MWM (gray), S in Y-maze test but U in MWM (blue), and S in both Y-maze and MWM (yellow), respectively. Bar graph represents the ratio of each group in CCI-Chronic mice (n = 152). (I) PWLs before and after administration of meloxicam (10 mg/kg, i.p., n = 10–20). (J) Performance of CCI mice in Y-maze test before and after meloxicam administration (10mg/kg, i.p., n = 10–20). (K) Bar graph represents the ratio of U and S on 22d, 36d, and 43d after CCI (n = 10–20). Data were analyzed by unpaired t test or two-way analysis of variance (two-way ANOVA), followed by post hoc Tukey’s multiple comparisons between multiple groups when appropriate. All data are presented as the mean ± SEM. ns, not significant; *p < 0.05; **p < 0.01; ***p < 0.001. CCI, chronic constrictive injury; d, day; MWM, Morris water maze; PWL, paw withdrawal latency; PWT, paw withdrawal threshold; U, unsusceptible; S, susceptible.
Figure 1—figure supplement 1
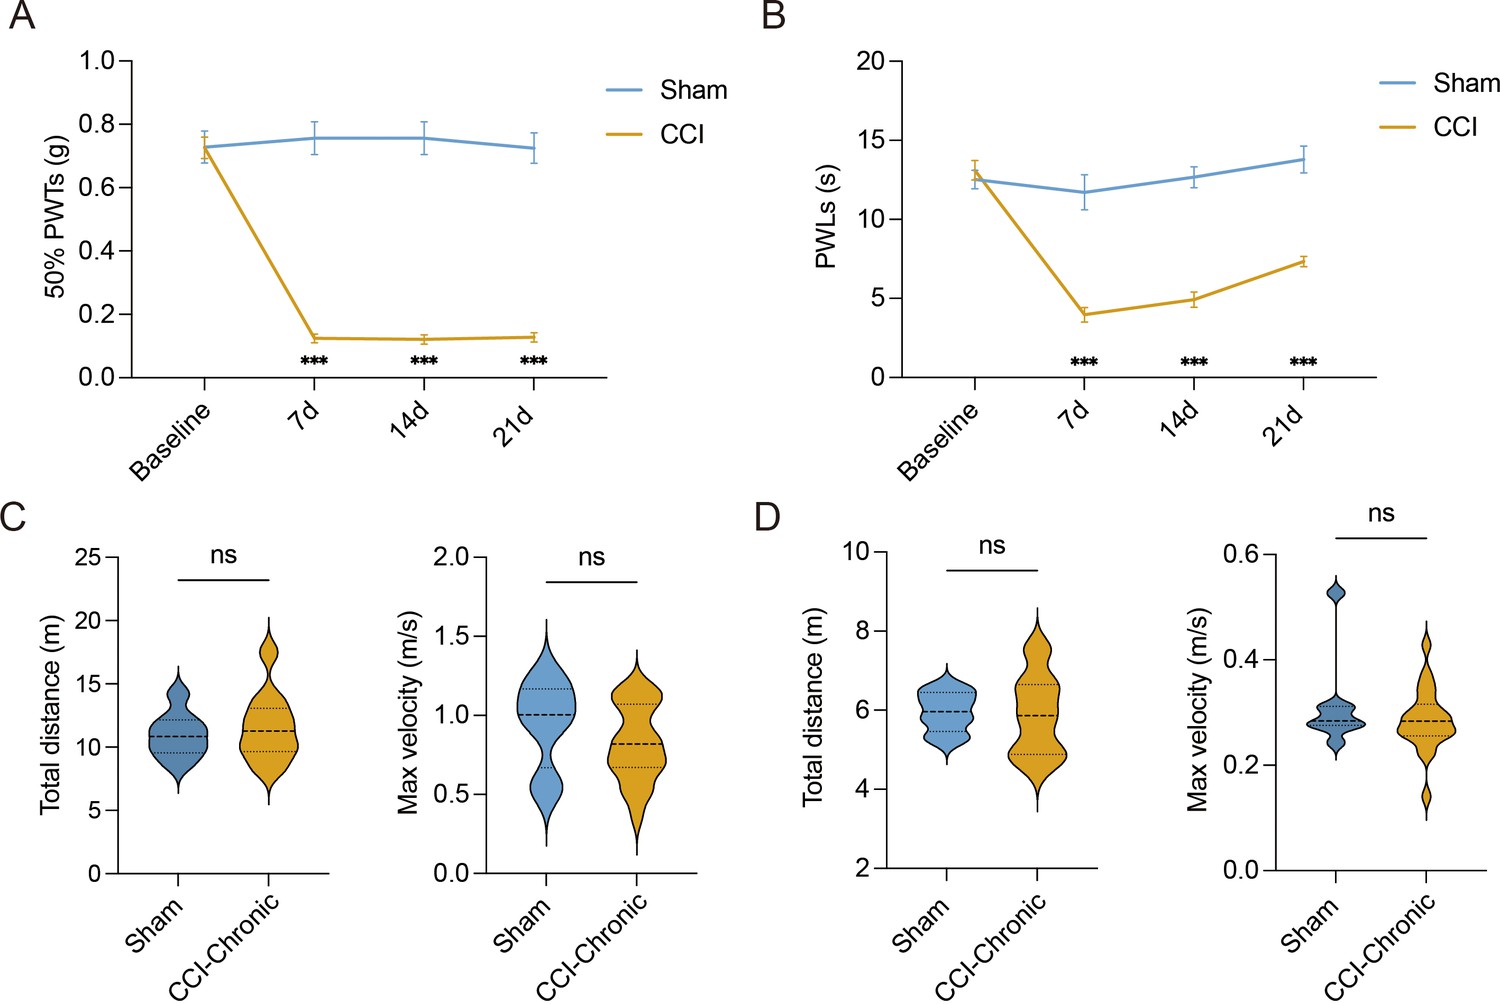
Behavioral assays of nociception and locomotor activity.
(A, B) 50% PWTs and PWLs of Sham- and CCI-treated mice of baseline, 7d, 14d, and 21d post CCI. (C) Quantitative summary of Y-maze test showing total distance traveled and max velocity in the novel arm in Sham- and CCI-Chronic mice (22d post CCI, n = 8–21). (D) Quantitative summary of Morris water maze (MWM) test showing total distance traveled and max velocity in the target quadrant in Sham- and CCI-Chronic mice (28d post CCI, n = 8–21). Data were analyzed by two-way ANOVA with post hoc Tukey’ s multiple comparisons test between groups (A, B) or two-tailed unpaired Student’s t test (C, D). All data are presented as the mean ± SEM. ns, not significant; ***p < 0.001. CCI, chronic constrictive injury; PWTs, paw withdrawal thresholds; PWLs, paw withdrawal latencies; d, day.
Figure 1—figure supplement 2
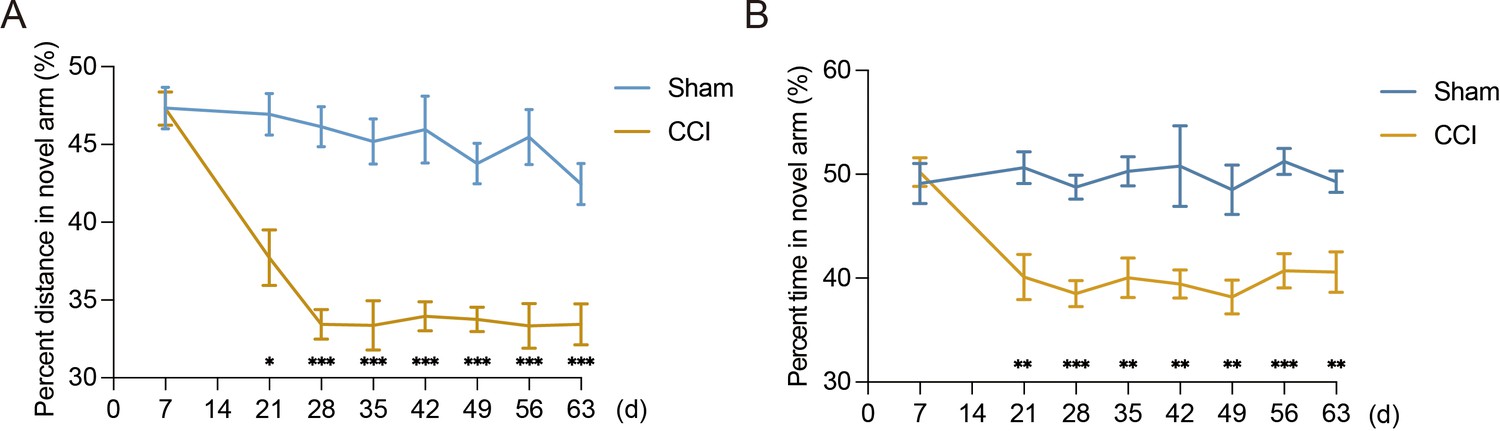
Chronic pain-induced memory impairment lasts at least to 63d after CCI.
(A, B) Quantitative summary of Y-maze test showing percent distance traveled and percent time spent in the novel arm in Sham- and CCI-treated mice at 7d, 21d, 28d, 35d, 42d, 49d, 56d, and 63d after CCI (n = 10–20). Data were analyzed by two-way ANOVA with post hoc Tukey’ s multiple comparisons test between groups. All data are presented as the mean ± SEM. *p < 0.05; **p < 0.01; ***p < 0.001. CCI, chronic constrictive injury; d, day.
Figure 1—figure supplement 3
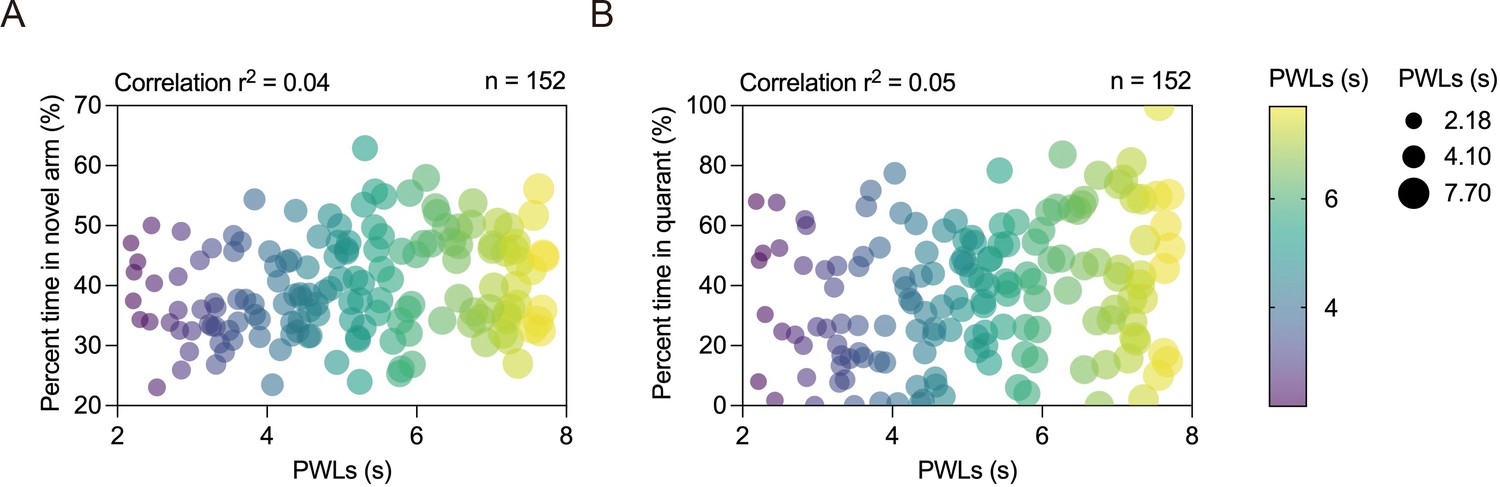
Susceptibility or insusceptibility to chronic pain-induced memory impairment is irrelevant to pain threshold of chronic constriction injury (CCI)-treated mice.
(A, B) Correlation analysis of PWLs with percent time in novel arm (r2 = 0.04, n = 152) and percent time in quadrant (r2 = 0.05, n = 152). Linear regression followed by a goodness-of-fit measure of R-squared (r2) was used to determine the correlation. PWLs, paw withdrawal latencies.
Figure 1—figure supplement 4

Analgesic effects of meloxicam on neuropathic pain of CCI.
(A) The analgesic effects of meloxicam on neuropathic pain of CCI 4h, 12h, and 24h post a single dose of meloxicam (10 mg/kg, i.p.). (B) The analgesic effects of meloxicam on neuropathic pain of CCI 4h, 12h, and 24h on day 7 post intraperitoneal injection of meloxicam once daily (10 mg/kg, i.p.). Data were analyzed by two-way ANOVA with post hoc Tukey’ s multiple comparisons test between groups. All data are presented as the mean ± SEM. **p < 0.01; ***p < 0.001; ns, not significant. CCI, chronic constrictive injury; PWLs, paw withdrawal latencies; d, day; h, hour.
Figure 2 with 1 supplement
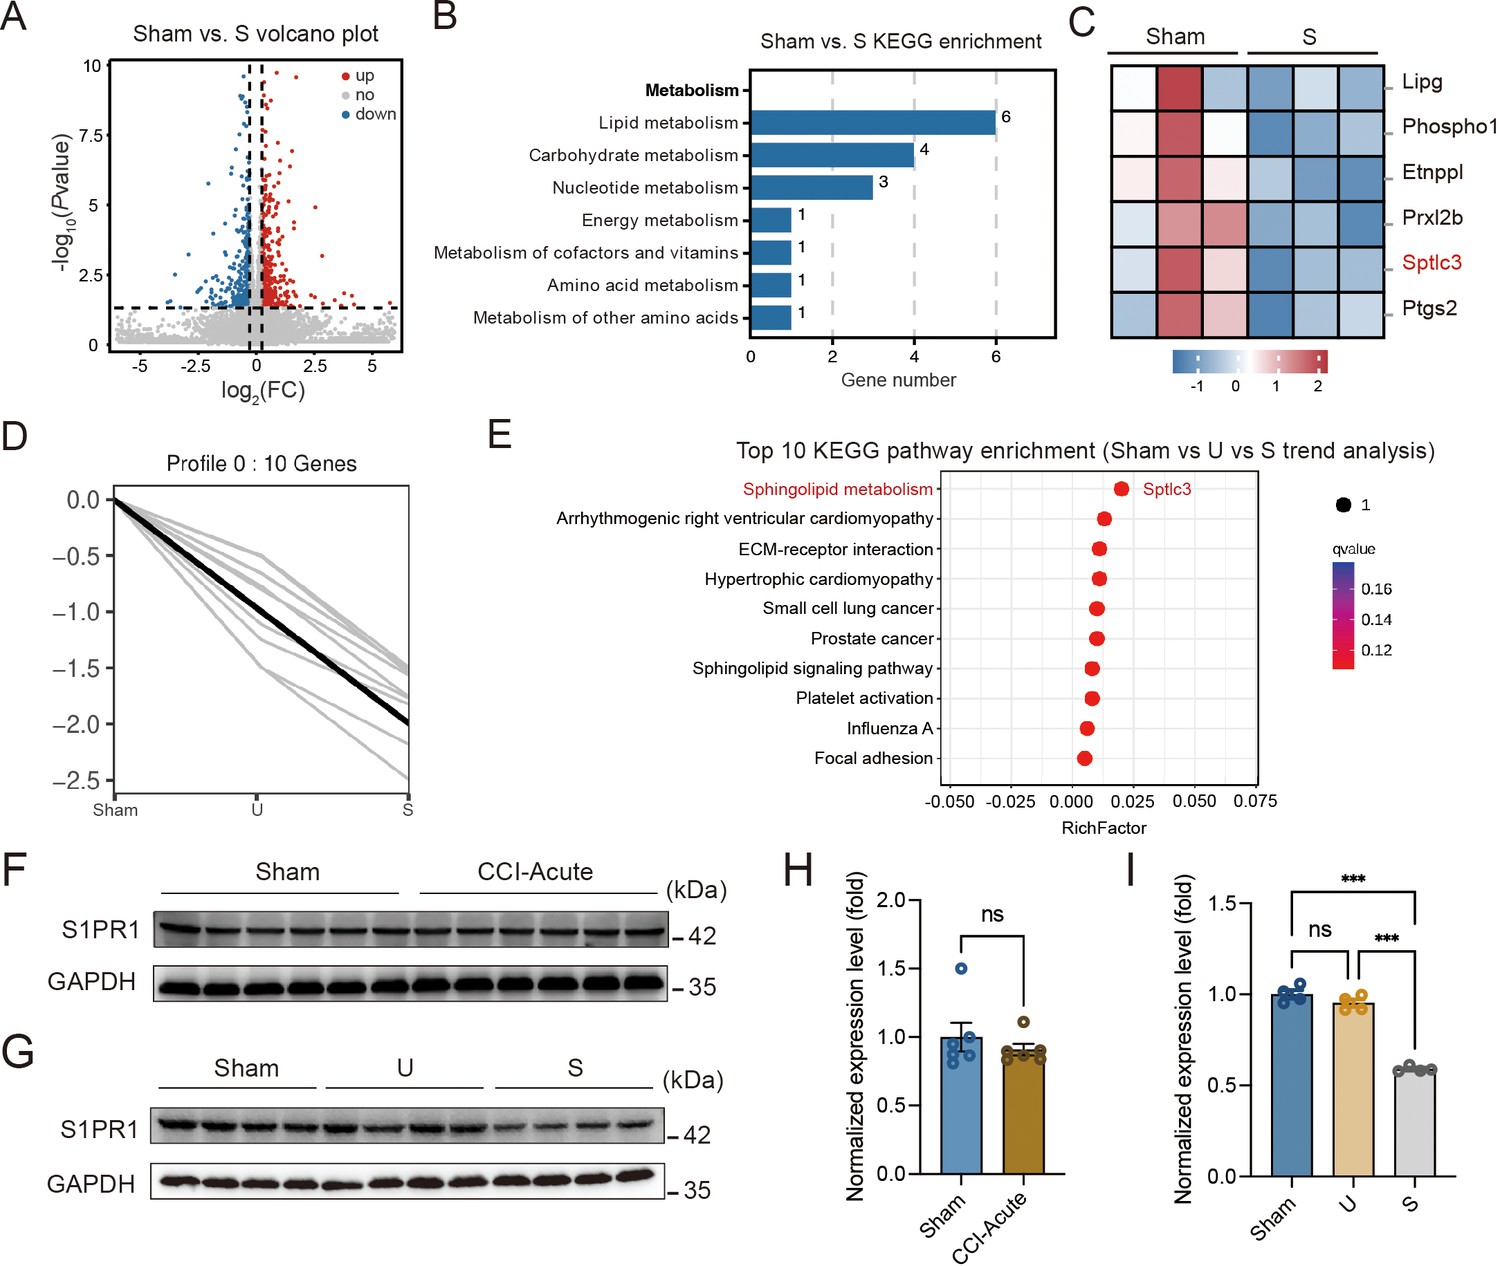
S1PR1 expression is decreased in the hippocampal dentate gyrus (DG) of susceptible mice.
(A) Volcano plot showing RNA-Seq data for DG from Sham versus susceptible mice. Differentially expressed genes (DEGs) are designated in red (upregulation [up]) and blue (downregulation [down]) and defined as having an FDR of less than 0.05. (B) Bar plot showing significant enrichment of DEGs in various pathways related with metabolism for Sham versus susceptible mice. (C) Relative expression levels are shown for genes related with lipid metabolism upon susceptible as compared with Sham. (D) Trend pattern used for analysis of Sham versus U versus S. (E) Bubble diagram represents the top 10 enrichment of KEGG pathways. (F–I) Example western bands (F) and densitometric comparison (H) of the average expression of S1PR1 in DG lysates from Sham and CCI-Acute mice (7d post CCI). Lanes 1–6 represent Sham, Lanes 7–12 represent CCI-Acute (n = 6); example western bands (G) and densitometric comparison (I) of the average expression of S1PR1 in DG lysates from Sham, U, and S mice. Lanes 1–4 represent Sham, Lanes 5–8 represent U, and Lanes 9–12 represent S (n = 4). Data were analyzed by unpaired t test or one-way analysis of variance (one-way ANOVA), followed by post hoc Tukey’s multiple comparisons between multiple groups when appropriate. All data are presented as the mean ± SEM. ns, not significant; ***p < 0.001. CCI, chronic constrictive injury; d, day; U, unsusceptible; S, susceptible.
-
Figure 2—source data 1
PDF file containing original western blots for Figure 2F, G, indicating the relevant bands.
- https://cdn.elifesciences.org/articles/99862/elife-99862-fig2-data1-v1.zip
-
Figure 2—source data 2
Original files for western blot analysis displayed in Figure 2F, G.
- https://cdn.elifesciences.org/articles/99862/elife-99862-fig2-data2-v1.zip
Figure 2—figure supplement 1
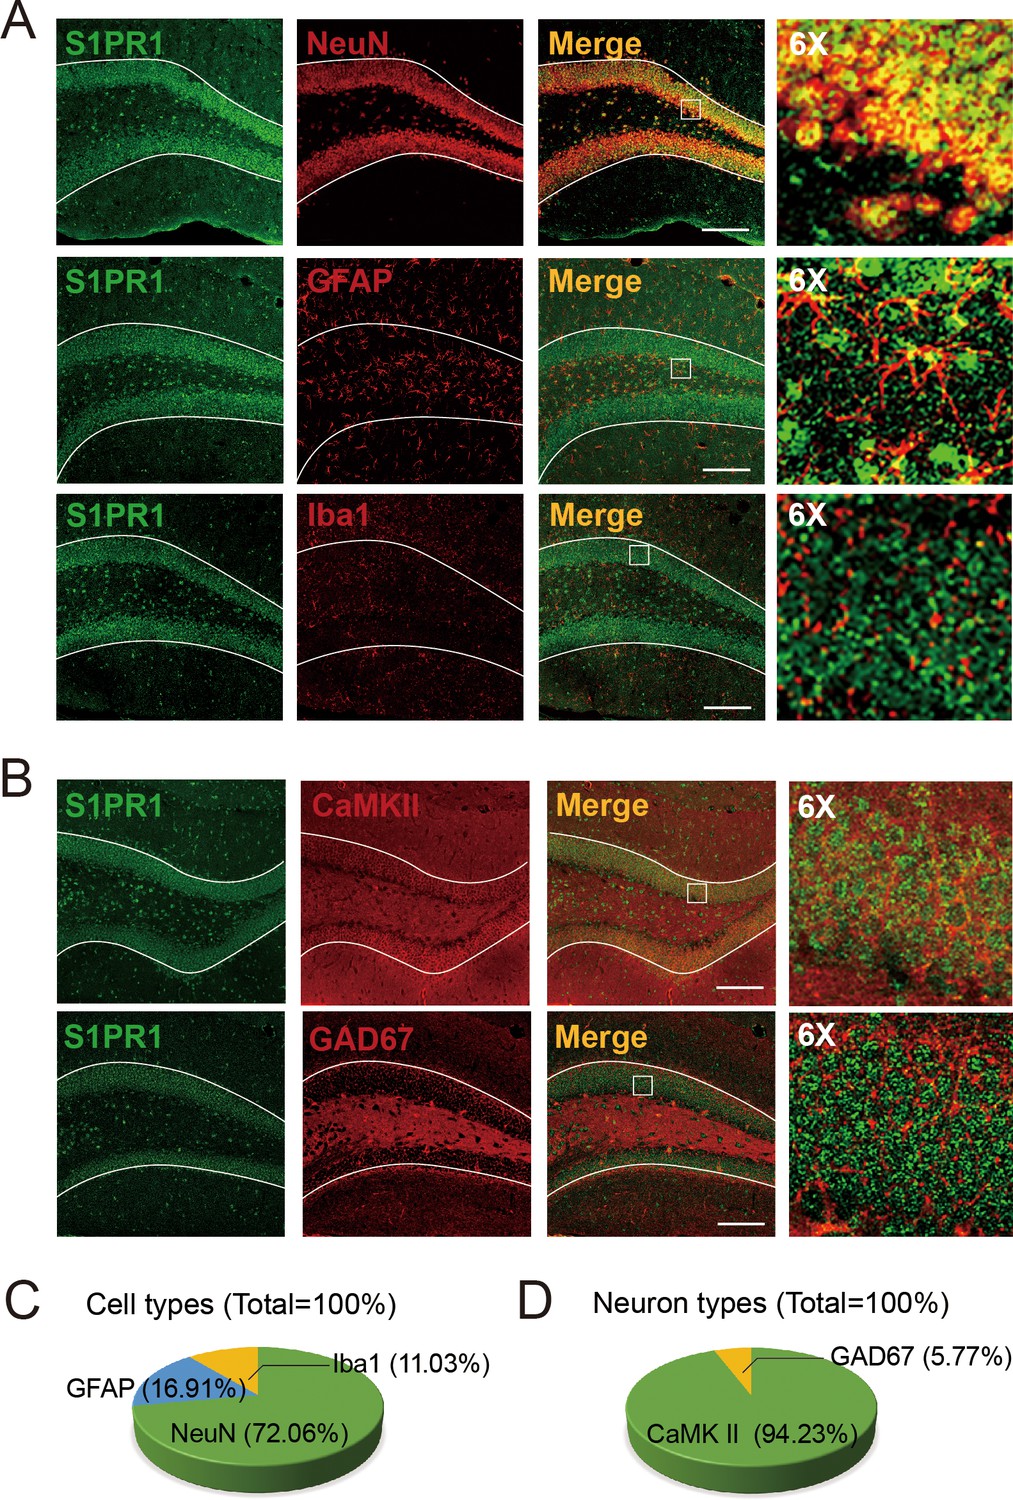
Characterization of expression profile of S1PR1 in the dentate gyrus (DG).
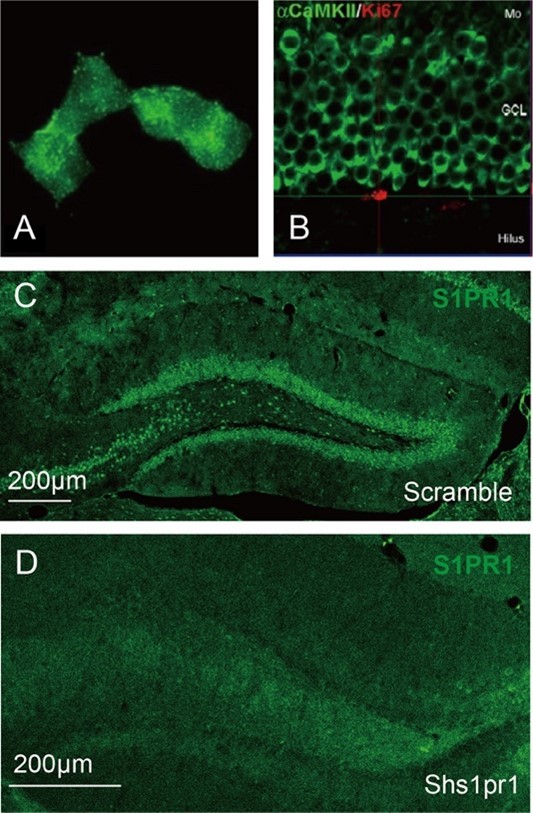
Characterization of S1PR1 expression in different cell types (A) and neuron types (B) (scale bar, 100 μm). (C) S1PR1 was highly co-expressed with NeuN and sparsely co-expressed with glial fibrillary acidic protein (GFAP) or Iba1 (n = 4). (D) S1PR1 expression was found mostly in CaMKII+ neurons and sparsely in GAD67+ neurons (n = 4).
Figure 3 with 1 supplement
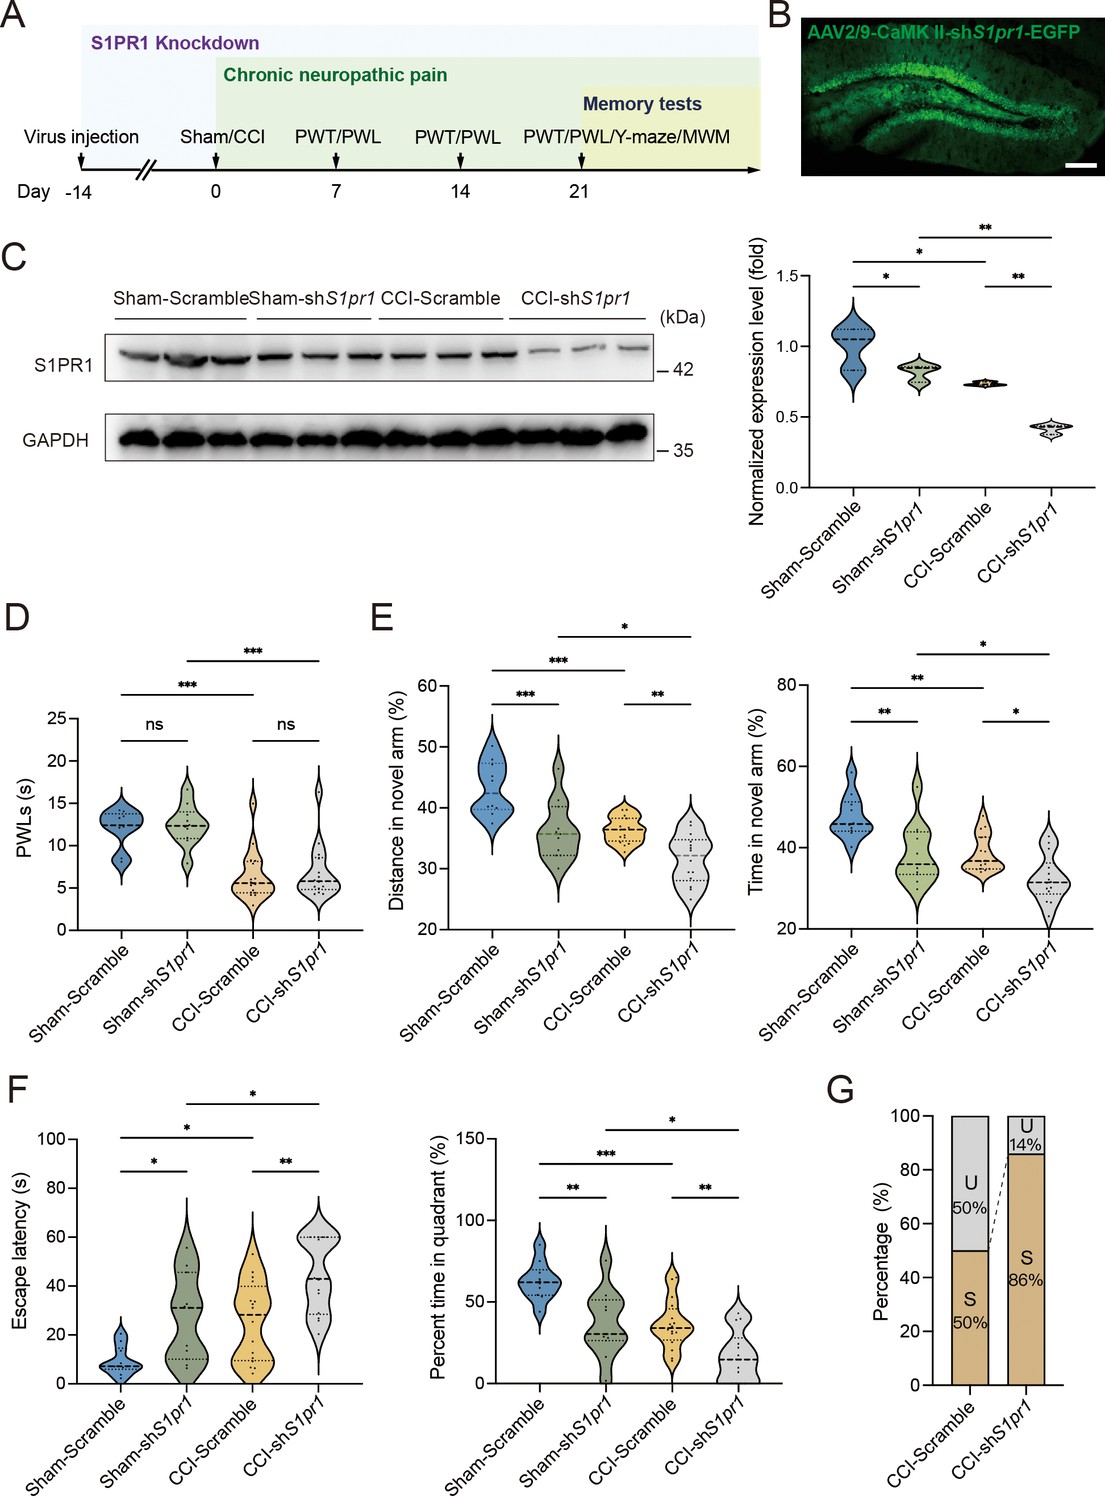
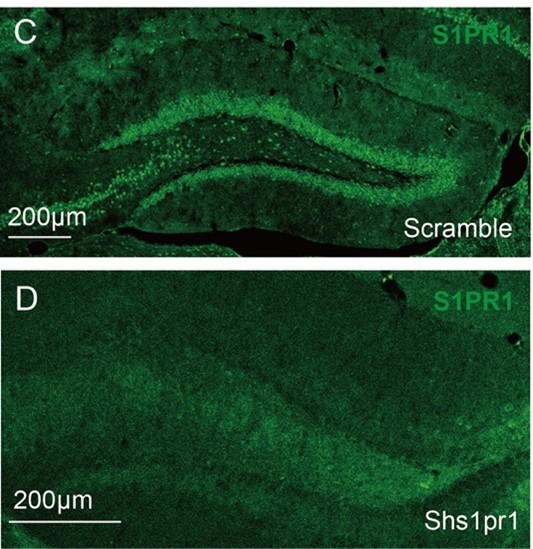
S1PR1 knockdown in the dentate gyrus (DG) induces memory impairment.
(A) Timeline of intra-DG virus injection, CCI surgery, pain threshold tests, Y-maze test, and MWM training. (B) A confocal image showing virus expression in the DG (scale bar, 100 μm). (C) Example western bands showing efficient S1pr1 knockdown in the DG lysates from Sham-Scramble, Sham-shS1pr1, CCI-Scramble, and CCI-shS1pr1. Densitometric comparison of the average expression of S1PR1 (n = 6). (D) Pain threshold in Sham- and CCI-treated mice subjected to Scramble/shS1pr1 in the DG (n = 8–10). (E) Quantitative summary of Y-maze showing distances traveled and time spent in the novel arm in Sham- and CCI-treated mice subjected to Scramble/shS1pr1 in the DG (n = 10–16). (F) Quantitative summary of MWM training showing escape latency and time spent in the quadrant in Sham- and CCI-treated mice subjected to Scramble/shS1pr1 in the DG (n = 10–16). (G) Ratio of U and S in CCI-Scramble and CCI-shS1pr1 mice. Data were analyzed by two-way analysis of variance (two-way ANOVA), followed by post hoc Tukey’s multiple comparisons between multiple groups. All data are presented as the mean ± SEM. ns, not significant; *p < 0.05; **p < 0.01; ***p < 0.001. CCI, chronic constrictive injury; MWM, Morris water maze; PWL, paw withdrawal latency; PWT, paw withdrawal threshold; U, unsusceptible; S, susceptible.
-
Figure 3—source data 1
PDF file containing original western blots for Figure 3C, indicating the relevant bands.
- https://cdn.elifesciences.org/articles/99862/elife-99862-fig3-data1-v1.pdf
-
Figure 3—source data 2
Original files for western blot analysis displayed in Figure 3C.
- https://cdn.elifesciences.org/articles/99862/elife-99862-fig3-data2-v1.zip
Figure 3—figure supplement 1

Zoomed-out images of the brain to show the precision of the virus injection (scale bar, 1000 μm).
Figure 4 with 1 supplement
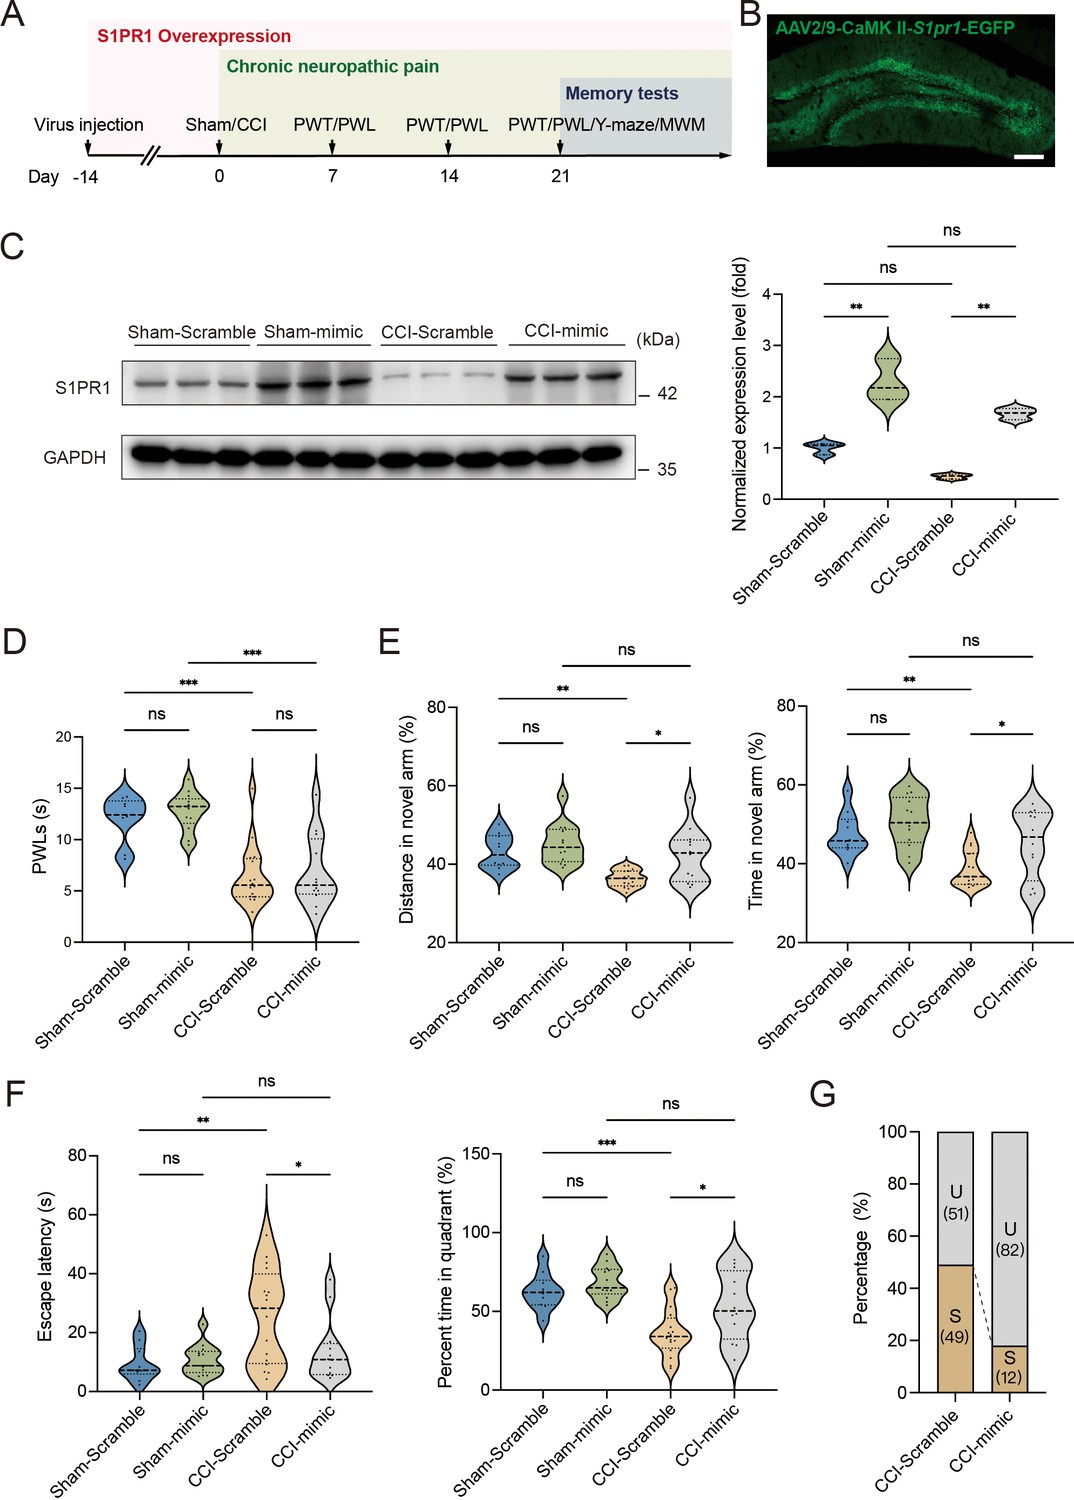
Overexpression of S1PR1 in the dentate gyrus (DG) rescues chronic pain-induced memory impairment.
(A) Timeline of intra-DG virus injection, CCI surgery, pain threshold tests, Y-maze test, and MWM training. (B) A confocal image showing virus expression in the DG (scale bar, 100 μm). (C) Example western bands showing efficient S1PR1 overexpression in the DG lysates from Sham-Scramble, Sham-mimic, CCI-Scramble, and CCI-mimic. Densitometric comparison of the average expression of S1PR1 (n = 6). (D) Pain threshold in Sham- and CCI-treated mice subjected to Scramble/mimic in the DG (n = 8–10). (E) Quantitative summary of Y-maze showing distances traveled and time spent in the novel arm in Sham- and CCI-treated mice subjected to Scramble/mimic in the DG (n = 10–16). (F) Quantitative summary of MWM training showing escape latency and time spent in the quadrant in Sham- and CCI-treated mice subjected to Scramble/mimic in the DG (n = 10–16). (G) Ratio of U and S in CCI-Scramble and CCI-mimic mice. Data were analyzed by two-way analysis of variance (two-way ANOVA), followed by post hoc Tukey’s multiple comparisons between multiple groups. All data are presented as the mean ± SEM. ns, not significant; *p < 0.05; **p < 0.01; ***p < 0.001. CCI, chronic constrictive injury; MWM, Morris water maze; PWL, paw withdrawal latency; PWT, paw withdrawal threshold; U, unsusceptible; S, susceptible.
-
Figure 4—source data 1
PDF file containing original western blots for Figure 4C, indicating the relevant bands.
- https://cdn.elifesciences.org/articles/99862/elife-99862-fig4-data1-v1.pdf
-
Figure 4—source data 2
Original files for western blot analysis displayed in Figure 4C.
- https://cdn.elifesciences.org/articles/99862/elife-99862-fig4-data2-v1.zip
Figure 4—figure supplement 1

Zoomed-out images of the brain to show the precision of the virus injection (scale bar, 1000 μm).
Figure 5
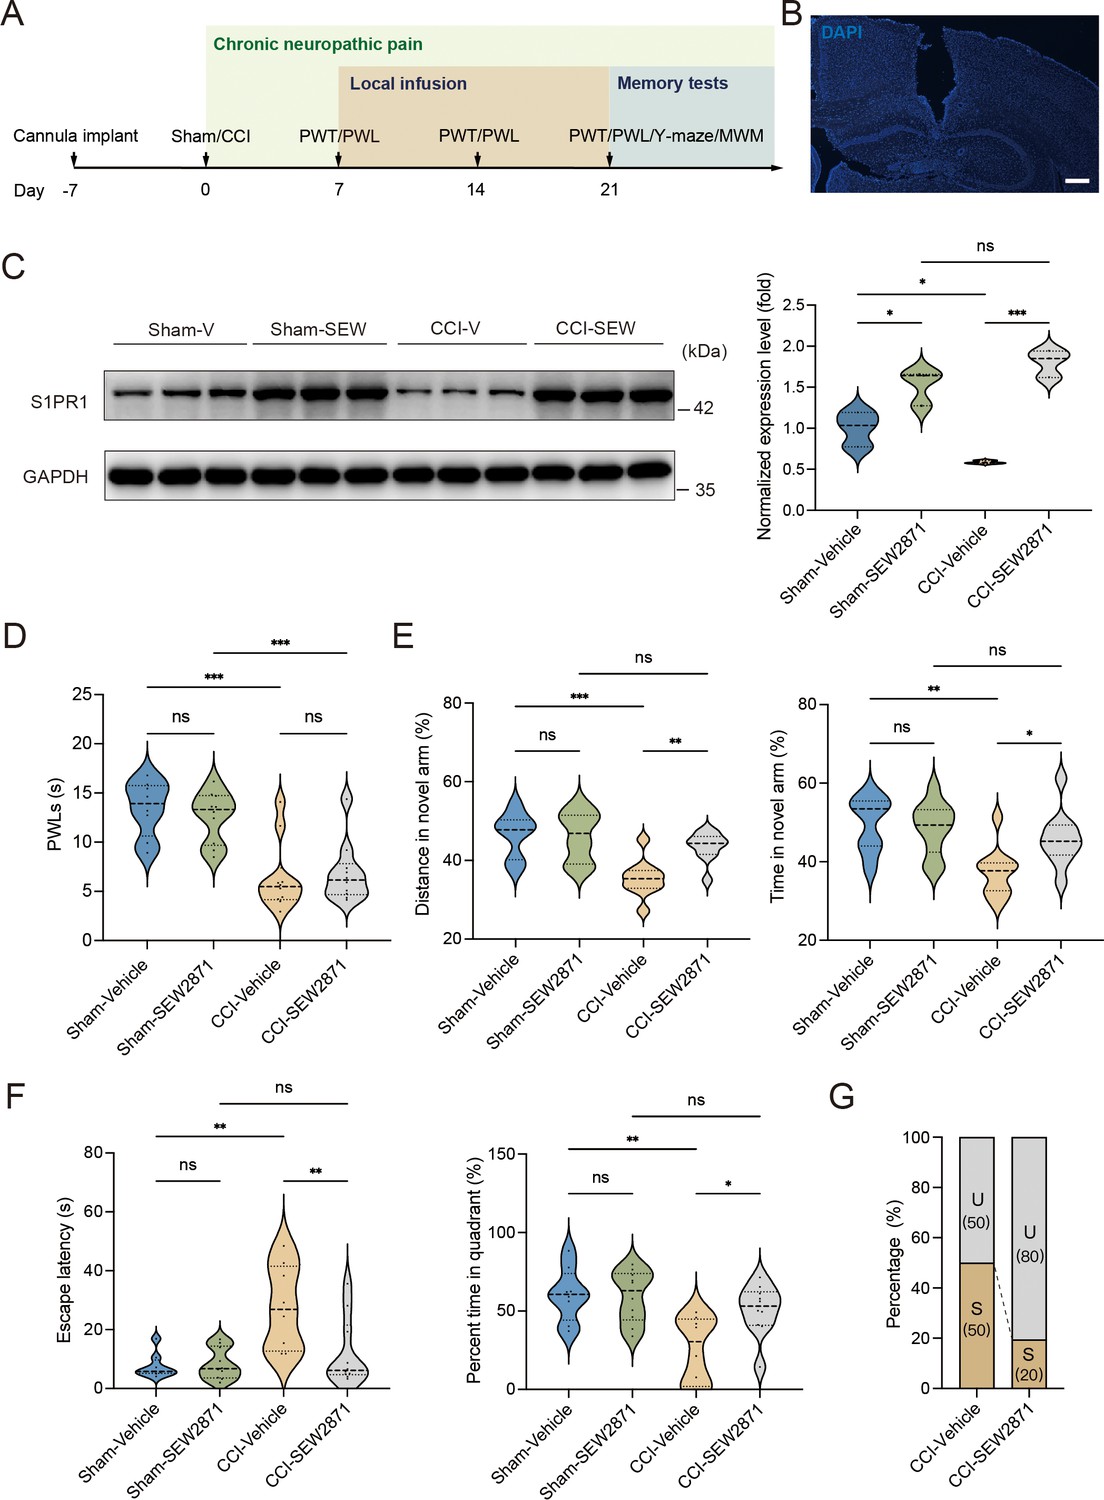
Local infusion of SEW2871 in the dentate gyrus (DG) prevented the presence of chronic pain-induced memory impairment.
(A) Timeline of cannula implant, CCI surgery, pain threshold tests, Y-maze test, and Morris water maze (MWM) training. (B) Confocal image showing cannula implanted in the DG (scale bar, 100 μm). (C) Example western bands showing expression of S1PR1 in DG lysates from Sham-Vehicle, Sham-SEW2871, CCI-Vehicle, and CCI-SEW2871. Densitometric comparison of the average expression of S1PR1 (n = 6). (D) Pain threshold in Sham- and CCI-treated mice subjected to local infusion of vehicle/SEW2871 in the DG (n = 8–10). (E) Quantitative summary of Y-maze showing distances traveled and time spent in the novel arm in Sham- and CCI-treated mice subjected to local infusion of vehicle/SEW2871 in the DG (n = 10–16). (F) Quantitative summary of MWM training showing escape latency and time spent in the quadrant in Sham- and CCI-treated mice subjected to local infusion of vehicle/SEW2871 in the DG (n = 10–16). (G) Ratio of U and S in CCI-vehicle and CCI-SEW2871 mice. Data were analyzed by two-way analysis of variance (two-way ANOVA), followed by post hoc Tukey’s multiple comparisons between multiple groups. All data are presented as the mean ± SEM. ns, not significant; *p < 0.05; **p < 0.01; ***p < 0.001. CCI, chronic constrictive injury; MWM, Morris water maze; PWL, paw withdrawal latency; PWT, paw withdrawal threshold; DG, dentate gyrus; U, unsusceptible; S, susceptible.
-
Figure 5—source data 1
PDF file containing original western blots for Figure 5C, indicating the relevant bands.
- https://cdn.elifesciences.org/articles/99862/elife-99862-fig5-data1-v1.pdf
-
Figure 5—source data 2
Original files for western blot analysis displayed in Figure 5C.
- https://cdn.elifesciences.org/articles/99862/elife-99862-fig5-data2-v1.zip
Figure 6 with 2 supplements
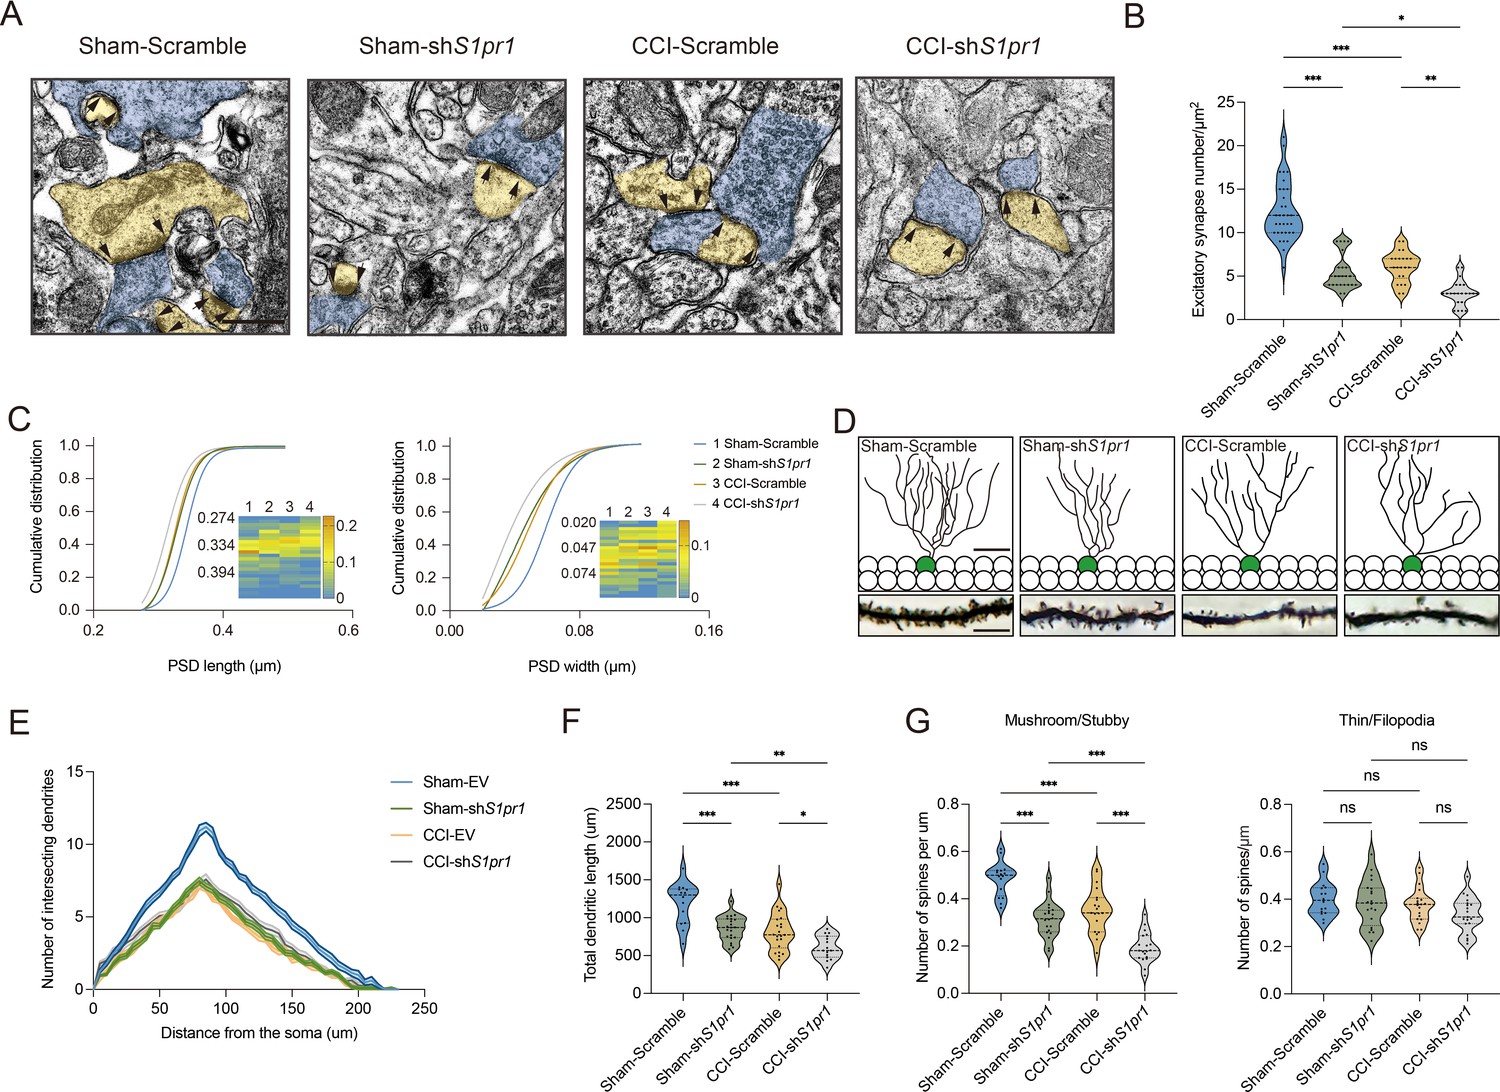
S1PR1 knockdown in the dentate gyrus (DG) impairs synaptic plasticity.
(A) Representative TEM images of synapses in the DG in Sham- and CCI-treated mice subjected to Scramble/shS1pr1 in the DG. Blue indicates presynaptic site and yellow indicates postsynaptic sites of excitatory synapses, respectively (scale bar, 500 nm). (B) Mean number of excitatory synapses per μm2 of DG in Sham- and CCI-treated mice subjected to Scramble/shS1pr1 (n = 18–24 from 4 mice/group). (C) Cumulative distribution plots for the lengths and widths of postsynaptic density in the DG in Sham- and CCI-treated mice subjected to Scramble/shS1pr1 in the DG (n = 121–162 from 4 mice/group). (D) Representative Golgi-staining images of dendritic spine morphology from the DG in Sham- and CCI-treated mice subjected to Scramble/shS1pr1 in the DG (scale bar, top: 50 μm; bottom:10 μm). (E) The number of intersections of all dendritic branches in Sham- and CCI-treated mice subjected to Scramble/shS1pr1 in the DG (n = 18–24 from 4 mice/group). (F) Violin plots indicate the total dendritic length (n = 18–24 from 4 mice/group). (G) Violin plots indicate the number of mushroom/stubby type dendritic spines (left), and the number of thin/filopodia type dendritic spines (right) in the DG of Sham- and CCI-treated mice subjected to Scramble/shS1pr1 in the DG (n = 18–24 from 4 mice/group). Data were analyzed by two-way analysis of variance (two-way ANOVA), followed by post hoc Tukey’s multiple comparisons between multiple groups when appropriate. All data are presented as the mean ± SEM. ns, not significant; *p < 0.05; **p < 0.01; ***p < 0.001. CCI, chronic constrictive injury; TEM, transmission electron microscope.
Figure 6—figure supplement 1
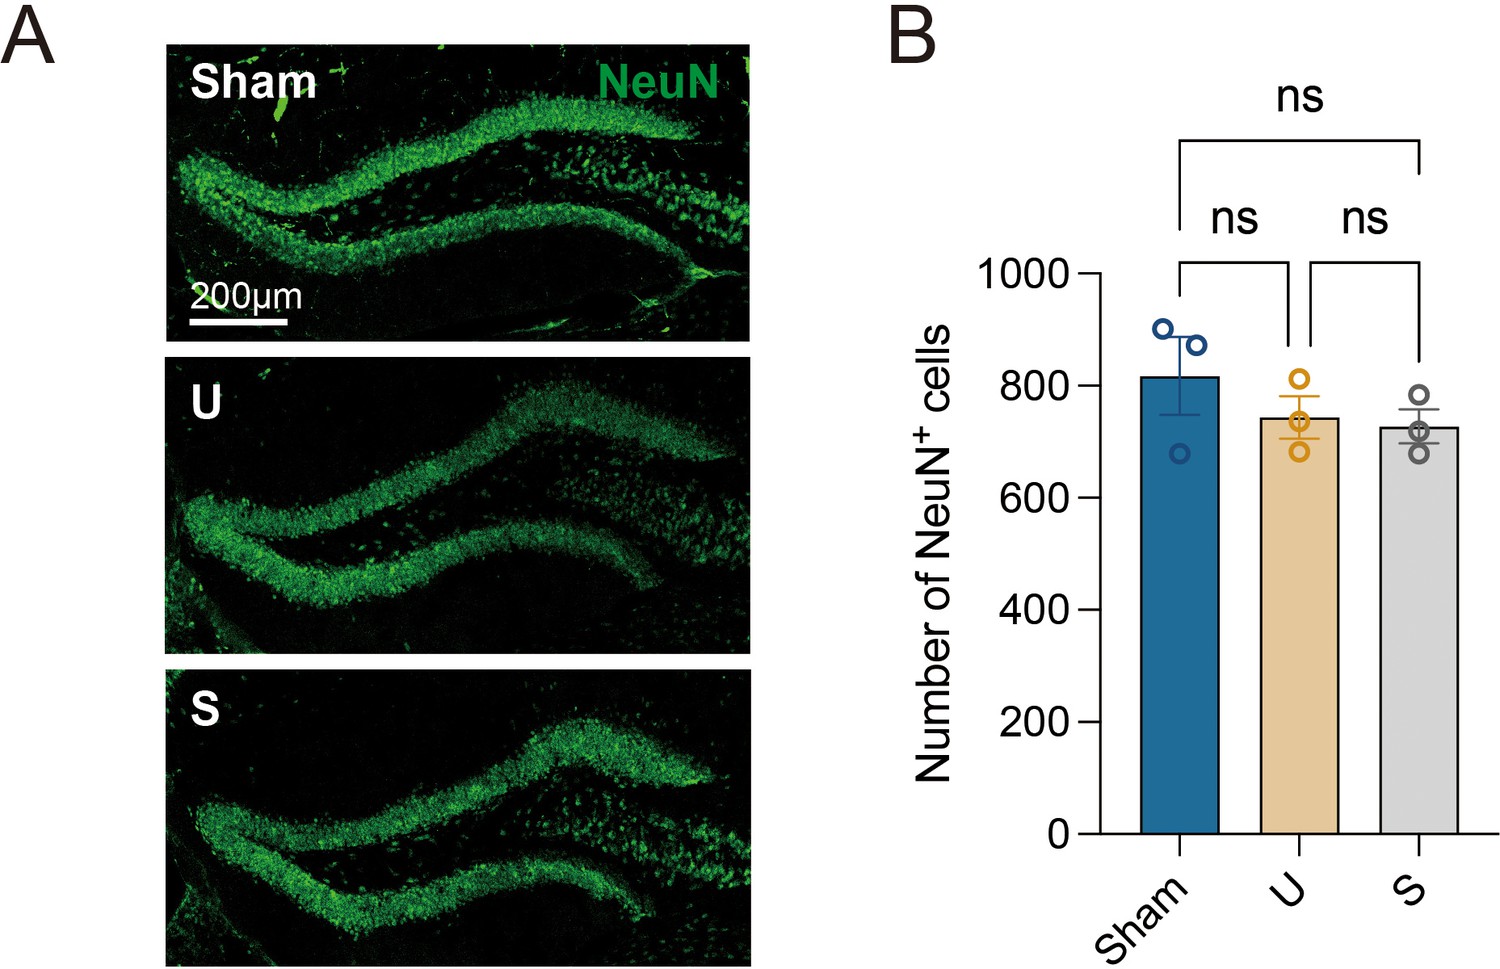
The number of neurons in the hippocampal dentate gyrus.
(A) Representative confocal images showing neurons in the DG in Sham, U, and S mice (scale bar, 200 μm). (B) Bar graph indicates the number of neurons in the DG (n = 3). Data were analyzed by one-way analysis of variance (one-way ANOVA), followed by post hoc Tukey’s multiple comparisons between multiple groups when appropriate. All data are presented as the mean ± SEM. ns, not significant. DG, dentate gyrus; U, unsusceptible; S, susceptible.
Figure 6—figure supplement 2
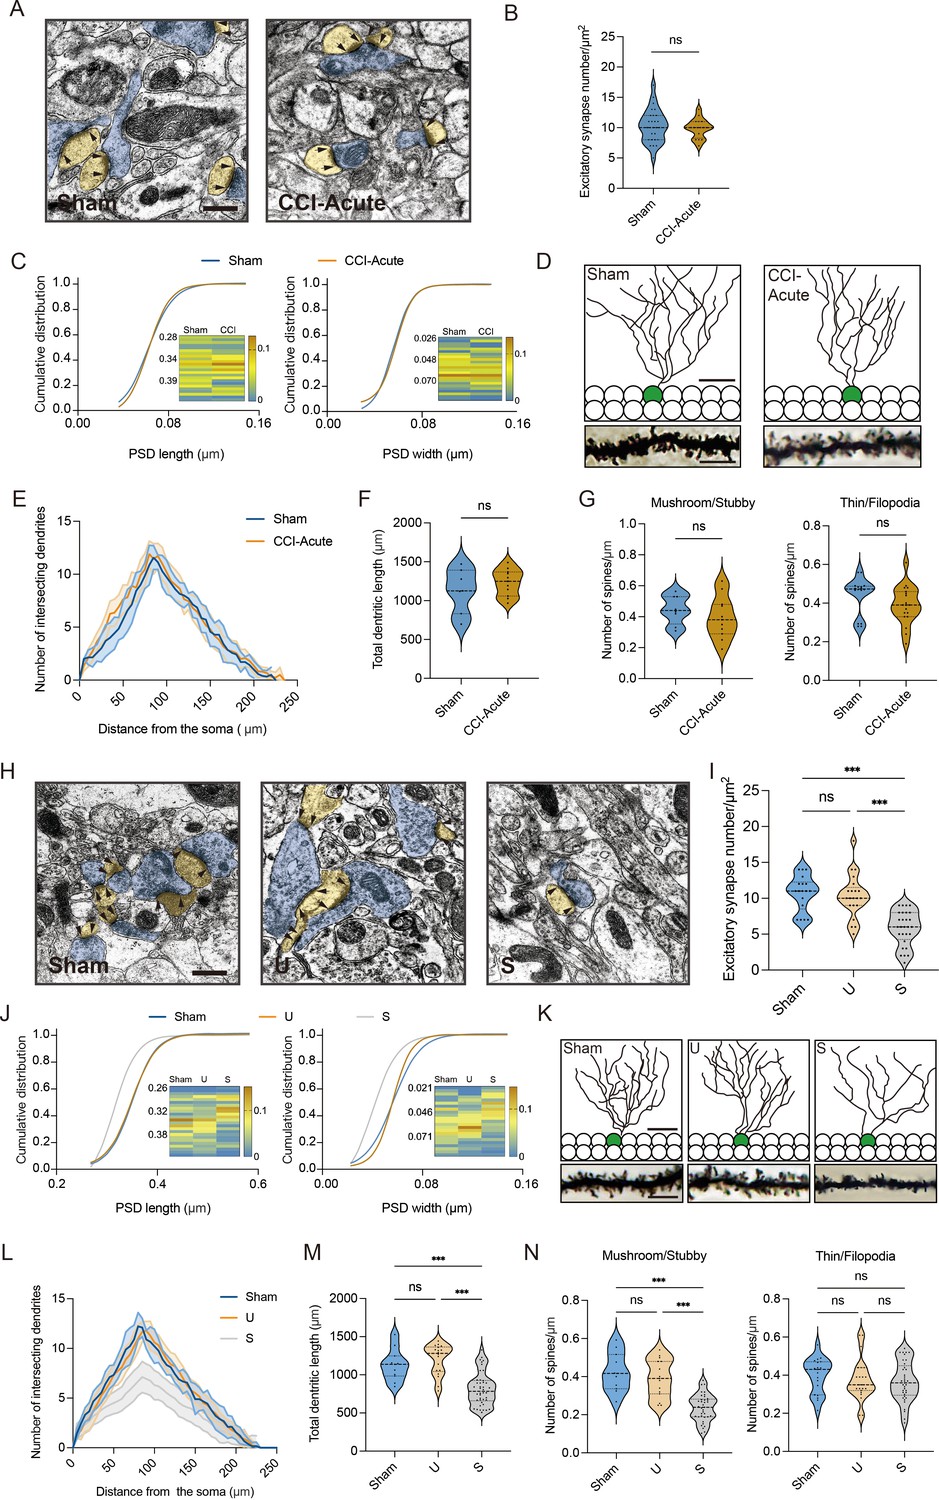
Susceptible mice exhibit altered excitatory synaptic plasticity in the hippocampal dentate gyrus.
(A) Representative TEM images of synapses in the DG in Sham and CCI-Acute mice (7d post CCI). Blue indicates presynaptic site and yellow indicates postsynaptic sites of excitatory synapses, respectively. Synaptic densities are bracketed by arrows (scale bar, 500 nm). (B) Mean number of excitatory synapses per μm2 of DG in Sham and CCI-Acute mice (7d post CCI, n = 18–24 from 4 mice/group). (C) Cumulative distribution plots for the lengths and widths of postsynaptic density in the DG in Sham and CCI-Acute mice (n = 102–156 from 4 mice/group). (D) Representative Golgi-staining images of dendritic spine morphology from the DG in Sham and CCI-Acute mice (7d post CCI, scale bar, top: 50 μm; bottom:10 μm). (E) The number of intersections of all dendritic branches in Sham and CCI-Acute mice (n = 15–18 from 4 mice/group). (F) Violin plots indicate the total dendritic length. (G) Violin plots indicate the number of mushroom/stubby type dendritic spines (left), and the number of thin/filopodia type dendritic spines (right) in Sham and CCI-Acute mice (7d post CCI, n = 15–18 from 4 mice/group). (H) Representative TEM images of synapses in the DG in Sham and CCI-Chronic mice (27d post CCI). Blue indicates presynaptic site and yellow indicates postsynaptic sites of excitatory synapses, respectively. Synaptic densities are bracketed by arrows (scale bar, 500 nm). (I) Mean number of excitatory synapses per μm2 of DG in Sham, unsusceptible and susceptible mice (n = 18–24 from 4 mice/group). (J) Cumulative distribution plots for the lengths and widths of postsynaptic density in the DG in Sham, unsusceptible, and susceptible mice (n = 102–156 from 4 mice/group). (K) Representative Golgi-staining images of dendritic spine morphology from the DG in Sham, unsusceptible, and susceptible mice (scale bar, top:50 μm; bottom:10 μm). (L) The number of intersections of all dendritic branches in Sham, unsusceptible, and susceptible mice (n = 15–18 from 4 mice/group). (M) Violin plots indicate the total dendritic length. (N) Violin plots indicate the number of mushroom/stubby type dendritic spines (left), and the number of thin/filopodia type dendritic spines (right) in Sham, unsusceptible, and susceptible mice (n = 15–18 from 4 mice/group). Data were analyzed by unpaired t test or one-way analysis of variance (one-way ANOVA), followed by post hoc Tukey’s multiple comparisons between multiple groups when appropriate. All data are presented as the mean ± SEM. ns, not significant; ***p < 0.001. CCI, chronic constrictive injury; d, day; DG, dentate gyrus; U, unsusceptible; S, susceptible; TEM, transmission electron microscope.
Figure 7
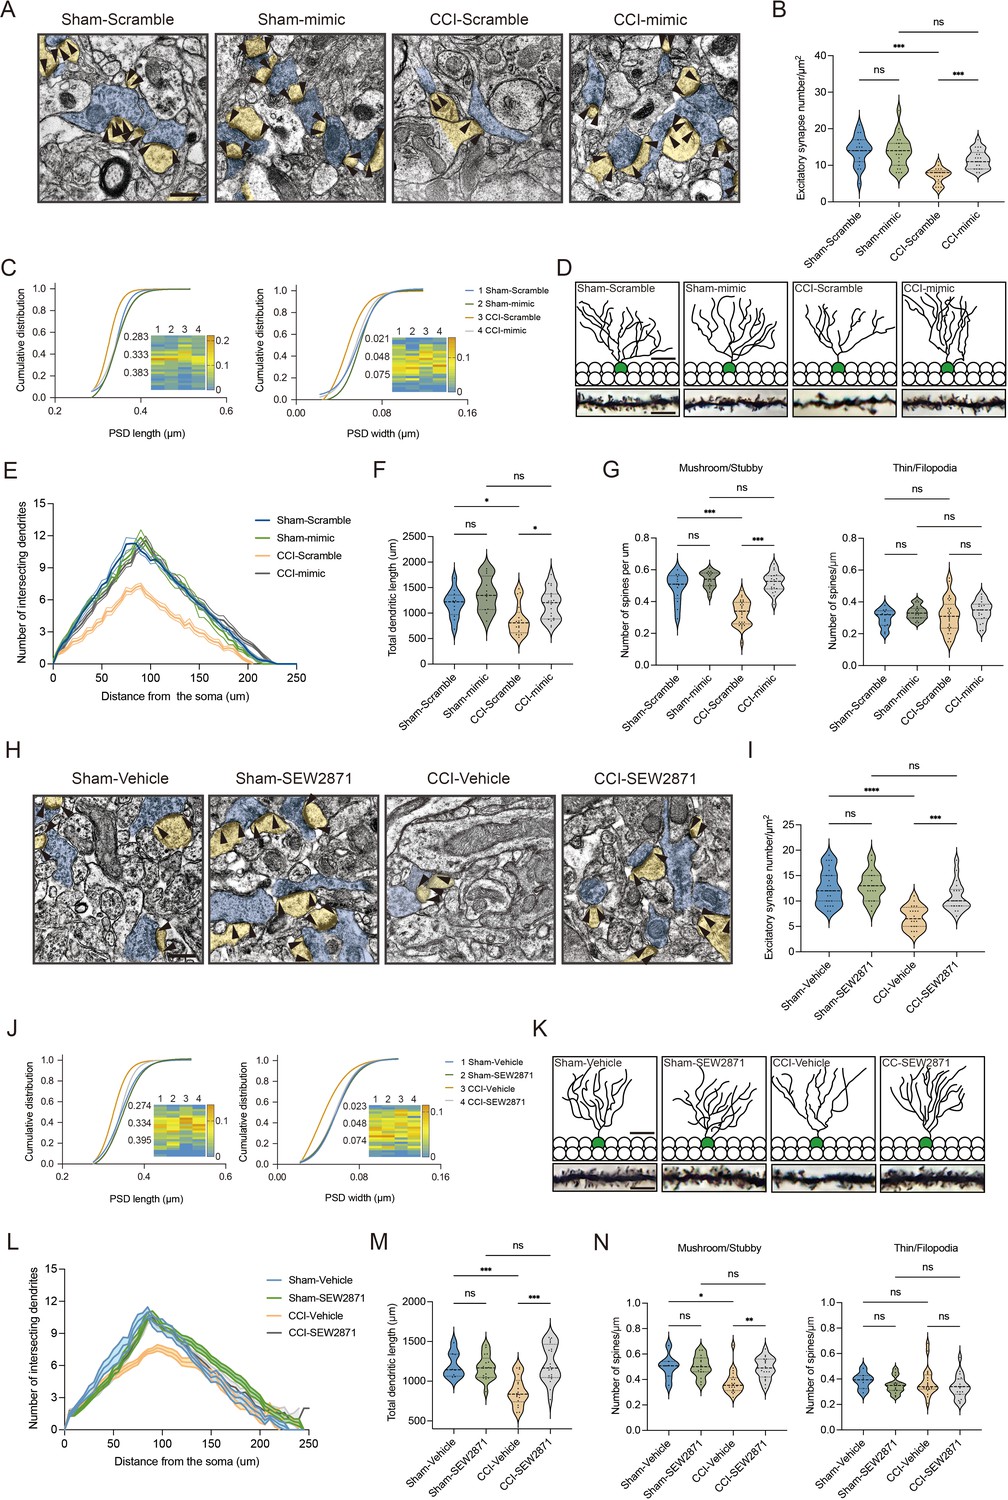
Overexpression of S1PR1 or local infusion of SEW2871 in the DG maintained the synaptic structural plasticity.
(A) Representative TEM images of synapses in the DG in Sham- and CCI-treated mice subjected to Scramble/mimic in the DG. Blue indicates presynaptic site and yellow indicates postsynaptic sites of excitatory synapses, respectively. Synaptic densities are bracketed by arrows (scale bar, 500 nm). (B) Mean number of excitatory synapses per μm2 of DG in Sham- and CCI-treated mice subjected to Scramble/mimic (n = 18–24 from 4 mice/group). (C) Cumulative distribution plots for the lengths and widths of postsynaptic density in the DG in Sham- and CCI-treated mice subjected to Scramble/mimic in the DG (n = 121–162 from 4 mice/group). (D) Representative Golgi-staining images of dendritic spine morphology from the DG in Sham- and CCI-treated mice subjected to Scramble/mimic in the DG (scale bar, top: 50 μm; bottom:10 μm). (E) The number of intersections of all dendritic branches in Sham- and CCI-treated mice subjected to Scramble/mimic in the DG (n = 18–24 from 4 mice/group). (F) Violin plots indicate the total dendritic length (n = 18–24 from 4 mice/group). (G) The number of mushroom/stubby type dendritic spines (left), and the number of thin/filopodia type dendritic spines (right) in the DG of Sham- and CCI-treated mice subjected to Scramble/mimic in the DG (n = 18–24 from 4 mice/group). (H) Representative TEM images of synapses in the DG in Sham- and CCI-treated mice subjected to local infusion of vehicle/SEW2871 in the DG. Blue indicates presynaptic site and yellow indicates postsynaptic sites of excitatory synapses, respectively. Synaptic densities are bracketed by arrows (scale bar, 500 nm). (I) Mean number of excitatory synapses per μm2 of DG in Sham- and CCI-treated mice subjected to local infusion of vehicle/SEW2871 (n = 18–24 from 4 mice/group). (J) Cumulative distribution plots for the lengths and widths of postsynaptic density in the DG in Sham- and CCI-treated mice subjected to local infusion of vehicle/SEW2871 in the DG (n = 121–162 from 4 mice/group). (K) Representative Golgi-staining images of dendritic spine morphology from the DG in Sham- and CCI-treated mice subjected to local infusion of vehicle/SEW2871 in the DG (scale bar, top: 50 μm; bottom:10 μm). (L) The number of intersections of all dendritic branches in Sham- and CCI-treated mice subjected to local infusion of vehicle/SEW2871 in the DG (n = 18–24 from 4 mice/group). (M) Violin plots indicate the total dendritic length (n = 18–24 from 4 mice/group). (N) The number of mushroom/stubby type dendritic spines (left), and the number of thin/filopodia type dendritic spines (right) in the DG of Sham- and CCI-treated mice subjected to local infusion of vehicle/SEW2871 in the DG (n = 18–24 from 4 mice/group). Data were analyzed by two-way analysis of variance (two-way ANOVA), followed by post hoc Tukey’s multiple comparisons between multiple groups. All data are presented as the mean ± SEM. ns, not significant; *p < 0.05; **p < 0.01; ***p < 0.001; ****p < 0.0001. CCI, chronic constrictive injury; DG, dentate gyrus; TEM, transmission electron microscope.
Figure 8 with 1 supplement
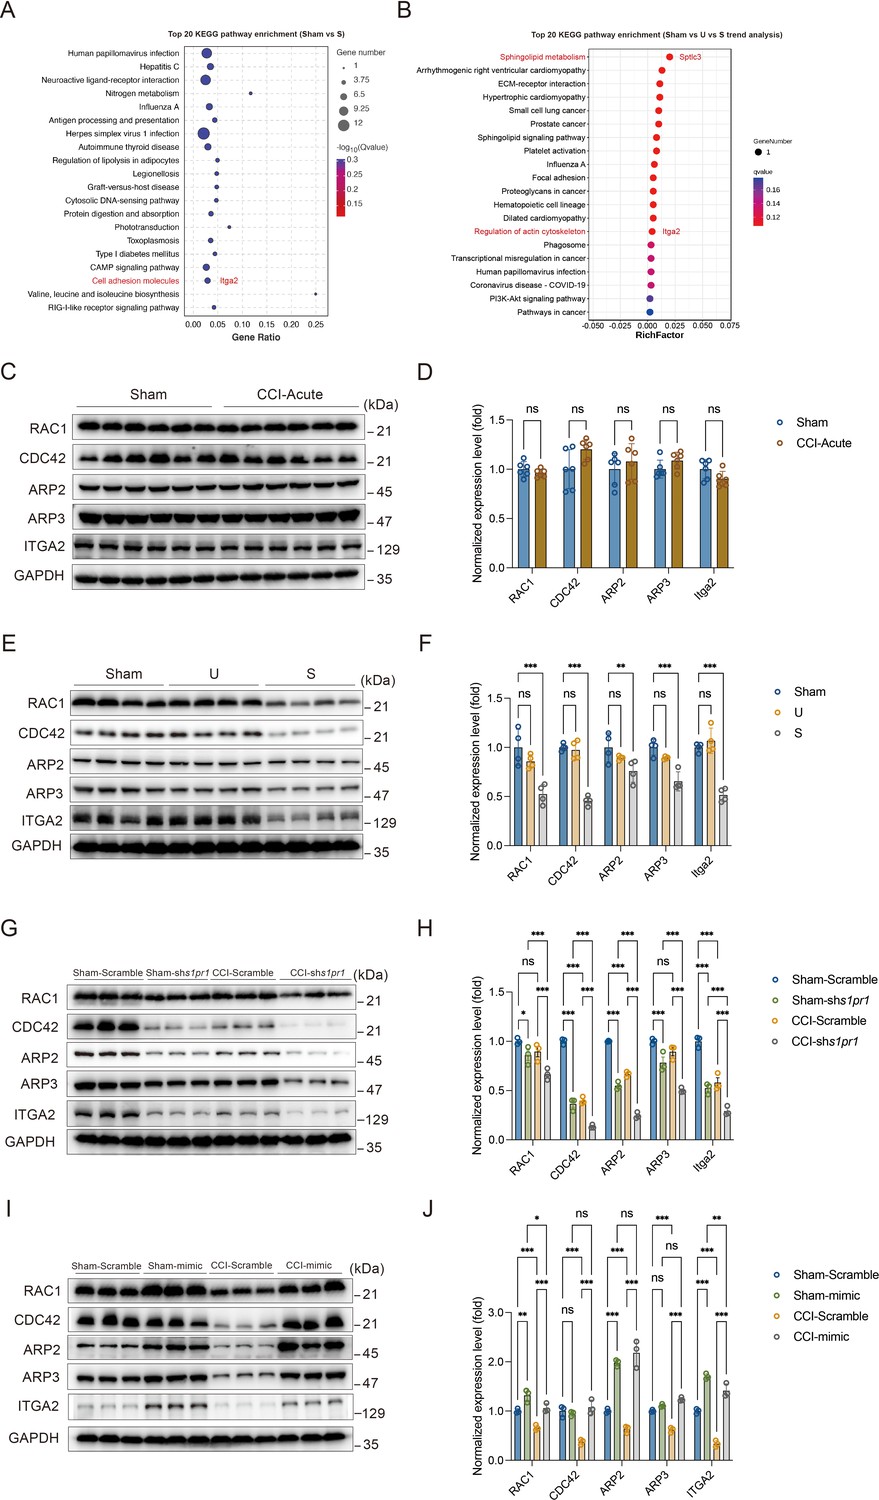
Susceptible mice, S1PR1-knockdown mice, and S1PR1 overexpression mice exhibit altered CDC42/RAC1 activity, ARP2/3-dependent actin signaling and engage ITGA2 in the dentate granule cells (DGCs).
(A) Bubble diagram showing significant enrichment of differentially expressed genes (DEGs) in top 20 KEGG pathways for Sham versus susceptible mice. (B) Bubble diagram represents the top 20 enrichment of KEGG pathways using analysis of Sham versus U versus S. (C) Example western bands showing expression of RAC1, CDC42, ARP2, ARP3, and ITGA2 in DG lysates from Sham and CCI-Acute mice (7d post CCI). (D) Densitometric comparison of the average expression of RAC1, CDC42, ARP2, ARP3, and ITGA2 (n = 6). (E) Example western bands showing expression of RAC1, CDC42, ARP2, ARP3, and ITGA2 in DG lysates from Sham, U, and S mice. (F) Densitometric comparison of the average expression of RAC1, CDC42, ARP2, ARP3, and ITGA2 (n = 6). (G) Example western bands showing expression of RAC1, CDC42, ARP2, ARP3, and ITGA2 in DG lysates from in Sham- and CCI-treated mice subjected to Scramble/shS1pr1 in the DG. (H) Densitometric comparison of the average expression of RAC1, CDC42, ARP2, ARP3, and ITGA2 (n = 6). (I) Example western bands showing expression of RAC1, CDC42, ARP2, ARP3, and ITGA2 in DG lysates from in Sham- and CCI-treated mice subjected to Scramble/S1pr1-mimic in the DG. (J) Densitometric comparison of the average expression of RAC1, CDC42, ARP2, ARP3, and ITGA2 (n = 6). Data were analyzed by unpaired t test or two-way analysis of variance (two-way ANOVA), followed by post hoc Tukey’s multiple comparisons between multiple groups when appropriate. All data are presented as the mean ± SEM. ns, not significant; *p < 0.05; **p < 0.01; ***p < 0.001. CCI, chronic constrictive injury; DG, dentate gyrus; U, unsusceptible; S, susceptible.
-
Figure 8—source data 1
PDF file containing original western blots for Figure 8C, E, G, I, indicating the relevant bands.
- https://cdn.elifesciences.org/articles/99862/elife-99862-fig8-data1-v1.pdf
-
Figure 8—source data 2
Original files for western blot analysis displayed in Figure 8C, E, G, I.
- https://cdn.elifesciences.org/articles/99862/elife-99862-fig8-data2-v1.zip
Figure 8—figure supplement 1
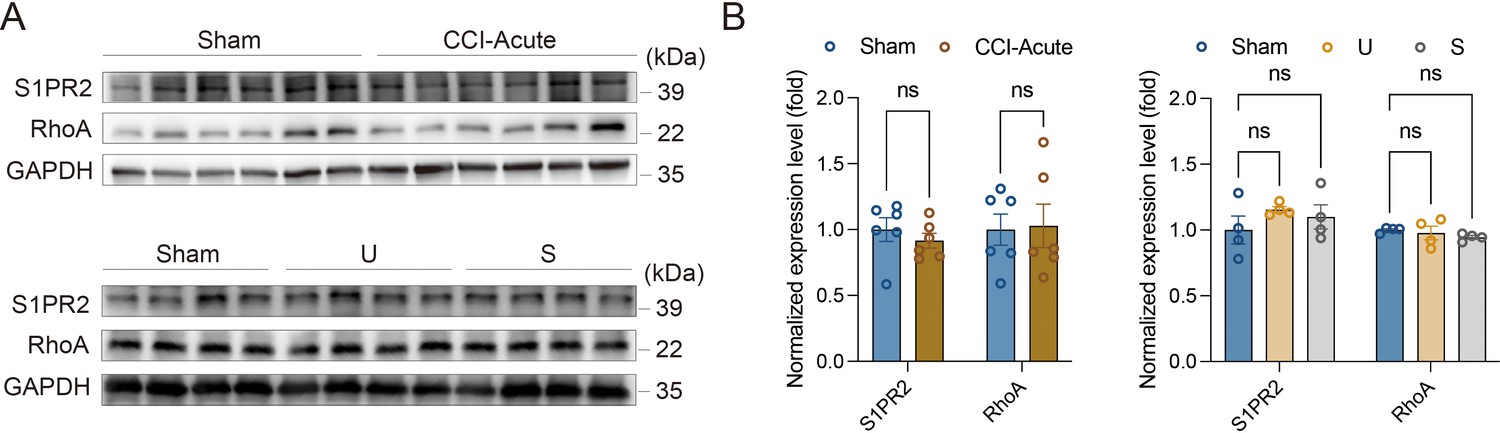
Expression levels of S1PR2 and RhoA in Sham and CCI animals.
(A) Example western bands showing expression of S1PR2 and RhoA in DG lysates from Sham and CCI-Acute mice (7d post CCI), Sham and CCI-Chronic mice (unsusceptible and susceptible populations, 21d post CCI). (B) Densitometric comparison of the average expression of S1PR2 and RhoA (n = 6 for CCI-Acute mice, n = 4 for CCI-Chronic mice). Data were analyzed by unpaired t test or one-way analysis of variance (one-way ANOVA), followed by post hoc Tukey’s multiple comparisons between multiple groups when appropriate. All data are presented as the mean ± SEM. ns, not significant. CCI, chronic constrictive injury; DG, dentate gyrus; U, unsusceptible; S, susceptible.
-
Figure 8—figure supplement 1—source data 1
PDF file containing original western blots for Figure 8—figure supplement 1A, indicating the relevant bands.
- https://cdn.elifesciences.org/articles/99862/elife-99862-fig8-figsupp1-data1-v1.pdf
-
Figure 8—figure supplement 1—source data 2
Original files for western blot analysis displayed in Figure 8—figure supplement 1A.
- https://cdn.elifesciences.org/articles/99862/elife-99862-fig8-figsupp1-data2-v1.zip
Figure 9 with 4 supplements

S1PR1 regulates actin polymerization by interaction with ITGA2.
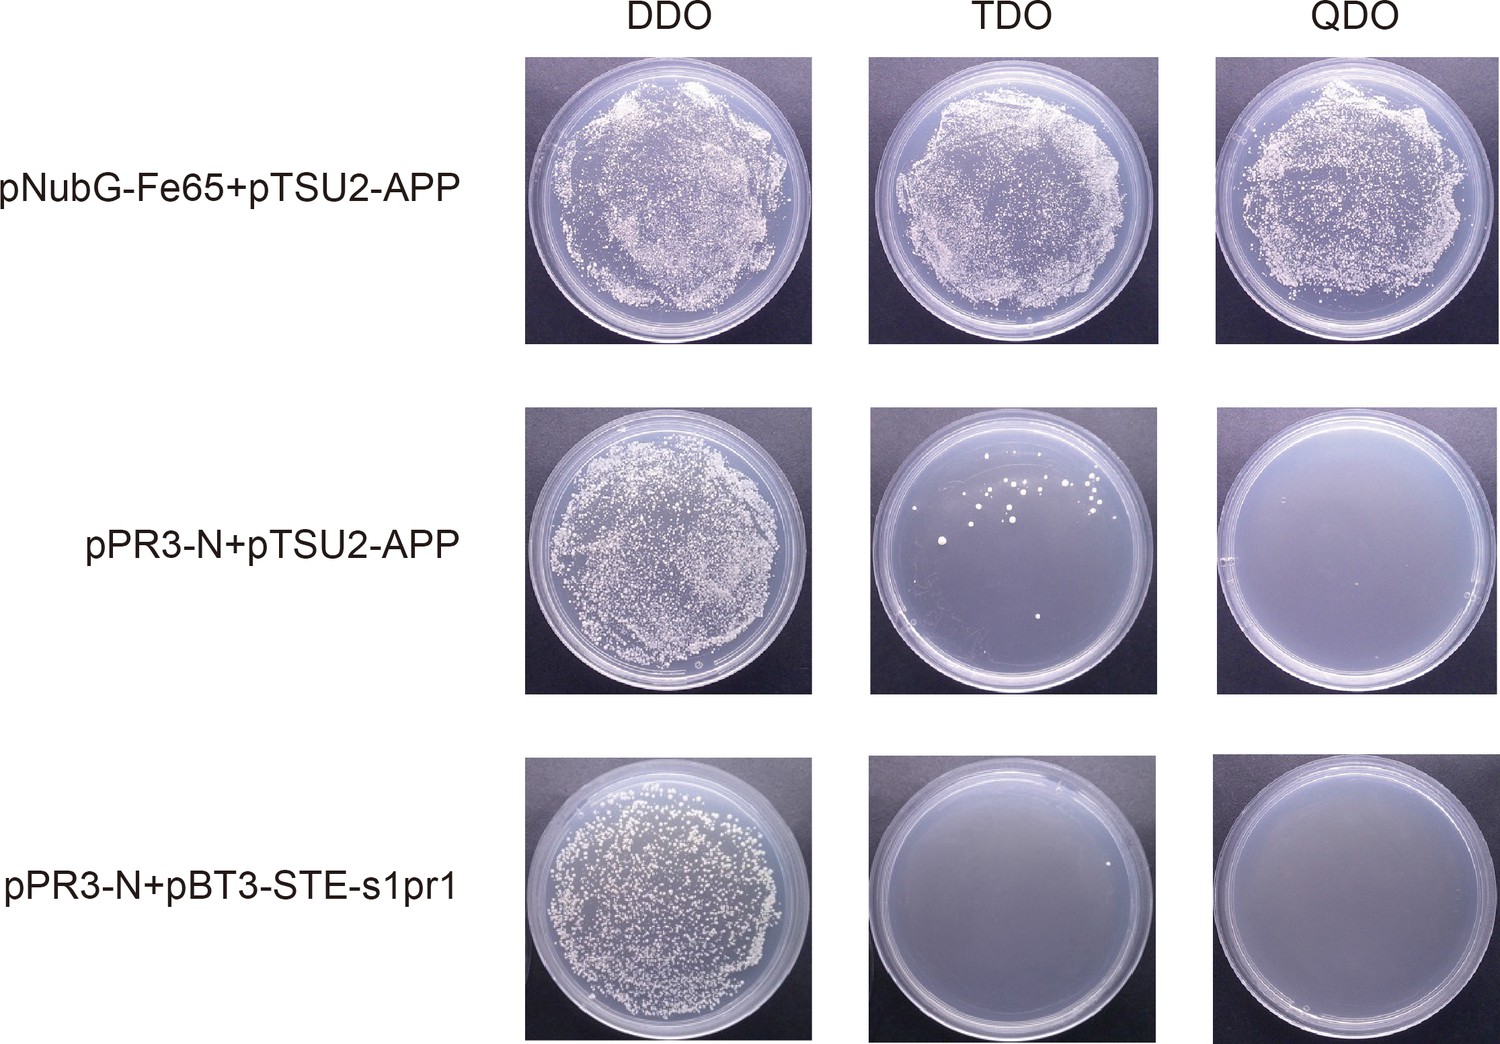
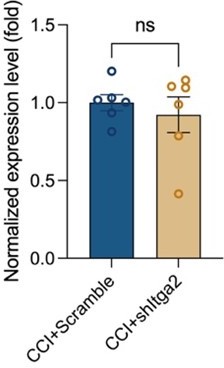
(A, B) Quantification of F/G-actin ratio in dentate gyrus of Sham, U, and S mice by western blot. (C) Phalloidin staining of F-actin showing the simple cytoskeleton of S1pr1−/− knockdown HT-22 cells and primary hippocampal neurons in comparison to highly organized actin fibers present within scramble HT-22 cells and primary hippocampal neurons (scale bar, 50 μm). (D) Interaction between S1PR1 and ITGA2 in a yeast two-hybrid system. pNubG-Fe65 and pTSU2-APP were used as a pair of positive control. pPR3-N and pTSU2-APP were used as a negative control. DDO, SD/-Trp/-Leu; QDO, SD/-Trp/-Leu/-His/-Ade. (E) In vivo co-immunoprecipitation assay shows that S1PR1 interacts with ITGA2 in the dentate gyrus of mice. Total protein extracts were immunoprecipitated by the anti-S1PR1-specific antibody and analyzed by immunoblot probed with the anti-S1PR1 and anti-ITGA2 antibodies. Immunoglobulin G was used as the negative control. (F) Timeline of intra-DG virus injection, CCI surgery, pain threshold tests, Y-maze test, and MWM training. (G) A confocal image showing virus expression in the DG (scale bar, 100 μm). (H) Example western bands showing efficient ITGA2 knockdown in the DG lysates from Sham-Scramble, Sham-shItga2, CCI-Scramble, and CCI-shItga2. Densitometric comparison of the average expression of S1PR1 (n = 3). (I) Pain threshold in Sham- and CCI-treated mice subjected to Scramble/shItga2 in the DG (n = 10–20). (J) Quantitative summary of Y-maze showing distances traveled and time spent in the novel arm in Sham- and CCI-treated mice subjected to Scramble/shItga2 in the DG (n = 10–19). (K) Quantitative summary of MWM training showing escape latency and time spent in the quadrant in Sham- and CCI-treated mice subjected to Scramble/shItga2 in the DG (n = 9–20). (L) Timeline of intra-DG virus injection, Y-maze test and MWM training. (M) A confocal image showing virus expression in the DG (scale bar, 100 μm). (N) Quantitative summary of Y-maze showing distances traveled and time spent in the novel arm in WT mice subjected to Scramble/shS1pr1/shItga2/shS1pr1+shItga2 in the DG (n = 10). (O) Quantitative summary of MWM training showing escape latency and time spent in the quadrant in WT mice subjected to Scramble/shS1pr1/shItga2/shS1pr1+shItga2 in the DG (n = 10). Data were analyzed by one-way or two-way analysis of variance (one-way or two-way ANOVA), followed by post hoc Tukey’s multiple comparisons between multiple groups. All data are presented as the mean ± SEM. ns, not significant; *p < 0.05; **p < 0.01; ***p < 0.001; ****p < 0.0001. CCI, chronic constrictive injury; d, day; MWM, Morris water maze; PWL, paw withdrawal latency; PWT, paw withdrawal threshold; DG, dentate gyrus; U, unsusceptible; S, susceptible.
-
Figure 9—source data 1
PDF file containing original western blots for Figure 9A, E, H, indicating the relevant bands.
- https://cdn.elifesciences.org/articles/99862/elife-99862-fig9-data1-v1.pdf
-
Figure 9—source data 2
Original files for western blot analysis displayed in Figure 9A, E, H.
- https://cdn.elifesciences.org/articles/99862/elife-99862-fig9-data2-v1.zip
Figure 9—figure supplement 1
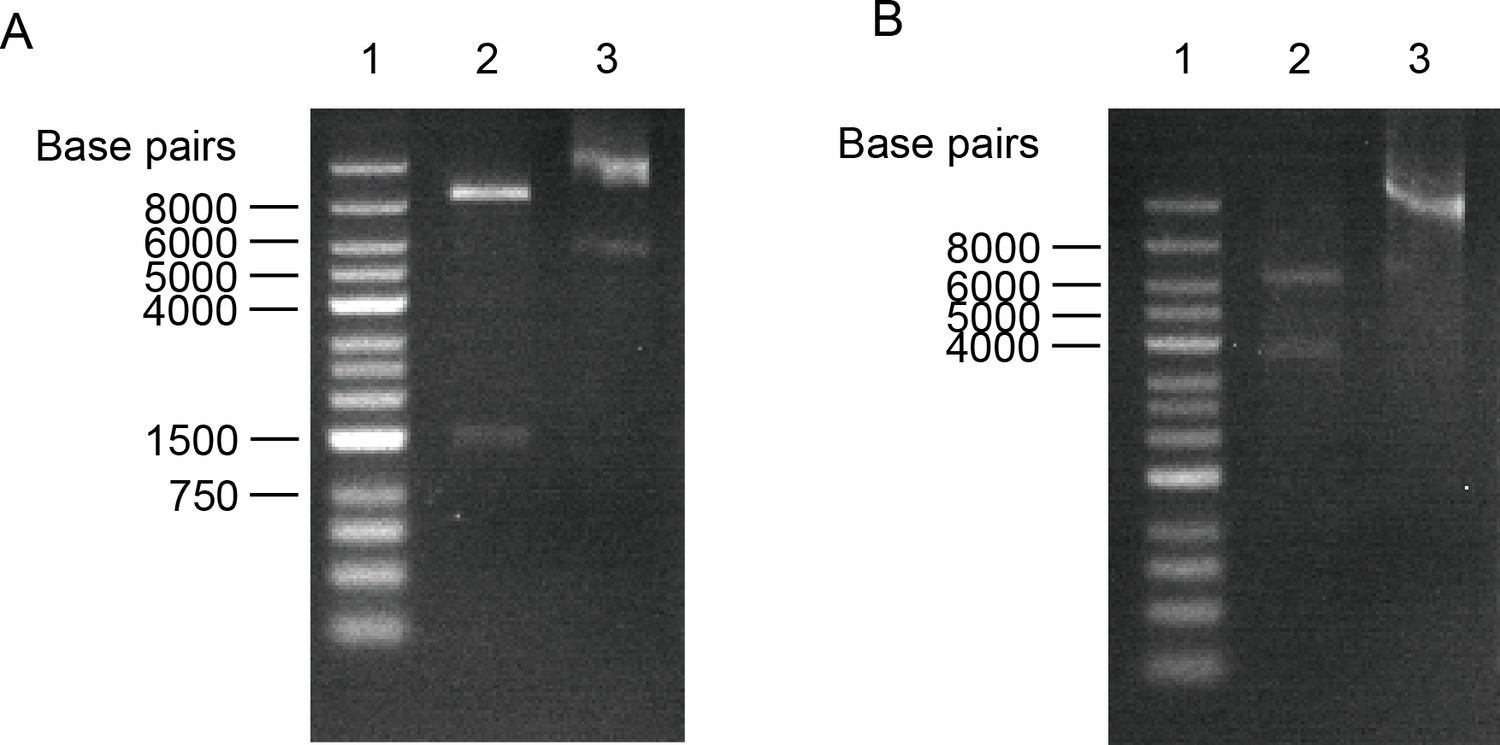
Verification for plasmid construction by polymerase chain reaction (PCR) followed by restriction digestion.
(A) pBT3-STE-s1pr1 plasmid digested with XbaI-HindIII. (B) pPR3-C-itga2 plasmid digested with SalI-BamHI. Lane 1, 2, 3 in (A–B) represents DNA ladder, plasmid digested with restriction enzymes and empty plasmid control.
-
Figure 9—figure supplement 1—source data 1
PDF file containing unedited gels for Figure 9—figure supplement 1, with lanes labelled.
- https://cdn.elifesciences.org/articles/99862/elife-99862-fig9-figsupp1-data1-v1.pdf
-
Figure 9—figure supplement 1—source data 2
Original unedited gels for Figure 9—figure supplement 1.
- https://cdn.elifesciences.org/articles/99862/elife-99862-fig9-figsupp1-data2-v1.zip
Figure 9—figure supplement 2
The auto-activation test.
Lines 1, 2, and 3 represent a positive control (the pNubG-Fe65 and pTSU2-APP vector together), a negative control, and the pPR3-N empty vector and the pBT3-STE vector with S1pr1 growing on the DDO (SD/-Trp/-Leu), TDO (SD/-Trp/-Leu/-His), and QDO (SD/-Trp/-Leu/-His/-Ade) plates, respectively.
Figure 9—figure supplement 3

Zoomed-out images of the brain to show the precision of the virus injection (scale bar, 1000 μm).
Figure 9—figure supplement 4

Zoomed-out images of the brain to show the precision of the virus injection (scale bar, 1000 μm).
Figure 10
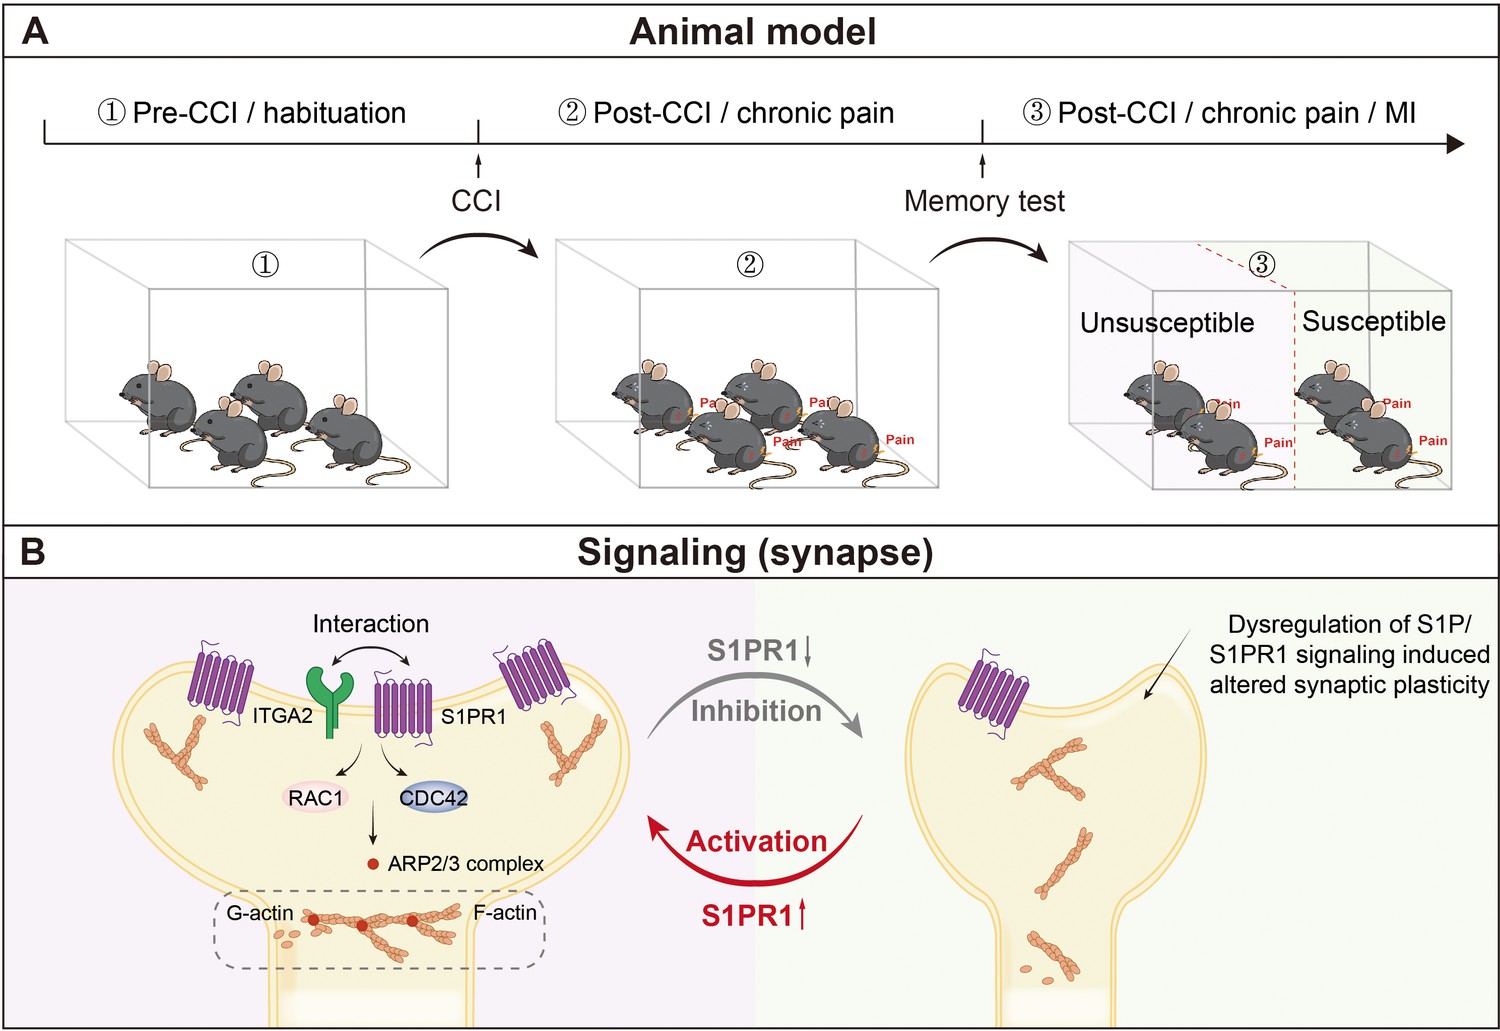
Schematic representation of S1P/S1PR1-mediated susceptibility to chronic pain-related memory impairment.
(A) Mice subjected to chronic pain can be separated into memory impairment-susceptible and -unsusceptible subpopulations 21 days post CCI. (B) Structural synaptic plasticity is mainly regulated by the actin cytoskeleton organization. In the DGCs of Sham/unsusceptible mice, S1P/S1PR1 signaling mediates actin dynamics via Itga2-dependent activation of the Rac1/Cdc42 signaling cascade and Arp2/3-dependent actin polymerization, whereas in susceptible mice dysregulation of S1P/S1PR1 signaling in the DGCs leads to defective actin cytoskeleton organization which alters the synaptic plasticity. CCI, chronic constrictive injury; MI, memory impairment; DGCs, dentate granule cells.
Author response image 1
Author response image 2
Author response image 3

Author response image 4
Additional files
-
Supplementary file 1
Virus vectors, chemicals, and antibodies used in this study.
- https://cdn.elifesciences.org/articles/99862/elife-99862-supp1-v1.docx
-
MDAR checklist
- https://cdn.elifesciences.org/articles/99862/elife-99862-mdarchecklist1-v1.docx
Download links
A two-part list of links to download the article, or parts of the article, in various formats.
Downloads (link to download the article as PDF)
Open citations (links to open the citations from this article in various online reference manager services)
Cite this article (links to download the citations from this article in formats compatible with various reference manager tools)
Dysfunctional S1P/S1PR1 signaling in the dentate gyrus drives vulnerability of chronic pain-related memory impairment
eLife 13:RP99862.
https://doi.org/10.7554/eLife.99862.3


