Lifestyles and their relative contribution to biological aging across multiple-organ systems: Change analysis from the China Multi-Ethnic Cohort study
- West China School of Public Health and West China Fourth Hospital, Sichuan University, China
- Xiamen Center for Disease Control and Prevention, China
- Chengdu Center for Disease Control and Prevention, China
- School of Medicine, Tibet University, China
- Chongqing Municipal Centre for Disease Control and Prevention, China
- School of Public Health, the Key Laboratory of Environmental Pollution Monitoring and Disease Control, Ministry of Education, Guizhou Medical University, China
- School of Public Health, Kunming Medical University, China
Figures
Figure 1
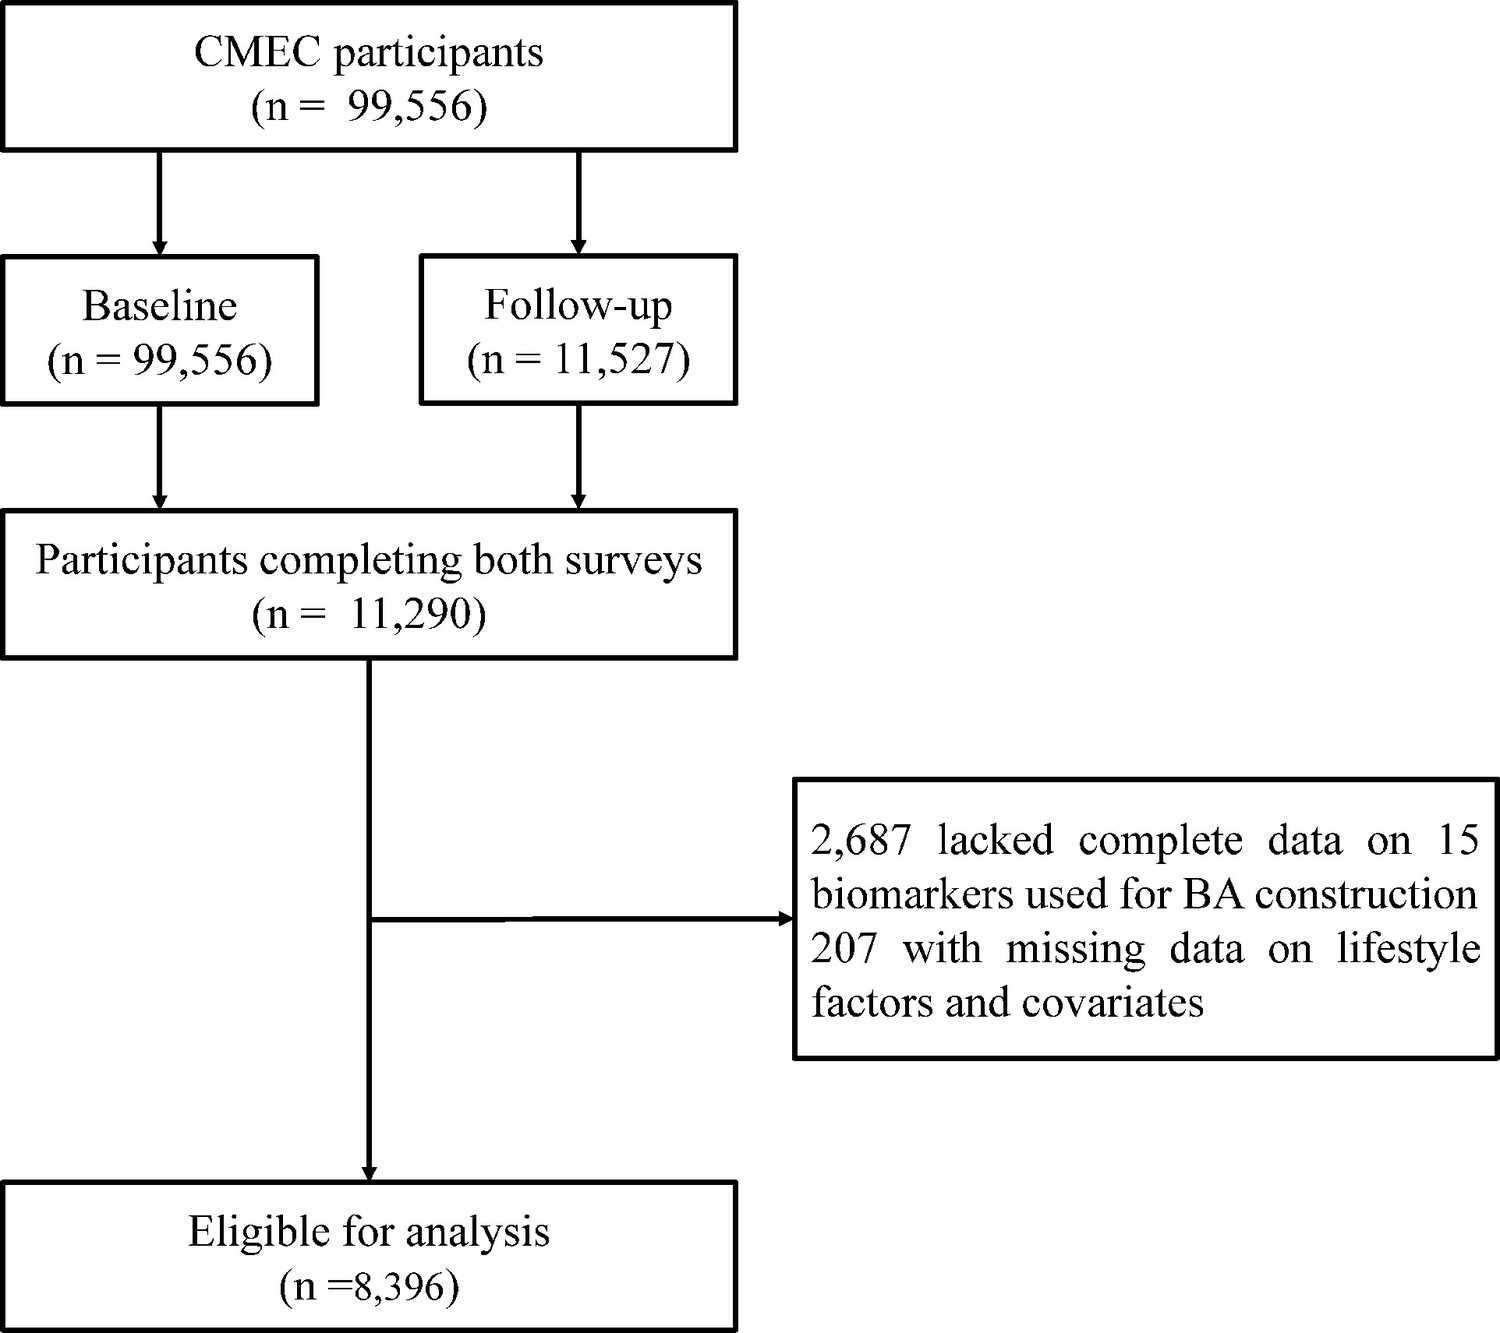
Flowchart of the study.
Figure 2
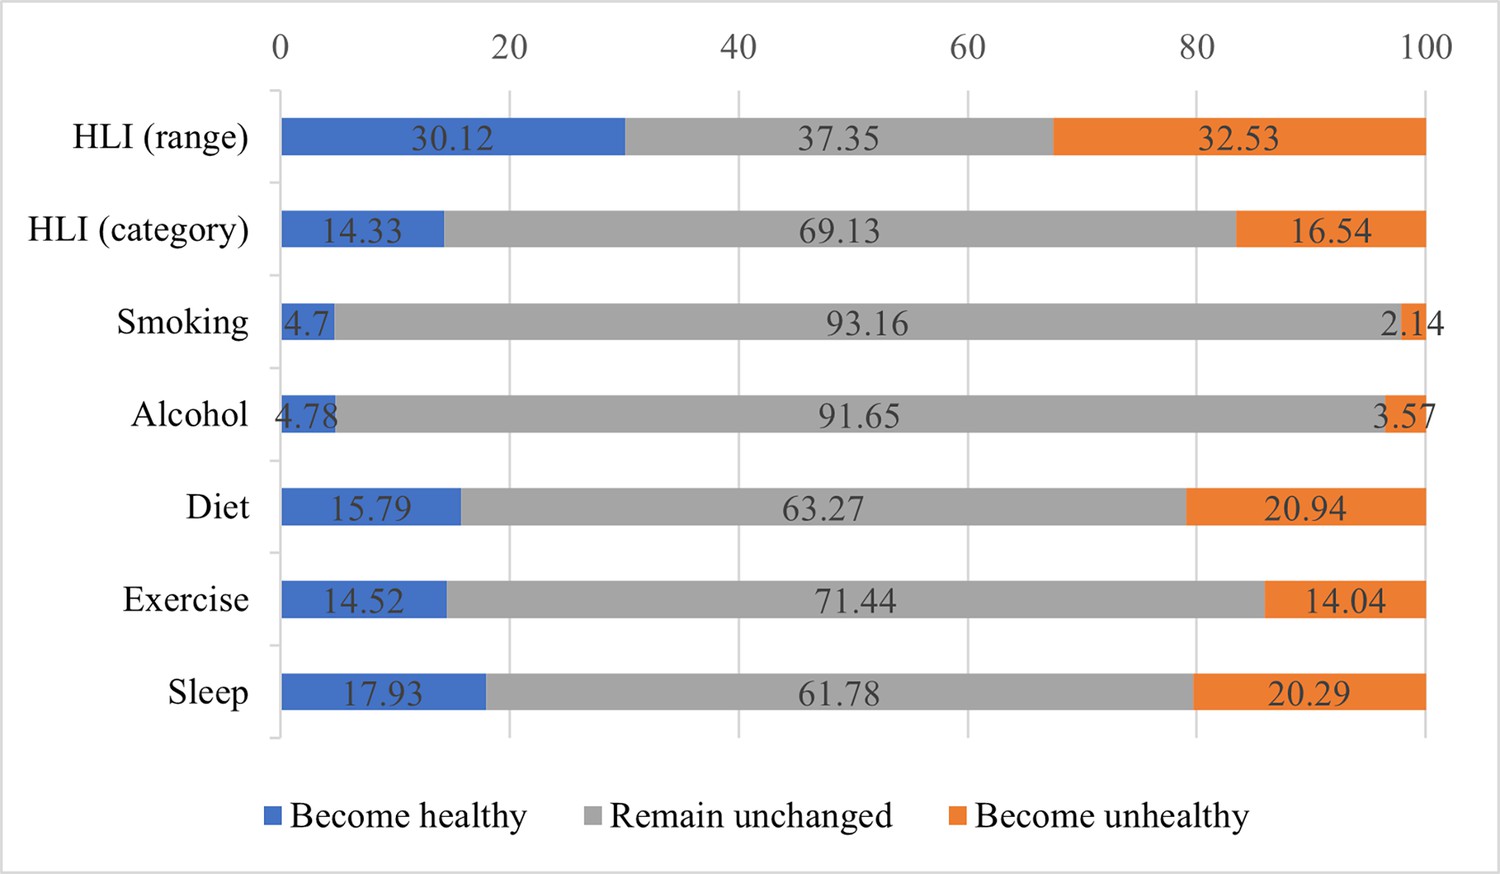
Changes in lifestyle factors from baseline to repeated survey.
The blue bars represent the percentage of individuals who have transitioned to healthier behaviors or improved their healthy lifestyle indicator (HLI) score; the gray bars represent the percentage of individuals whose behaviors or HLI score have not changed; the orange bars represent the percentage of individuals who have transitioned to unhealthier behaviors or whose HLI score has decreased.
Figure 3 with 6 supplements
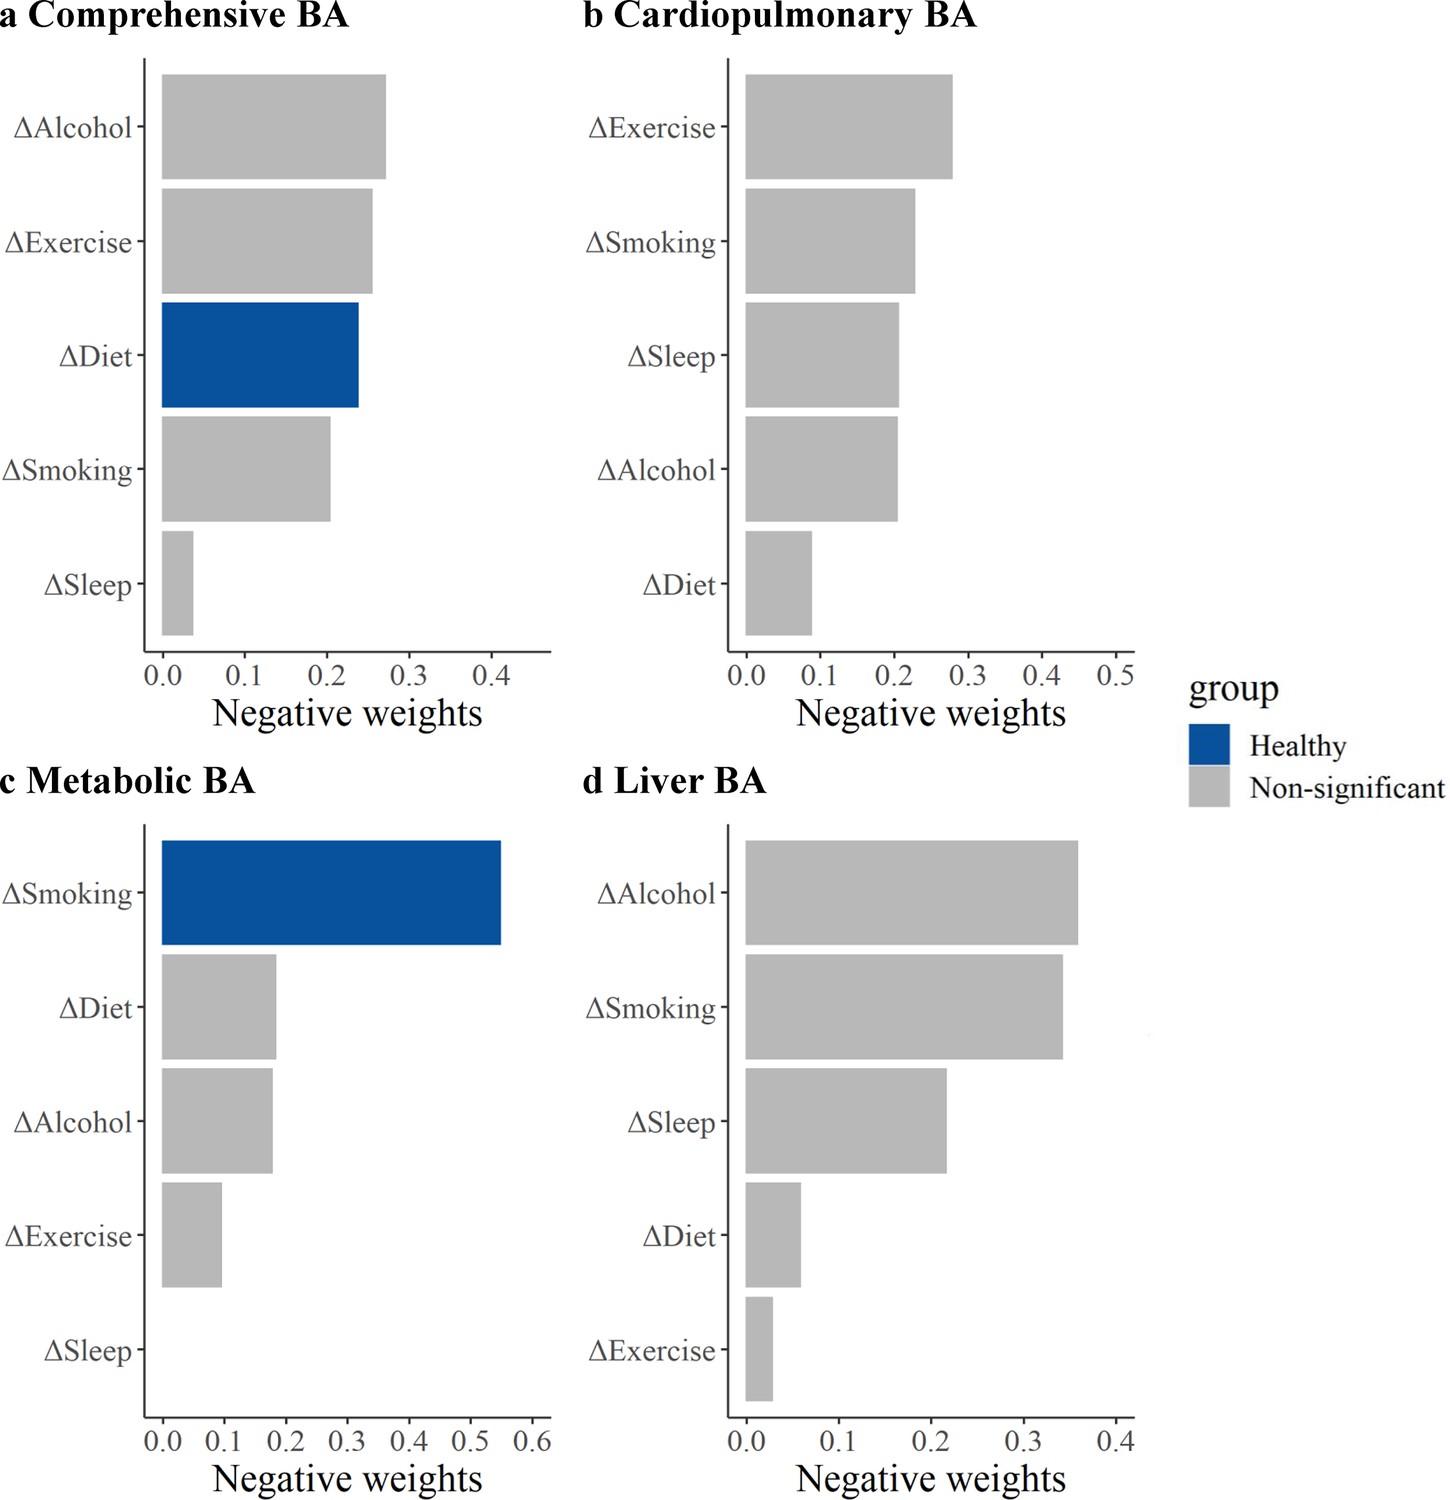
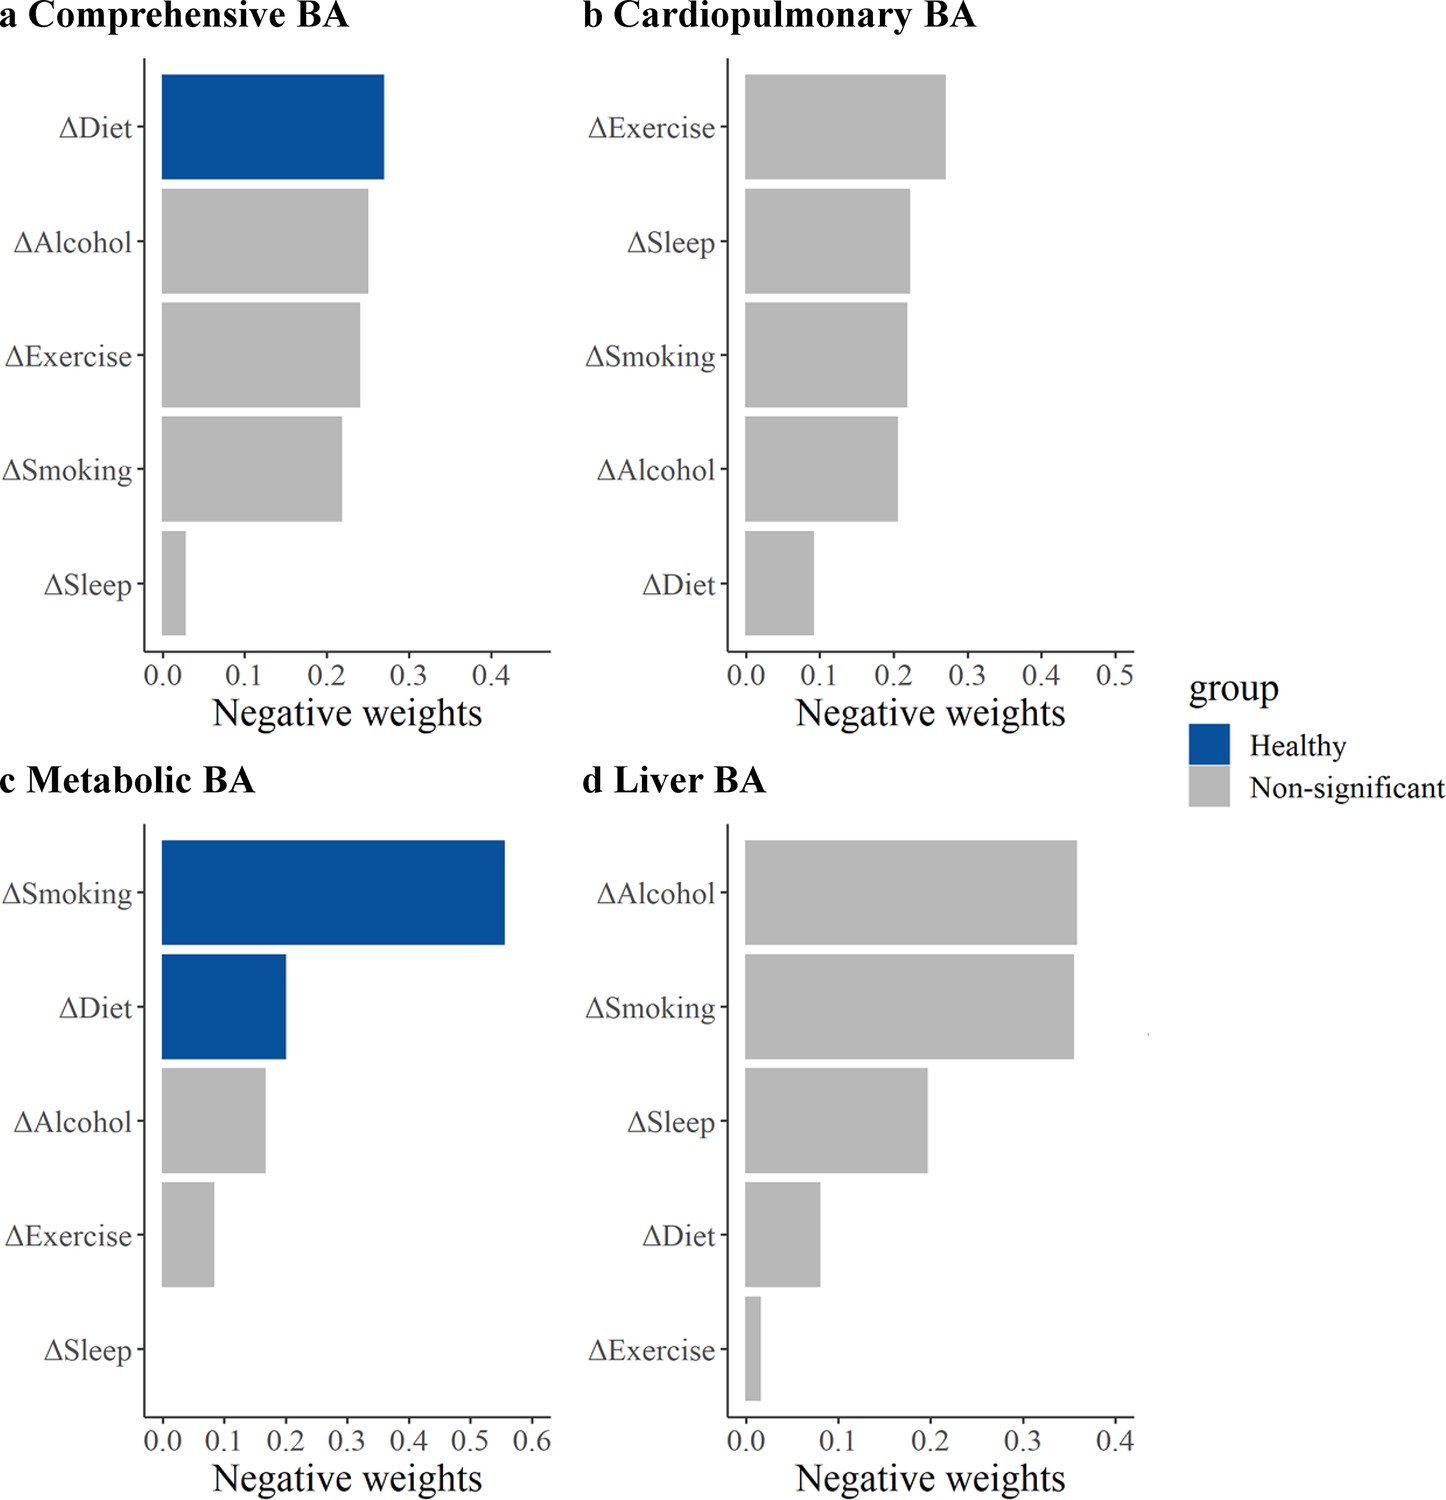
Relative contributions of five healthy lifestyle components to biological age (BA) acceleration.
Panels: results of the comprehensive BA acceleration, the cardiopulmonary BA acceleration, the metabolic BA acceleration, and the liver BA acceleration (a–d). ΔSmoking, change in smoking status between the baseline and repeated survey; ΔAlcohol, change in alcohol consumption between the baseline and repeated survey; ΔDiet, change in dietary quality between the baseline and repeated survey; ΔExercise, change in exercise between the baseline and repeated survey; ΔSleep, change in sleep between the baseline and repeated survey. Estimates were obtained using quantile G-computation (QGC), which treated the BA accelerations as the dependent variables and five individual lifestyle factors as the independent variables. Models were adjusted for age, occupation, marital status, total energy intake, depression symptoms, anxiety symptoms, menopausal status in women, beverage intake, dietary supplement intake, diabetes, cardiovascular disease, cancer, sex, ethnicity, urbanicity, education, and the participants' age at baseline. The blue bars represent results that are statistically significant in the fixed effects model (FEM) analysis, while the gray bars represent results in the FEM analysis that were not found to be statistically significant and positive weights were not shown.
Figure 3—figure supplement 1
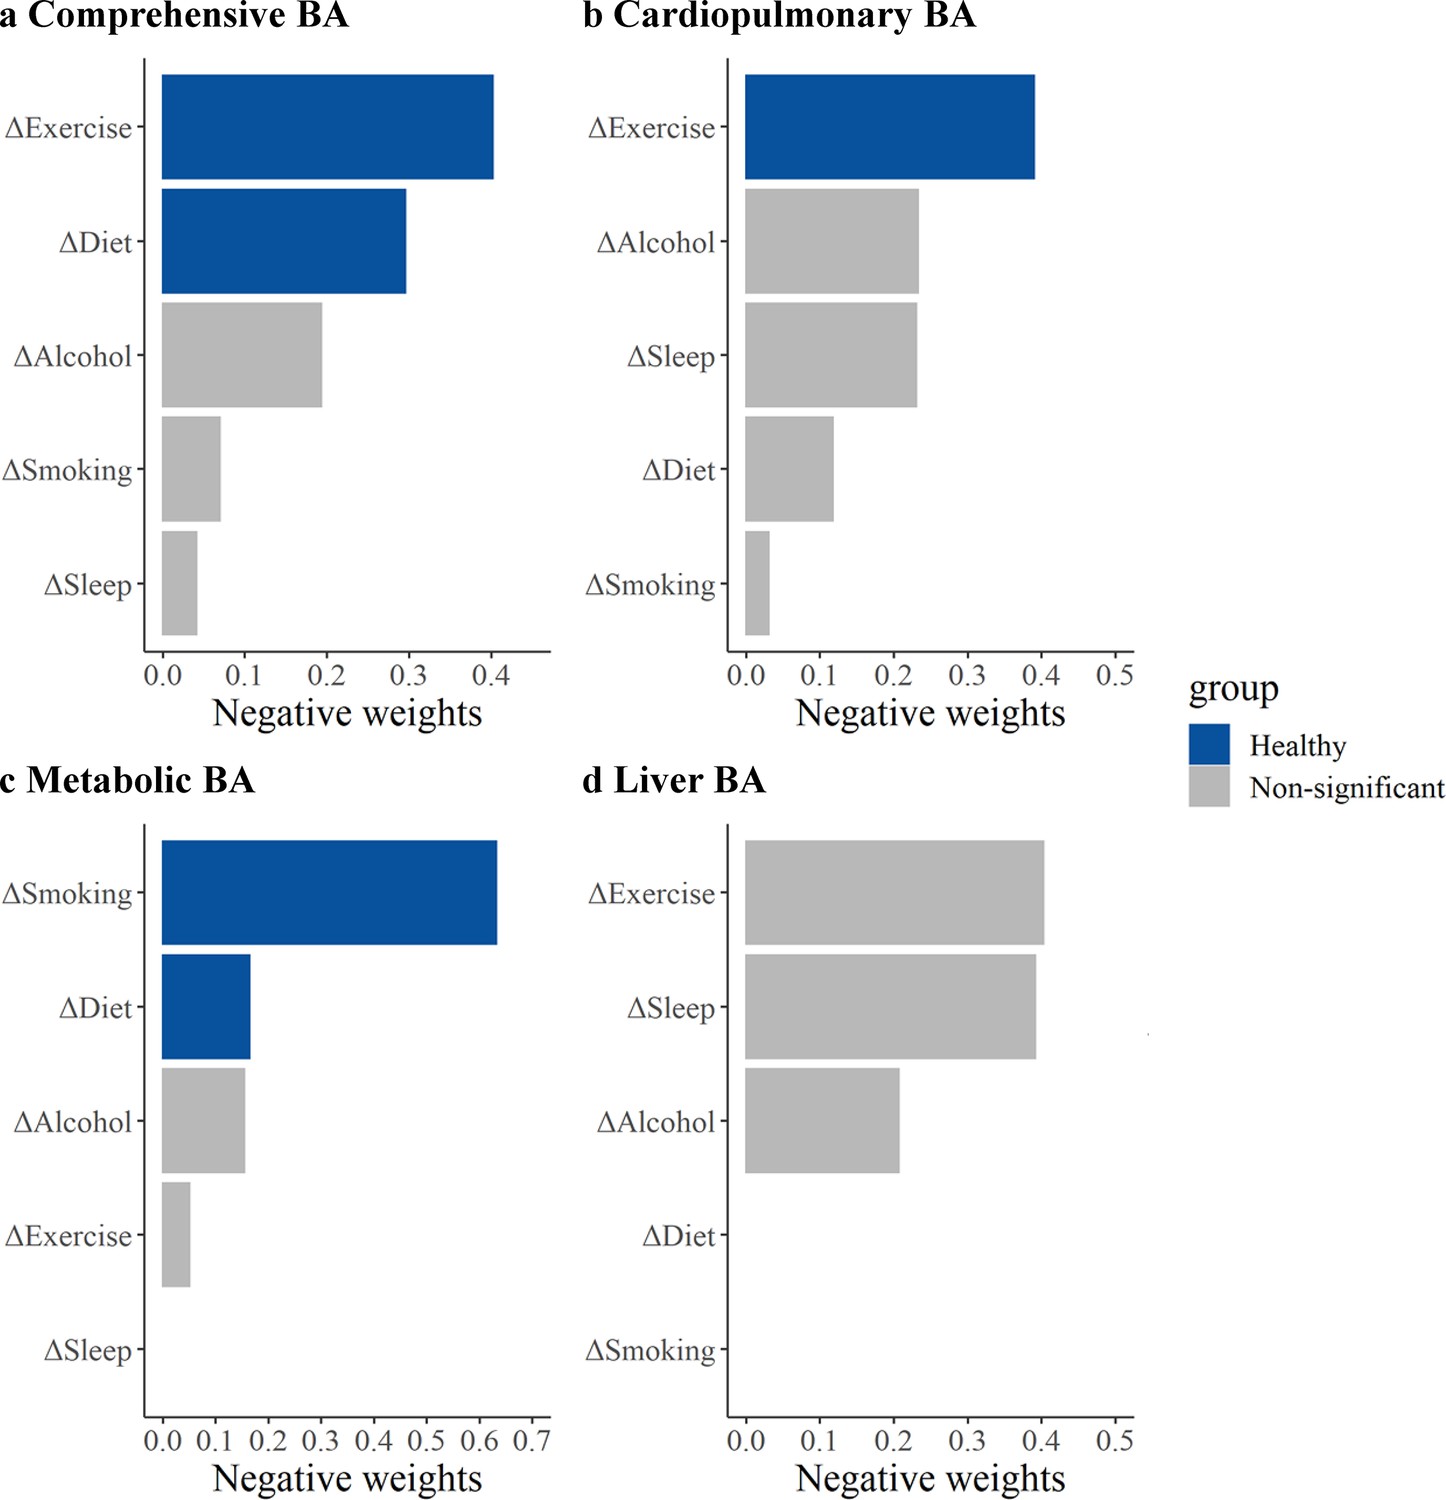
Relative contributions of five healthy lifestyle components to biological age (BA) acceleration with adjustment for time-varying covariate.
Panels: results of the comprehensive BA acceleration, the cardiopulmonary BA acceleration, the metabolic BA acceleration, and the liver BA acceleration (a–d). ΔSmoking, change in smoking status between the baseline and repeated survey; ΔAlcohol, change in alcohol consumption between the baseline and repeated survey; ΔDiet, change in dietary quality between the baseline and repeated survey; ΔExercise, change in exercise between the baseline and repeated survey; ΔSleep, change in sleep between the baseline and repeated survey. Estimates were obtained using quantile G-computation (QGC) treating the BA accelerations as the dependent variables and five individual lifestyle factors as the independent variables. Models were adjusted for age, occupation, marital status, total energy intake, depression symptoms, anxiety symptoms, menopausal status in women, beverage intake, dietary supplement intake, diabetes, cardiovascular disease, and cancer. The blue bars represent results that are statistically significant in the fixed effects model (FEM) analysis, while the gray bars represent results in the FEM analysis that were not found to be statistically significant and positive weights were not shown.
Figure 3—figure supplement 2
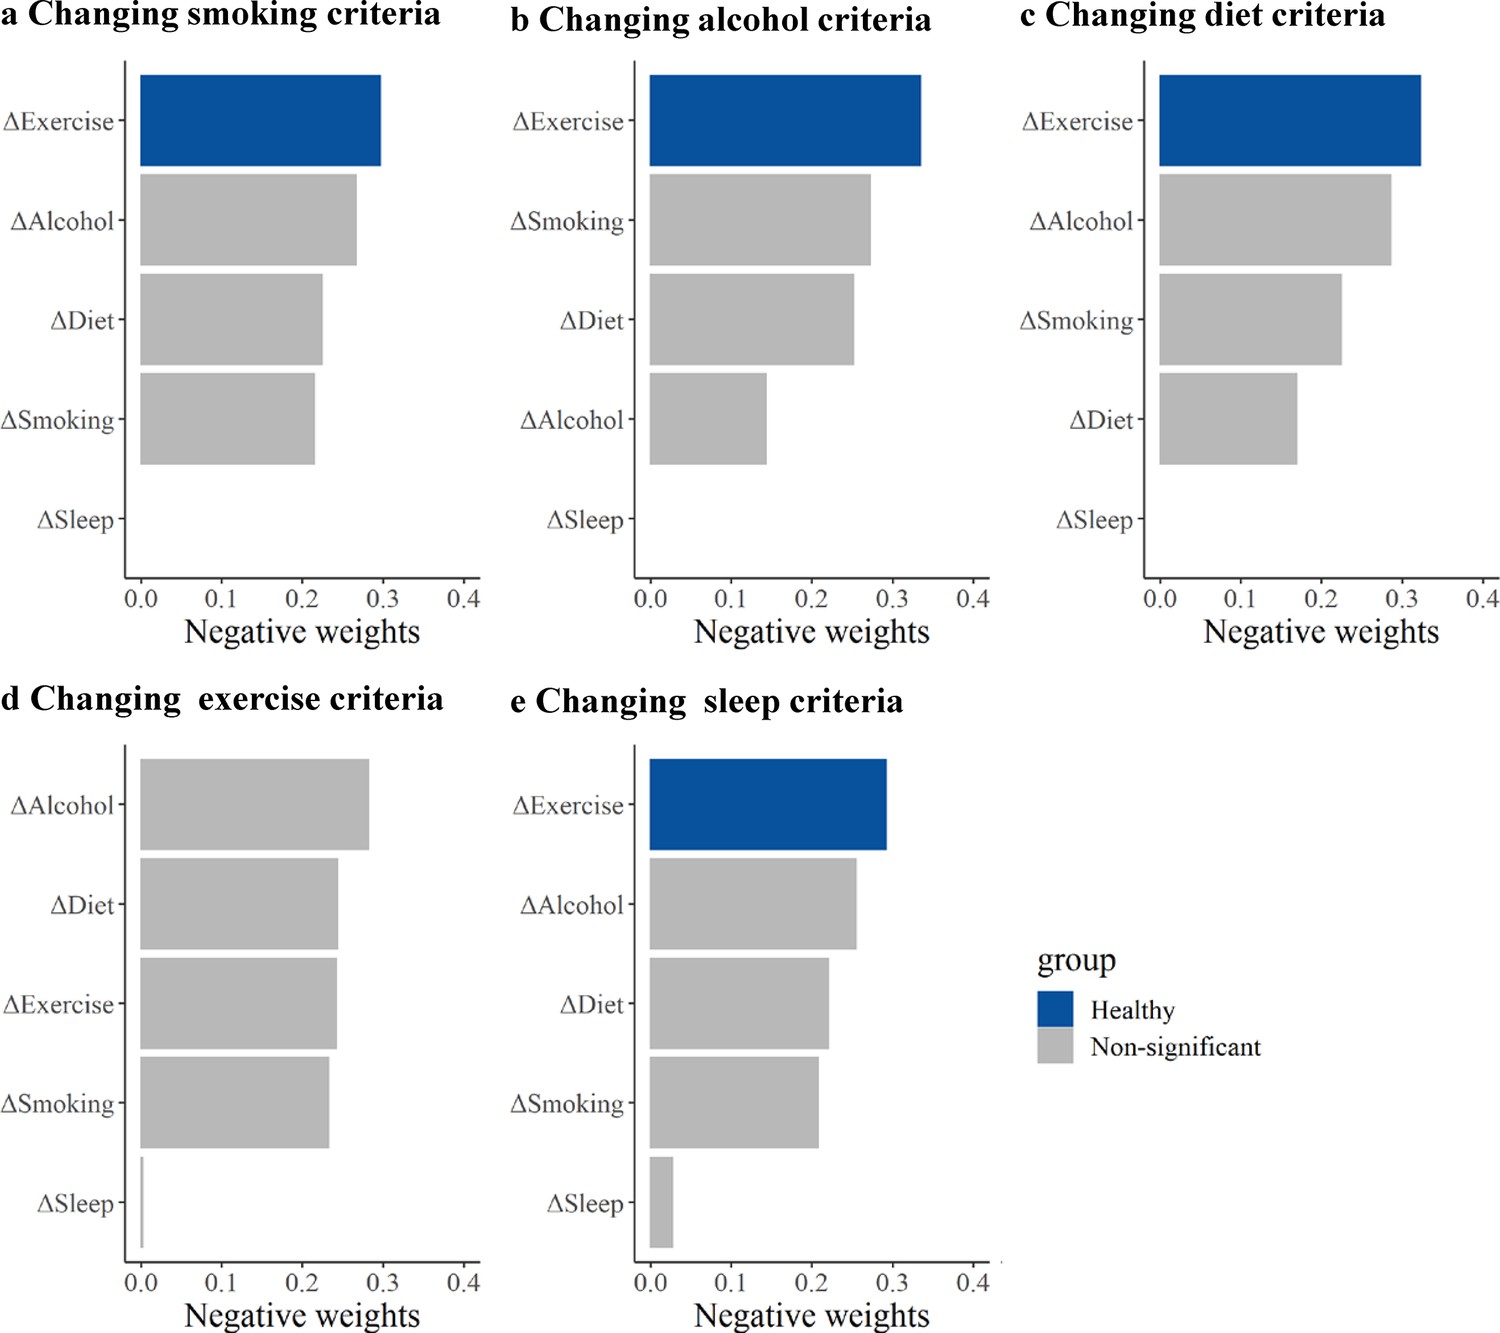
The relative contributions of five healthy lifestyle components to the comprehensive biological age (BA) acceleration with altered healthy lifestyle criteria.
Panels: results of the comprehensive BA acceleration when definitions of smoking, alcohol, diet, exercise, and sleep are changed separately (a–e). ΔSmoking, change in smoking status between the baseline and repeated survey; ΔAlcohol, change in alcohol consumption between the baseline and repeated survey; ΔDiet, change in dietary quality between the baseline and repeated survey; ΔExercise, change in exercise between the baseline and repeated survey; ΔSleep, change in sleep between the baseline and repeated survey. Estimates were obtained using quantile G-computation (QGC) treating the comprehensive BA acceleration as the dependent variables and five individual lifestyle factors as the independent variables. All models were adjusted for age, occupation, marital status, total energy intake, depression symptoms, anxiety symptoms, menopausal status in women, beverage intake, dietary supplement intake, diabetes, cardiovascular disease, cancer, sex, ethnicity, urbanicity, education, and the participants' age at baseline. The blue bars represent results that are statistically significant in the fixed effects model (FEM) analysis, while the gray bars represent results in the FEM analysis that were not found to be statistically significant and positive weights were not shown.
Figure 3—figure supplement 3
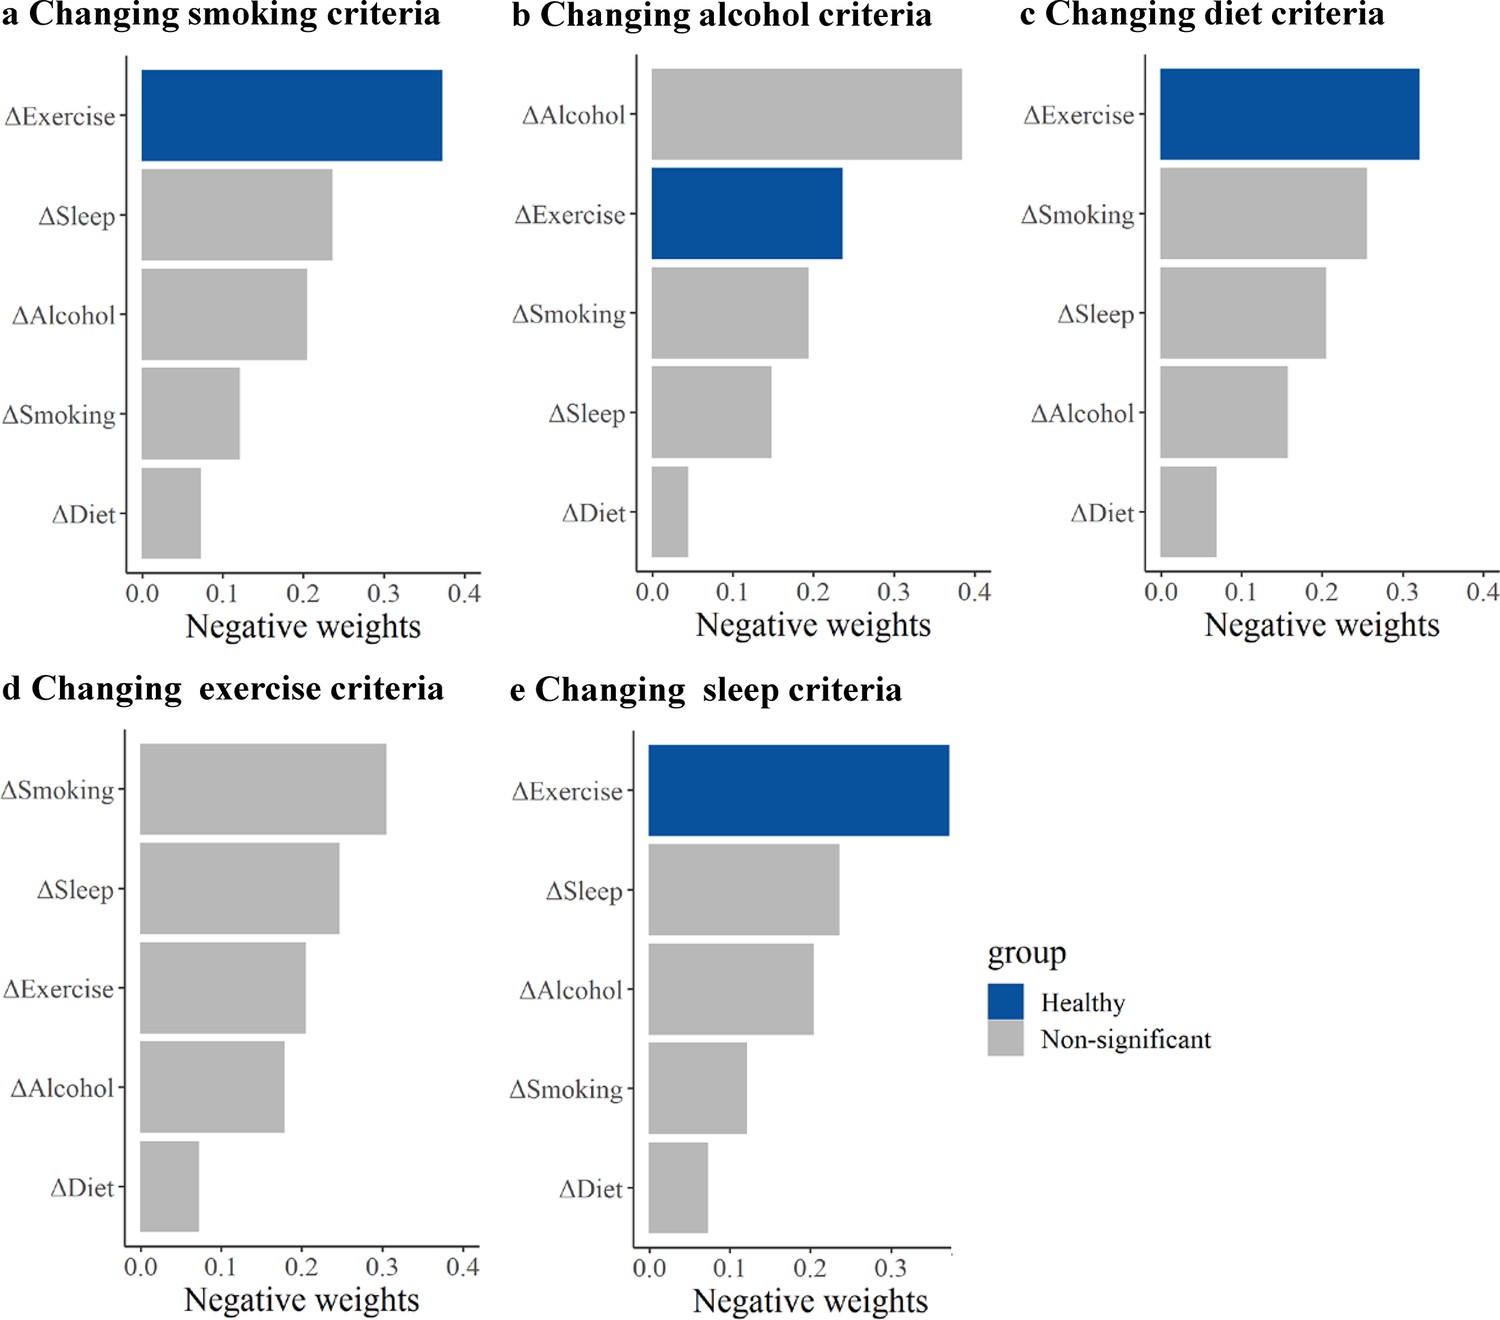
The relative contributions of five healthy lifestyle components to the cardiopulmonary biological age (BA) acceleration with altered healthy lifestyle criteria.
Panels: results of the cardiopulmonary BA acceleration when definitions of smoking, alcohol, diet, exercise, and sleep are changed separately (a–e). ΔSmoking, change in smoking status between the baseline and repeated survey; ΔAlcohol, change in alcohol consumption between the baseline and repeated survey; ΔDiet, change in dietary quality between the baseline and repeated survey; ΔExercise, change in exercise between the baseline and repeated survey; ΔSleep, change in sleep between the baseline and repeated survey. Estimates were obtained using quantile G-computation (QGC) treating the cardiopulmonary BA acceleration as the dependent variables and five individual lifestyle factors as the independent variables. All models were adjusted for age, occupation, marital status, total energy intake, depression symptoms, anxiety symptoms, menopausal status in women, beverage intake, dietary supplement intake, diabetes, cardiovascular disease, cancer, sex, ethnicity, urbanicity, education, and the participants' age at baseline. The blue bars represent results that are statistically significant in the fixed effects model (FEM) analysis, while the gray bars represent results in the FEM analysis that were not found to be statistically significant and positive weights were not shown.
Figure 3—figure supplement 4
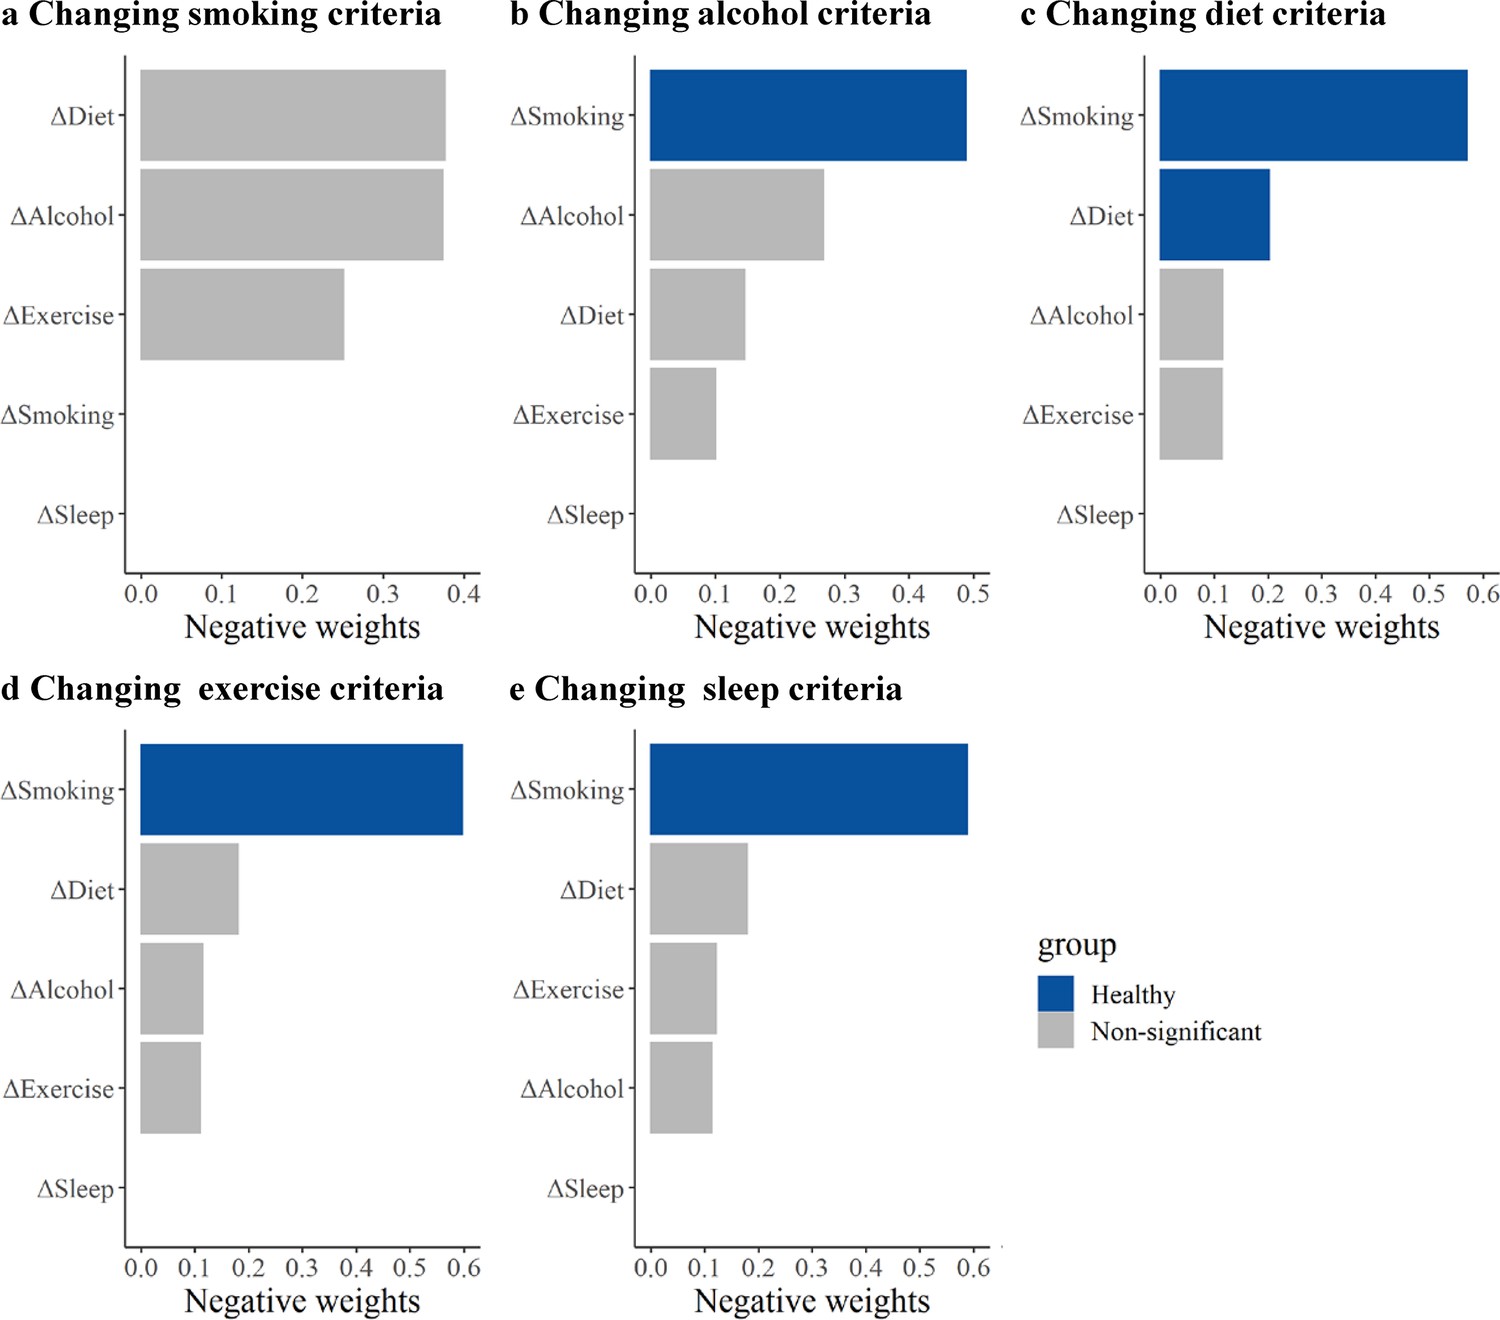
The relative contributions of five healthy lifestyle components to the metabolic biological age (BA) acceleration with altered healthy lifestyle criteria.
Panels: results of the metabolic BA acceleration when definitions of smoking, alcohol, diet, exercise, and sleep are changed separately (a–e). ΔSmoking, change in smoking status between the baseline and repeated survey; ΔAlcohol, change in alcohol consumption between the baseline and repeated survey; ΔDiet, change in dietary quality between the baseline and repeated survey; ΔExercise, change in exercise between the baseline and repeated survey; ΔSleep, change in sleep between the baseline and repeated survey. Estimates were obtained using quantile G-computation (QGC) treating the metabolic BA acceleration as the dependent variables and five individual lifestyle factors as the independent variables. All models were adjusted for age, occupation, marital status, total energy intake, depression symptoms, anxiety symptoms, menopausal status in women, beverage intake, dietary supplement intake, diabetes, cardiovascular disease, cancer, sex, ethnicity, urbanicity, education, and the participants' age at baseline. The blue bars represent results that are statistically significant in the fixed effects model (FEM) analysis, while the gray bars represent results in the FEM analysis that were not found to be statistically significant and positive weights were not shown.
Figure 3—figure supplement 5
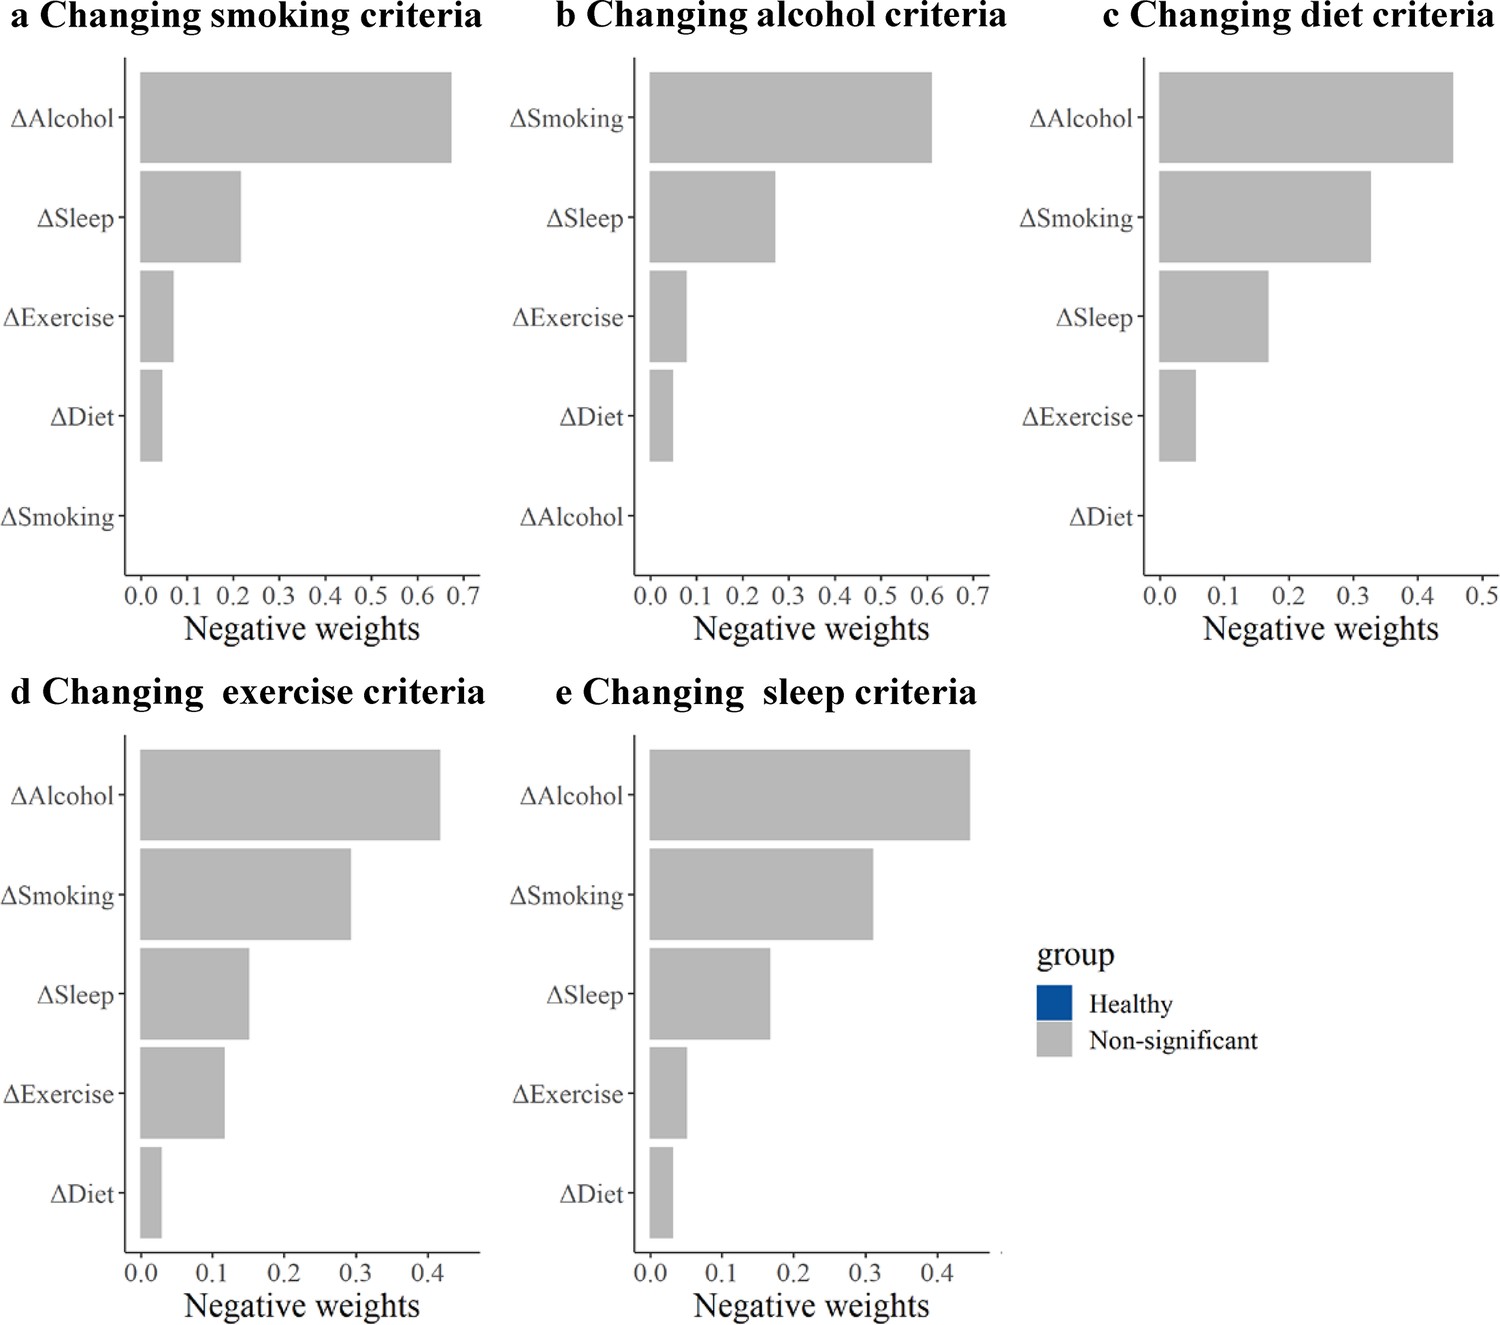
The relative contributions of five healthy lifestyle components to the liver biological age (BA) acceleration with altered healthy lifestyle criteria.
Panels: results of the liver BA acceleration when definitions of smoking, alcohol, diet, exercise, and sleep are changed separately (a–e). ΔSmoking, change in smoking status between the baseline and repeated survey; ΔAlcohol, change in alcohol consumption between the baseline and repeated survey; ΔDiet, change in dietary quality between the baseline and repeated survey; ΔExercise, change in exercise between the baseline and repeated survey; ΔSleep, change in sleep between the baseline and repeated survey. Estimates were obtained using quantile G-computation (QGC) treating the liver BA acceleration as the dependent variables and five individual lifestyle factors as the independent variables. All models were adjusted for age, occupation, marital status, total energy intake, depression symptoms, anxiety symptoms, menopausal status in women, beverage intake, dietary supplement intake, diabetes, cardiovascular disease, cancer, sex, ethnicity, urbanicity, education, and the participants' age at baseline. The blue bars represent results that are statistically significant in the fixed effects model (FEM) analysis, while the gray bars represent results in the FEM analysis that were not found to be statistically significant and positive weights were not shown.
Figure 3—figure supplement 6
Relative contributions of five healthy lifestyle components to the comprehensive and the metabolic biological age (BA) acceleration with additionally adjusted for body mass index (BMI).
Panels: results of the comprehensive BA acceleration, the cardiopulmonary BA acceleration, the metabolic BA acceleration, and the liver BA acceleration (a–d). ΔSmoking, change in smoking status between the baseline and repeated survey; ΔAlcohol, change in alcohol consumption between the baseline and repeated survey; ΔDiet, change in dietary quality between the baseline and repeated survey; ΔExercise, change in exercise between the baseline and repeated survey; ΔSleep, change in sleep between the baseline and repeated survey. Estimates were obtained using quantile G-computation (QGC) treating the BA accelerations as the dependent variables and five individual lifestyle factors as the independent variables. Models were adjusted for age, occupation, marital status, total energy intake, depression symptoms, anxiety symptoms, menopausal status in women, beverage intake, dietary supplement intake, diabetes, cardiovascular disease, cancer, sex, ethnicity, urbanicity, education, and the participants' age at baseline. The blue bars represent results that are statistically significant in the fixed effects model (FEM) analysis, while the gray bars represent results in the FEM analysis that were not found to be statistically significant and positive weights were not shown.
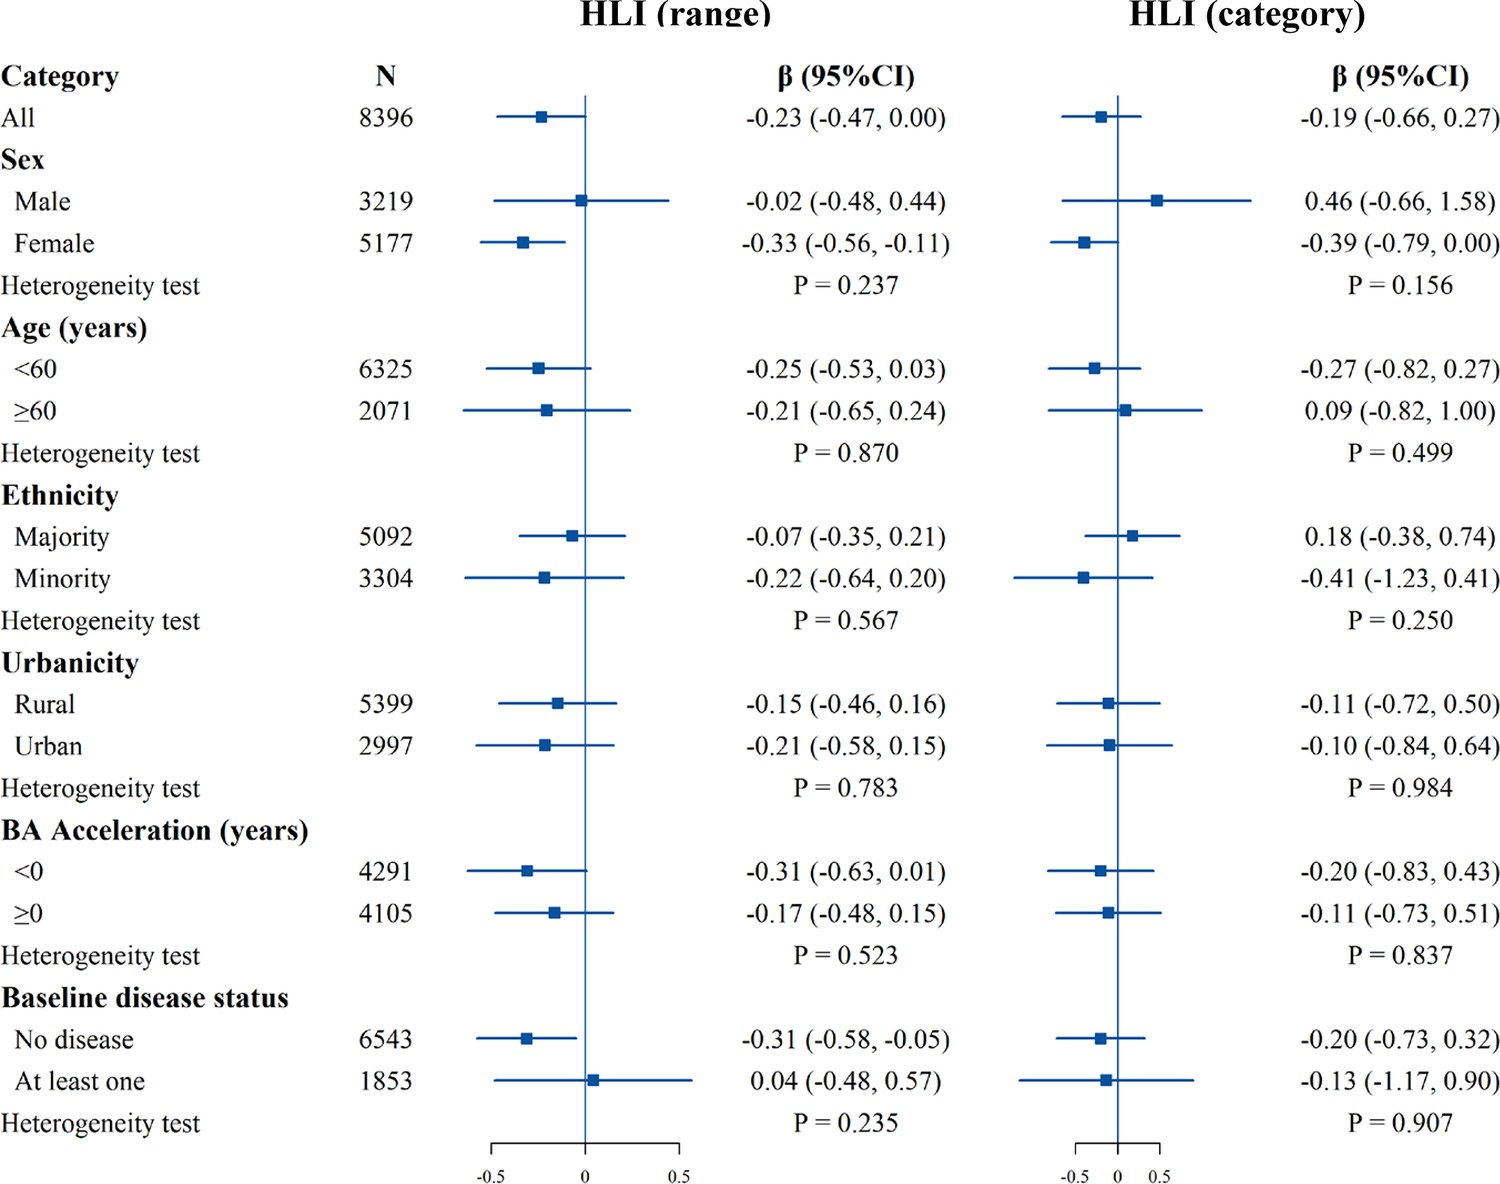
Figure 4 with 3 supplements
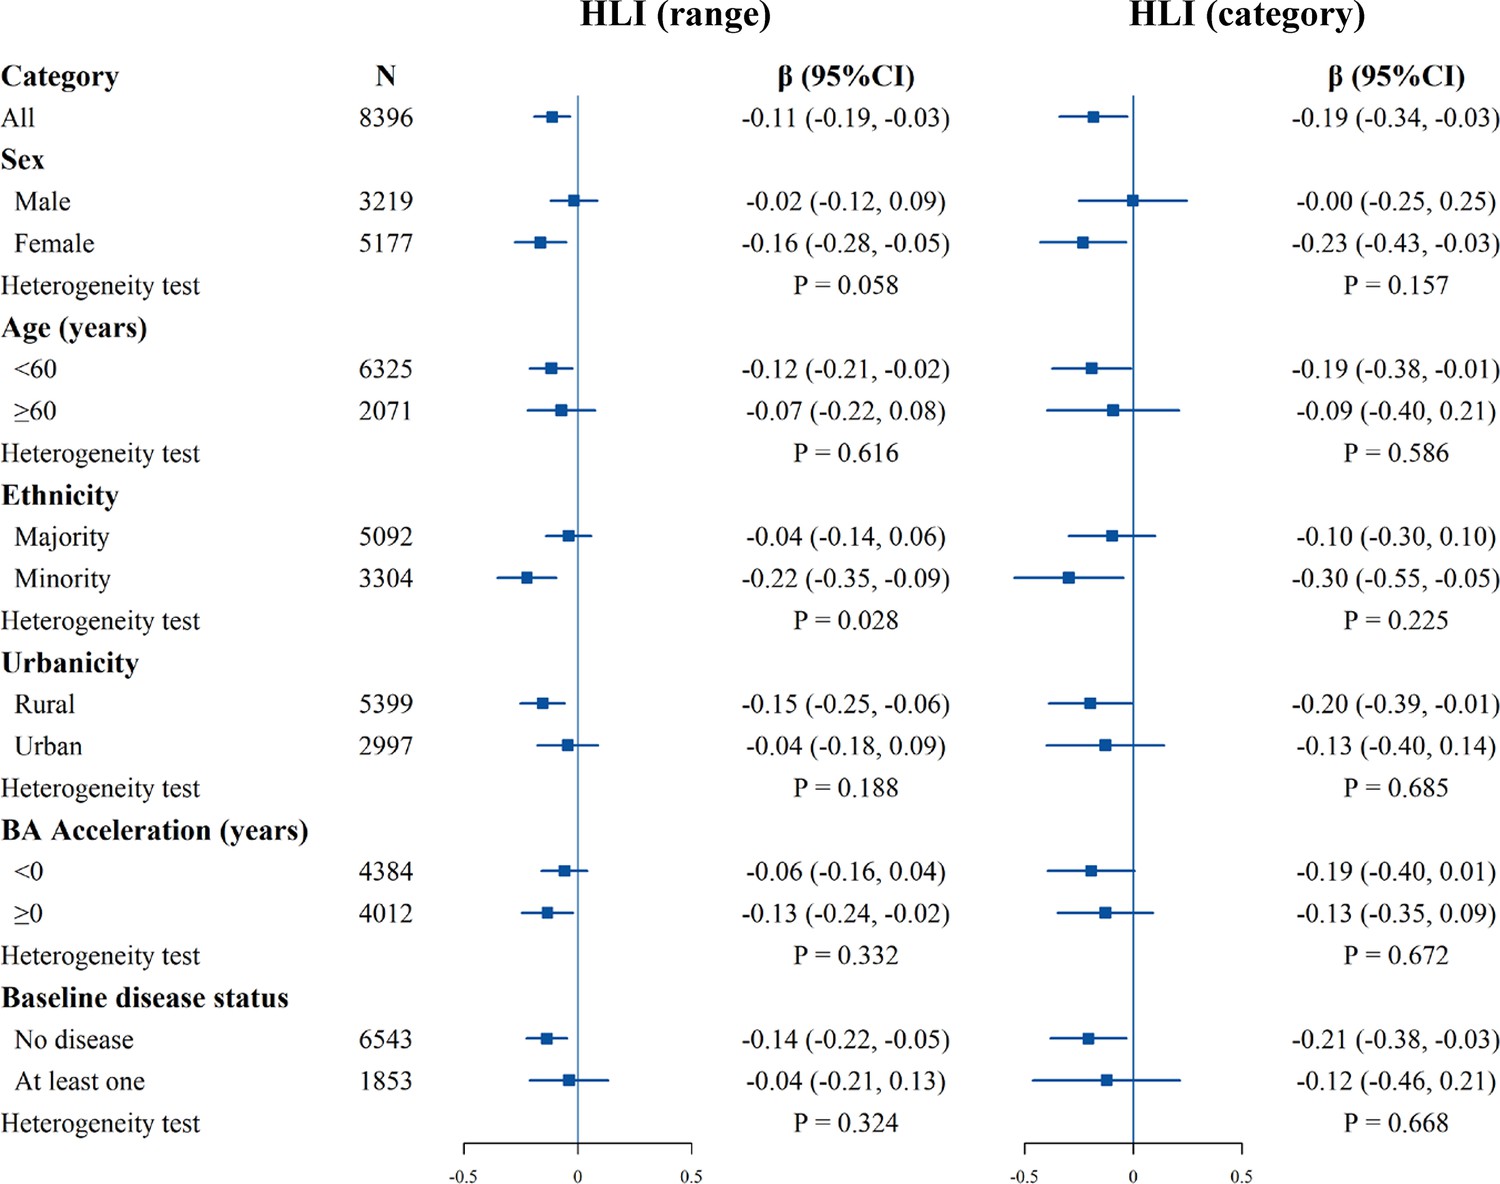
Stratified analysis of estimated associations between the healthy lifestyle index (HLI) and the comprehensive biological age (BA) acceleration.
All models were adjusted for age, occupation, marital status, total energy intake, depression symptoms, anxiety symptoms, menopausal status in women, beverage intake, dietary supplement intake, diabetes, cardiovascular disease, cancer, sex, ethnicity, urbanicity, education, and the participants' age at baseline, with exclusion of the stratified variable as appropriate. The boxes represent point estimations. Horizontal lines represent 95% CI.
Figure 4—figure supplement 1
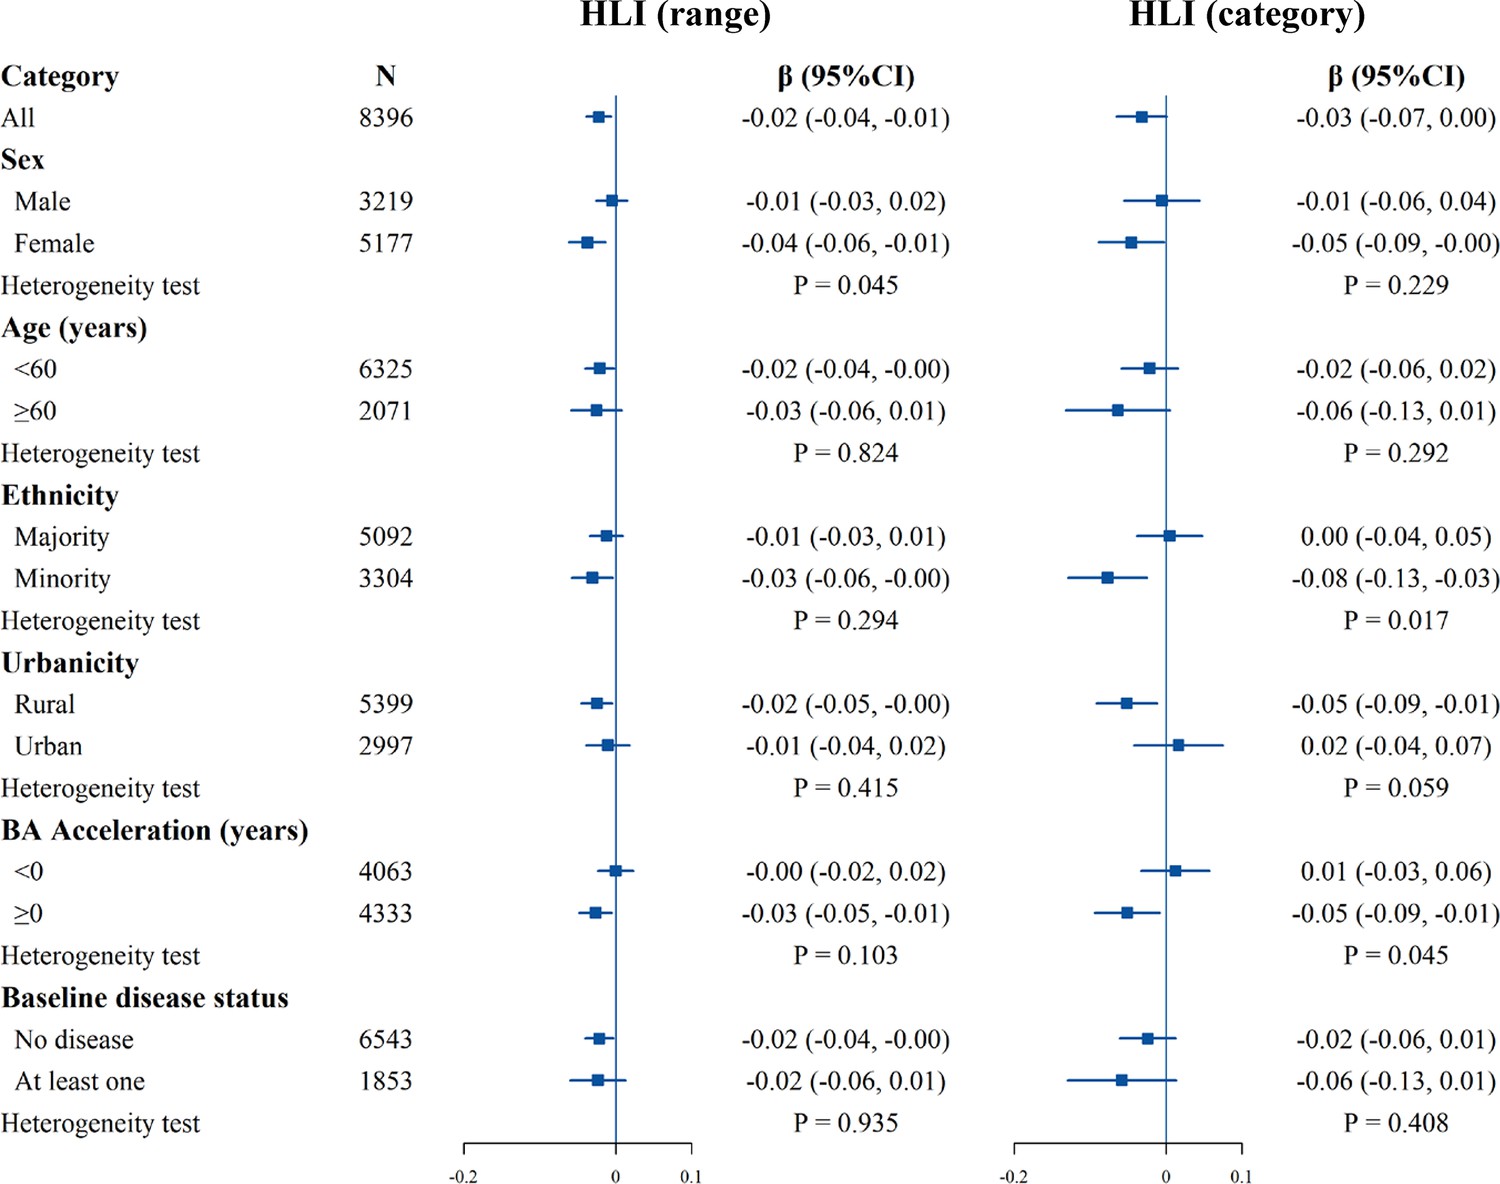
Stratified analysis of estimated associations between the healthy lifestyle index (HLI) and the cardiopulmonary biological age (BA) acceleration.
All models were adjusted for age, occupation, marital status, total energy intake, depression symptoms, anxiety symptoms, menopausal status in women, beverage intake, dietary supplement intake, diabetes, cardiovascular disease, cancer, sex, ethnicity, urbanicity, education, and the participants' age at baseline, with the exclusion of the stratified variable as appropriate. The boxes represent point estimations. Horizontal lines represent 95% CI.
Figure 4—figure supplement 2
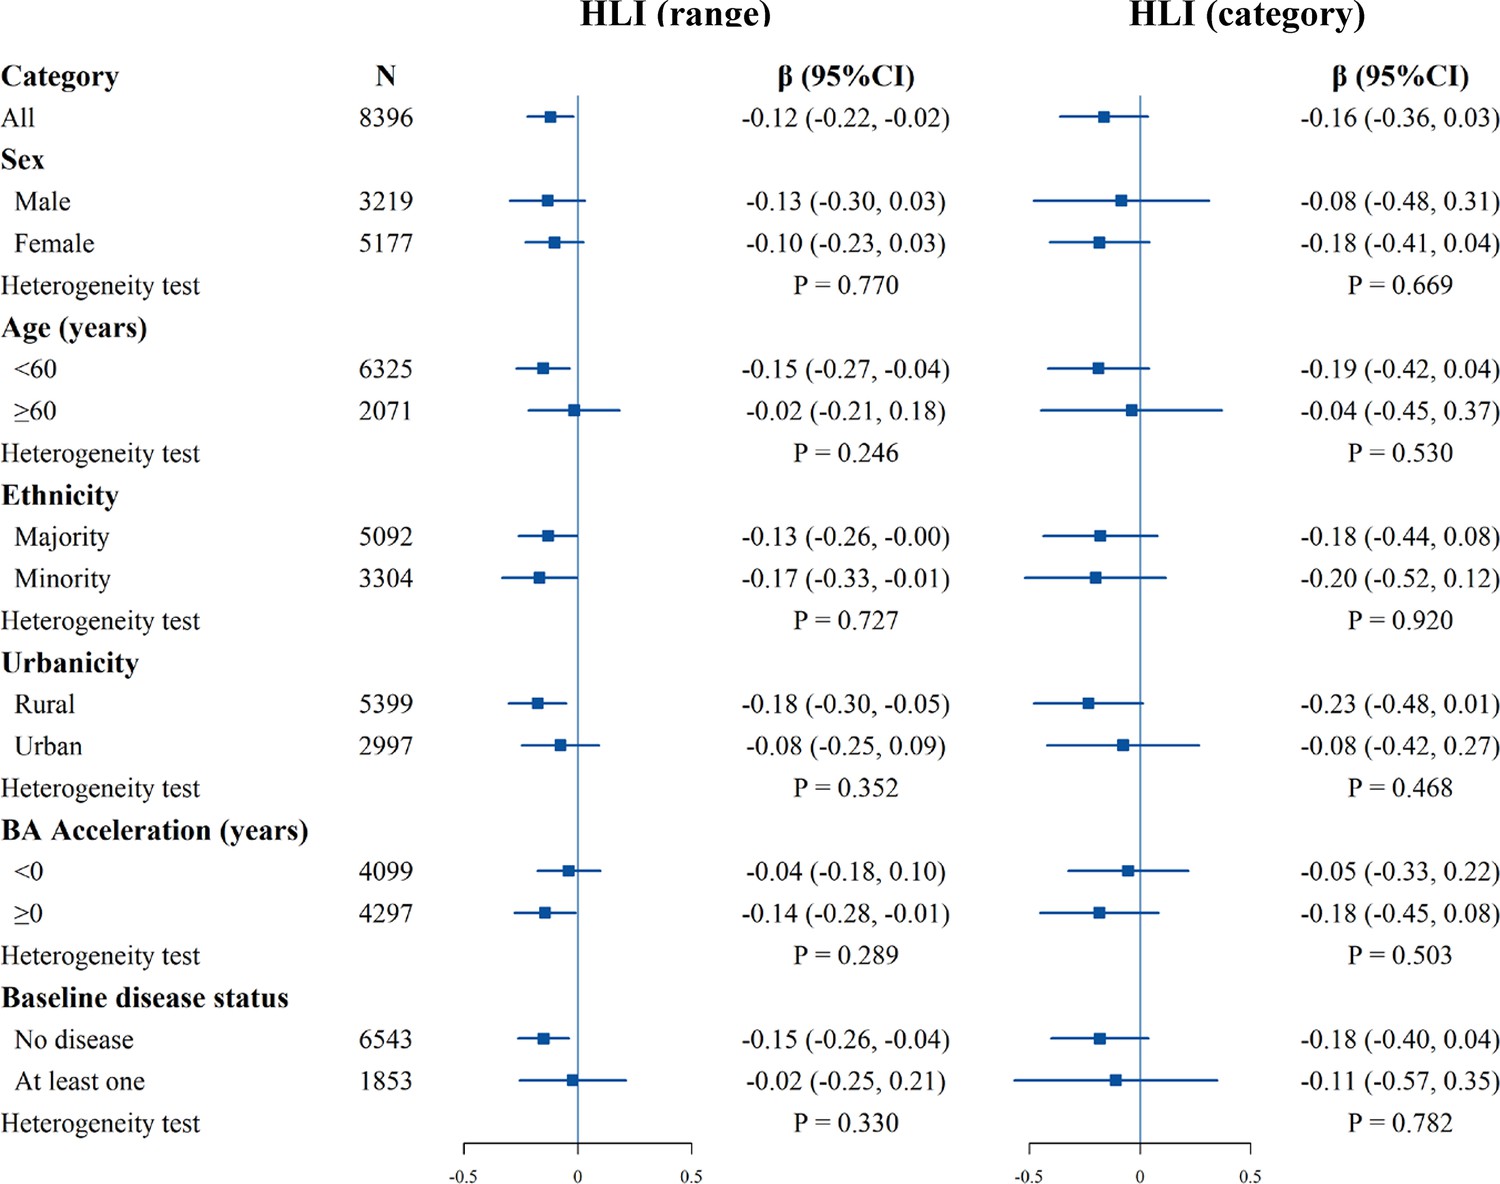
Stratified analysis of estimated associations between the healthy lifestyle index (HLI) and the metabolic biological age (BA) acceleration.
All models were adjusted for age, occupation, marital status, total energy intake, depression symptoms, anxiety symptoms, menopausal status in women, beverage intake, dietary supplement intake, diabetes, cardiovascular disease, cancer, sex, ethnicity, urbanicity, education, and the participants' age at baseline, with the exclusion of the stratified variable as appropriate. The boxes represent point estimations. Horizontal lines represent 95% CI.
Figure 4—figure supplement 3
Stratified analysis of estimated associations between the healthy lifestyle index (HLI) and the liver biological age (BA) acceleration.
All models were adjusted for age, occupation, marital status, total energy intake, depression symptoms, anxiety symptoms, menopausal status in women, beverage intake, dietary supplement intake, diabetes, cardiovascular disease, cancer, sex, ethnicity, urbanicity, education, and the participants' age at baseline, with the exclusion of the stratified variable as appropriate. The boxes represent point estimations. Horizontal lines represent 95% CI.
Tables
Table 1
Characteristics of participants in baseline and repeated surveys, based on the categorized HLI*.
| Characteristic | Baseline HLI (category) | Follow up HLI (category) | ||
|---|---|---|---|---|
| UnfavorableN=4935 | HealthyN=3461 | UnfavorableN=5121 | HealthyN=3275 | |
| Age (years) | 51.83 [44.97, 60.44] | 49.19 [42.51, 56.66] | 53.75 [47.01, 62.24] | 50.86 [44.21, 59.14] |
| Female (%) | 2511 (50.9) | 2666 (77.0) | 2685 (52.4) | 2492 (76.1) |
| Urbanicity (%) | 1472 (29.8) | 1525 (44.1) | 1527 (29.8) | 1470 (44.9) |
| Majority (%) | 2665 (54.0) | 2427 (70.1) | 2763 (54.0) | 2329 (71.1) |
| Education (%) | ||||
| No schooling | 1506 (30.5) | 653 (18.9) | 1554 (30.3) | 605 (18.5) |
| Primary school | 1305 (26.4) | 721 (20.8) | 1377 (26.9) | 649 (19.8) |
| Middle/high school | 1764 (35.7) | 1525 (44.1) | 1780 (34.8) | 1509 (46.1) |
| College/university | 360 (7.3) | 562 (16.2) | 410 (8.0) | 512 (15.6) |
| Occupation (%) | ||||
| Primary industry practitioner | 1993 (40.4) | 820 (23.7) | 2093 (40.9) | 826 (25.2) |
| Secondary industry practitioner | 335 (6.8) | 197 (5.7) | 396 (7.7) | 174 (5.3) |
| Tertiary industry practitioner | 1699 (34.4) | 1671 (48.3) | 1736 (33.9) | 1462 (44.6) |
| Unemployed | 908 (18.4) | 773 (22.3) | 896 (17.5) | 813 (24.8) |
| Married (%) | 4396 (89.1) | 3111 (89.9) | 4595 (89.7) | 2966 (90.6) |
| Total energy intake (kcal/day) | 1796.35 [1394.49, 2293.37] | 1759.71 [1404.92, 2156.58] | 1510.72 [1129.17, 1994.64] | 1482.29 [1183.94, 1879.82] |
| BMI (kg/m2) | 24.29 [21.94, 26.79] | 24.12 [22.04, 26.47] | 24.61 [22.23, 27.05] | 24.34 [22.31, 26.73] |
| Depression symptom (%) | 289 (5.9) | 117 (3.4) | 203 (4.0) | 86 (2.6) |
| Anxiety symptom (%) | 335 (6.8) | 146 (4.2) | 212 (4.1) | 71 (2.2) |
| Menopausal status in women (%) | ||||
| Premenopausal | 1042 (41.5) | 1336 (50.1) | 914 (34.0) | 1099 (44.1) |
| Perimenopausal | 170 (6.8) | 189 (7.1) | 133 (5.0) | 109 (4.4) |
| Postmenopausal | 1299 (51.7) | 1141 (42.8) | 1638 (61.0) | 1284 (51.5) |
| Beverage (%) | ||||
| Never | 4564 (92.5) | 3292 (95.1) | 4746 (92.7) | 3079 (94.0) |
| Former consumer | 23 (0.5) | 16 (0.5) | 27 (0.5) | 14 (0.4) |
| Currently consuming | 348 (7.1) | 153 (4.4) | 348 (6.8) | 182 (5.6) |
| Dietary supplement intake (%) | 711 (14.4) | 722 (20.9) | 724 (14.1) | 712 (21.7) |
| Major diseases | ||||
| Diabetes (%) | 245 (5.0) | 161 (4.7) | 275 (5.4) | 159 (4.9) |
| CVD (%) | 974 (19.7) | 628 (18.1) | 1054 (20.6) | 602 (18.4) |
| Cancer (%) | 36 (0.7) | 31 (0.9) | 39 (0.8) | 32 (1.0) |
| Biological ages† | ||||
| Comprehensive BA | 52.35 [43.90, 61.07] | 49.15 [40.19, 58.61] | 54.78 [46.48, 63.45] | 51.67 [42.74, 61.31] |
| Comprehensive BA acceleration | 0.00 [–2.89, 3.00] | –0.70 [–3.79, 2.73] | 0.40 [–2.66, 3.48] | –0.13 [–3.21, 3.25] |
| Cardiopulmonary BA | 51.86 [45.05, 60.40] | 49.10 [42.48, 56.89] | 53.79 [47.07, 62.14] | 50.82 [43.97, 59.18] |
| Cardiopulmonary BA acceleration | 0.08 [–0.47, 0.59] | –0.03 [–0.65, 0.55] | 0.04 [–0.56, 0.62] | –0.08 [–0.71, 0.56] |
| Metabolic BA | 52.87 [43.86, 61.78] | 49.42 [40.53, 59.01] | 55.14 [46.10, 64.29] | 52.29 [42.89, 61.77] |
| Metabolic BA acceleration | 0.55 [–3.86, 4.85] | –0.37 [–4.41, 3.86] | 0.46 [–3.87, 4.94] | 0.32 [–3.93, 4.46] |
| Liver BA | 52.42 [41.08, 63.96] | 49.40 [37.83, 60.43] | 57.61 [46.15, 68.52] | 54.13 [42.31, 64.32] |
| Liver BA acceleration | 0.15 [–8.16, 8.46] | –0.88 [–8.50, 6.73] | 2.88 [–5.31, 11.58] | 1.11 [–6.02, 9.08] |
-
BA, biological age; BMI, body mass index; CVD, cardiovascular disease; HLI, healthy lifestyle indicator.
-
*
Data are presented as median (25th, 75th percentile) for continuous variables and count (percentage) for categorical variables. For HLI (category), ‘healthy’ corresponds to a score of 4–5, while ‘unfavorable’ corresponds to a score of 0–3.
-
†
Information on each validated BA has been reported. BA acceleration is the difference between each BA and CA in the same survey.
Table 2
Associations of healthy lifestyle factors and HLI with the BA acceleration of validated BAs.
| Variables | ComprehensiveBA accelerationβ (95% CI) | CardiopulmonaryBA accelerationβ (95% CI) | MetabolicBA accelerationβ (95% CI) | LiverBA accelerationβ (95% CI) |
|---|---|---|---|---|
| HLI (range) | ||||
| Per 1-point increase | –0.11 (–0.19, –0.03) | –0.02 (–0.04, –0.01) | –0.12 (–0.22, –0.02) | –0.23 (–0.47, 0.00) |
| HLI (category) | ||||
| To have a healthy lifestyle | –0.19 (–0.34, –0.03) | –0.03 (–0.07, 0.00) | –0.16 (–0.36, 0.03) | –0.19 (–0.66, 0.27) |
| Healthy lifestyle factors | ||||
| ΔSmoking | –0.13 (–0.47, 0.21) | –0.03 (–0.10, 0.04) | –0.54 (–0.97, –0.11) | –0.57 (–1.58, 0.44) |
| ΔAlcohol | –0.17 (-0.47, 0.13) | –0.02 (–0.09, 0.04) | –0.18 (–0.56, 0.21) | –0.59 (–1.50, 0.31) |
| ΔDiet | –0.15 (–0.29, –0.00) | –0.01 (–0.04, 0.02) | –0.18 (–0.36, 0.00) | –0.10 (–0.53, 0.33) |
| ΔExercise | –0.16 (–0.32, 0.00) | –0.03 (–0.07, 0.00) | –0.09 (–0.30, 0.11) | –0.05 (–0.53, 0.44) |
| ΔSleep | –0.02 (–0.16, 0.12) | –0.02 (–0.05, 0.01) | 0.01 (–0.17, 0.19) | –0.36 (–0.78, 0.06) |
-
Estimates were obtained using FEMs treating the BA accelerations as the dependent variables and HLI (as either continuous or as categorized) or five individual lifestyle factors as the independent variables. Models were adjusted for age, occupation, marital status, total energy intake, depression symptoms, anxiety symptoms, menopausal status in women, beverage intake, dietary supplement intake, diabetes, cardiovascular disease, cancer, sex, ethnicity, urbanicity, education, and the participants' age at baseline.
-
BA, biological age; HLI, healthy lifestyle indicator. ΔSmoking, change in smoking status between the baseline and repeated survey; ΔAlcohol, change in alcohol consumption between the baseline and repeated survey; ΔDiet, change in dietary quality between the baseline and repeated survey; ΔExercise, change in exercise between the baseline and repeated survey; ΔSleep, change in sleep between the baseline and repeated survey.
Author response table 1
Baseline characteristics of participants included and not included in the study.
| Characteristic | Overall N=99,556 | Population included N=8396 | Population not included N=91.160 |
|---|---|---|---|
| Age (years) | 50.48 [43.12, 60.27] | 50.64 [43.91, 59.26] | 50.46 [43.04, 60.38] |
| Female (%) | 59762 (60.0) | 5177 (61.7) | 54585 (59.9) |
| Urbanicity (%) | 33578 (34.1) | 2997 (35.7) | 30581 (33.9) |
| Majority (%) | 55420 (56.2) | 5092 (60.6) | 50328 (55.8) |
| Education(%) | |||
| No schooling | 27028 (27.4) | 2159 (25.7) | 24869 (27.6) |
| Primary school | 25136 (25.5) | 2026 (24.1) | 23110 (25.6) |
| Middle/high school | 35850 (36.4) | 3289 (39.2) | 32561 (36.1) |
| College'university | 10536 (10.7) | 922 (11.0) | 9614 (10.7) |
| Occupation(%) | |||
| Primary industry practitioner | 33842 (34.4) | 2813 (33.5) | 31029 (34.4) |
| Secondary industry practitioner | 7002 (7.1) | 532 (6.3) | 6470 (7.2) |
| Tertiary industry practitioner | 36792 (37.4) | 3370 (40.1) | 33422 (37.1) |
| Unemployed | 20838 (21.2) | 1681 (20.0) | 19157 (21.3) |
| Married (%) | 87420 (88.7) | 7507 (89.4) | 79913 (88.6) |
| Total energy intake (kcal/day) | 1737.19[1354.75 2201.42] | 1778.33 [1400.29, 2234.39] | 1733.40[1350.15 2198.22] |
| BMI (kg/m2) | 24.06 [21.78, 26.32] | 24.22 [21.97, 26.67] | 24.04 [21.76, 26.31] |
| Depression symptom (%) | 4990 (5.1) | 406 (4.8) | 4584 (5.1) |
| Anxiety symptom (%) | 5833 (5.9) | 481 (5.7) | 5352 (6.0) |
| Menopausal status in women (%) | |||
| Premenopausal | 26630 (45.0) | 2378 (45.9) | 24252 (44.9) |
| Perimenopausal | 3994 (6.8) | 359 (6.9) | 3635 (6.7) |
| Postmenopausal | 28544 (48.2) | 2440 (47.1) | 26104 (48.3) |
| Beverage (%) | |||
| Never | 90684 (92.1) | 7856 (93.6) | 82828 (91.9) |
| Former consumer | 429 (0.4) | 39 (0.5) | 390 (0.4) |
| Currently consuming | 7400 (7.5) | 501 (6.0) | 6899 (7.7) |
| Dietary supplement intake (%) | 15679 (16.0) | 1433 (17.1) | 14246 (15.8) |
| HLI (healthy) (%)* | 37104 (37.9) | 3461 (41.2) | 33643 (37.5) |
| Major diseases | |||
| Diabetes (%) | 4587 (4.7) | 406 (4.8) | 4181 (4.6) |
| CVD (%) | 18226 (18.5) | 1602 (19.1) | 16624 (18.4) |
| Cancer (%) | 782 (0.8) | 67 (0.8) | 715 (0.8) |
| Biological ages† | |||
| Comprehensive BA | 51.24 [42.20, 60.97] | 51.08 [42.28, 60.03] | 51.26 [42.19, 61.09] |
| Comprehensive BA acceleration | -0.15 [-3.15, 3.03] | -0.23[-3.28,2.88] | -0.14 [-3.14, 3.05] |
| Cardiopulmonary BA | 50.76 [43.46, 60.34] | 50.66 [43.87, 59.10] | 50.77 [43.41, 60.45] |
| Cardiopulmonary BA acceleration | 0.02 [-0.57, 0.57] | 0.03 [-0.54, 0.58] | 0.02 [-0.57, 0.57] |
| Metabolic BA | 51.41 [41.91, 61.32] | 51.57 [42.37, 60.89] | 51.39 [41.86, 61.37] |
| Metabolic BA acceleration | -0.11 [-4.31, 4.14] | 0.22 [-4.08, 4.44] | -0.14 [-4.33, 4.11] |
| Liver BA | 51.88 [39.54, 63.59] | 51.30 [39.49, 62.68] | 51.94 [39.55, 63.69] |
| Liver BA acceleration | -0.12[-8.05, 7.94] | -0.37[-8.36, 7.73] | -0.10 [-8.03, 7.96] |
-
BA, biological age; BMI, body mass index; CVD, cardiovascular disease; HLI, healthy lifestyle indicator.
-
Data are presented as median (25th, 75th percentile) for continuous variables and count (percentage) for categorical variables.
-
*
For HLI, "healthy" corresponds to a score of 4-5.
-
†
Information on each validated BA has been reported. BA acceleration is the difference between each BA and CA in the same survey.
Author response table 2
Description of BA and BA acceleration.
| BA | Comprehensive BA | Cardiopulmonary BA | Metabolic BA | Liver BA | Renal BA | Immune BA |
|---|---|---|---|---|---|---|
| KDM-BA | ||||||
| Baseline | 51.66 (12.45) | 51.66 (11.50) | 51.66 (13.31) | 51.66 (17.35) | 51.66 (15.24) | 51.66 (14.00) |
| Follow-up | 53.85 (12.04) | 53.43 (10.84) | 53.94 (13.01) | 56.58 (17.59) | 53.59 (14.67) | 54.24 (13.51) |
| Change | 2.49 (4.09) | 2.00 (0.94) | 2.32 (5.26) | 5.09 (12.57) | 2.31 (9.11) | 2.68 (5.07) |
| KDM-BA acceleration | ||||||
| Baseline | 0.00 (4.83) | 0.00 (0.91) | –0.00 (6.76) | –0.00 (13.02) | 0.00 (10.03) | 0.00 (8.04) |
| Follow-up | 0.39 (4.89) | –0.04 (0.94) | 0.48 (6.78) | 3.11 (13.98) | 0.13 (9.85) | 0.77 (7.95) |
| Change | 0.44 (4.09) | –0.05 (0.86) | 0.27 (5.25) | 3.05 (12.55) | 0.26 (9.14) | 0.63 (5.06) |
-
BA, biological age
-
Data are presented as mean (standard deviation).
Additional files
-
Supplementary file 1
Supplementary methods, descriptive analysis of biological age, and results of sensitivity analysis.
(a) Detailed definitions of lifestyle factors in the main analysis and sensitivity analysis. (b) Candidate indicators used to construct the comprehensive and multi-organ systems of biological age. (c) Description of BA and BA acceleration. (d) Associations of the comprehensive and multi-organ systems BA acceleration with organ-specific diseases. (e) Associations of healthy lifestyle factors and HLI with the BA accelerations with adjustment for time-varying covariates. (f) Associations of healthy lifestyle factors and HLI with the BA accelerations altered healthy lifestyle criteria. (g) Associations of healthy lifestyle factors and HLI with the BA accelerations with additionally adjusted for BMI.
- https://cdn.elifesciences.org/articles/99924/elife-99924-supp1-v1.docx
-
MDAR checklist
- https://cdn.elifesciences.org/articles/99924/elife-99924-mdarchecklist1-v1.docx
Download links
A two-part list of links to download the article, or parts of the article, in various formats.
Downloads (link to download the article as PDF)
Open citations (links to open the citations from this article in various online reference manager services)
Cite this article (links to download the citations from this article in formats compatible with various reference manager tools)
Lifestyles and their relative contribution to biological aging across multiple-organ systems: Change analysis from the China Multi-Ethnic Cohort study
eLife 13:RP99924.
https://doi.org/10.7554/eLife.99924.3


