Redistribution of fragmented mitochondria ensures symmetric organelle partitioning and faithful chromosome segregation in mitotic mouse zygotes
- Department of Animal Science, Graduate School of Environment and Life Science, Okayama University, Japan
- Reproductive Centre, Mio Fertility Clinic, Japan
- Development and Stem Cell Program and Department of Anatomy and Developmental Biology, Monash Biomedicine Discovery Institute, Monash University, Australia
- Department of Bioscience, Tokyo University of Agriculture, Japan
Figures
Figure 1 with 4 supplements
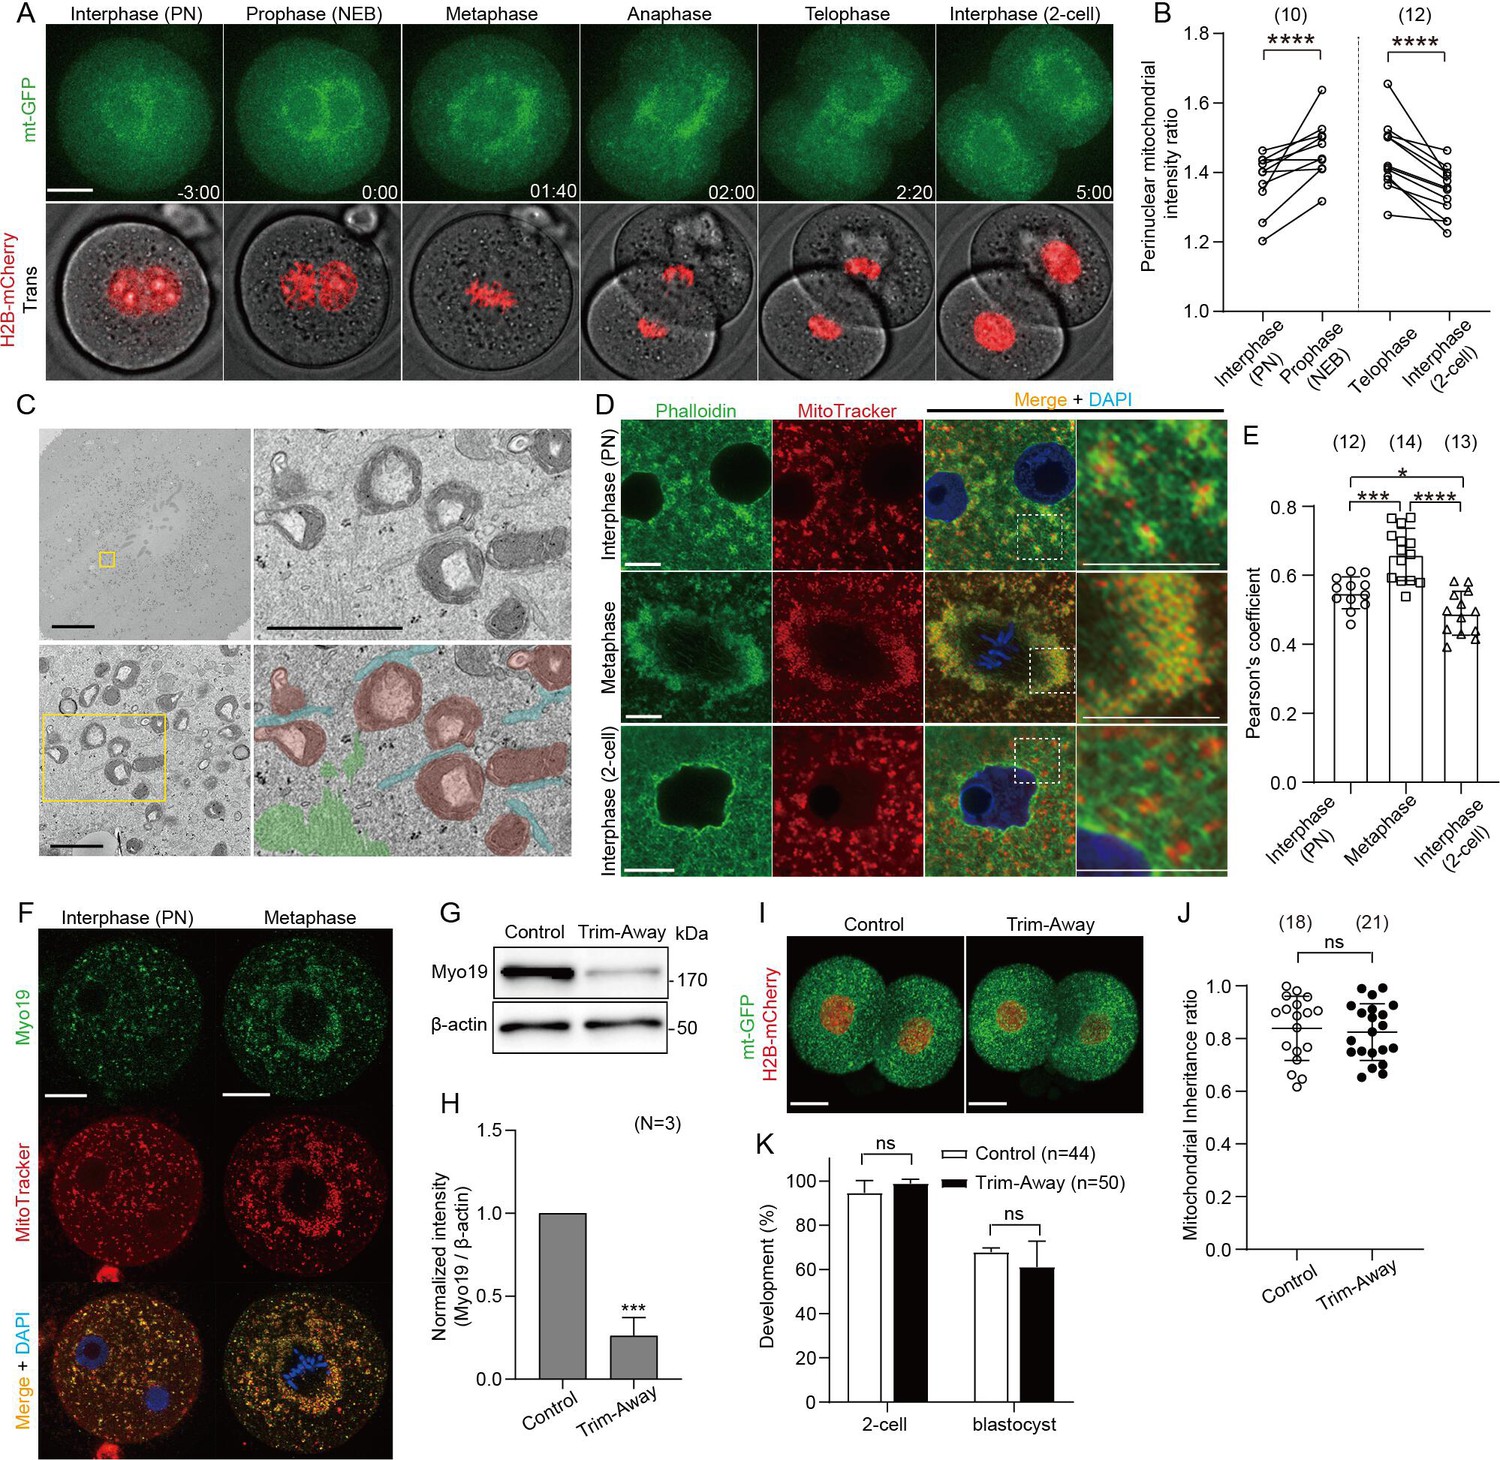
Redistribution and symmetric partitioning of mitochondria during embryonic cleavage.
(A) Representative time-lapse images (maximum-intensity Z projection) of mitochondria and chromosomes in zygotes expressing mitochondrially-targeted (mt-GFP) and histone H2B-mCherry during the first cleavage division. Time is relative to the onset of NEBD. Scale bar, 20 μm. (B) Quantification of mitochondrial accumulation around the nucleus at different cell cycle phases by calculating the ratio of the mitochondrial fluorescence intensity at the nuclear periphery to that of outside the nuclear periphery. (C) Representative electron microscopy (EM) images (n=5) showing the accumulation of mitochondria around the mitotic spindle. Higher-magnification images (31 sections) of the representative boxed areas in the lower left and upper right, respectively. Mitochondria (purple), endoplasmic reticulum (aqua), and actin filaments (yellow-green) are pseudo-colored in the lower right panel. Scale bar left: 10 μm; Lower left and upper right: 1 μm. (D) Interphase or metaphase zygotes and interphase 2 cell embryos were stained with Phalloidin-iFluor 488, MitoTracker Red CMXros, and Hoechst 33342. Magnified images in the box areas are shown in the right panels. Scale bar, 10 μm. An overall view of each embryo is shown in Figure 1—figure supplement 1D. (E) Quantification of the correlation between the localization of the F-actin (Phalloidin-iFluor 488) and mitochondria (MitoTracker Red CMXros). (F) Representative immunofluorescence images of Myo19. Interphase (n=13) and metaphase (n=11) zygotes were stained with MitoTracker Red CMXRos. After fixation and immunostaining with anti-Myo19 antibody and Hoechst 33342, single-section images crossing the mid-zone of the zygotes were imaged by confocal microscopy. Scale bar, 20 μm. (G) Western blot analysis of zygotes overexpressing Trim21 and microinjected with control IgG or anti-Myo19 antibodies. Lysates of 100 zygotes were extracted 5 h after microinjection and were probed with antibodies specific to Myo19 and β-actin. (H) Quantification of the relative Myo19 expression levels in (G) across three experimental replications following Myo19 depletion. (J) Quantitation of mitochondrial mass inheritance after the first cleavage division of control and Myo19-depleted zygotes. Total mitochondrial fluorescence in each daughter blastomere of 2 cell embryos was measured, and the smaller value was divided by the greater value for the inheritance ratio. (K) Developmental competence of control and Myo19-depleted embryos. Percentage of zygotes reaching the indicated developmental stage. (I) Maximum-intensity Z projection of control and Myo19 Trim-Away embryos expressing mt-GFP and H2B-mCherry. Scale bar, 20 μm. Data are represented as mean ± SD and p-values calculated using two-tailed paired (B) or unpaired (E, H, K, and J) Student’s t test. *p<0.05, ***p<0.001, ****p<0.0001; ns, not significant. Number of zygotes/embryos is indicated in brackets.
-
Figure 1—source data 1
Original files of the full raw uncropped blots displayed in Figure 1G.
- https://cdn.elifesciences.org/articles/99936/elife-99936-fig1-data1-v1.zip
-
Figure 1—source data 2
Figures with the uncropped blots with the relevant bands and treatments for Figure 1G.
- https://cdn.elifesciences.org/articles/99936/elife-99936-fig1-data2-v1.zip
Figure 1—figure supplement 1
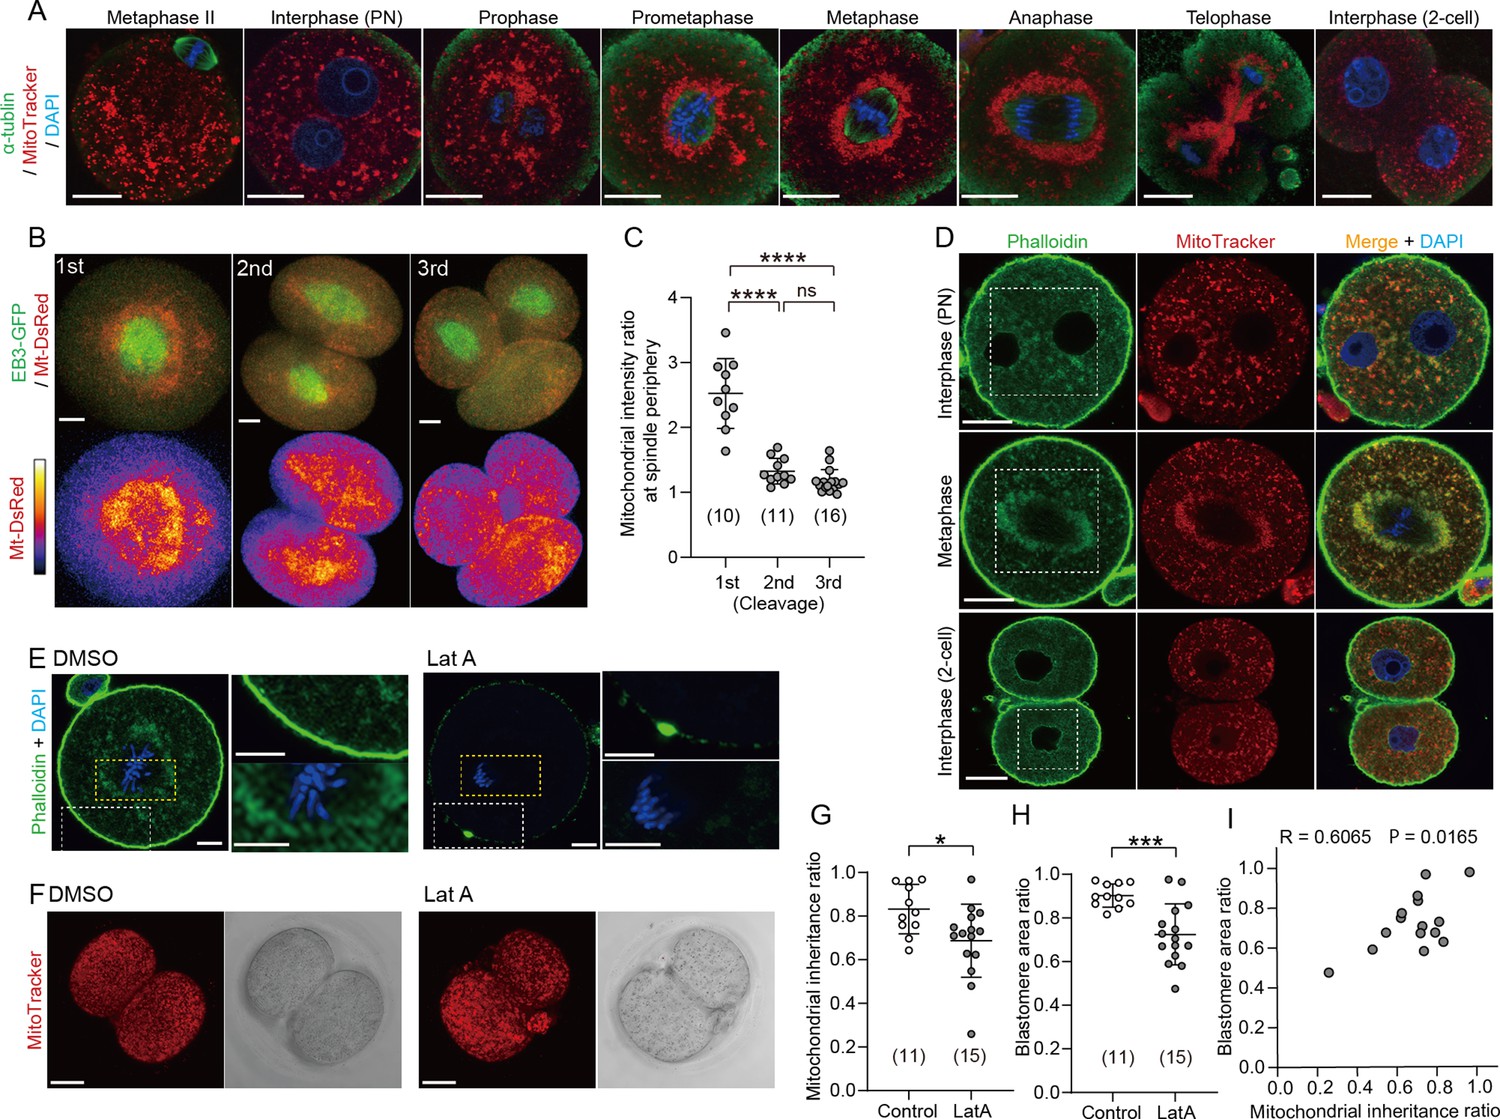
Redistribution of mitochondria during the first embryonic cleavage.
(A) Representative immunofluorescence images of microtubules (green), mitochondria (red), and DNA (blue) during the first cleavage division. Metaphase II eggs were collected 14 hr after hCG. Zygotes were isolated 24 hr after hCG and cultured to different mitotic stages (n=10–35). Interphase zygotes at the PN stage and 2 cell stage embryos were fixed 25 and 35 hr after hCG, respectively. Mitotic zygotes were fixed at 0.5 (prophase and prometaphase), 1 (metaphase), and 2 hr (anaphase and telophase) after the disappearance of the nuclear envelope was observed. Prior to fixation, zygotes were stained with MitoTracker Red CMXRos for 0.5 hr. After fixation and immunostaining with anti-α-tubulin and DAPI, single-section images crossing the mid-zone of the zygotes were imaged by confocal microscopy. Scale bar, 20 μm. (B) Representative images (maximum-intensity Z projection) of mitochondria (mt-DsRed) and microtubules (EB3-GFP) in metaphase blastomeres during the first to third cleavage division. Scale bar, 20 μm. (C) Quantification of mitochondrial accumulation around the spindle by calculating the ratio of the mitochondrial fluorescence intensity at the spindle periphery to that of outside spindle periphery. (D) Interphase or metaphase zygotes and interphase 2 cell embryos were stained with Phalloidin-iFluor 488, MitoTracker Red CMXros and Hoechst 33342. Magnified images in the box areas are shown in Figure 1D. (E) Confocal images of zygotes treated with DMSO (control) or Latrunculin A (LatA) for 1 hr just after nuclear envelope breakdown (NEB), fixed and stained for F-actin (Phalloidin-iFluor 488) and DNA (Hoechst 33342). Magnified views of the cytoplasmic and cortical regions are shown in the upper right and lower right, respectively. Scale bar, 10 μm. (F) Zygotes were treated as in (E), then washed out, cultured to develop into 2 cell embryos, and stained with MitoTracker Red CMXros. Maximum-intensity Z projection of the entire cell for mitochondria was imaged by confocal microscopy. (G, H) Quantitation of mitochondrial mass inheritance (G) and blastomere size (H) in control and LatA-treated 2 cell embryos. Total mitochondrial fluorescence and the area in each daughter blastomere of two-cell embryos was measured, and the ratio was calculated by dividing the smaller value by the larger value. (I) Correlation between mitochondrial inheritance ratio and blastomere size ratio. Data are represented as mean ± SD and p-values calculated using two-tailed Student’s t-test. *p<0.05, ***p<0.001, ****p<0.0001; ns, not significant. Number of embryos are indicated in brackets.
Figure 1—figure supplement 2
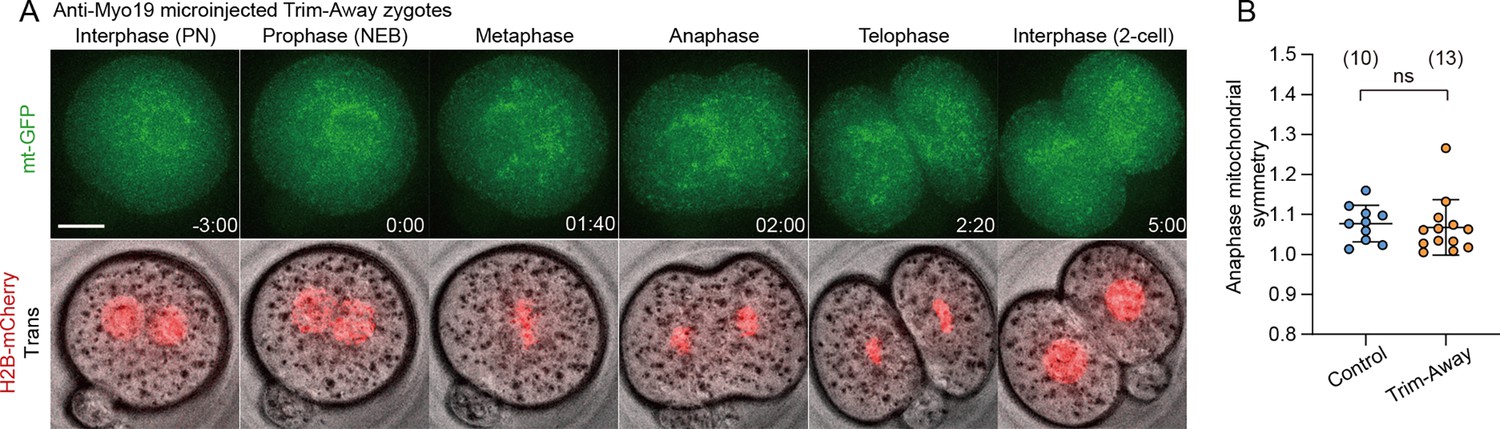
Redistribution of mitochondria during the first cleavage in Myo19-depleted zygotes.
(A) Representative time-lapse images (maximum-intensity Z projection) of mitochondria and chromosomes in anti-Myo19 microinjected Trim-Away zygotes expressing mt-GFP and H2B-mCherry. Time is relative to the onset of NEBD. Dashed lines indicate cleavage plane. Scale bar, 20 μm. (B) Quantitation of mitochondrial asymmetry at anaphase in control and Myo19-depleted zygotes. Total mitochondrial fluorescence in each dividing blastomere was measured, and the greater value was divided by the smaller value for the symmetry index. Data are represented as mean ± SD and P value calculated using two-tailed Student’s t test. ns, not significant. Number of zygotes are indicated in brackets.
Figure 1—video 1
Symmetric mitochondrial partitioning during the first cleavage, related to Figure 1.
Representative time-lapse movies of mitochondria (mt-GFP) and chromosomes (H2B-mCherry) in zygotes. Time is relative to the onset of nuclear envelope breakdown (NEB) (hours_minutes). Z-projection of eight sections, 5 μm apart; time interval: 20 min.
Figure 1—video 2
Mitochondrial dynamics during the first embryonic cleavage in Myo19-depleted zygotes, related to Figure 1—figure supplement 2.
Representative time-lapse movies of mitochondria (mt-GFP) and chromosomes (H2B-mCherry) in zygotes. Time is relative to the onset of nuclear envelope breakdown (NEB) (hours_minutes). Z-projection of eight sections, 5 μm apart; time interval: 20 min.
Figure 2 with 2 supplements
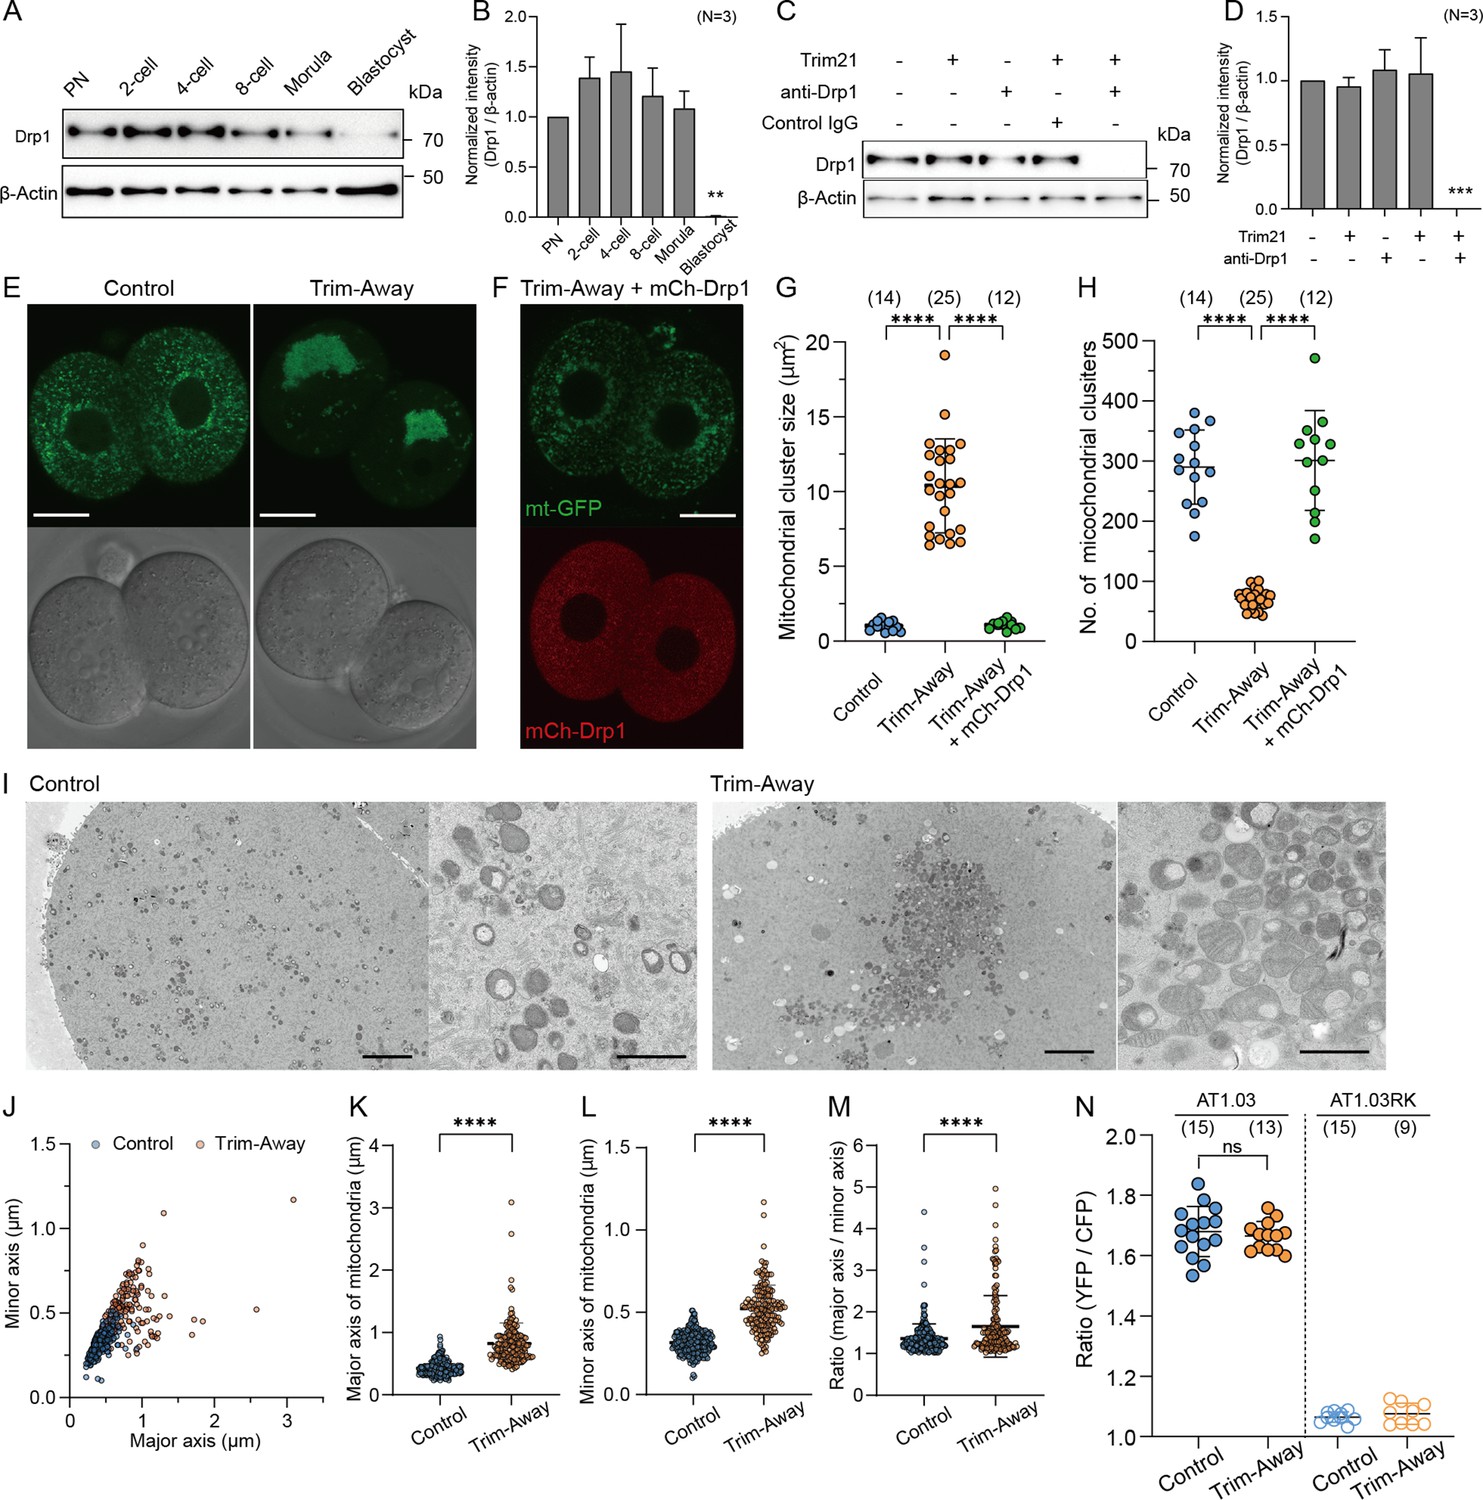
Depletion of Drp1 induces mitochondrial aggregation.
(A) Western blot analysis of preimplantation embryos at the different stages. Lysates of 30 cells were probed with antibodies specific to Drp1 and β-actin. (B) Quantification of the relative Drp1 expression levels in (A) across three experimental replications. (C) Western blot analysis of zygotes overexpressing Trim21 and microinjected with control IgG or anti-Drp1 antibodies (henceforth referred to simply as control and Trim-Away, respectively), or zygotes microinjected with Trim21 mRNA, control IgG, or anti-Drp1 alone. Lysates were extracted 5 h after microinjection and immunoblotted for the indicated proteins. (D) Quantification of the relative Drp1 expression levels in (C) across three experimental replications following Drp1 depletion. (E) Representative images of in-control and Drp1 Trim-Away embryos expressing mt-GFP. Scale bar, 20 μm. (F) A representative image of mitochondria (mt-GFP) in Drp1-depleted embryos expressing exogenous Drp1 (mCh-Drp1). Note that mCh-Drp1 expression rescues the mitochondrial aggregation following Drp1 depletion by Trim-Away to the normal dispersed distribution. Scale bar, 20 μm. (G, H) Comparisons of size (G) and number (H) of mitochondrial clusters (mt-GFP) in (E) and (F). (I) Representative EM images of control (n=5, 17 sections) and Drp1-depleted (n=6, 20 sections) 2 cell embryos. Right panels show higher-magnification images. Scale bar left: 4 μm; right: 1 μm. (J–M) Quantification of major and minor axes (J) of individual mitochondria observed in (I). Comparisons of major axis (K), minor axis (L), and the aspect ratio (M) of mitochondria in control and Drp1-depleted embryos. (N) Levels of ATP in control and Drp1-depleted embryos were estimated using the emission ratio of AT1.03 (YFP/CFP). The emission ratio of AT1.03RK (YFP/CFP), which is unable to bind ATP, is shown as a negative control. Data are represented as mean ± SD and p-values calculated using two-tailed Student’s t-test with Welch’s correction. ****p<0.0001. Number of embryos are indicated in brackets.
-
Figure 2—source data 1
Original files of the full raw uncropped blots displayed in Figures 2A and C.
- https://cdn.elifesciences.org/articles/99936/elife-99936-fig2-data1-v1.zip
-
Figure 2—source data 2
Figures with the uncropped blots with the relevant bands and treatments for Figures 2A and C.
- https://cdn.elifesciences.org/articles/99936/elife-99936-fig2-data2-v1.zip
Figure 2—figure supplement 1
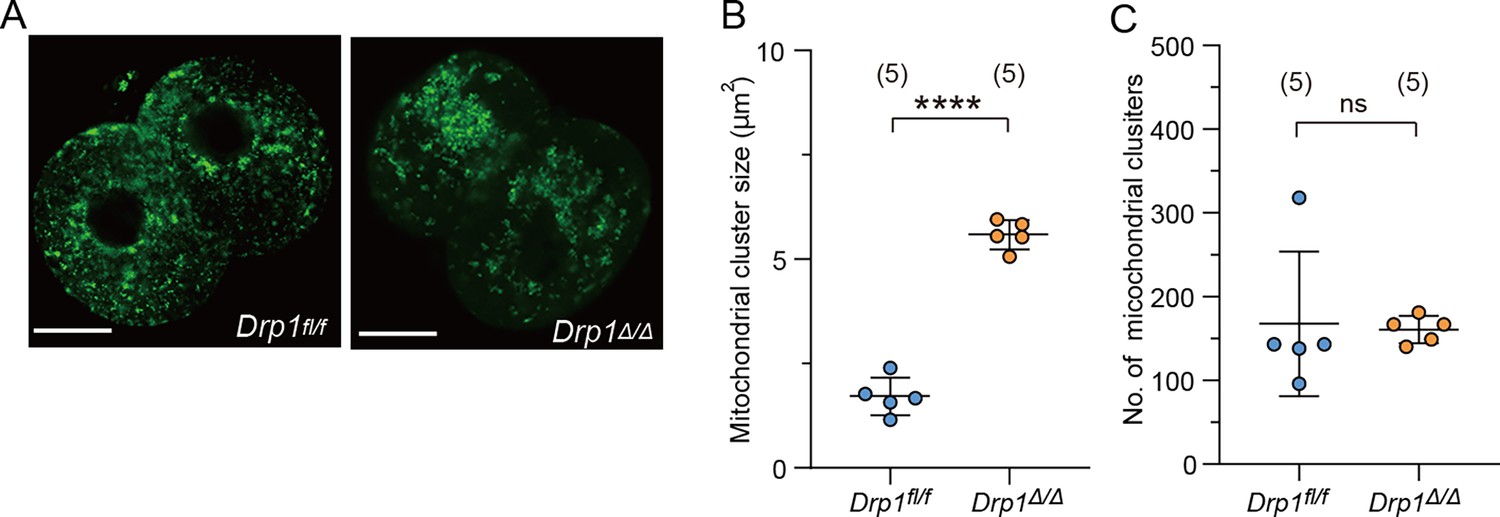
Mitochondrial aggregation in Drp1 knockout (KO) parthenotes.
(A) Representative images of mitochondria (mt-GFP) in Drp1fl/fl control and Drp1Δ/Δ parthenotes. Mature eggs were collected from 4- to 5-week-old Drp1fl/fl and Drp1Δ/Δ mice. Scale bar, 20 μm. After microinjection of mt-GFP mRNA, oocytes were exposed to 10 mM SrCl2. (B, C) Comparisons of size (B) and number (C) of mitochondrial clusters in (A). Data are represented as mean ± SD and P values calculated using two-tailed Student’s t test. ****p < 0.0001; ns, not significant. Number of embryos are indicated in brackets.
Figure 2—figure supplement 2
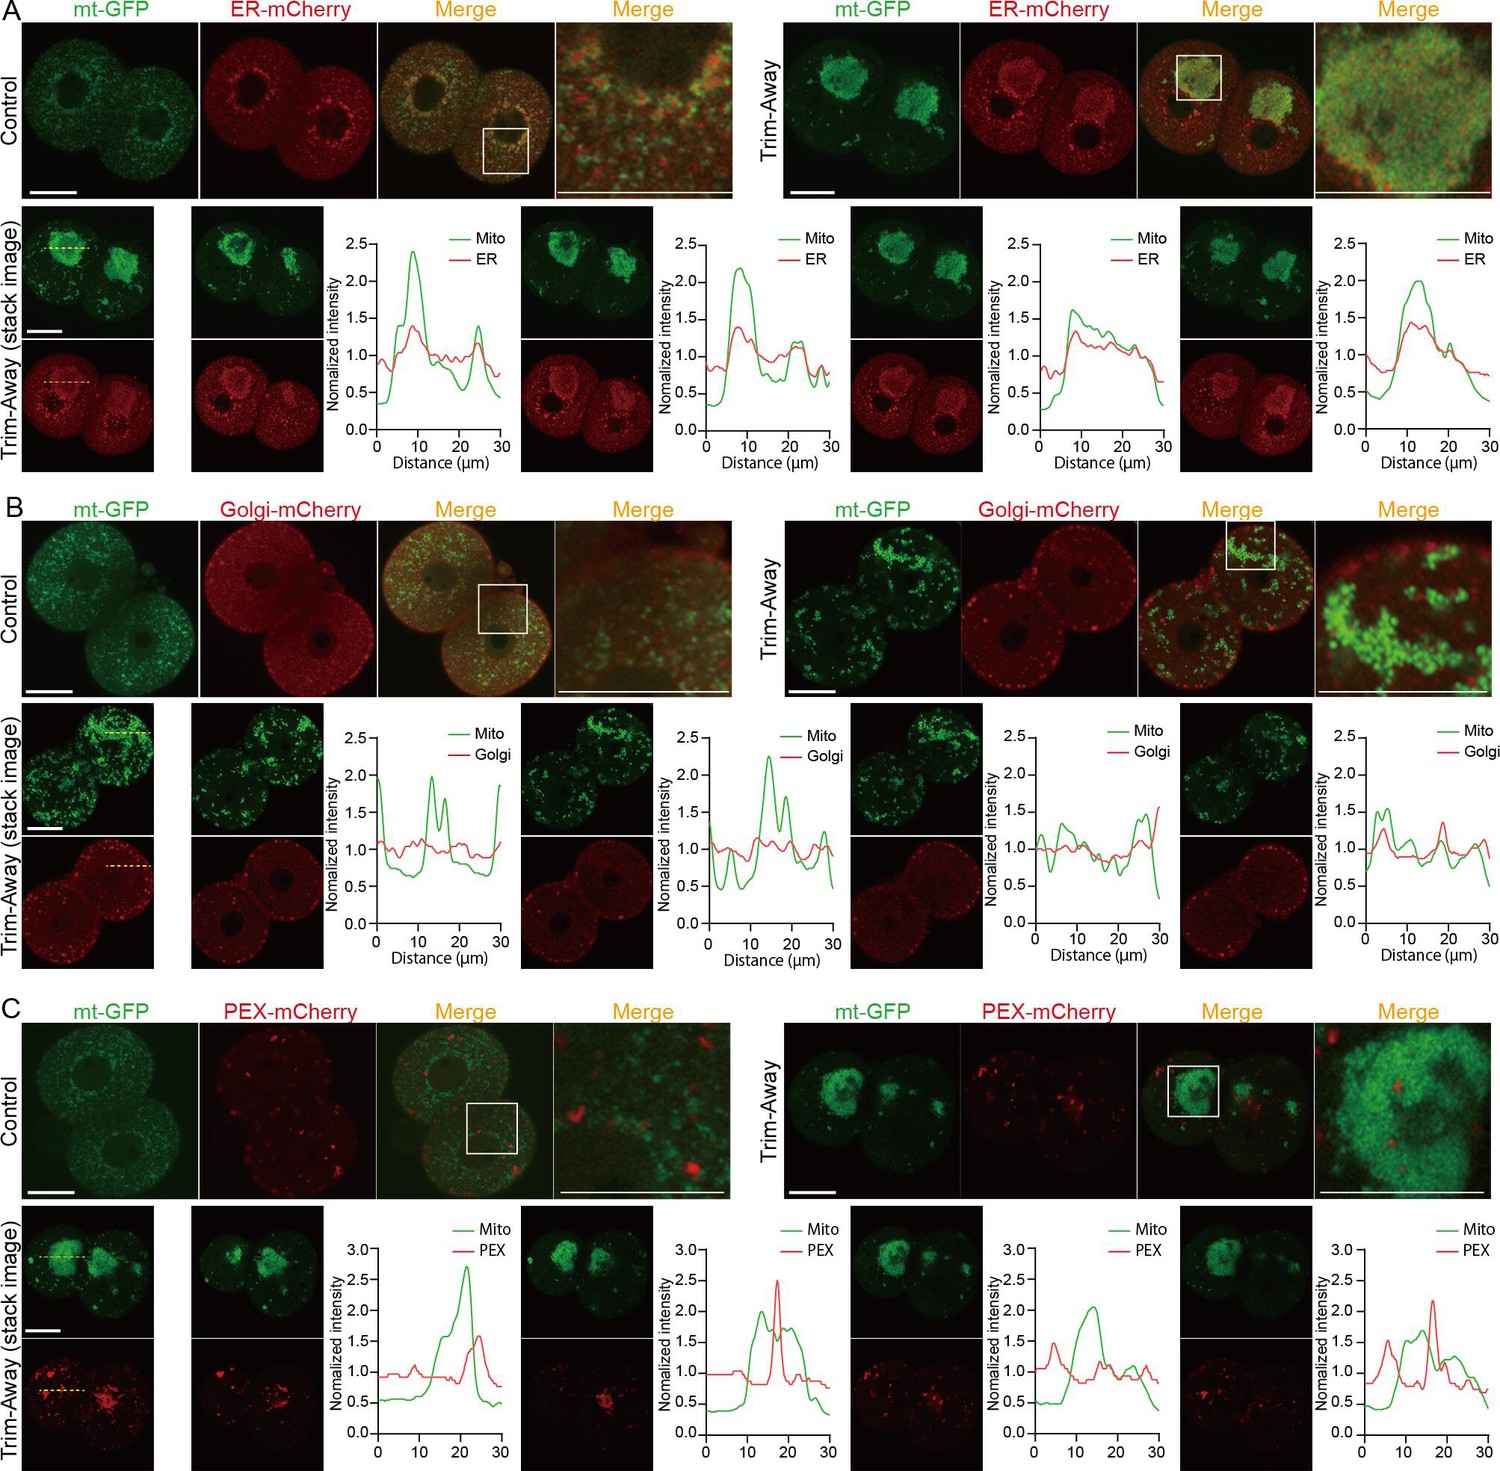
Mitochondrial aggregation disturbs subcellular organelle compartments.
(A–C) Subcellular distributions of mitochondria with endoplasmic reticulum (ER) (A), Golgi (B), and peroxisome (C). Representative images of control and Drp1 Trim-Away embryos co-expressing mt-GFP and ER-mCherry (control, n=11; Trim-Away, n=15), Golgi-mCherry (control, n=10; Trim-Away, n=16), or PEX-mCherry (control, n=19; Trim-Away, n=20). Magnified images in the box areas are shown in the right panels. Scale bar, 20 μm. Bottom panels represent line scan analysis of ER-mCherry (A), Golgi-mCherry (B) and PEX-mCherry at different focal planes of aggregated mitochondria (mt-GFP) in Trim-Away embryos. The fluorescence intensity traces at the dashed line across mitochondrial mass in focal images acquired at 5 µm intervals in the Z-axis direction. Note that the intensity peak of ER-mCherry coincides with that of mt-GFP in each focal plane.
Figure 3 with 3 supplements
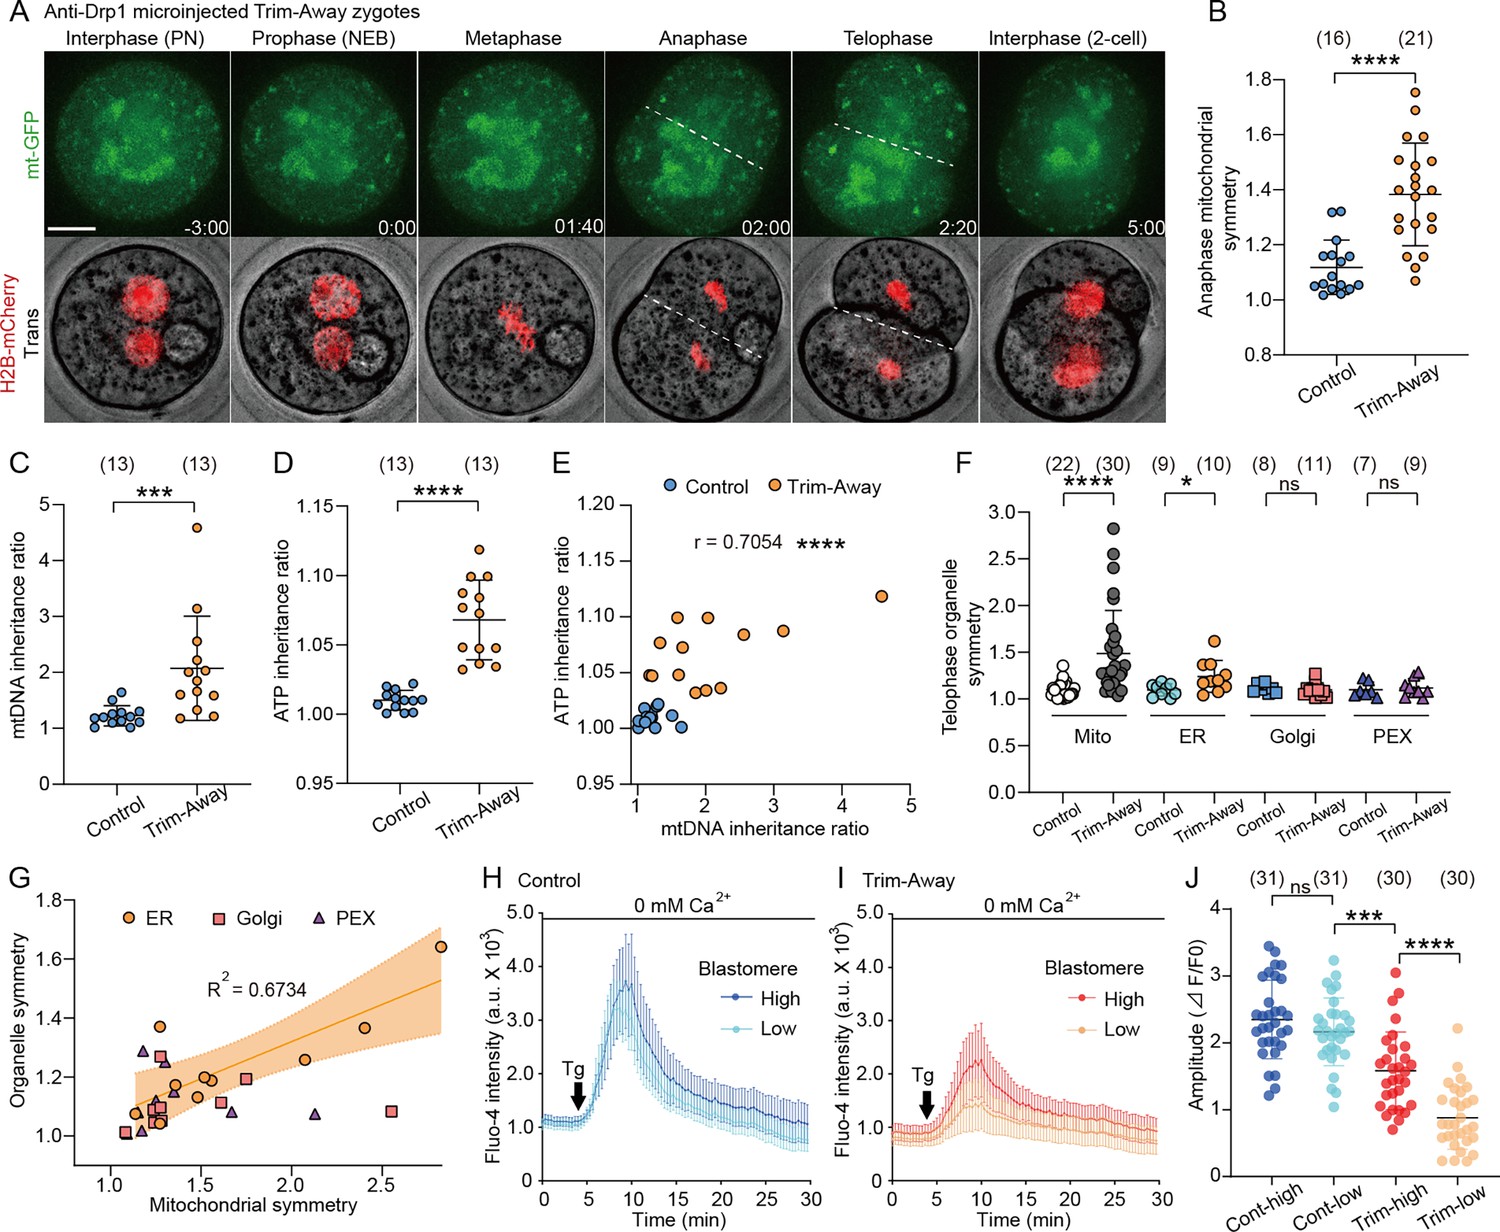
Drp1 depletion causes asymmetric mitochondrial inheritance and functions.
(A) Representative time-lapse images (maximum-intensity Z projection) of mitochondria and chromosomes in anti-Drp1 microinjected Trim-Away zygotes expressing mt-GFP and H2B-mCherry. Time is relative to the onset of NEBD. Dashed lines indicate cleavage plane. Scale bar, 20 μm. (B) Quantitation of mitochondrial asymmetry at anaphase in control and Drp1-depleted zygotes. Total mitochondrial fluorescence in each dividing blastomere was measured, and the greater value was divided by the smaller value for the symmetry index. (C) mtDNA inheritance ratio after the first cleavage division of control and Drp1-depleted zygotes. mtDNA copy number in each daughter blastomere of 2 cell embryo was measured, and the ratio was calculated by dividing the greater value by the smaller value. (D) ATP inheritance ratio between two blastomeres was estimated from comparison of emission ratio of AT1.03 (YFP/CFP) in the daughter blastomere A/B, where A is the daughter blastomere with more mitochondria as confirmed by MitoTracker staining (see Figure 3—figure supplement 1C). (E) Correlation between mtDNA and ATP inheritance ratio between 2 cell blastomeres. (F) Quantitation of organelle asymmetry at telophase was analyzed from time-lapse images of embryos co-expressing mt-GFP with mCherry-tagged ER, Golgi, or peroxisome. Total mitochondrial fluorescence in each blastomere was measured, and the greater value was divided by the smaller value. (G) Organelle symmetry ratios, as shown in (F), are plotted against the mitochondrial symmetry ratio for each Drp1-depleted embryo. Note that mitochondrial and endoplasmic reticulum (ER) inheritance ratios are highly correlated (R2=0.6734). (H–J) Endoplasmic reticulum Ca2+ content in each blastomere of control (H) and Drp1-depleted (I) embryos was estimated following the addition of 10 μM thapsigargin in Ca2+ -free medium, and comparisons of the Fluo-4 fluorescent peaks are shown in a graph (J). Data are represented as mean ± SD and p-values calculated using unpaired two-tailed t-tests with Welch’s correction (B, C, D, and F) or one-way ANOVA with Turkey’s multiple comparison test (J). *p<0.05, ***p<0.001, ****p<0.0001; ns, not significant. Number of zygotes/embryos are indicated in brackets.
Figure 3—figure supplement 1
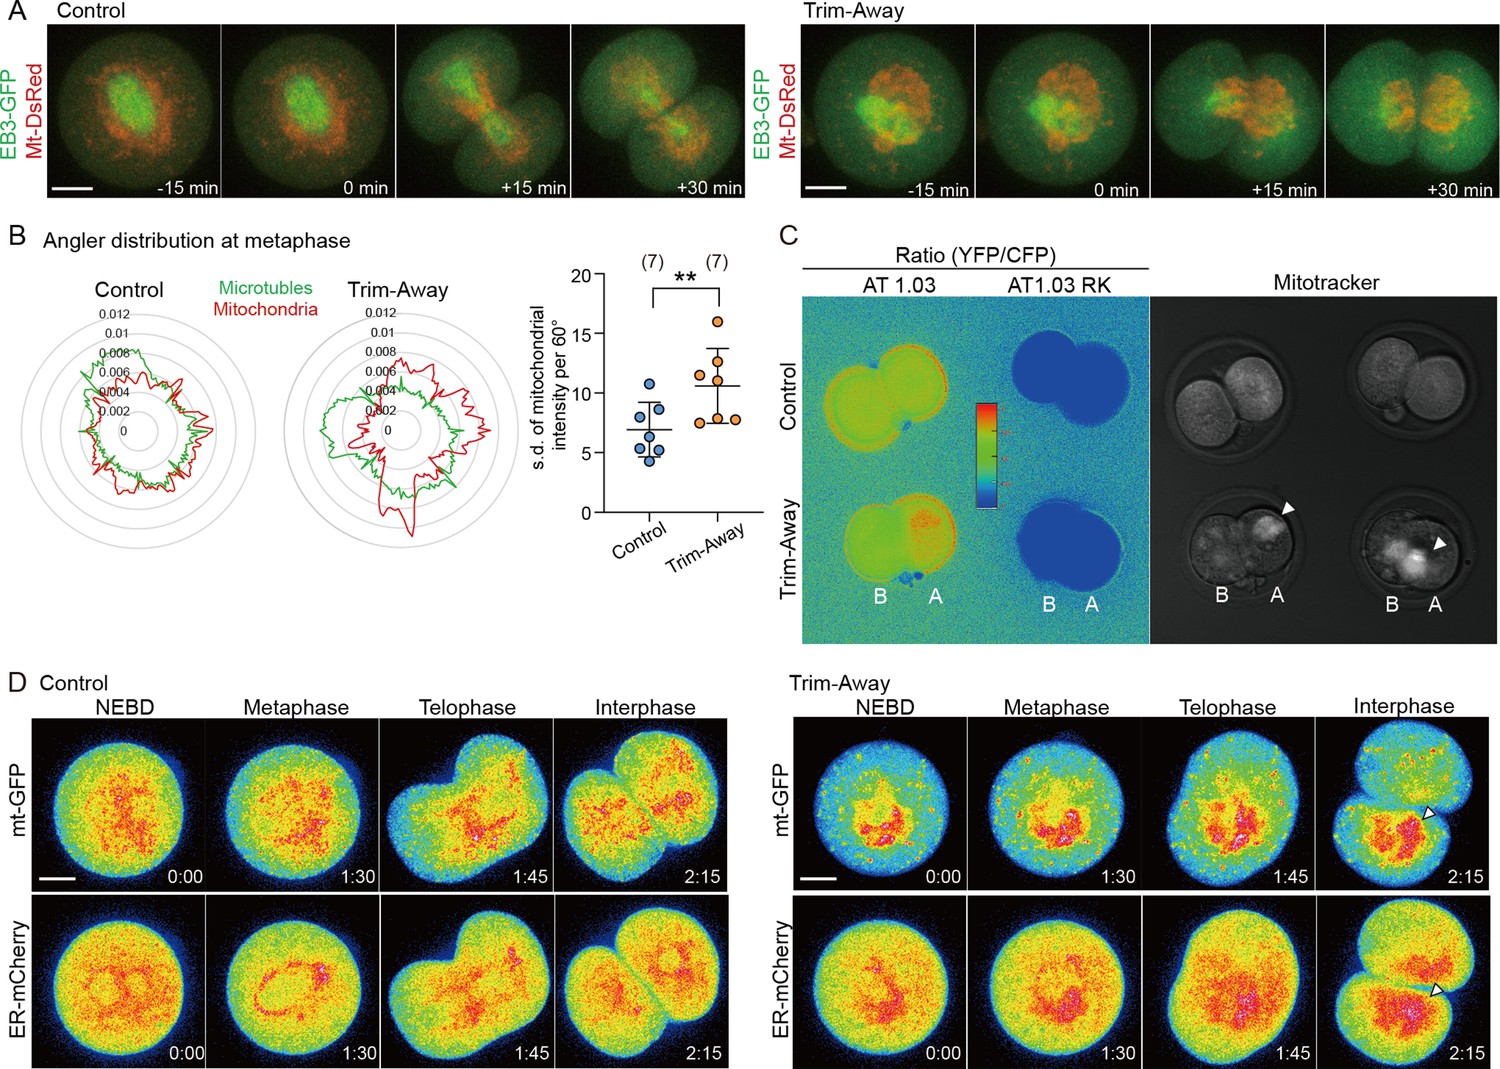
Drp1 depletion increases asymmetry in mitochondrial inheritance between blastomeres.
(A) Representative time-lapse images (maximum-intensity Z projection) of mitochondria and microtubules in control and anti-Drp1 microinjected Trim-Away zygotes expressing EB3-GFP and mt-DsRed. Time is relative to the onset of anaphase. Scale bar, 20 μm. (B) Uniformity analysis of mitochondrial distribution around the spindle. Representative angler distributions of mitochondria (red trace) and microtubules (green trace) at the metaphase of control and Drp1 Trim-Away zygotes, as shown in (A). Based on the angular distributions, standard deviation of averaged mitochondrial fluorescence intensity per 60° sector were plotted in the graph to the right, higher values indicate increased non-uniformity. (C) Representative ratiometric images of ATeam AT1.03 and AT1.03RK fluorescence (YFP/CFP) in control and Drp1-depleted 2 cell embryos. Mitochondrial distribution in the same embryos is shown in the right panel. Arrowheads represent marked mitochondrial aggregation in Drp1 Trim-Away embryos and blastomere A/B, where A is the daughter blastomere with more mitochondria as indicated by MitoTracker staining. (D) Representative time-lapse images (maximum-intensity Z projection) of mitochondria and ER in control and Drp1 Trim-Away zygotes expressing mt-GFP and ER-mCherry. Arrowheads represent regions of marked mitochondrial aggregation in Drp1 Trim-Away embryos. Time is relative to the onset of NEBD. Scale bar, 20 μm. Data are represented as mean ± SD and p-value calculated using two-tailed Student’s t-test. **p<0.01. Number of zygotes are indicated in brackets.
Figure 3—video 1
Asymmetric mitochondrial partitioning during the first cleavage of Drp1-depleted zygotes, related to Figure 3.
Representative time-lapse movies of mitochondria (mt-GFP) and chromosomes (H2B-mCherry) in Drp1 Trim-Away (right) zygotes. Time is relative to the onset of nuclear envelope breakdown (NEB) (hours_minutes). Z-projection of eight sections, 5 μm apart; time interval: 20 min.
Figure 3—video 2
Asymmetric partitioning of the endoplasmic reticulum (ER) confined to mitochondrial aggregation regions in Drp1-depleted zygotes, related to Figure 3—figure supplement 1.
Representative time-lapse movies of mitochondria (mt-GFP) and ER (ER-mCherry) in control and Drp1 Trim-Away zygotes. Each of the movies in the upper row is displayed in the lower row by LUT. Arrowheads represent regions of marked mitochondrial aggregation. Time is relative to the onset of nuclear envelope breakdown (NEB) (hours_minutes). Z-projection of eight sections, 5 μm apart; time interval: 15 min.
Figure 4 with 1 supplement
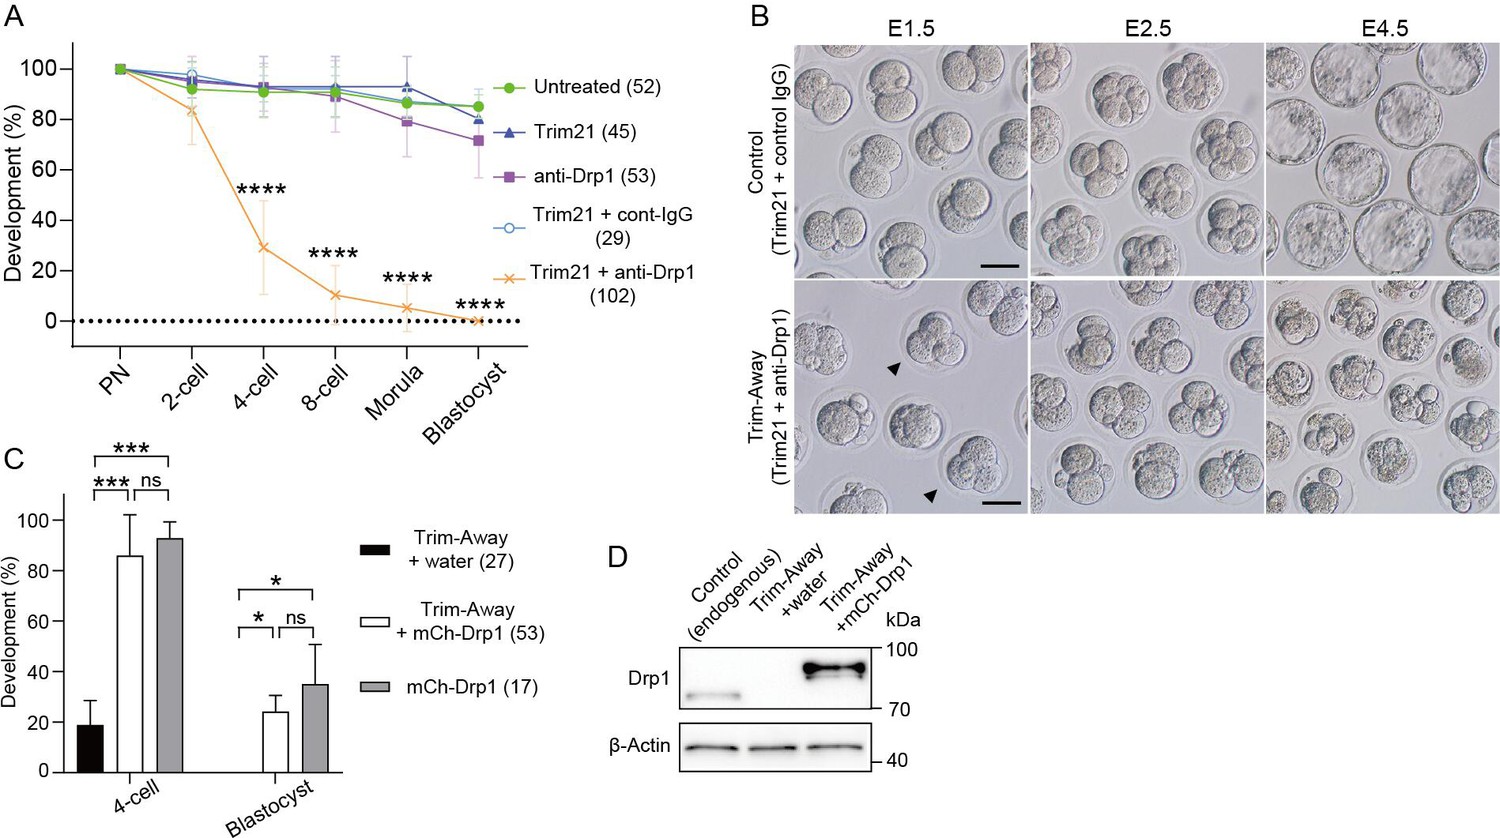
Drp1 depletion causes early embryonic arrest.
(A) Developmental competence of control and Drp1 Trim-Away zygotes. Following Drp1 depletion by Trim-Away (co-injection of Trim21 mRNA and anti-Drp1 antibody) or the control experiments in Figure 2B, zygotes were cultured to the indicated stages. (B) Representative images of embryos microinjected with Trim21 mRNA and control IgG or anti-Drp1 were cultured. Some embryos at E1.5 have three or four blastomeres (arrowheads). Scale bar, 20 μm. (C) Developmental competence of Drp1-depleted embryos is rescued by microinjection of mCherry-Drp1 (mCh-Drp1) mRNA. Percentage of zygotes reaching the indicated developmental stage. Note that the 2 cell stage arrest in control condition with RNA buffer (water) upon Trim-Away depletion was reversed by microinjecting mCh-Drp1 mRNA. (D) Western blot analysis of control and Drp1 Trim-Away zygotes that were microinjected with water or mCh-Drp1 mRNA upon Trim-Away depletion. Lysates of 20 zygotes were extracted 5 hr after microinjection and were probed with antibodies specific to Drp1 and β-actin. Data are represented as mean ± SD and p-values calculated using one-way ANOVA with Turkey’s multiple comparison test. *p<0.05, ***p<0.001, ****p<0.0001; ns, not significant. Number of embryos are indicated in brackets.
-
Figure 4—source data 1
Original files of the full raw uncropped blots displayed in Figure 4D.
- https://cdn.elifesciences.org/articles/99936/elife-99936-fig4-data1-v1.zip
-
Figure 4—source data 2
Figures with the uncropped blots with the relevant bands and treatments for Figure 4D.
- https://cdn.elifesciences.org/articles/99936/elife-99936-fig4-data2-v1.zip
Figure 4—figure supplement 1
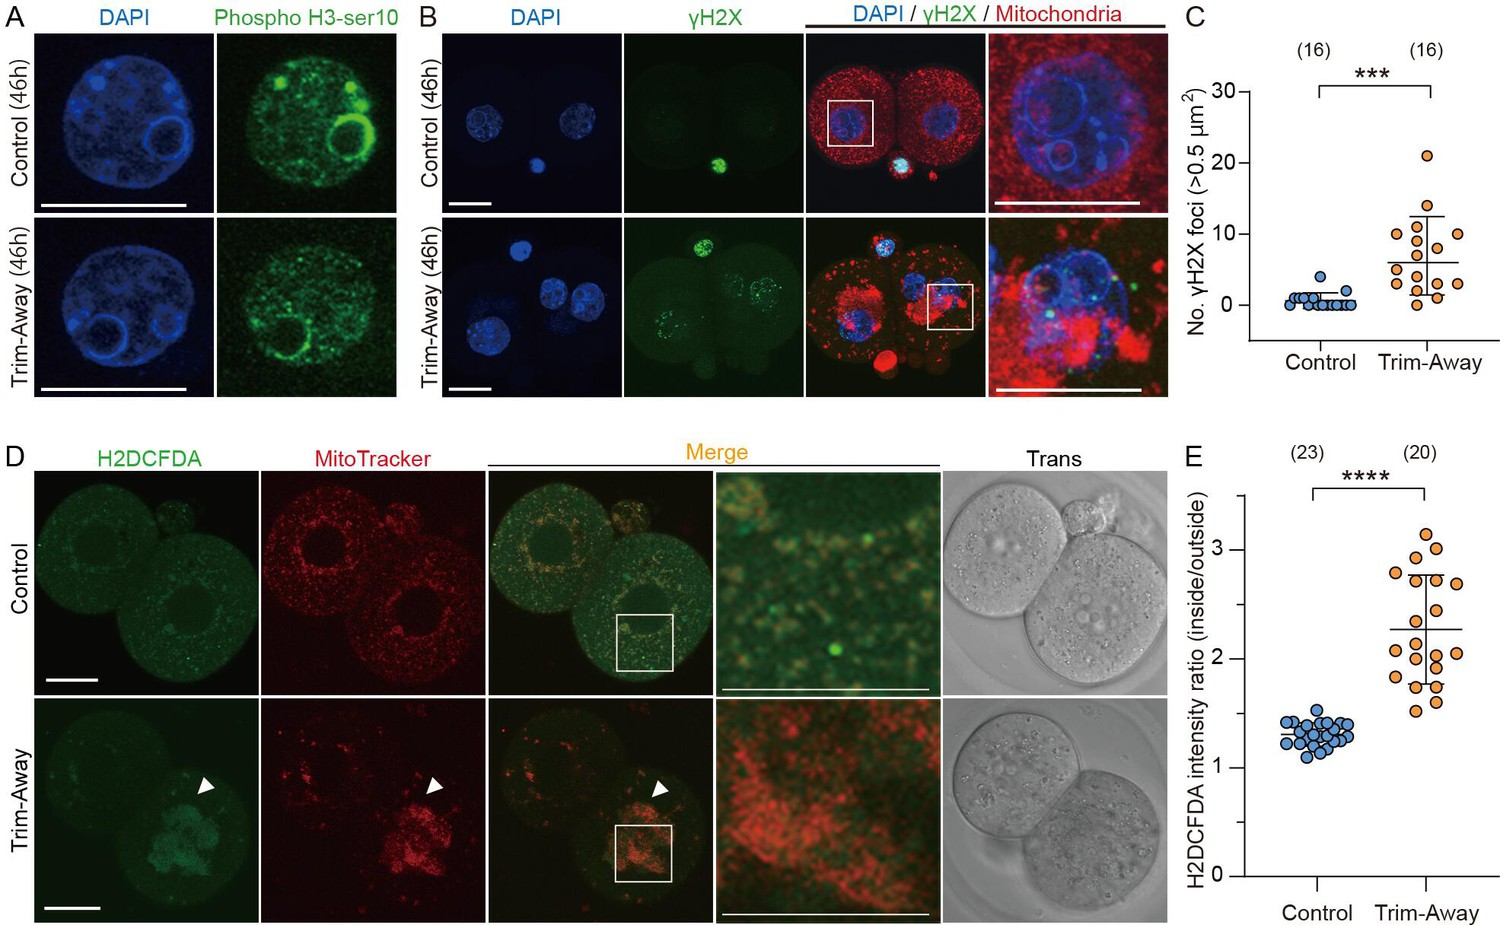
Drp1 depletion increases ROS in mitochondria and DNA damage.
(A) Representative immunofluorescence images of phosphorylated (Ser10) histone H3 (green), known to localize in the heterochromatin region in G2-phase cells, and DAPI (blue) in control (n=18) and Drp1 Trim-Away (n=20) embryos. Scale bars, 20 µm. Note that the phosphorylated (Ser10) histone H3 signal accumulates in DAPI-intense stained heterochromatin domains. Embryos were fixed at 46 hr post-hCG (corresponding to the G2 stage of 2 cell embryos). (B) Representative immunofluorescence images (maximum-intensity Z projection) of γH2AX (green), MitoTracker Red CMXros (red), and DAPI (blue) in control and Drp1 Trim-Away embryos. (C) Comparisons of the number of γH2AX foci in control and Drp1 Trim-Away embryos. (D) Representative images of H2DCFDA, a probe for intracellular reactive oxygen species (ROS) and mitochondria (MitoTracker Red CMXros) in control and Drp1 Trim-Away embryos. Arrowheads represent regions of marked mitochondrial aggregation in Drp1 Trim-Away embryos. Magnified images in the box areas are shown in the right panels. Scale bar, 20 μm. (E) Quantification of ROS enrichment levels in mitochondria by calculating the ratio of H2DCFDA fluorescence intensity inside mitochondria to that outside mitochondria. Data are represented as mean ± SD and p-values calculated using unpaired two-tailed t tests with Welch’s correction. ***p<0.001, ****p<0.0001. Number of embryos are indicated in brackets.
Figure 5 with 3 supplements
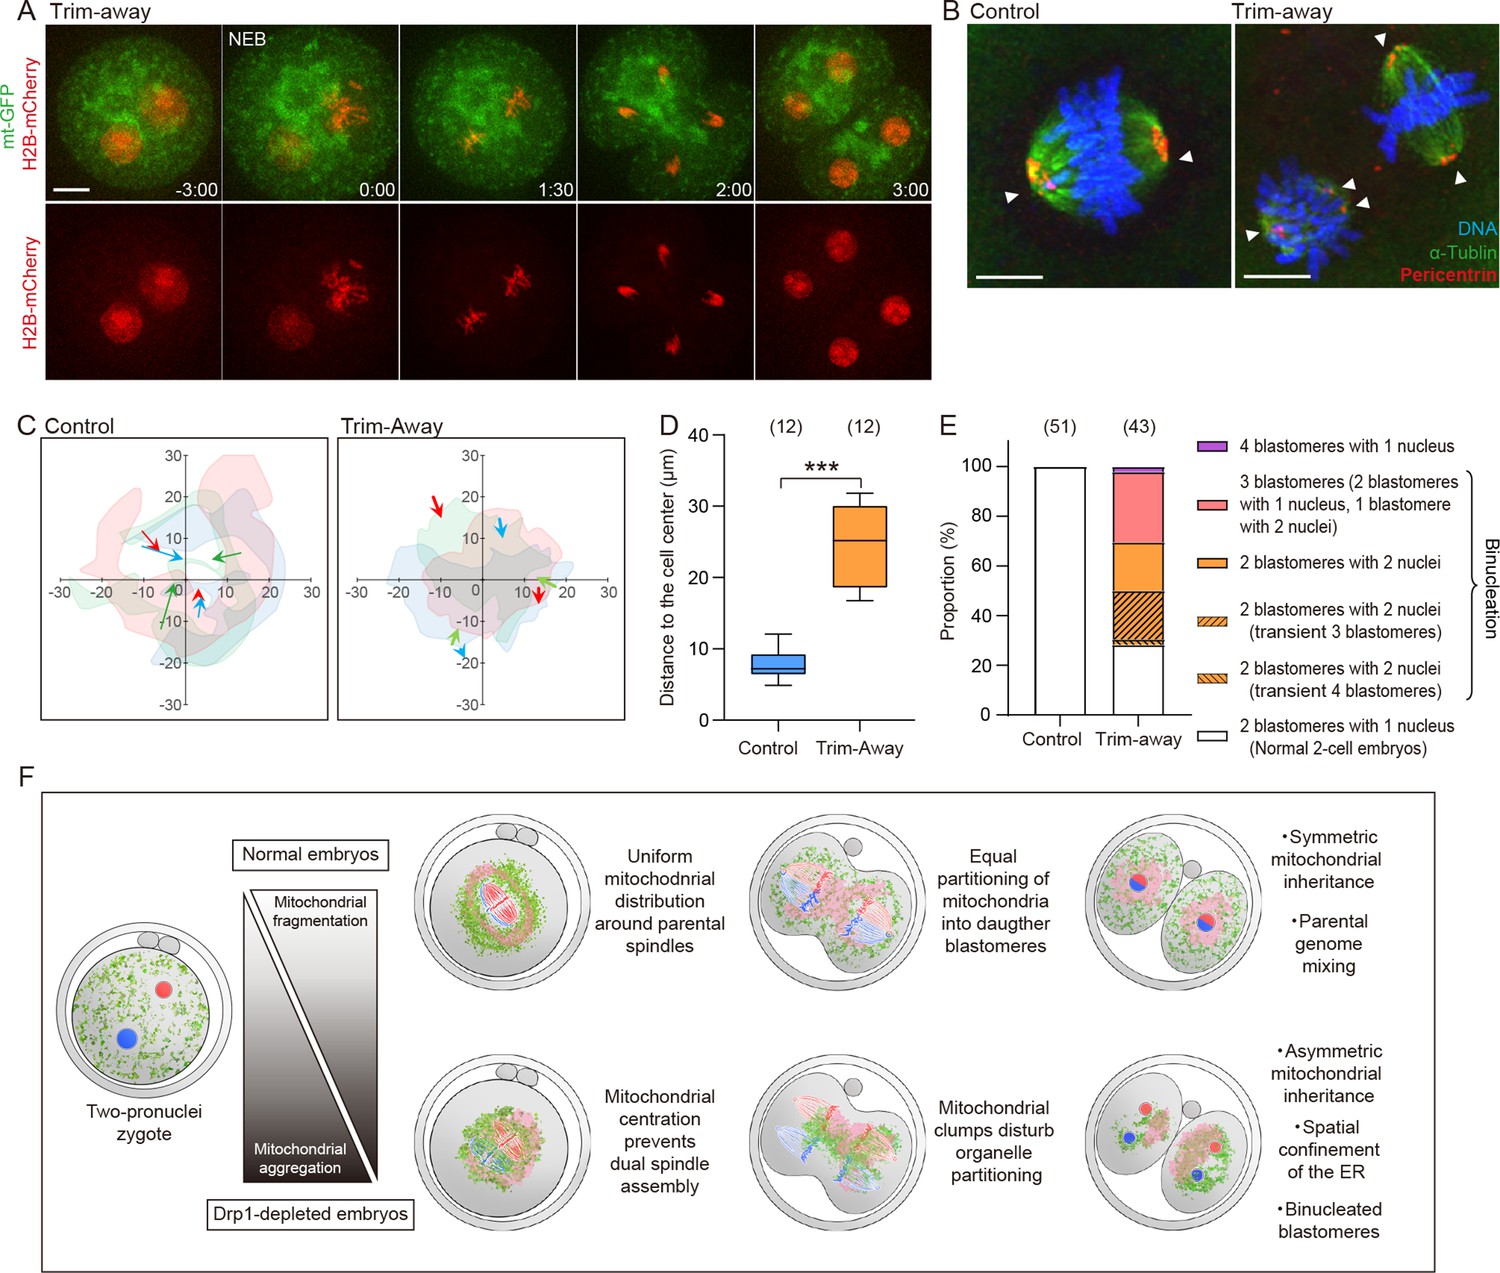
Misplaced mitochondria cause chromosome segregation defects leading to binucleation.
(A) Representative time-lapse images (maximum-intensity Z projection) of mitochondria and chromosomes in Drp1 Trim-Away zygotes expressing mt-GFP and H2B-mCherry. Time is relative to the onset of nuclear envelope breakdown (NEB). Scale bar, 20 μm. (B) Representative immunofluorescence images of control (n=10) and Drp1-depleted (n=31) zygotes at metaphase of the first cleavage. Pericentrin (red), microtubules (green), and DNA (blue) were imaged by confocal microscopy. White arrowheads indicate spindle poles. Scale bars, 10 µm. (C) The position of chromosomes relative to the center of zygotes. The centroids of two sets of chromosomes were tracked, and only the displacements projected in the direction pointing from initial (NEB) to the final position (just before anaphase onset) were indicated. Data for three representative zygotes were presented, and each color represents a zygote. Images of mitochondria at the final position automatically had their thresholds stipulated using Fiji (Moments algorithm) and merged with images filled inside the outline with the color corresponding to the chromosomes. (D) Quantification of the distance of chromosomes to cell center just before anaphase onset. (E) Cell division abnormalities at the first cleavage. Note that binucleated blastomeres in Drp1-depleted embryos result from various chromosome segregation defects (see also Figure 5—figure supplement 1C and D). (F) Schematic summary of results highlighting significant findings in this study. Drp1 mediates mitochondrial fragmentation, ensuring symmetric mitochondrial inheritance between daughter blastomeres. In normal embryos, fragmented mitochondria (green) and the endoplasmic reticulum (ER) (pink) uniformly surround two spindles, allowing parental spindles (blue and red) to assemble at the center of metaphase zygotes. Drp1 depletion increases mitochondrial aggregation and asymmetric distribution. Misplaced mitochondria disturb the organelle positioning during the first cleavage division, leading to asymmetric organelle inheritance and chromosome missegregation, which in turn results in early embryonic arrest. Data are represented as mean ± SD and p-values calculated using unpaired two-tailed t-tests with Welch’s correction. ***p<0.001.
Figure 5—figure supplement 1
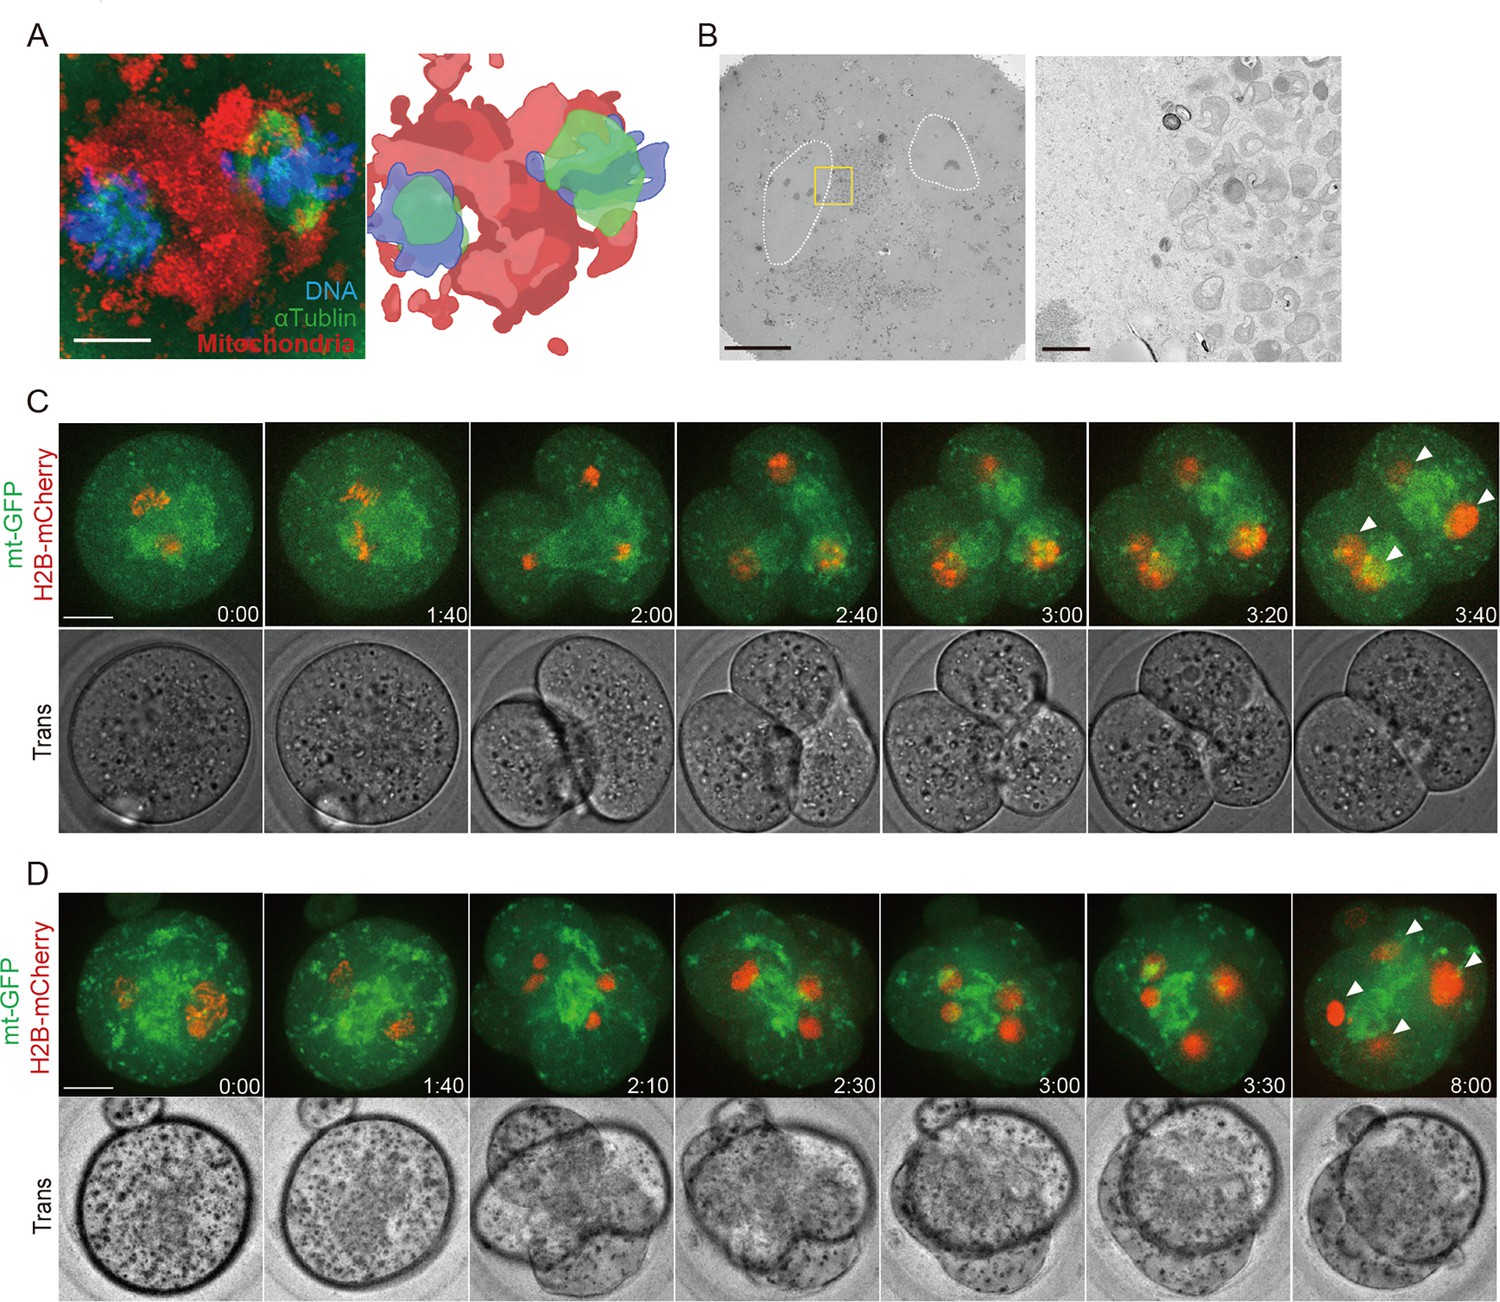
Marked mitochondrial centration causes chromosome segregation defects.
(A) A representative image of mitochondria (red), microtubules (green), and DNA (blue) in Drp1-depleted metaphase zygotes (n=22). Prior to fixation, zygotes were stained with MitoTracker Red CMXRos for 0.5 hr. Scale bars: 10 µm. The right panel represents a schematic diagram showing mitochondria located in the center of two spindles based on the left panel. (B) Representative electron microscopy (EM) images (n=6) showing mitochondria clustered in zygote center and metaphase chromosomes, as surrounded by dashed lines, located in the vicinity of the mitochondria. Representative higher-magnification images (31 sections) of the boxed areas. Scale bar left: 10 μm; middle and right: 1 μm. (C, D) Examples of two typical cleavage defects leading to binucleation in Drp1 Trim-Away zygotes. Time-lapse images (maximum-intensity Z projection) of mitochondria (mtGFP) and chromosomes (H2B-mCherry) during the first cleavage division show the mitochondrial aggregation sits between two sets of chromosomes which transiently segregated into three (C) or four (D) blastomeres before forming binucleated (arrowheads) 2 cell embryos. Time is relative to the onset of NEBD. Scale bar, 20 μm.
Figure 5—video 1
Binuclear formation in Drp1-depleted embryos, related to Figure 5.
Representative time-lapse movies of mitochondria (mt-GFP) and chromosomes (H2B-mCherry) in Drp1 Trim-Away zygotes. Time is relative to the onset of nuclear envelope breakdown (NEB) (hours_minutes). Z-projection of 10 sections, 3.5 μm apart; time interval: 15 min.
Figure 5—video 2
Examples of two typical cleavage defects leading to binucleation in Drp1 Trim-Away zygotes, related to Figure 5—figure supplement 1.
Time-lapse movies of mitochondria (mt-GFP) and chromosomes (H2B-mCherry) in the zygote showed that multiple cleavage furrows formed between the different sets of chromosomes leading to transient formation of three or four blastomeres, which failed to complete cytokinesis and collapsed back to form binucleated 2 cell embryos. Time is relative to the onset of nuclear envelope breakdown (NEB) (hours_minutes). Z-projection of 10 sections, 3.5 μm apart; time interval: 10 min.
Tables
Key resources table
| Reagent type (species) or resource | Designation | Source or reference | Identifiers | Additional information |
|---|---|---|---|---|
| Genetic reagent (Mus musculus) | DBA/2 (♂) | Charles River Laboratories | RRID:MGI:2159768 | |
| Genetic reagent (M. musculus) | Mouse: C57BL/6 N (♀) | Charles River Laboratories | RRID:MGI:2159965 | |
| Genetic reagent (M. musculus) | Mouse: B6D2F1 mice | Department of Animal Resources, Okayama University | RRID:MGI:5649818 | |
| Genetic reagent (M. musculus) | Drp1fl/fl mice | PMID:19752021 | ||
| Genetic reagent (M. musculus) | Drp1cKO mice | PMID:35704569 | ||
| Antibody | Mouse monoclonal anti-Drp1 | BD Biosciences | Cat# 611739; RRID:AB_399215 | WB(1:1000) Trim-Away experiment (1000 ng/mL) |
| Antibody | Mouse monoclonal anti-β-actin | Cell Signalling Technology | Cat# 3700; RRID:AB_2242334 | WB(1:2000) |
| Antibody | Rabbit polyclonal anti-Myo19 | Abcam | Cat# ab174286; RRID:AB_3712164 | IF(1:300) WB(1:1000) |
| Antibody | Rabbit polyclonal anti-Pericentrin | Abcam | Cat# ab4448; RRID:AB_304461 | IF(1:500) |
| Antibody | Mouse monoclonal Anti-γH2A.X | Abcam | Cat# ab22551; RRID:AB_447150 | IF(1:500) |
| Antibody | HRP anti-Mouse | Cell Signaling Technology | Cat# 7076; RRID:AB_330924 | WB(1:2000) |
| Antibody | HRP anti-Rabbit | Cell Signaling Technology | Cat# 7074; RRID:AB_2099233 | WB(1:2000) |
| Antibody | Alexa Fluor 488 anti-Mouse IgG | Thermo Fisher Scientific | Cat# A-11001; RRID:AB_2534069 | IF(1:300) |
| Antibody | Alexa Fluor 568 anti-Rabbit IgG | Thermo Fisher Scientific | Cat# A-11011; RRID:AB_143157 | IF(1:500) |
| Antibody | Normal mouse IgG | Santa Cruz Biotechnology | Cat# sc-2025; RRID:AB_737182 | Trim-Away experiment (1000 ng/mL) |
| Antibody | Normal Rabbit IgG | Cell Signaling Technology | Cat# 2729; RRID:AB_1031062 | Trim-Away experiment (1000 ng/mL) |
| Recombinant DNA reagent | pcDNA6-Mt-GFP(plasmid) | PMID:25113836 | ||
| Sequence-based reagent | pcDNA6-Mt-DsRed (plasmid) | PMID:25113836 | ||
| Recombinant DNA reagent | pcDNA6-ER-mCherry (plasmid) | PMID:25113836 | ||
| Recombinant DNA reagent | pcDNA6-H2B-mCherry (plasmid) | PMID:25113836 | ||
| Recombinant DNA reagent | pcDNA6-EB3-GFP (plasmid) | PMID:25113836 | ||
| Recombinant DNA reagent | pcDNA3-AT1.03 (plasmid) | PMID:19720993 | ||
| Recombinant DNA reagent | pcDNA3-AT1.03 RK (plasmid) | PMID:19720993 | ||
| Recombinant DNA reagent | pCMV-Trim21 (plasmid) | ORIGENE | Cat#: MR207378 | |
| Sequence-based reagent | pcDNA6-Golgi-mCherry cloning (sense) | Eurofins | PCR primers | 5’-ATCAAGCTTGCCACCATGGGCAACTTGAAG-3’ |
| Sequence-based reagent | pcDNA6-Golgi-mCherry cloning (antisense) | Eurofins | PCR primers | 5’-TATCTCGAGACCACCTCCACCTCCTCCA-3’ |
| Sequence-based reagent | pcDNA6-PEX-mCherry cloning (sense) | Eurofins | PCR primers | 5’-GATCTCGAGCTCAAGCTTCGAATTCTGCAG-3’ |
| Sequence-based reagent | pcDNA6-PEX-mCherry cloning (antisense) | Eurofins | PCR primers | 5’- TATCTAGAGTCGCGGCCGCTACAGCTTG-3’ |
| Sequence-based reagent | pcDNA6-mCherry-Drp1 infusion cloning (sense) | Eurofins | PCR primers | 5’- CAGTGTGGTGGAATTGCCACCATGGTGAGCAAG-3’ |
| Sequence-based reagent | pcDNA6-mCherry-Drp1 infusion cloning (antisense) | Eurofins | PCR primers | 5’- ACTGTGCTGGATATCTCACCAAAGATGAGTCTCC-3’ |
| Sequence-based reagent | mtDNA qPCR (left) | Eurofins | PCR primers | 5’-CCTATCACCCTTGCCA-3 |
| Sequence-based reagent | mtDNA qPCR (right) | Eurofins | PCR primers | 5’-GAGGCTGTTGCTTGTG-3’ |
| Commercial assay or kit | RiboMAX Large Scale RNA Production Systems | Promega | Cat# P1300 | |
| Commercial assay or kit | Ribo m7G Cap Analog | Promega | Cat# P1712 | |
| Commercial assay or kit | T7 mMessage mMachine Kit | Thermo Fisher Scientific | Cat# AM1344 | |
| Commercial assay or kit | Poly(A) Tailing Kit | Thermo Fisher Scientific | Cat# AM1350 | |
| Chemical compound, drug | Hyaluronidase | Sigma-Aldrich | Cat# D2650 | |
| Chemical compound, drug | Protease | Sigma-Aldrich | Cat# P5147 | |
| Chemical compound, drug | DMSO | Sigma-Aldrich | Cat# D2650 | |
| Chemical compound, drug | Cytochalasin B | Sigma-Aldrich | Cat# C6762 | |
| Chemical compound, drug | Polyvinylpyrrolidone (PVP) Solution | Irvine Scientific | Cat# 90123 | |
| Chemical compound, drug | Thapsigargin | Thermo Fisher Scientific | Cat# T9033 | |
| Chemical compound, drug | MitoTracker Red CMXRos | Thermo Fisher Scientific | Cat# M7512 | |
| Chemical compound, drug | CM-H2-DCFDA | Thermo Fisher Scientific | Cat# C6827 | |
| Chemical compound, drug | Fluo-4, AM | Thermo Fisher Scientific | Cat# F14201 | |
| Chemical compound, drug | Pluronic F-127 | Thermo Fisher Scientific | Cat# P6867 | |
| Chemical compound, drug | Triton X-100 | Sigma-Aldrich | Cat# T9284 | |
| Chemical compound, drug | DAPI | Sigma-Aldrich | Cat# D9542 | |
| Software, algorithm | Fiji | PMID:22743772 | RRID:SCR_002285 | |
| Software, algorithm | QuantEv Icy plugin | PMID:30091700 | ||
| Software, algorithm | HCImage | Hamamatsu photonics | RRID:SCR_015041 | |
| Software, algorithm | Prism 8 | GraphPad Prism | RRID:SCR_002798 |
Additional files
Download links
A two-part list of links to download the article, or parts of the article, in various formats.
Downloads (link to download the article as PDF)
Open citations (links to open the citations from this article in various online reference manager services)
Cite this article (links to download the citations from this article in formats compatible with various reference manager tools)
Redistribution of fragmented mitochondria ensures symmetric organelle partitioning and faithful chromosome segregation in mitotic mouse zygotes
eLife 13:RP99936.
https://doi.org/10.7554/eLife.99936.4


