Origins and functional consequences of somatic mitochondrial DNA mutations in human cancer
- Wellcome Trust Sanger Institute, United Kingdom
- Cambridge University Hospitals NHS Foundation Trust, United Kingdom
- University of Cambridge, United Kingdom
- University of New South Wales, Australia
- National Cancer Centre, Singapore
- Duke-NUS Graduate Medical School, Singapore
- Dana-Farber Cancer Institute, United States
- Institute of Cancer Research, Sutton, United Kingdom
- University of Oxford, United Kingdom
- MD Anderson Cancer Center, United States
- University of Nottingham, United Kingdom
- National Institute of Health, United States
- University of North Carolina, United States
- University of Toronto, Canada
- University of Liverpool, United Kingdom
- HCA Pathology Laboratories, United Kingdom
- University of East Anglia, United Kingdom
- University of Tampere and Tampere University Hospital, Finland
- Johns Hopkins University, United States
- Royal National Orthopaedic Hospital, United Kingdom
- University College London, United Kingdom
- The University of Texas, MD Anderson Cancer Center, Houston, United States
- Newcastle University, United Kingdom
Decision letter
-
Todd GolubReviewing Editor; Broad Institute, United States
eLife posts the editorial decision letter and author response on a selection of the published articles (subject to the approval of the authors). An edited version of the letter sent to the authors after peer review is shown, indicating the substantive concerns or comments; minor concerns are not usually shown. Reviewers have the opportunity to discuss the decision before the letter is sent (see review process). Similarly, the author response typically shows only responses to the major concerns raised by the reviewers.
Thank you for sending your work entitled “Origins and functional consequences of somatic mitochondrial DNA mutations” for consideration at eLife. Your article has been favorably evaluated by Stylianos Antonarakis (Senior editor), a Reviewing editor, and 3 reviewers.
The editors and the reviewers discussed their comments before we reached this decision, and the Senior editor has assembled the following comments to help you prepare a revised submission.
The substantial concerns of the 3 reviewers are:
Reviewer 1:
1) Is the generated sequence data accessible through a public repository such as GEO? Are database accession numbers provided somewhere in the manuscript.
2) Figure 3–figure supplement 1 is an example of possible artifacts in the authors' results/interpretation. This figure compares the substitution rates between 12 coding genes on heavy strand vs 1 on light strand, but information on how the graph was generated for the 12 genes cannot be found. Does the graph show the sum or average of observed substitution rates? If it is based on average rates, should there not be error bars or p-values from t-tests. Also, why are the 12 genes shown for the L strand, and the 1 gene as the H strand?
3) In Figure 4, what are the authors trying to demonstrate with Figure 4A? What do arrows beside the “box” indicate? What do the different colors of the arrow (blue and red) mean? Why is the “box” designed for the light strand sequence when it has only 1 out of 13 protein-coding genes? What does skew mean here?
Reviewer 2:
1) Do the authors observe differences between tumor types in terms of the relative proportion of negatively selected somatic mutations that are hetero- vs. homoplasmic? This may indicate differential (negative) selective pressures in different tumor types (e.g. negative selection could be less pronounced in tumors with a low rate of oxidative phosphorylation).
2) The authors suggest that the major explanation for lack of visible exogenous mutation signatures (i.e. such related to tobacco smoke or UV light exposure) is that the endogenous mutation rate in mitochondria is several orders of magnitude greater than the exogenous mutation rate. Can the authors, based on the rate of nuclear genome somatic mutations in tumors with pronounced exogenous mutation signatures (i.e. using data from earlier works by the authors) provide an estimate for the relative difference in endogeneous vs. exogeneous mutation rate?
Reviewer 3:
1) Several studies have already used massive parallel sequencing data for the identification of heteroplasmic mutations in cancer (He et al Nature 2010) and in normal samples (Goto et al 2011; Avital et al 2012; Payne et al 2013). These studies already set the standards for such analyses, which to a large extent were overlooked in the current manuscript. As an example, the authors used a threshold of >3% of the reads to be considered as trustworthy heteroplasmic mutations but the minimum coverage that they used does not allow such a threshold (10X!). Other studies used at least 100X (a minimum) or even 1000X coverage (preferable) and a threshold of 1.5% of the reads. Apart from the threshold issue, while considering secondary reads in the mtDNA (heteroplasmy) one should apply several filters such as 'no strand bias', unique mapping (NuMT exclusion) and 'exclusion of mutations at the end of reads'. These should be used in the revised manuscript and the list of mutations should be updated accordingly. These filters are especially important, since the authors give much weight for their strand bias hypothesis and replication-associated mutations. However, nothing is mentioned as to how the authors account for strand bias (i.e. mutations present mostly in forward or reverse reads). Until they exclude sequencing artifacts, including those resulting from strand bias, they cannot interpret the data as actual biological strand bias.
2) The authors claim that their analysis was unbiased and generated a catalogue of somatic mtDNA mutations. However, they excluded all candidate somatic mutations that recapitulated known mtDNA SNPs. The exclusion of SNPs is understood while considering the nuclear genome, however unlike the nuclear DNA the mtDNA molecule is in full linkage disequilibrium. This means that in order to avoid sample contamination the authors should exclude mutations in SNP positions ONLY when they phase along with other SNP mutations to form a haplotype.
3) The functional potential of mutations is not properly analyzed: dN/dS ratio calculated for genes does not reflect the functionality of specific mutations. Some estimation could be given by manipulations of this ratio using PAML or SELECTON. However the best way to assess the functional potential of variants is a comparison to disease causing mutations.
https://doi.org/10.7554/eLife.02935.027Author response
Reviewer 1:
1) Is the generated sequence data accessible through a public repository such as GEO? Are database accession numbers provided somewhere in the manuscript.
We have submitted our sequencing data to EBI. Corresponding accession numbers are available at Supplementary file 1. It may be finally updated after acceptance.
2) Figure 3–figure supplement 1 is an example of possible artifacts in the authors' results/interpretation. This figure compares the substitution rates between 12 coding genes on heavy strand vs 1 on light strand, but information on how the graph was generated for the 12 genes cannot be found. Does the graph show the sum or average of observed substitution rates? If it is based on average rates, should there not be error bars or p-values from t-tests. Also, why are the 12 genes shown for the L strand, and the 1 gene as the H strand?
We have updated our manuscript. In Materials and methods, section “Mutational signature and strand bias”, we describe how we calculated the substitution rates in more detail. In addition, we addressed chi-square tests to quantify the extent of difference in mutational signatures (Figure legends for Figure 3–figure supplement 1). Of the 13 protein-coding genes in mtDNA, we obtained their strands from human reference mtDNA sequence (rCRS). Notably, only 1 gene (MT-ND6) has its coding sequence on the H strand.
3) In Figure 4, what are the authors trying to demonstrate with Figure 4A? What do arrows beside the “box” indicate? What do the different colors of the arrow (blue and red) mean? Why is the “box” designed for the light strand sequence when it has only 1 out of 13 protein-coding genes? What does skew mean here?
This figure explains how the somatic mutational signature is identical or very similar to the germline one, observed across evolutionary time. From this, we conclude the mutational processes that shaped human mitochondria over time generate de novo mtDNA mutations in somatic tissues. Thus, the germline signature of human mtDNA can be inferred from codon usage biases (T>C skew and G>A skew; Materials and methods, “mtDNA codon usage”), which present T>C and G>A (L strand manner) exactly as observed in somatic substitutions. The arrows beside the box highlight the T>C (red) and G>A (blue) substitutional pressures in germline mtDNA. We have updated these in the figure legends of Figure 4A. The numbers in the box are based on 12 “L strand genes (genetic codes on the L strand, or transcribed from the H strand)”, not from 1 “H strand gene”.
Reviewer 2:
1) Do the authors observe differences between tumor types in terms of the relative proportion of negatively selected somatic mutations that are hetero- vs. homoplasmic? This may indicate differential (negative) selective pressures in different tumor types (e.g. negative selection could be less pronounced in tumors with a low rate of oxidative phosphorylation).
This is an interesting suggestion. Using 166 protein-truncating mutations, we tested the difference in variant allele fractions across tumor types. We have shown our results in the Figure 5–figure supplement 2 and have updated our manuscript accordingly. Interestingly, colorectal cancers show less extent of such constraints on mtDNA protein-truncating mutations.
Amended to: The extent of such disadvantage may vary according to tumor type: for example colorectal cancers show less negative selection compared to breast cancers (p=0.028; Figure 5–figure supplement 2).
2) The authors suggest that the major explanation for lack of visible exogenous mutation signatures (i.e. such related to tobacco smoke or UV light exposure) is that the endogenous mutation rate in mitochondria is several orders of magnitude greater than the exogenous mutation rate. Can the authors, based on the rate of nuclear genome somatic mutations in tumors with pronounced exogenous mutation signatures (i.e. using data from earlier works by the authors) provide an estimate for the relative difference in endogeneous vs. exogeneous mutation rate?
We tried to estimate the impact of ultraviolet light (UV) and tobacco smoking in the somatic mtDNA mutations as the reviewer suggested. We did not find any evidence that there were any mutations that could be unambiguously attributed to these mutational processes. We have added Figure 5–figure supplement 3 to summarize our estimates. Thus, it is impossible to estimate the relative difference between endogenous and exogenous mutation rates. Potentially, with larger sample sizes of these tumour types, this will be feasible.
According to the mutational signatures in the nuclear genomes reported by Alexandrov et al., (2013), UV and tobacco smoking are the most important exogenous mutagens. The mutational signatures of UV and tobacco smoking are C>T substitution at a dipyrimidine context and C>A substitution, respectively.
1) UV:
From 26 samples of melanoma, of which the UV mutational signature is found in each sample and accounts for >90% of somatic mutation in each nuclear genomes, we found 15 C>T (or G>A) mtDNA mutations. Of these, 12 (80%) were at dipyrimidine contexts. As controls, breast cancers mostly free from UV, we found 289 C>T (or G>A) substitution, and 227 (78.5%) were from dipyrimidine context. Because the proportions of C>T at dipyrimidine context are the same (chi-square test p=0.54) between melanomas and breast cancers, it is highly unlikely that the UV signature generates the mtDNA mutations even in the melanoma samples.
2) Tobacco smoking:
Tobacco signature is dominant in lung cancer nuclear genomes (61% for lung adenocarcinoma; 93% for small cell lung cancer; 45% for squamous cell carcinoma). In contrast, the mutational signature of tobacco smoking has not been previously found in breast cancer nuclear genomes (Alexandrov et al., Nature 2013). Of the 83 mtDNA somatic mutations in lung cancers, 3.6% (n=3) are C>A (or G>T) substitutions. From breast cancers, 4.7% of somatic mtDNA substitutions are C>A (or G>T) mutations. Because we cannot identify any C>A substitution enrichment in lung cancers, the impact of tobacco smoking is also minimal, approximately 0%.
Reviewer 3:
1) Several studies have already used massive parallel sequencing data for the identification of heteroplasmic mutations in cancer (He et al Nature 2010) and in normal samples (Goto et al 2011; Avital et al 2012; Payne et al 2013). These studies already set the standards for such analyses, which to a large extent were overlooked in the current manuscript. As an example, the authors used a threshold of >3% of the reads to be considered as trustworthy heteroplasmic mutations but the minimum coverage that they used does not allow such a threshold (10X!). Other studies used at least 100X (a minimum) or even 1000X coverage (preferable) and a threshold of 1.5% of the reads.
The threshold (“10x”) mentioned by the reviewer is not for “mtDNA somatic mutations” but for “autosomal SNPs” to assess “minor cross-contamination levels” (see Materials and methods, “DNA cross-contamination” section). As we described in the manuscript, average read-depths for mitochondrial DNA from WGS and WXS are 7,901x and 92x. For 1,907 somatic polymorphisms, the average and median read-depths are 4,560x and 419x, respectively. Our findings are based on “high-coverage mtDNA sequencing” like the previous studies the reviewer mentioned. It is worthy of note that WES is not as sensitive as WGS for mtDNA somatic mutations, but is sufficiently sensitive (71.4%) to provide useful information. With respect to the threshold (>3%), we decided to be more conservative compared to previous studies (1.5%), because copy number amplifications are very frequent in cancer cells, thus the influence of NuMTs in this study could be higher than previous studies from normal samples. Finally, we would like to emphasize that the major conclusions of the manuscript (the mutational signature and strand bias in mtDNA, and the lack of positive selection on mutations) are independent of the thresholds used.
Apart from the threshold issue, while considering secondary reads in the mtDNA (heteroplasmy) one should apply several filters such as 'no strand bias', unique mapping (NuMT exclusion) and 'exclusion of mutations at the end of reads'. These should be used in the revised manuscript and the list of mutations should be updated accordingly. These filters are especially important, since the authors give much weight for their strand bias hypothesis and replication-associated mutations. However, nothing is mentioned as to how the authors account for strand bias (i.e. mutations present mostly in forward or reverse reads). Until they exclude sequencing artifacts, including those resulting from strand bias, they cannot interpret the data as actual biological strand bias.
Most of the filters suggested by the reviewer were already applied in the original manuscript. Most importantly, we used the “strand-filter” (see Materials and methods, “Variant calling” section (strand-filter 1) and Supplementary Table 2). Therefore, we are very confident that the strand bias which is observed in the somatic substitutions is not an artifact from detection, or “mutations present mostly in forward OR reverse reads”. Additionally, we used only uniquely mapped reads in the mutation calling algorithm. We also note that the alignment algorithm simultaneously maps against the nuclear and mitochondrial genomes, so that reads from the NuMT regions will map to the nucleus, and not be included in the analysis presented here. We did not apply a “read-end filter”. To evaluate whether this would have had an impact, we checked 130 randomly selected mtDNA mutations. Only 2 were called as mutations based on mismatches at the end of reads only (<4bp from read-end); this is no more than what we would have expected by chance, so we believe the read-end issue to be negligible.
2) The authors claim that their analysis was unbiased and generated a catalogue of somatic mtDNA mutations. However, they excluded all candidate somatic mutations that recapitulated known mtDNA SNPs. The exclusion of SNPs is understood while considering the nuclear genome, however unlike the nuclear DNA the mtDNA molecule is in full linkage disequilibrium. This means that in order to avoid sample contamination the authors should exclude mutations in SNP positions ONLY when they phase along with other SNP mutations to form a haplotype.
We did not exclude candidate somatic mutations which overlap with known mtDNA SNPs; instead our algorithm uses sequencing from the matched normal sample to exclude germline polymorphisms. For example, in our main manuscript, we state “Of these 1,907 somatic substitutions, 1,385 (72.6%) were not registered in the database of mtDNA common polymorphism (mtDB)”. Thus, 27.4% of our mutations do overlap with previously known germline polymorphisms. Instead, we removed entire samples from the analysis when more than 3 of their somatic SNP candidates overlapped with known polymorphisms because such samples would be suggestive of cross-contamination with another sample, and lead to false mutation calls (see Materials and methods, Variant calling section, (3) Germline polymorphisms and back mutations). We would like to disclose that 66 samples (3.6%) were removed for this cross-contamination, out of the 1,848 samples initially enrolled in this study.
3) The functional potential of mutations is not properly analyzed: dN/dS ratio calculated for genes does not reflect the functionality of specific mutations. Some estimation could be given by manipulations of this ratio using PAML or SELECTON. However the best way to assess the functional potential of variants is a comparison to disease causing mutations.
We compared our mutation list with known disease-causing mtDNA mutations as the reviewer suggested. The results can be found in the Supplementary file 2. In addition, mutations more recurrent than expected are shown in Supplementary file 5. We have updated our manuscript accordingly.
Next, we assessed whether any specific somatic mutations showed evidence of positive selection. Out of the 1,907 somatic substitutions, 16 (0.8%) overlapped with known disease-associated mtDNA mutations, such as mutations frequently detected in MELAS (Mitochondrial Encephalomyopathy, lactic acidosis, and stroke-like episodes) and LHON (Leber hereditary optic neuropathy) (Supplementary file 2). In addition, ten mutations within mitochondrial protein-coding, tRNA and rRNA genes showed significantly higher recurrent rate than expected from background mutational signature (Supplementary file 5). However, it remains unclear whether this high recurrence reflects positive selection, because any factors not included in our background model of the mutational process, such as local mutation hotspots, could also explain a mild excess of mutations at a given nucleotide.
However, we still think our approaches are appropriate. Below are our responses to the reviewer’s concerns.
Point 1: The fraction of passenger mutations can be estimated from global dN/dS ratios
With respect to dN/dS ratio in detection of cancer genes, we have already shown that dN/dS measured at gene level is a powerful approach to identify driver genes (e.g. see Behjati et al, 2014 -PMID:24633157-, Bolli et al, 2014 -PMID:24429703- and Wong et al, 2014 -PMID: 24316979-). Of course, very subtle signals of selection, with infrequent positive selection acting at a single site, may escape this approach when applied to small datasets and a site-specific or codon-specific approach may be more powerful (see below).
Regarding our claim that most mutations are likely passenger events, we would like to highlight that the fraction of passenger mutations can indeed be estimated from gene or genome-level dN/dS ratios as long as negative selection is sufficiently weak. Here we have shown that, at least missense mutations seem to accumulate largely neutrally (see Figure 5A). Assuming that negative selection is absent, the fraction of driver mutations can be estimated using (w-1)/w, where w is the dN/dS ratio. This was explained in [Greenman C., et al. 2006]. If negative selection is stronger, this approach will provide an underestimation of the fraction of driver mutations.
Point 2: Use of PAML
We thank the referee for this interesting suggestion. We indeed considered and tried PAML. However, the assumptions of PAML are severely violated by this dataset leading to gross inaccuracies in the estimation of dN/dS. Critical assumptions that are violated are the simplistic mutation model (with a single rate parameter, the transition/transversion ratio), the assumption of strand symmetry (both strands mutate at very different rates), the reversibility of the mutation model (here we have an ancestral and a derived sequence, rather than two derived sequences) and potentially the stationarity of the sequence composition. To quantify the impact of these violations, we have performed simulations of neutral (randomly occurring) substitutions along the mitochondrial genome using the mutation spectrum described here (see Figure 3A or Author response image 1 below). In particular, we simulated 600 random mutations per genome, allowing for multiple mutations occurring in the same site (which is a much higher density of mutations than we observe, and so situation is more favourable for PAML than for our Poisson-based method).
Author response image 1

Somatic mutational signature of mitochondrial DNA
The resulting dN/dS estimates from 100 simulations are shown in Author response image 2 below. This clearly shows that the simplistic mutation model used in PAML leads to severe and systematic inaccuracies in dN/dS (3rd box plot). A similar bias is seen in the traditional Nei-Gojobori model (Nei & Gojobori, 1986) (4th box plot). In contrast, accounting for the different rates of each trinucleotide and for the extreme strand asymmetry in mitochondrial mutations, our model leads to unbiased dN/dS estimates.
Author response image 2
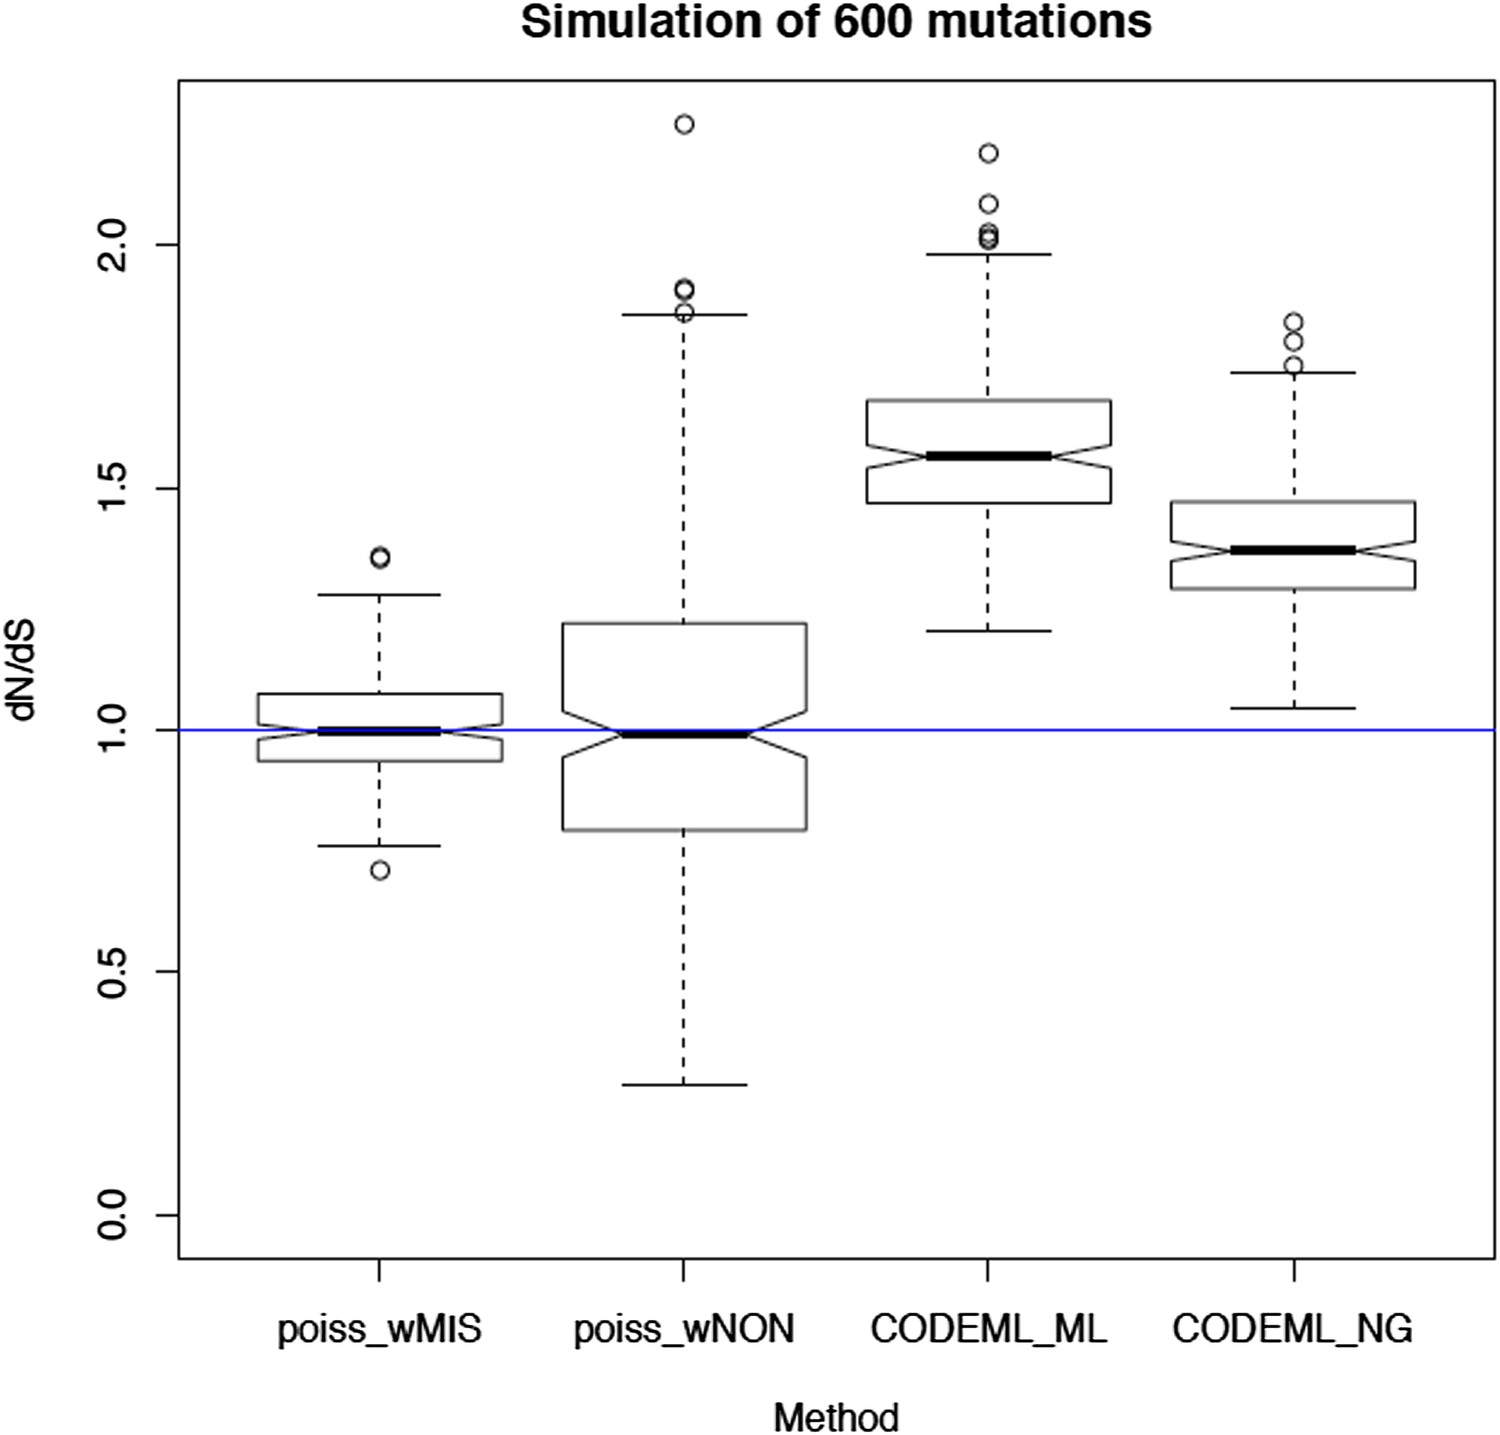
dN/dS ratio with 600 somatic substitutions randomly generated
Also, note that PAML cannot provide a dNon/dS ratio for nonsense mutation (nonsense mutations are excluded and a 61x61 codon substitution matrix is used).
Point 3: Selection at single-site level
Based on the simulations above, it is clear that PAML is not well suited to analyse this data reliably. The identification of highly recurrent sites within a protein should ideally take into consideration the exact sequence context of each site and the different mutation rates of each trinucleotide.
To address the referee's comments, we have extended our dN/dS approach to detect selection at single sites. Assuming a constant mutation spectrum across genes, we can test whether the level of site recurrence observed at each site violates the expected number of mutations given the local trinucleotide. A P-value can be computed for each site of a gene or a genome using a cumulative Poisson distribution (with lambda being the rate of the local trinucleotide), then correcting for multiple testing appropriately. This approach, which yields a p-value per site, is thus different from the Bayesian approach in PAML, being more similar to the method by Massingham and Goldman (2005, PMID: 15654091). Also note that this approach can be applied to non-coding sites as well as coding sites as it does not rely on a codon substitution matrix.
This analysis applied to our dataset revealed 10 sites within 37 mitochondrial genes (coding and non-coding) with a higher number of mutations than expected by neutral evolution assuming a constant mutation spectrum along the genome (shown in Supplementary file 4). It is, however, unclear whether the higher recurrence than expected reflects positive selection. Potential factors not considered in our statistical model, such as local mutation hotspots, may also explain these recurrences. It is worth noting that four of the recurrent sites are either synonymous or non-protein coding substitutions where positive selection is highly unlikely.
The analyses in this study suggest that most mutations in mitochondria are passenger events. We also did not find convincing evidence of driver events in any mitochondrial genes, using methods that have succeeded in finding known and novel cancer nuclear genes (see Behjati et al, 2014 -PMID:24633157-, Bolli et al, 2014 -PMID:24429703- and Wong et al, 2014 -PMID: 24316979-).
However, this does not rule out the possibility that a small fraction of mutations may be positively selected, too infrequently to be detected in the current dataset. We, however, found a list of recurrent hotspots whose origin and impact is unclear, that deserve further investigation.
https://doi.org/10.7554/eLife.02935.028Download links
A two-part list of links to download the article, or parts of the article, in various formats.
Downloads (link to download the article as PDF)
Open citations (links to open the citations from this article in various online reference manager services)
Cite this article (links to download the citations from this article in formats compatible with various reference manager tools)
Origins and functional consequences of somatic mitochondrial DNA mutations in human cancer
eLife 3:e02935.
https://doi.org/10.7554/eLife.02935


