Structural basis of pathogen recognition by an integrated HMA domain in a plant NLR immune receptor
- John Innes Centre, United Kingdom
- Iwate Biotechnology Research Center, Japan
- The Sainsbury Laboratory, United Kingdom
Figures
Figure 1
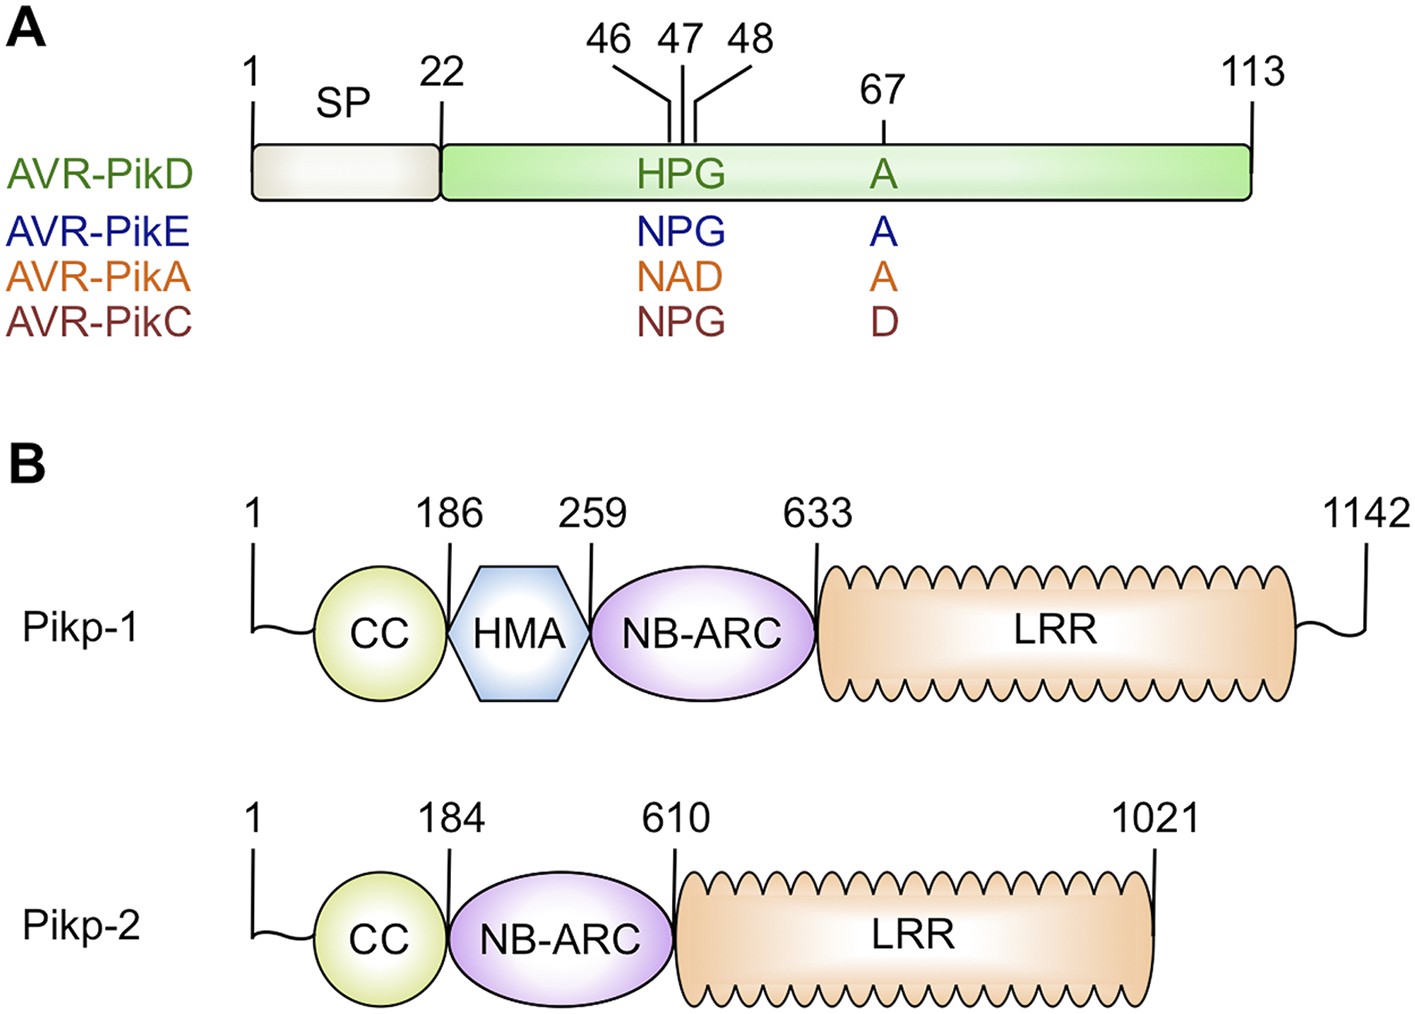
Schematic representations of (A) Magnaporthe oryzae AVR-Pik effector alleles with position of polymorphic residues shown, the effector domain is shown in green with the signal peptide (SP) in grey (amino acids are denoted by their single letter codes), (B) Rice Pik resistance proteins, highlighting the position of integrated HMA domain in the classical plant NLR architecture of Pik-1 (CC = coiled coil, HMA—Heavy Metal Associated domain, NB-ARC = Nucleotide-binding Apaf-1, R-protein, CED4-shared domain, LRR = Leucine Rich Repeat domain), domain boundaries are numbered, based on the Pikp sequences.
https://doi.org/10.7554/eLife.08709.003
Figure 2 with 4 supplements

AVR-Pik effector alleles interact with the Pikp-HMA domain with different affinities.
(A) Y2H assays showing the binding of effector alleles to the Pikp-HMA using two read-outs, growth on–Leu-Trp-His+3AT (-LTH) plates and the X-gal assay. (B) Analytical Gel Filtration traces depicting the retention volume of Pikp-HMA, AVR-PikD and the complex, with SDS-PAGE gels of relevant fractions (similar results were obtained for AVR-PikE and AVR-PikA, but AVR-PikC did not bind [Figure 2—figure supplement 3]). (C) Binding curves derived from Surface Plasmon Resonance multi-cycle kinetics data for Pikp-HMA binding to AVR-Pik alleles, Kd values are shown (NB = No Binding). The sensorgrams of the data used to derive these curves are shown in Figure 2—figure supplement 4.
Figure 2—figure supplement 1
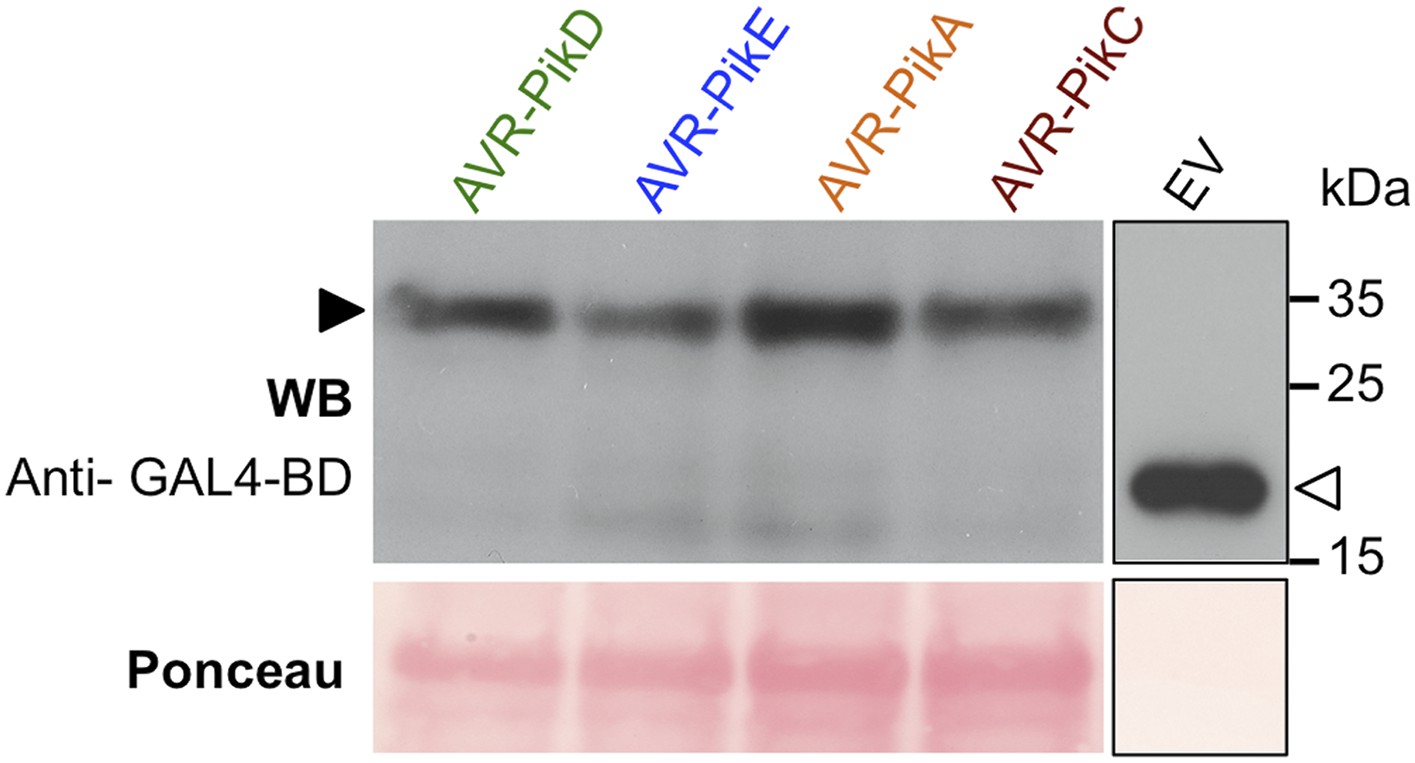
Confirmation of protein expression in yeast.
Western blot demonstrating the expression of AVR-Pik alleles in yeast. The expected size of the AVR-Pik/GAL4-BD is 30 kDa, the GAL4-BD alone is 19 kDa. Ponceau staining confirms equivalent protein loading. The empty vector is presented on a separate image (boxed) as we found the expression of this domain alone was much greater than when fused to the effectors, and it was necessary to load 40-fold less protein so as not to overload the signal. Ponceau staining of the membrane was used to confirm protein loading.
Figure 2—figure supplement 2
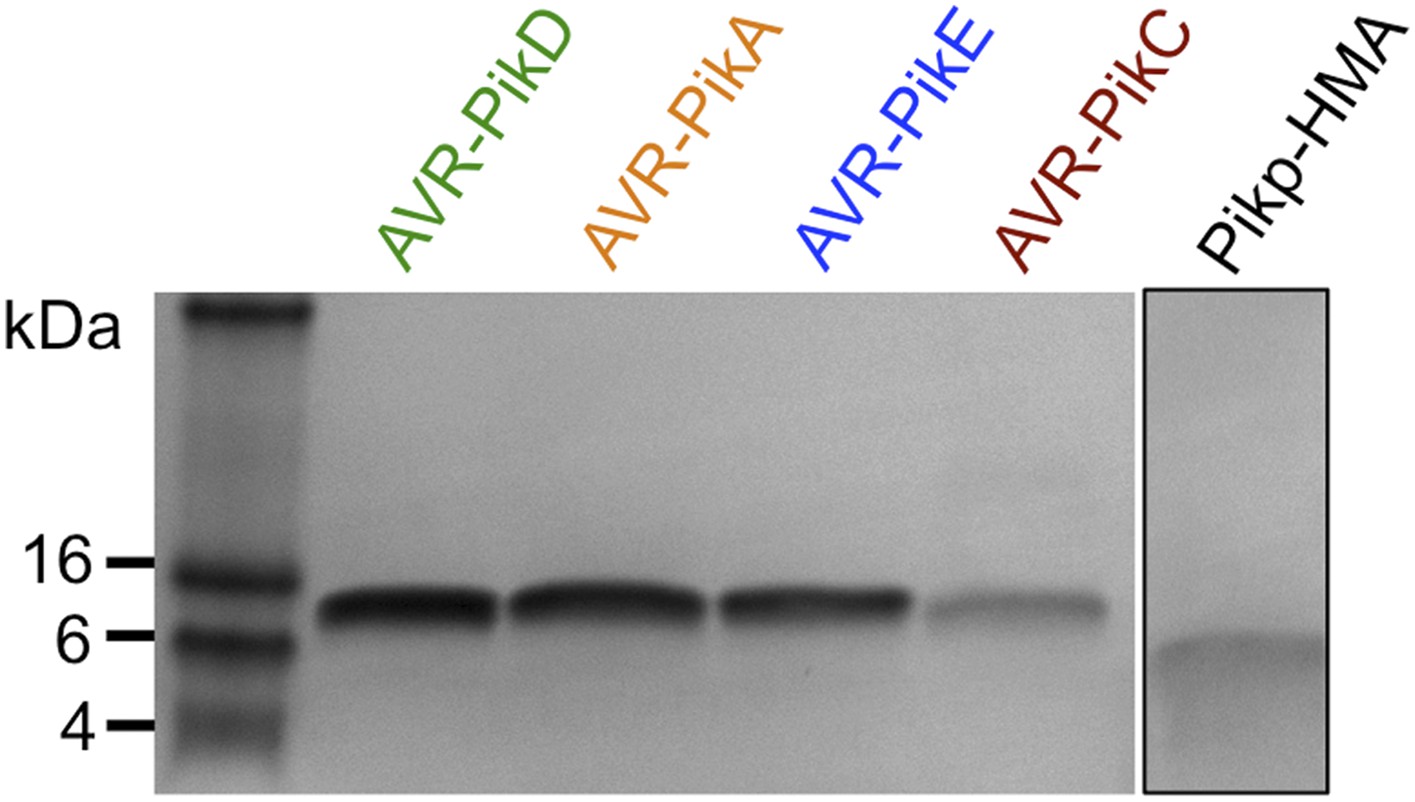
SDS-PAGE gels of purified proteins.
AVR-Pik effector alleles, as labelled, and Pikp1-HMA domain. The Pikp-HMA domain was run on a separate gel to the effectors and is boxed to indicate this.
Figure 2—figure supplement 3
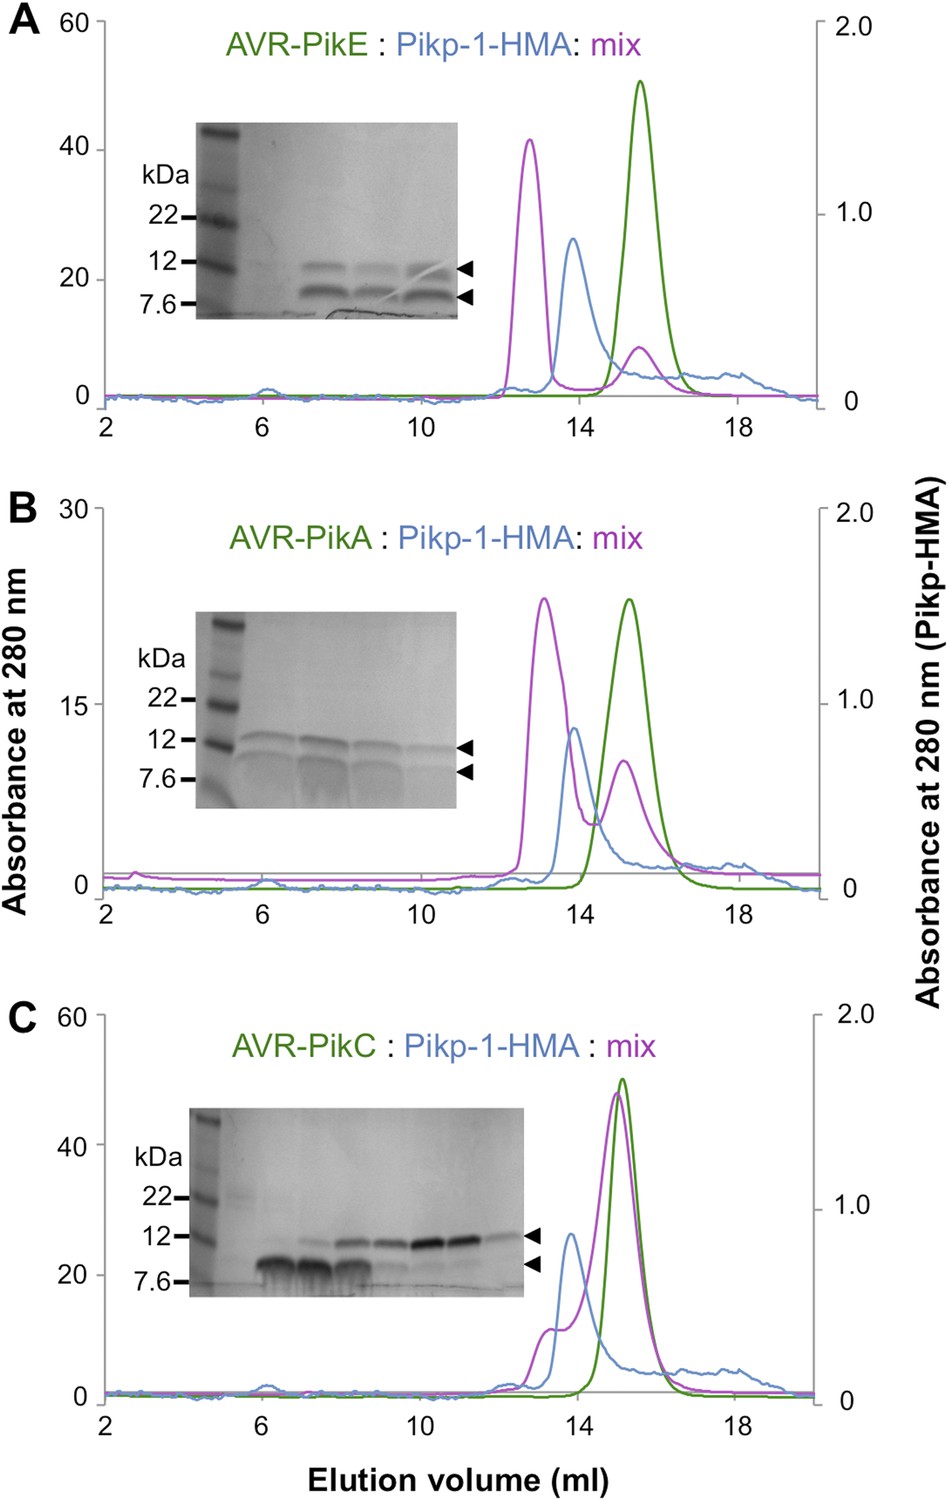
Analytical gel filtration.
Analytical gel filtration traces depicting the retention volume of AVR-PikE, AVR-PikA, AVR-PikC and Pikp-HMA individually and when effector and HMA are mixed ((A), (B) and (C) respectively). SDS-PAGE gels of the relevant fractions from the elution traces of the effector:Pikp-HMA are also shown.
Figure 2—figure supplement 4

SPR sensorgrams.
Multi-cycle kinetics data for the interaction of Pikp-HMA (analyte) with effectors (A) AVR-PikD, (B) AVR-PikE, (C) AVR-PikA, (D) AVR-PikC. This data was used to generate the binding curves shown in Figure 2C. Response units for each labelled protein concentration during the run are shown.
Figure 3 with 4 supplements

Structure of the AVR-PikD/Pikp-HMA complex.
(A) Schematic representation of the AVR-PikD/Pikp-HMA(monomer), highlighting interfacing residues. The effector is shown in green cartoon, with side chains as sticks and green carbon atoms (no surface). The Pikp-HMA is shown in blue cartoon, with side chains as sticks and blue carbon atoms; the molecular surface of this protein is also depicted. Effector residues selected for mutation are labelled, as are important interface residues of Pikp-HMA discussed in the text. Hydrogen bonds/salt-bridges are shown as dashed lines and the di-sulphide bond as yellow bars. (B) Buried surface areas of AVR-PikD (left, purple) and Pikp-HMA (right, brown) separated and shown from the perspective of the partner molecule. Cartoon and amino acid side chains shown are as for panel (A). (C) Comparison of the Pikp-HMA (monomer, blue) with yeast Ccc2A (wheat) showing the conservation of the HMA fold. The copper ion bound to Ccc2a is shown as a red sphere. (D) Comparison of AVR-PikD (green) and AVR-Piz-t (pink) structures showing the conservation of the β-sandwich structure, and the N-terminal extension of AVR-PikD.
Figure 3—figure supplement 1
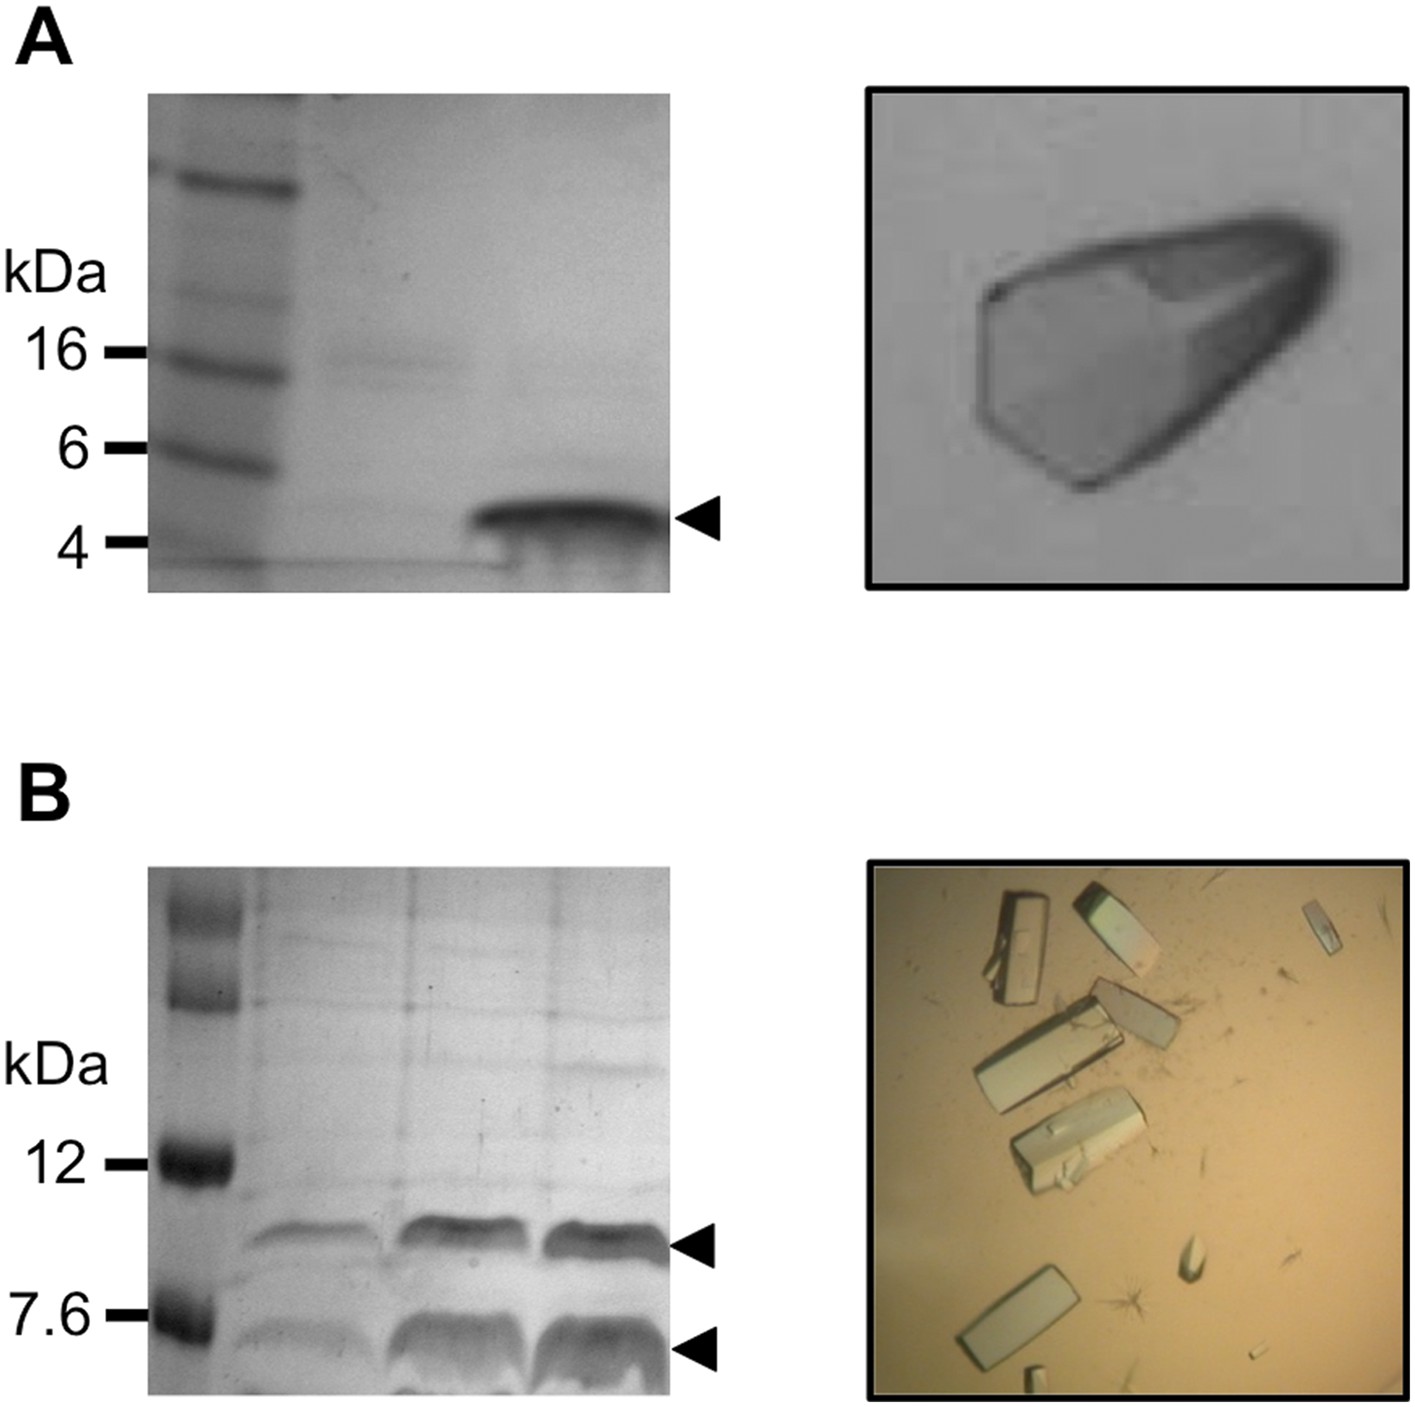
Sample preparation for x-ray data collection.
(A) Pikp-HMA, left: SDS-PAGE gel of sample used for crystallisation, right: crystal of Pikp-HMA. (B) Pikp-HMA/AVR-PikD complex, left: SDS-PAGE gel of sample used for crystallisation, right: crystals of Pikp-HMA/AVR-PikD complex.
Figure 3—figure supplement 2
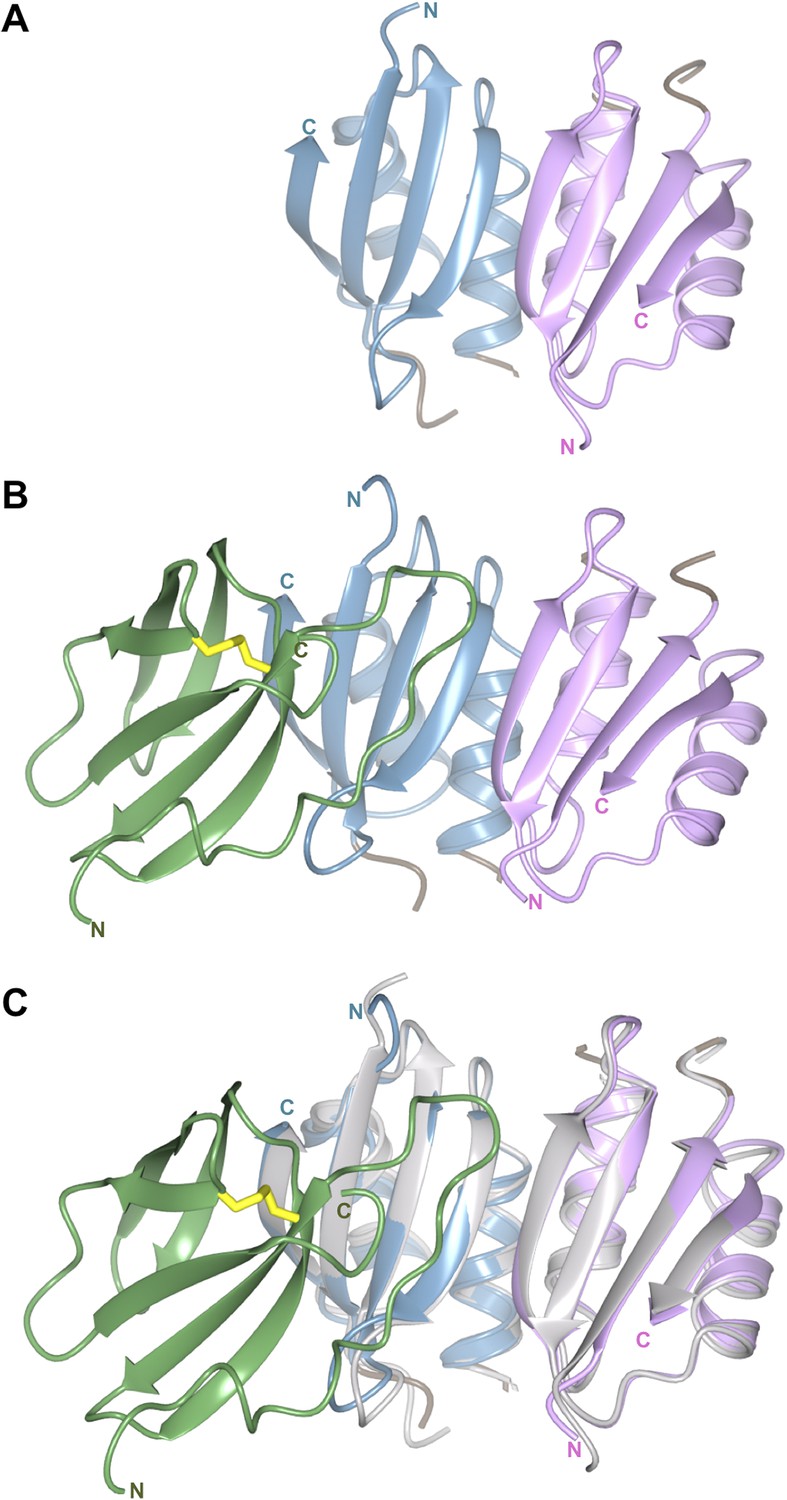
The structure of the Pikp-HMA dimer is conserved when bound to AVR-PikD.
(A) Crystal structure of the Pikp-HMA dimer, monomers are coloured blue and magenta. (B) Crystal structure of the Pikp-HMA dimer in complex with AVR-PikD, coloured as above and with the effector in green (Cys residues that form the di-sulphide bond are shown in yellow). (C) Crystal structure of the Pikp-HMA dimer in complex with AVR-PikD, with the Pikp-HMA dimer structure from ‘(A)’ overlaid, shown in grey.
Figure 3—figure supplement 3
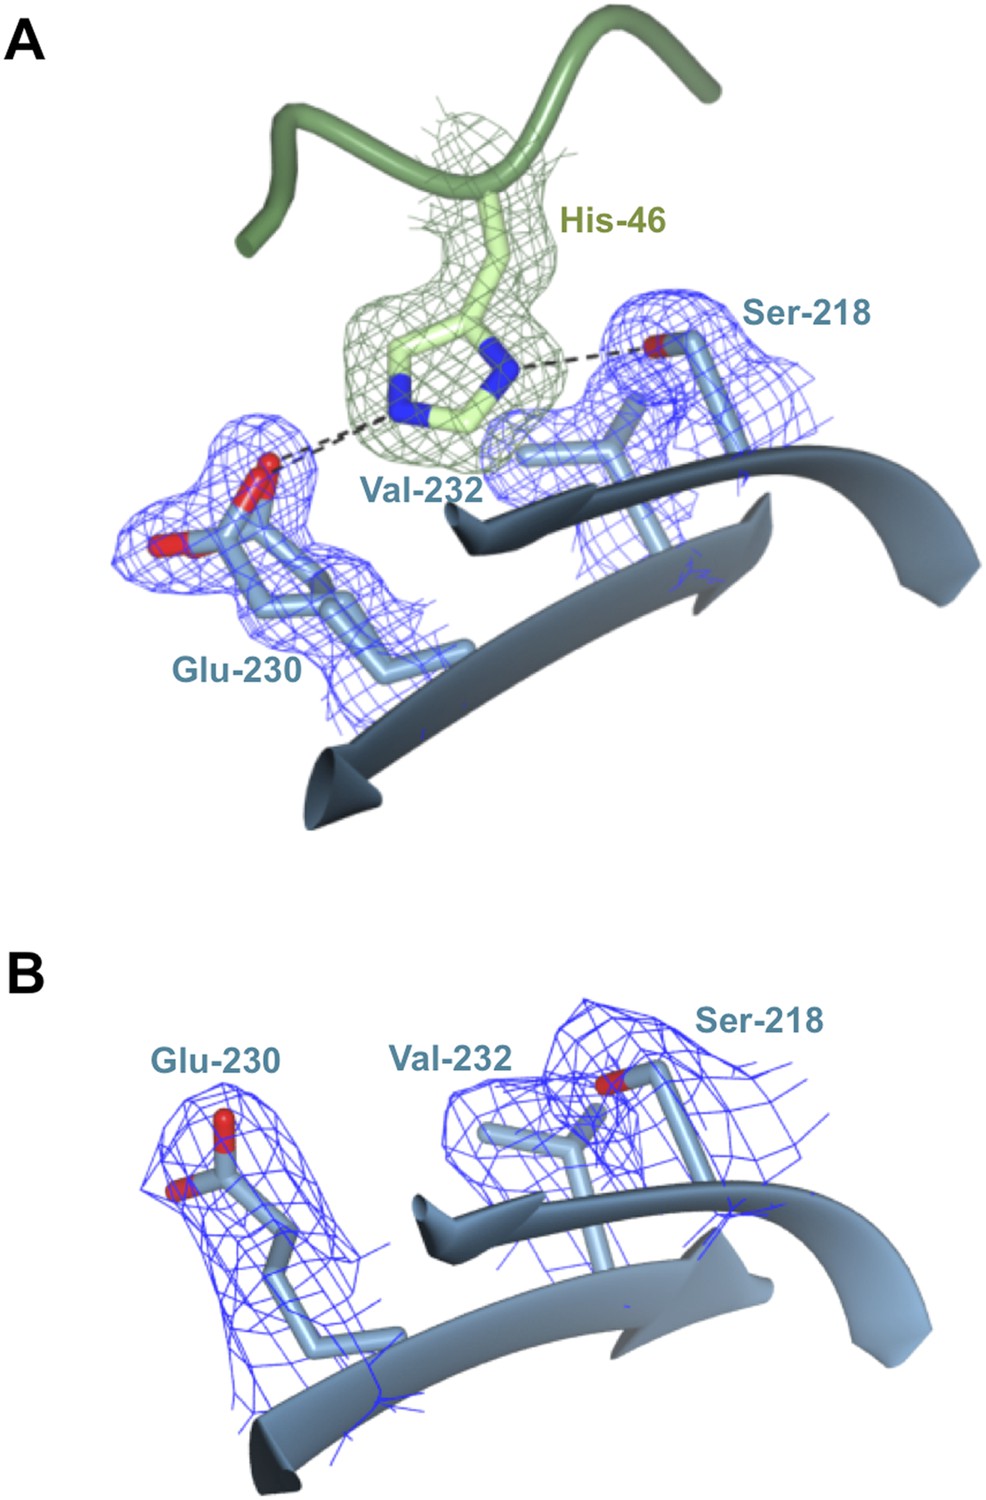
Polymorphic residue AVR-PikDHis46 is bound within a pocket on the Pikp-HMA surface.
(A) AVR-PikDHis46 interacts via hydrogen bond and salt–bridge interactions with Pikp-HMA residues Ser218 and Glu230 and van der Waals interaction with Val232. (B) Region of the Pikp-HMA structure, equivalent to that shown in (A), determined from the uncomplexed crystal structure of Pikp-HMA. In both panels, each residue is shown overlaid with the electron density describing their position (2mFobs − DFcalc contoured at 1σ).
Figure 3—figure supplement 4
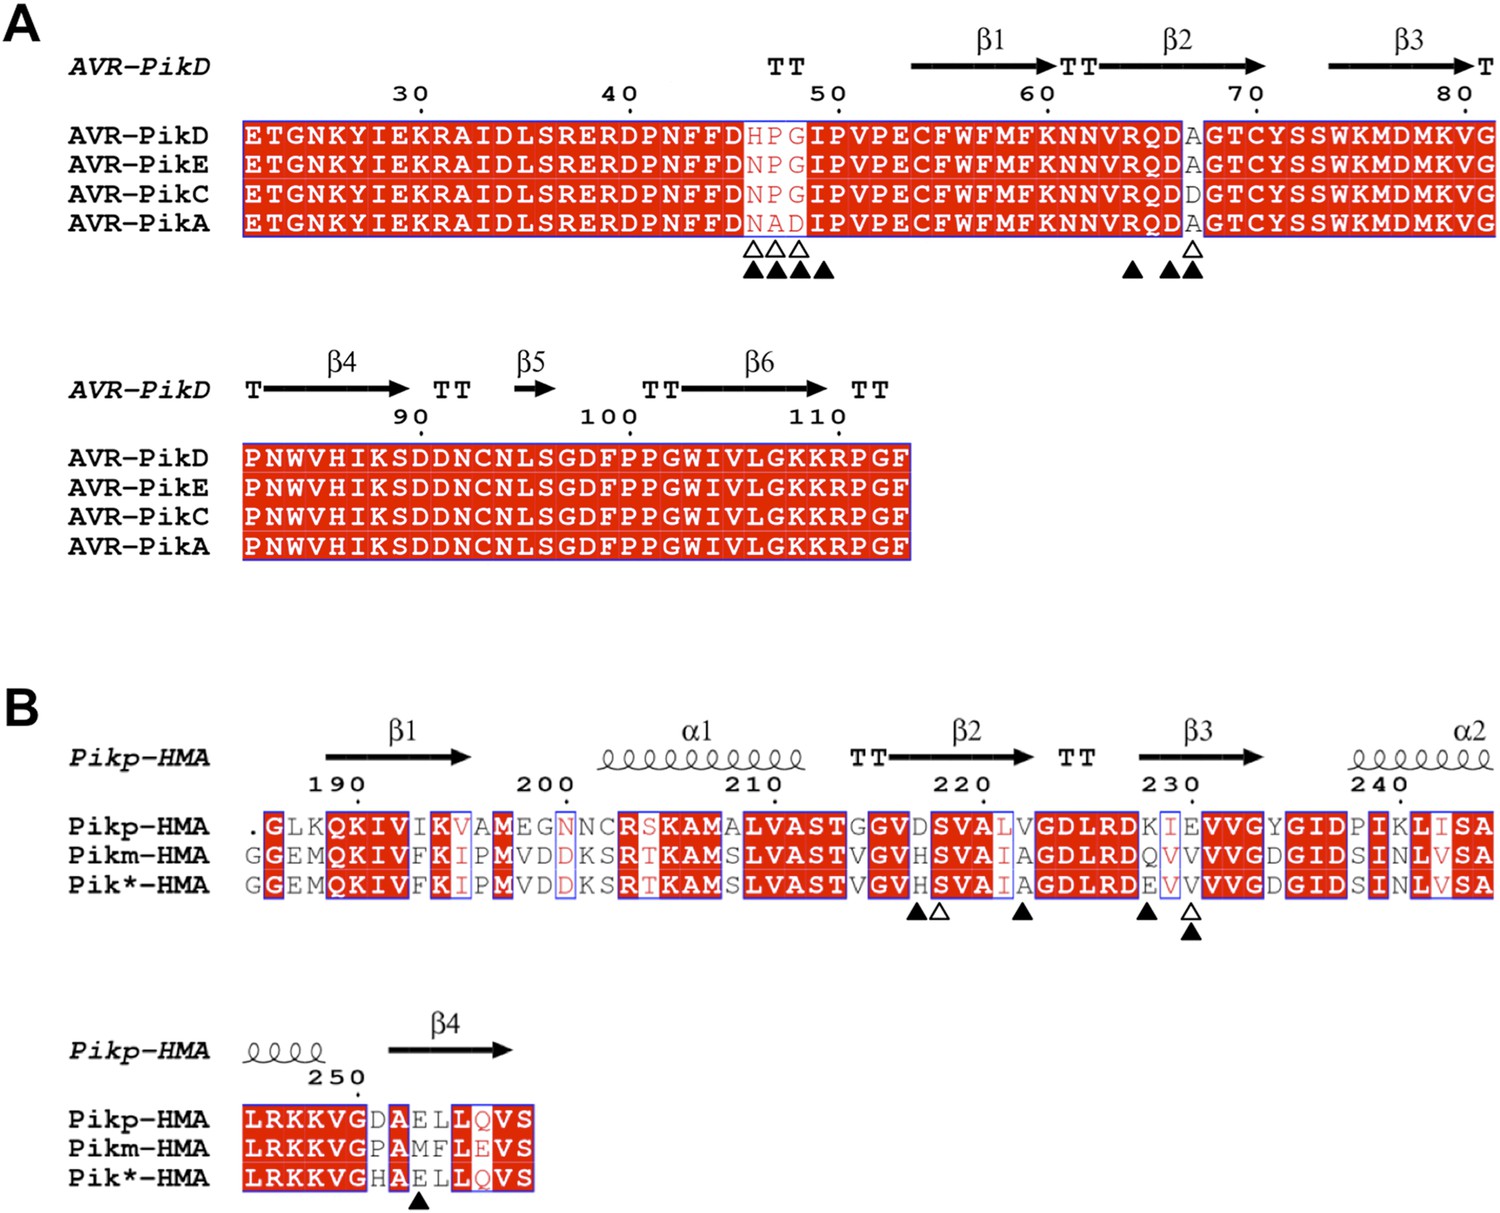
Amino acid sequence alignment of AVR-Pik alleles and Pik-HMA domains.
(A) AVR-Pik alleles. The residues that are polymorphic in AVR-Pik alleles are marked by empty triangles. The residues of AVR-PikD targeted for mutation in this study are marked with filled triangles. (B) Pik-HMAs (Pikp-HMA, Pikm-HMA and Pik*-HMA). The residues of Pikp-HMA involved in hydrogen bond interactions with AVR-PikDHis46 are marked by empty triangles. The residues of Pik-HMA domains that may contribute to recognition specificity are marked with filled triangles. The secondary structure features presented above the alignment are derived from the structures of AVR-PikD and Pikp-HMA. The alignments were performed using Clustal Omega (Sievers et al., 2011) and presented using ESPript (Robert and Gouet, 2014).
Figure 4 with 2 supplements
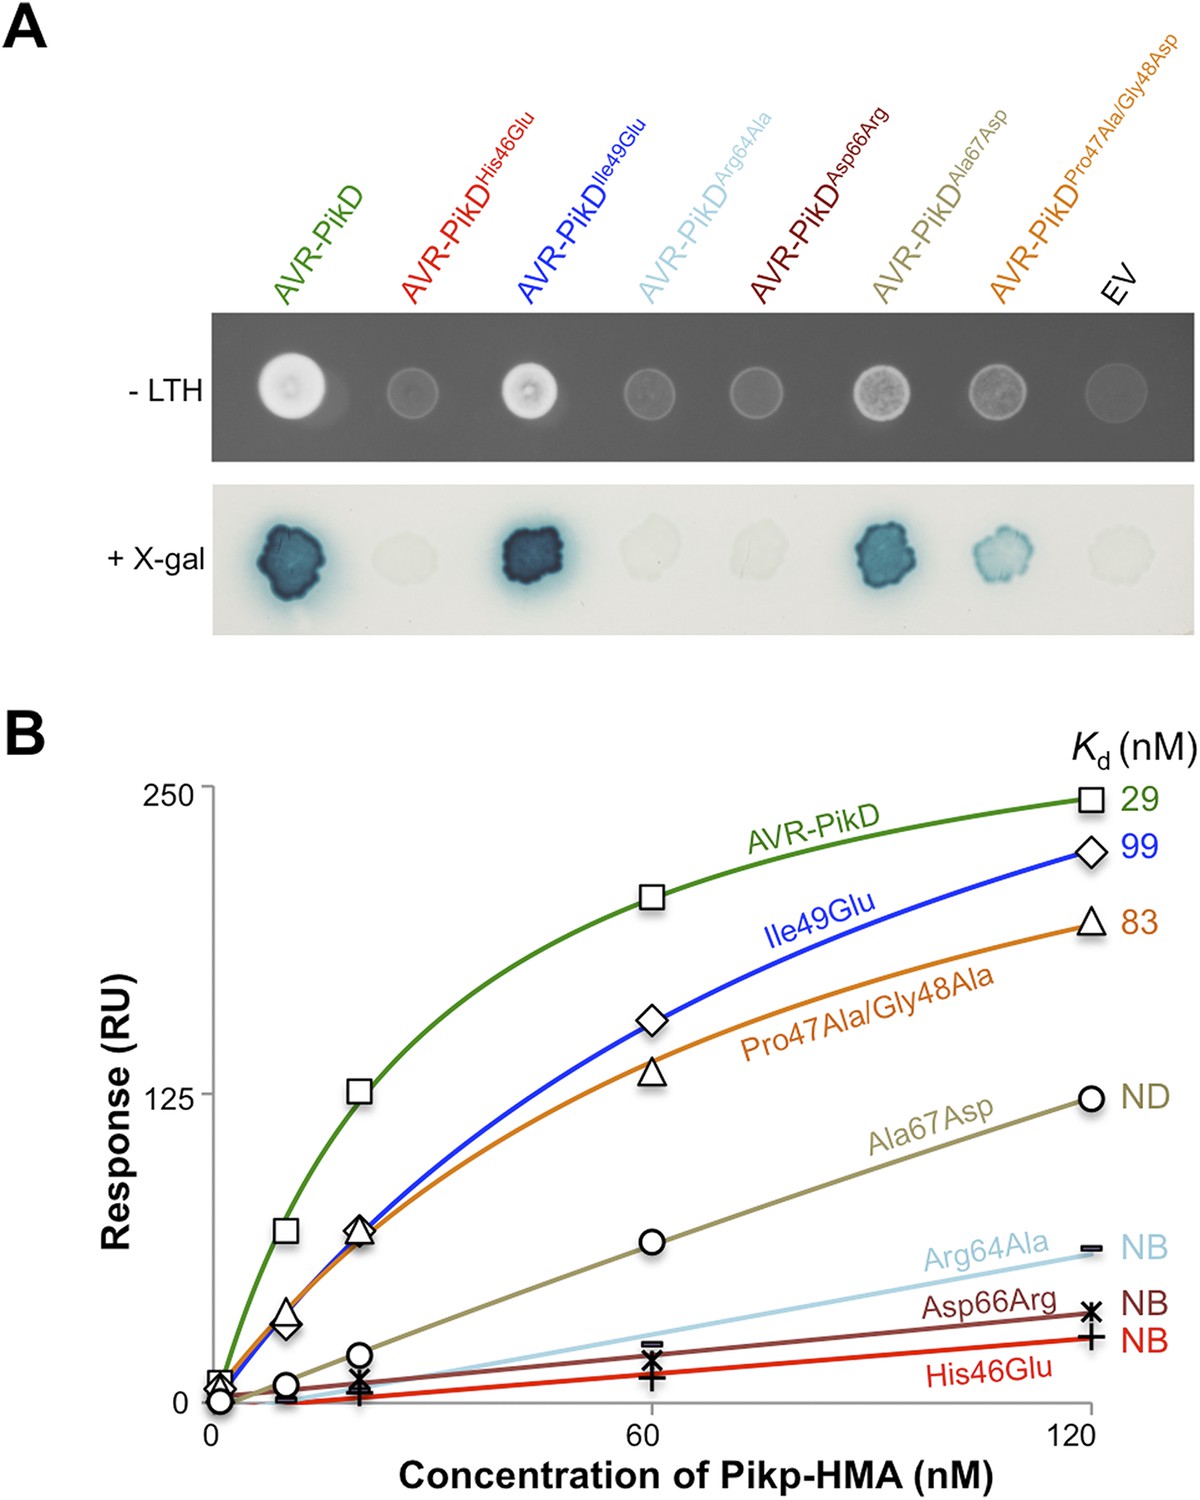
Structure-based mutagenesis at the Pikp-HMA/AVR-PikD interface perturbs protein interactions in yeast and in vitro.
(A) Y2H assays showing the binding of AVR-PikD mutants to Pikp-HMA using two read-outs, growth on–Leu-Trp-His+3AT (-LTH) plates and the X-gal assay. (B) Binding curves derived from Surface Plasmon Resonance single-cycle kinetics data for Pikp-HMA binding to AVR-PikD and AVR-PikD mutants, Kd values are shown where determined (ND = Not Determined, NB = No Binding). The sensorgrams of the data used to derive these curves are shown in Figure 4—figure supplement 2B.
Figure 4—figure supplement 1
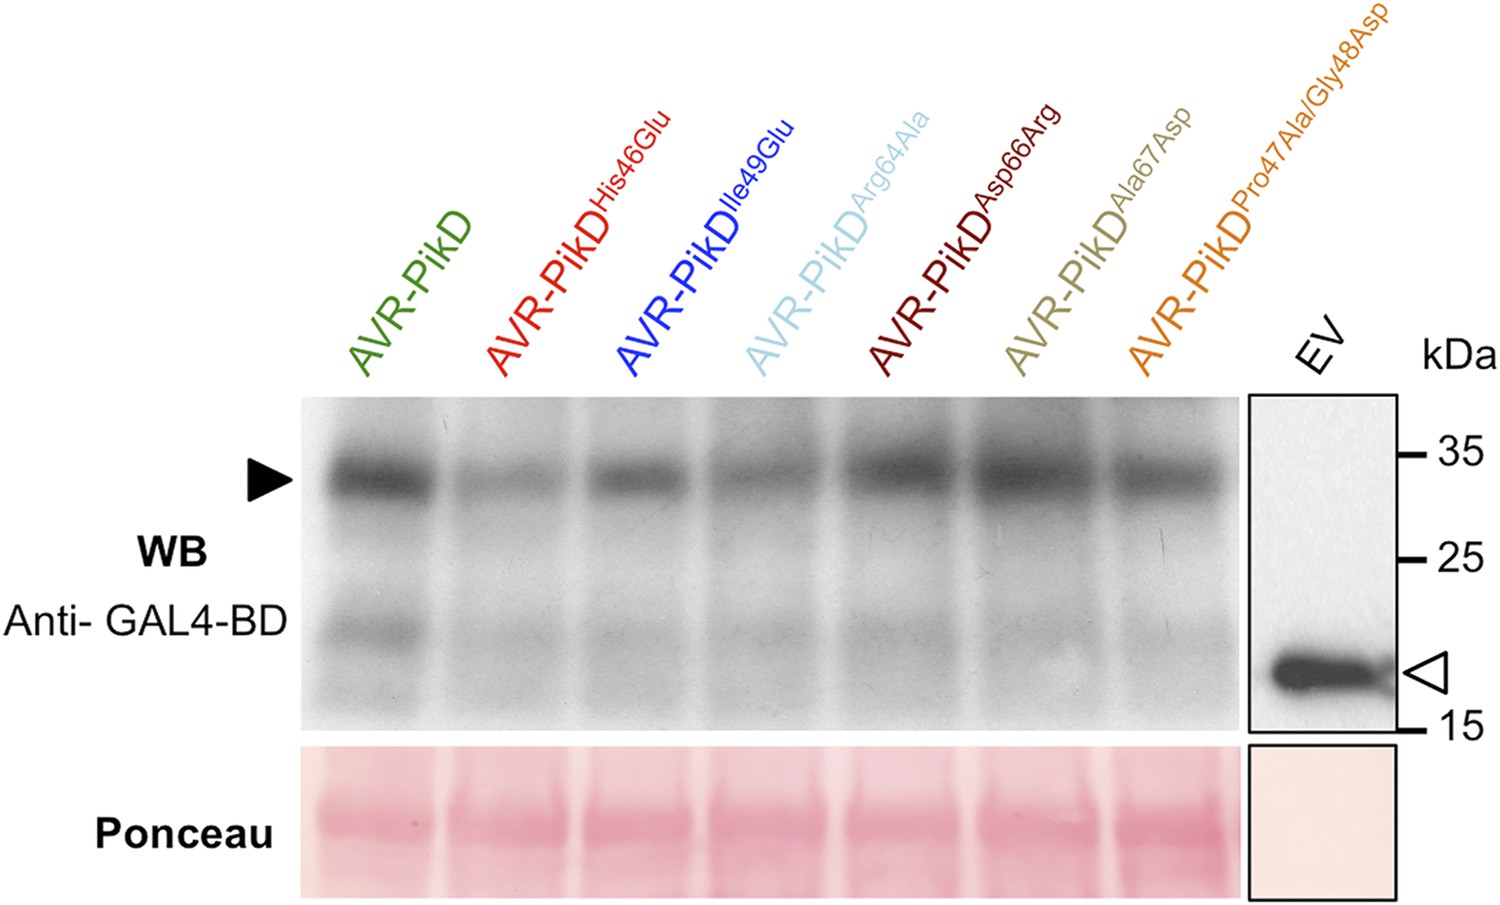
Confirmation of protein expression in yeast.
Western blot analysis demonstrating the expression of AVR-PikD and AVR-PikD mutants in yeast. The empty vector (EV) is presented on a separate image (boxed) as we found the expression of this domain alone was much greater than when fused to the effectors, and it was necessary to load 40-fold less protein to not overload the signal. Ponceau staining of the membrane was used to confirm protein loading.
Figure 4—figure supplement 2
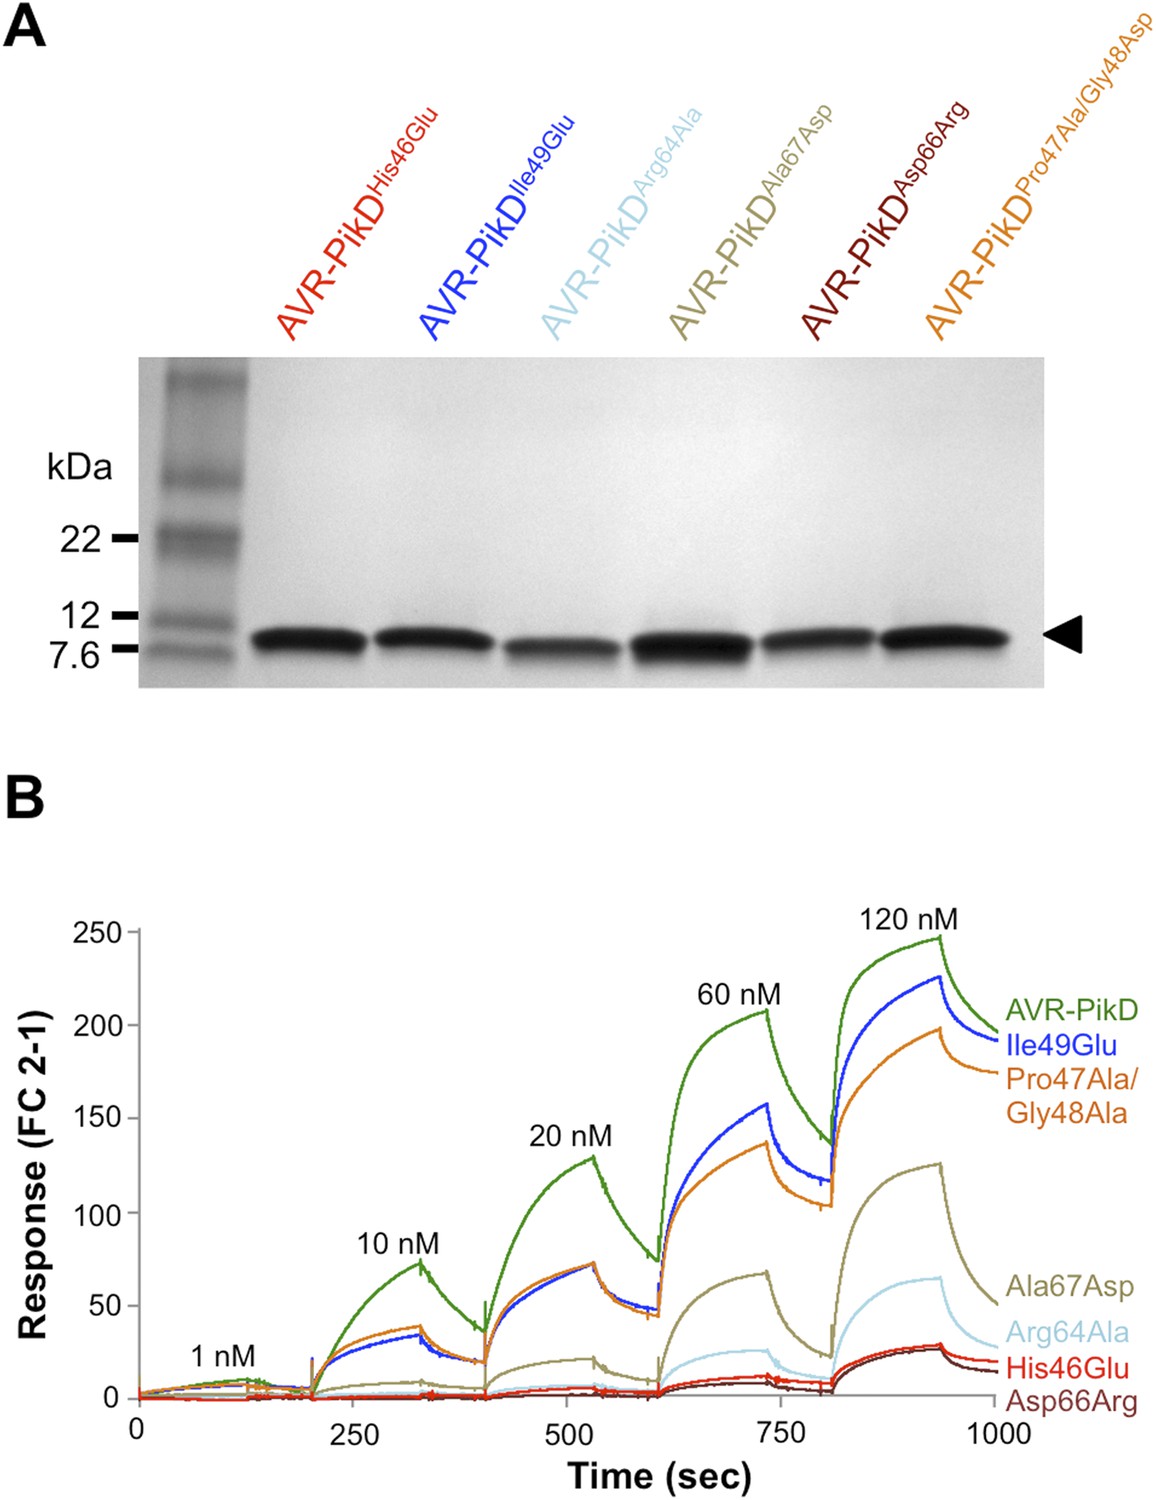
SDS-PAGE of AVR-PikD mutant proteins and SPR sensorgrams.
(A) AVR-PikD mutants prepared for SPR analysis. (B) Single-cycle kinetics data for the interaction of Pikp-HMA (analyte) with AVR-PikD mutants. This data was used to generate the binding curves shown in Figure 4B.
Figure 5 with 1 supplement
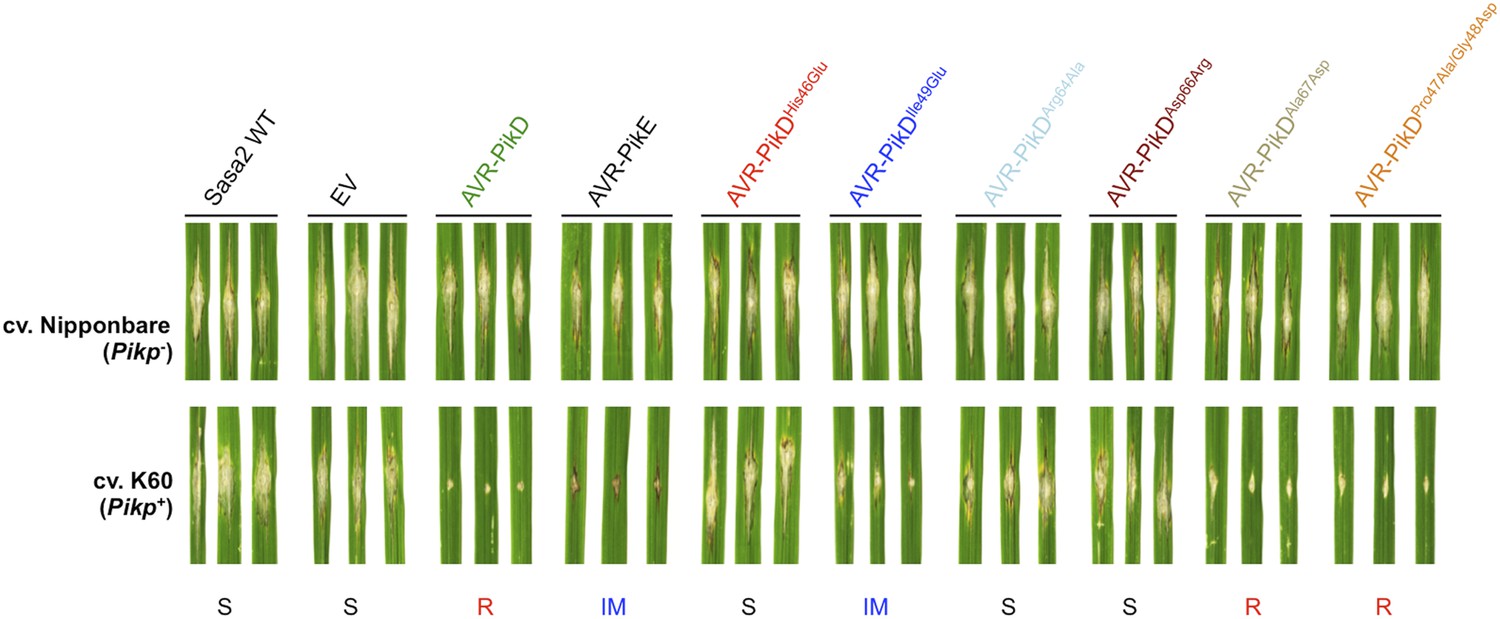
Structure-based mutagenesis at the Pikp-HMA/AVR-PikD interface leads to susceptibility in Pikp+ rice plants.
Rice plants Pik− (cv. Nipponbare) and Pikp+ (cv. K60) were spot-inoculated with M. oryzae Sasa2 expressing AVR-PikD, AVR-PikE and AVR-PikD mutants. The combinations resulting in resistant (R), intermediate (IM) and susceptible (S) phenotype are labelled.
Figure 5—figure supplement 1
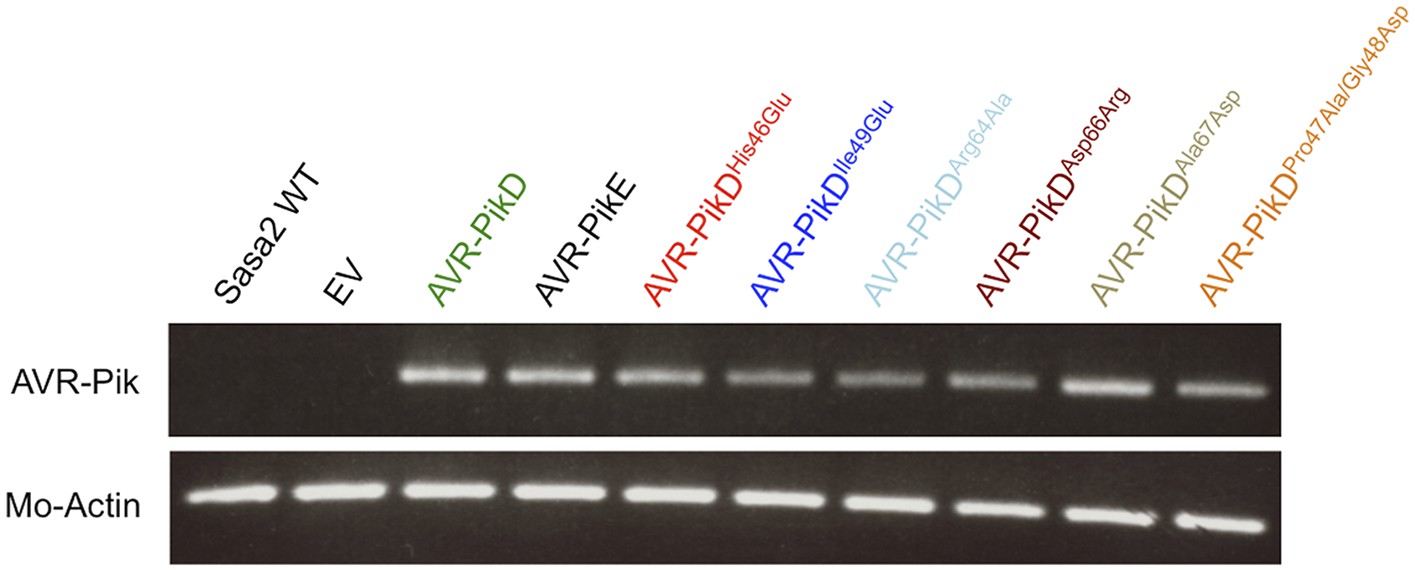
RT-PCR.
RT-PCR confirming AVR-PikD, AVR-PikE and AVR-PikD mutants are expressed during infection, M. oryzae actin was used as the positive control.
Figure 6 with 4 supplements
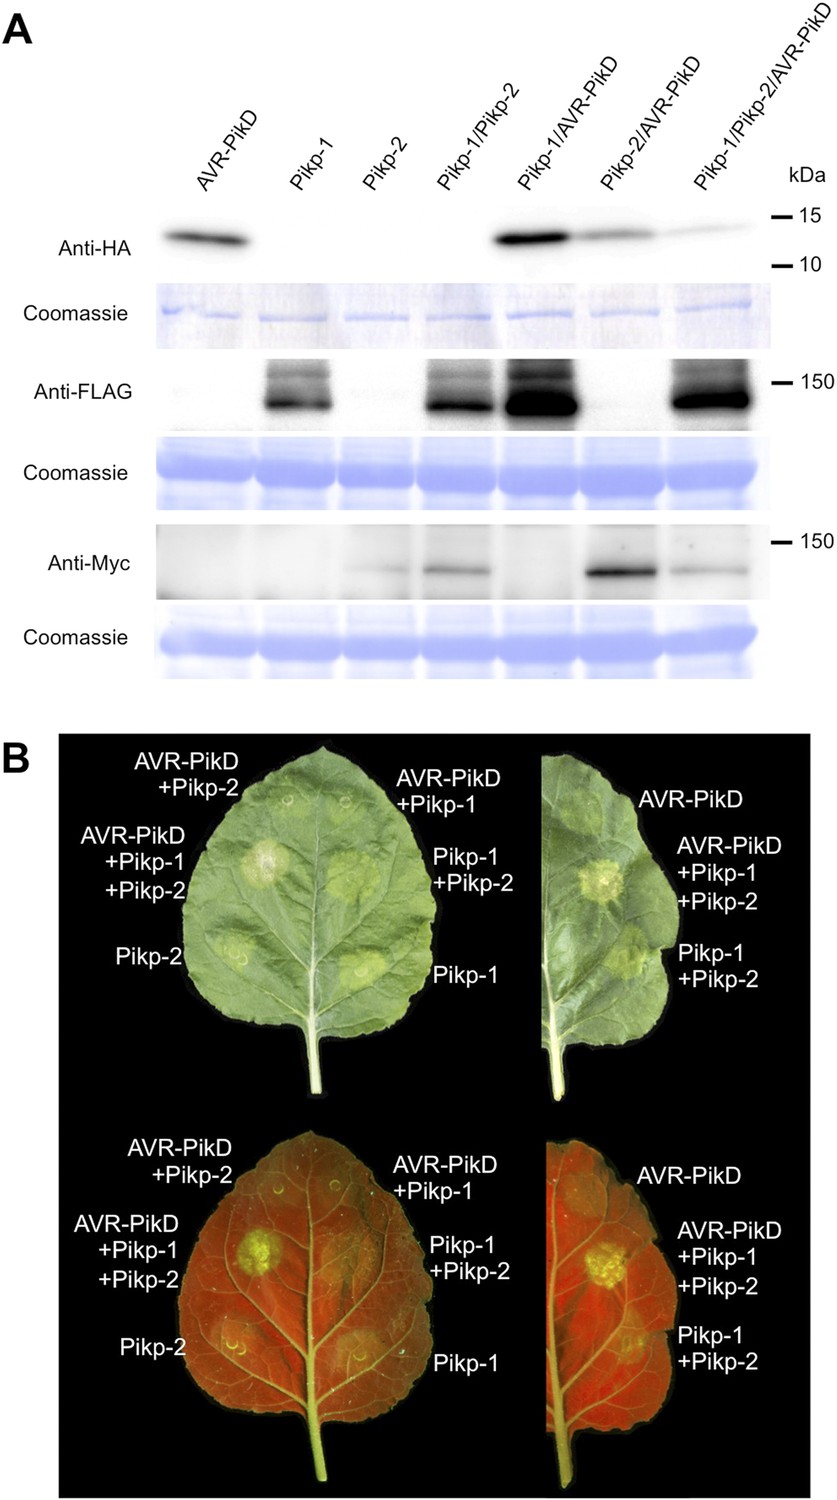
Pikp HR-like cell death in Nicotiana benthamiana requires co-delivery of AVR-PikD, Pikp-1 and Pikp-2.
(A) Western blots showing expression of AVR-PikD(HA), Pikp-1(FLAG) and Pikp-2(Myc) in N. benthamiana. Blots were probed using the appropriate antibody for the tagged protein. (B) The Pikp HR-like cell death in N. benthamiana requires expression of Pikp-1, Pikp-2 and AVR-PikD together. Expression of individual proteins or co-expression of any protein pair does not result in cell death. Images showing autofluorescence are horizontally flipped to present the same leaf orientation as white light images.
Figure 6—figure supplement 1
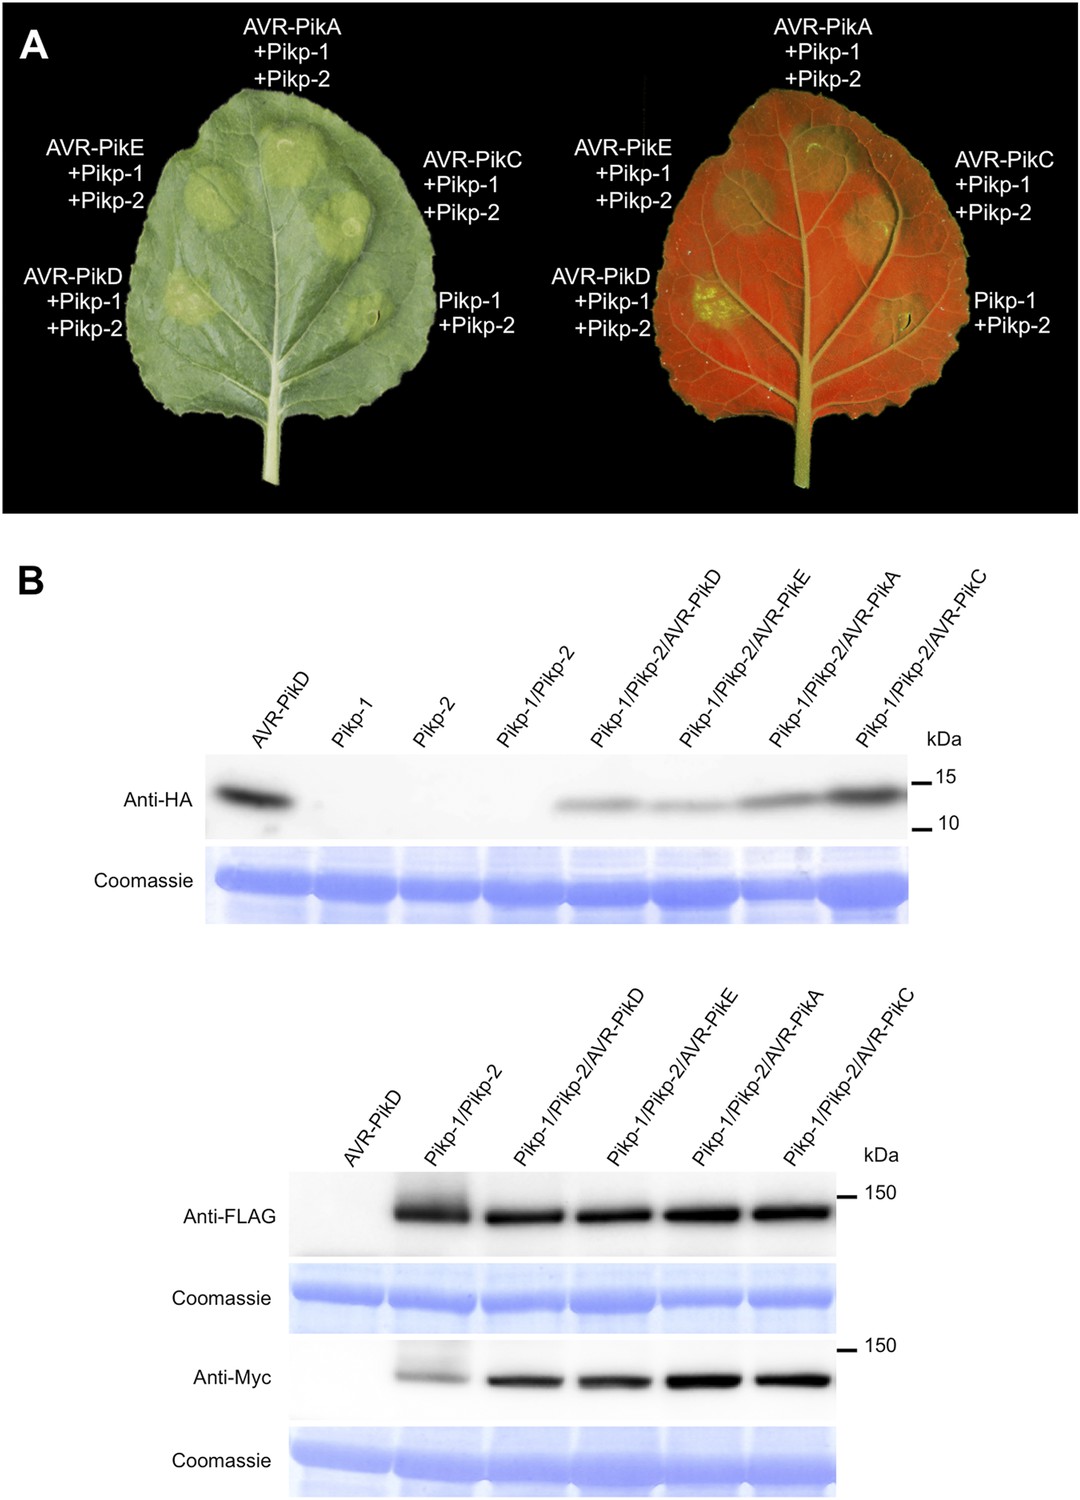
Pikp HR-like cell death in N. benthamiana requires expression of Pikp-1, Pikp-2 and AVR-PikD specifically.
(A) Only the expression of Pikp-1, Pikp-2 and AVR-PikD, not AVR-PikE, AVR-PikA or AVR-PikC, results in cell death in N. benthamiana. Images showing autofluorescence are horizontally flipped to present the same leaf orientation as white light images. (B) Western blots showing expression of AVR-Pik(HA) alleles, Pikp-1(FLAG) and Pikp-2(Myc) in N. benthamiana. Blots were probed using the appropriate antibody for the tagged protein.
Figure 6—figure supplement 2

Expression of AVR-Pik alleles alone, or in any combination with Pikp-1 or Pikp-2, does not result in HR-like cell death in N. benthamiana for (A) AVR-PikE, (B) AVR-PikA or (C) AVR-PikC.
The Pikp-1, Pikp-2 and AVR-PikD combination is included as a positive control. Images showing autofluorescence are horizontally flipped to present the same leaf orientation as white light images.
Figure 6—figure supplement 3
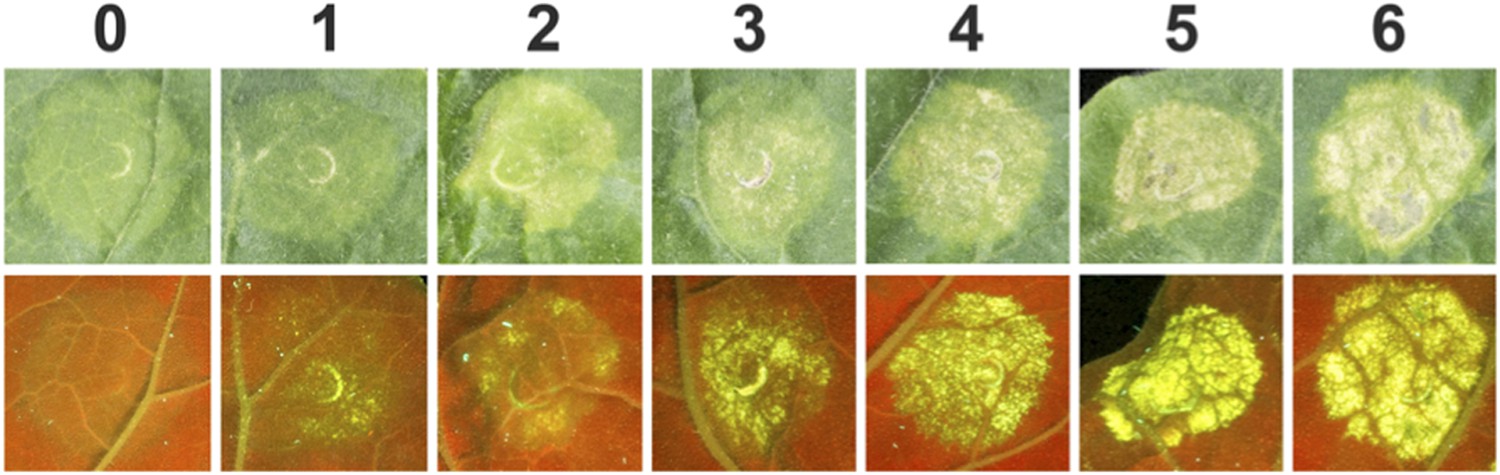
Example images used for scoring HR-like cell death (HR Index) in N. benthamiana on expression of Pikp-1, Pikp-2 and AVR-Pik alleles and AVR-PikD mutants.
Views from the adaxial side of the leaves for white light images and abaxial side of the leaves for UV images were used. Images showing autofluorescence are horizontally flipped to present the same orientation as white light images.
Figure 6—figure supplement 4
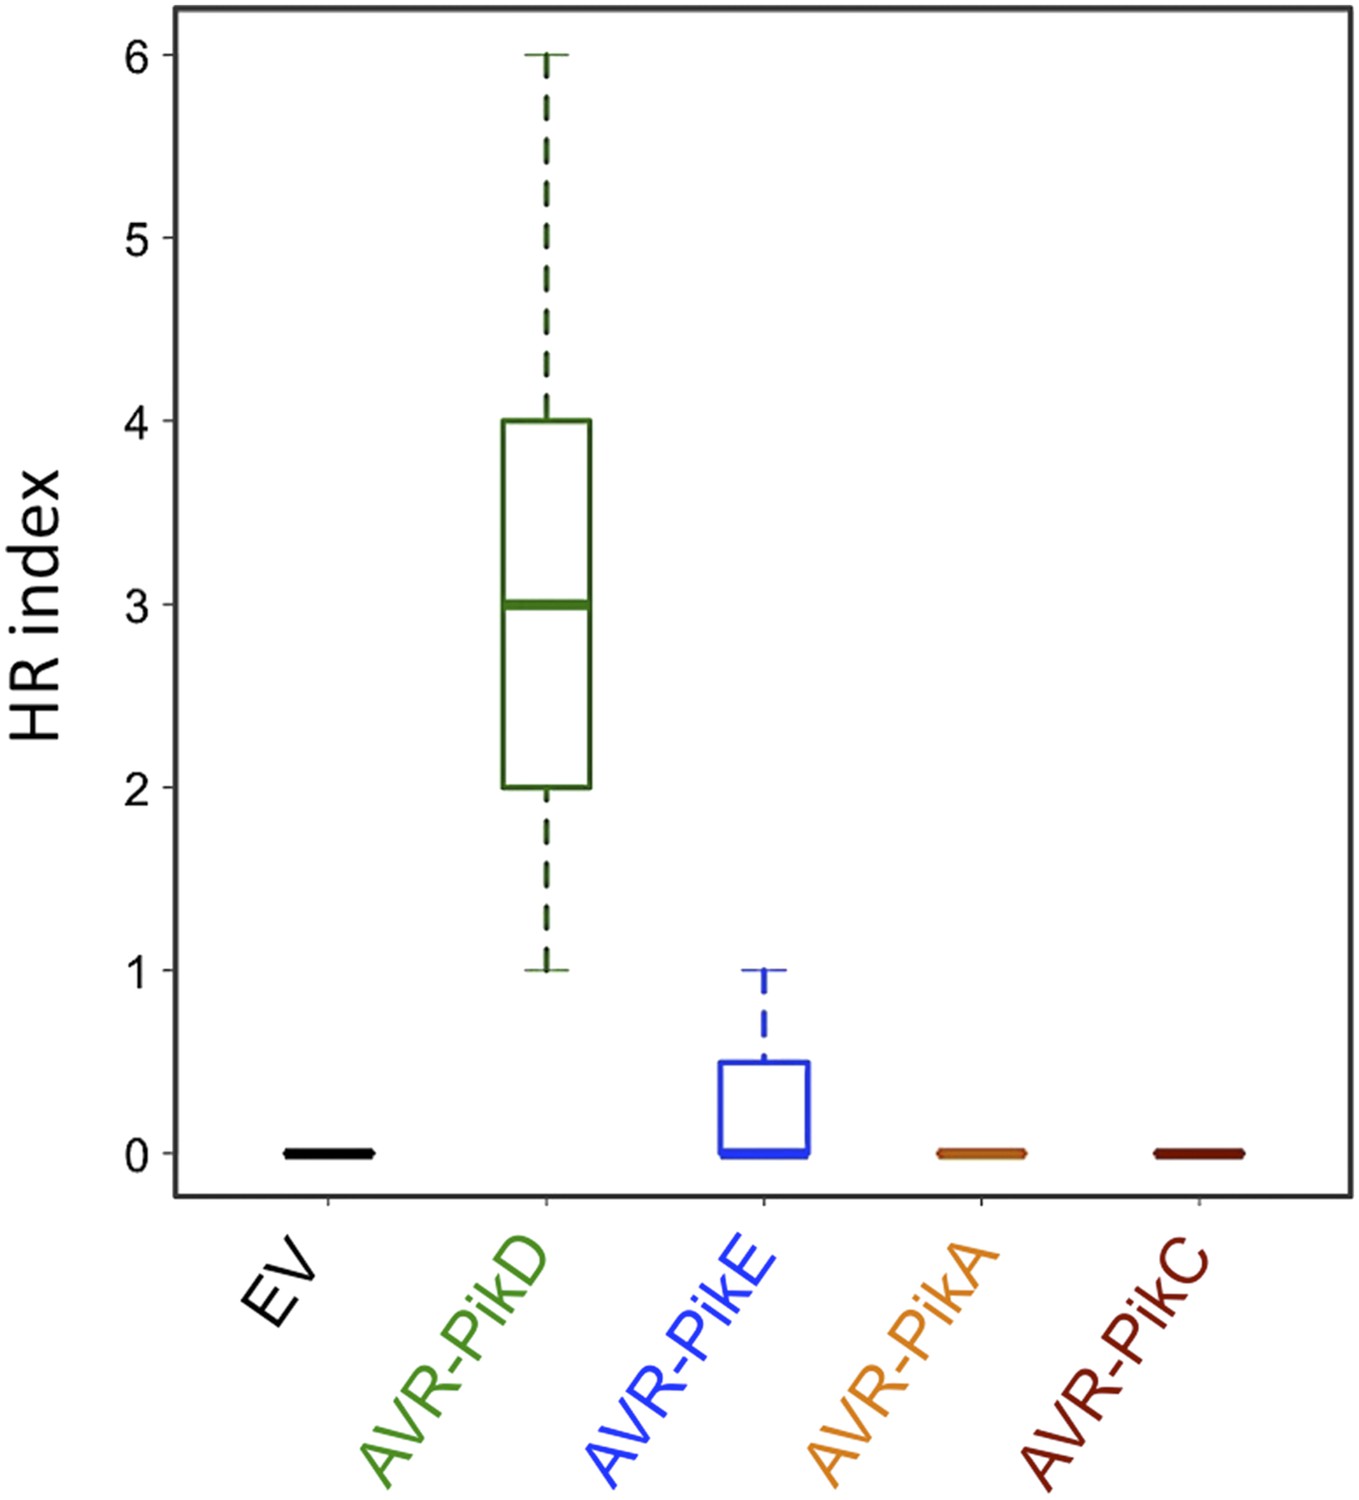
Box plots depicting HR Index for repeats of the assay shown in Figure 6 and Figure 6—figure supplement 1A.
For each sample the number of repeats used were, Empty Vector (EV) and AVR-PikD: 156, AVR-PikE: 68, AVR-PikA: 69, AVR-PikC: 70. The scoring system for the HR Index is shown in Figure 6—figure supplement 3.
Figure 7 with 2 supplements

Structure based mutations at the AVR-PikD/Pikp-HMA interface leads to loss of HR-like cell death in N. benthamiana.
Co-infiltration of Pikp-1 and Pikp-2 with AVR-PikD mutants His46Glu, Arg64Ala, Asp66Arg and Ala67Asp leads to loss of recognition and signalling in N. benthamiana. AVR-PikDIle49Glu and AVR-PikDPro47Ala/Gly48Asp retain recognition and signalling. Each infiltration site includes Pikp-1 and Pikp-2 with the AVR-PikD mutant indicated. Pikp-1 and Pikp-2 alone (EV) and with AVR-PikD are included as controls. Images showing autofluorescence are horizontally flipped to present the same leaf orientation as white light images.
Figure 7—figure supplement 1
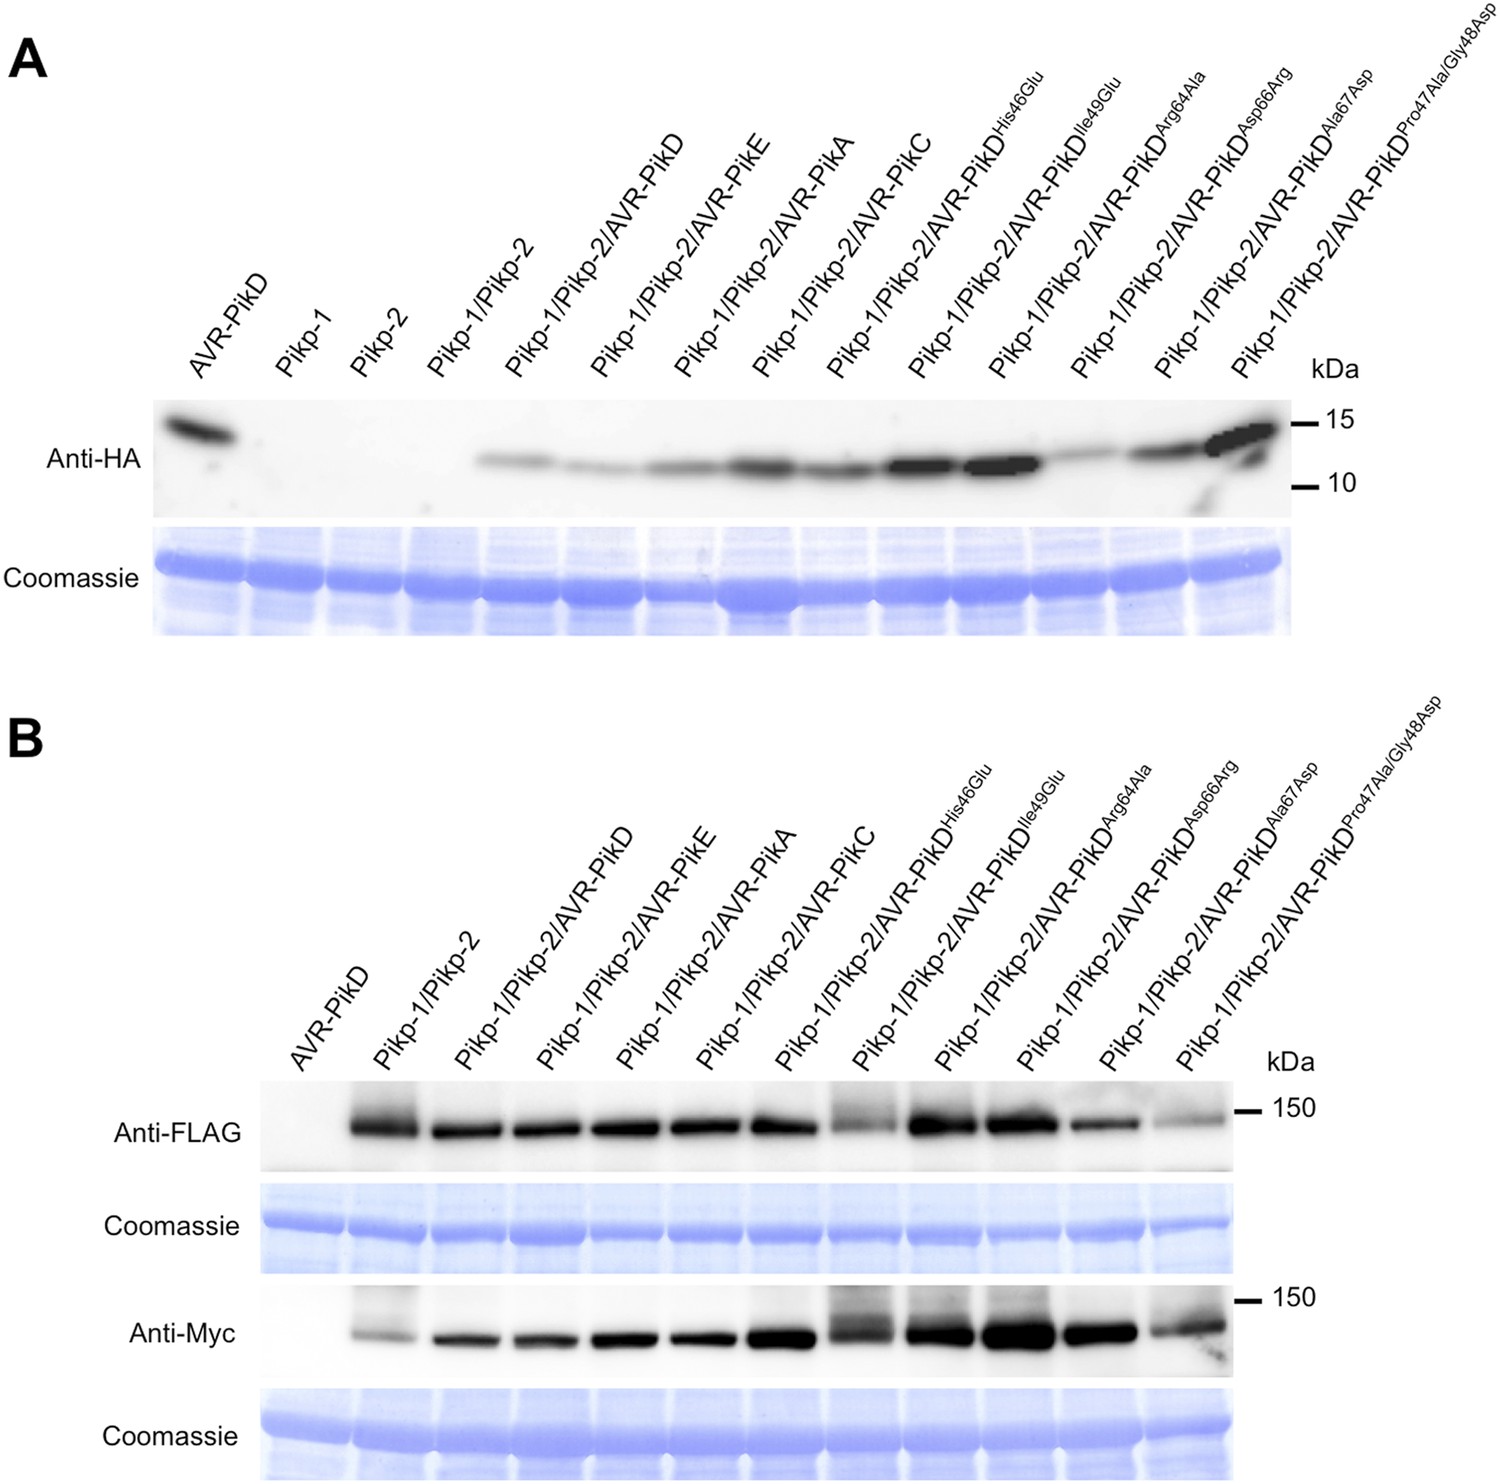
Western blots showing expression of AVR-Pik alleles, AVR-PikD mutants (A) and Pikp-1, Pikp-2 (B) in N. benthamiana.
Blots were probed using the appropriate antibody for the tagged protein. The same blots were previously shown in Figure 6—figure supplement 1B to show expression of Pikp-1, Pikp-2 and AVR-Pik alleles.
Figure 7—figure supplement 2
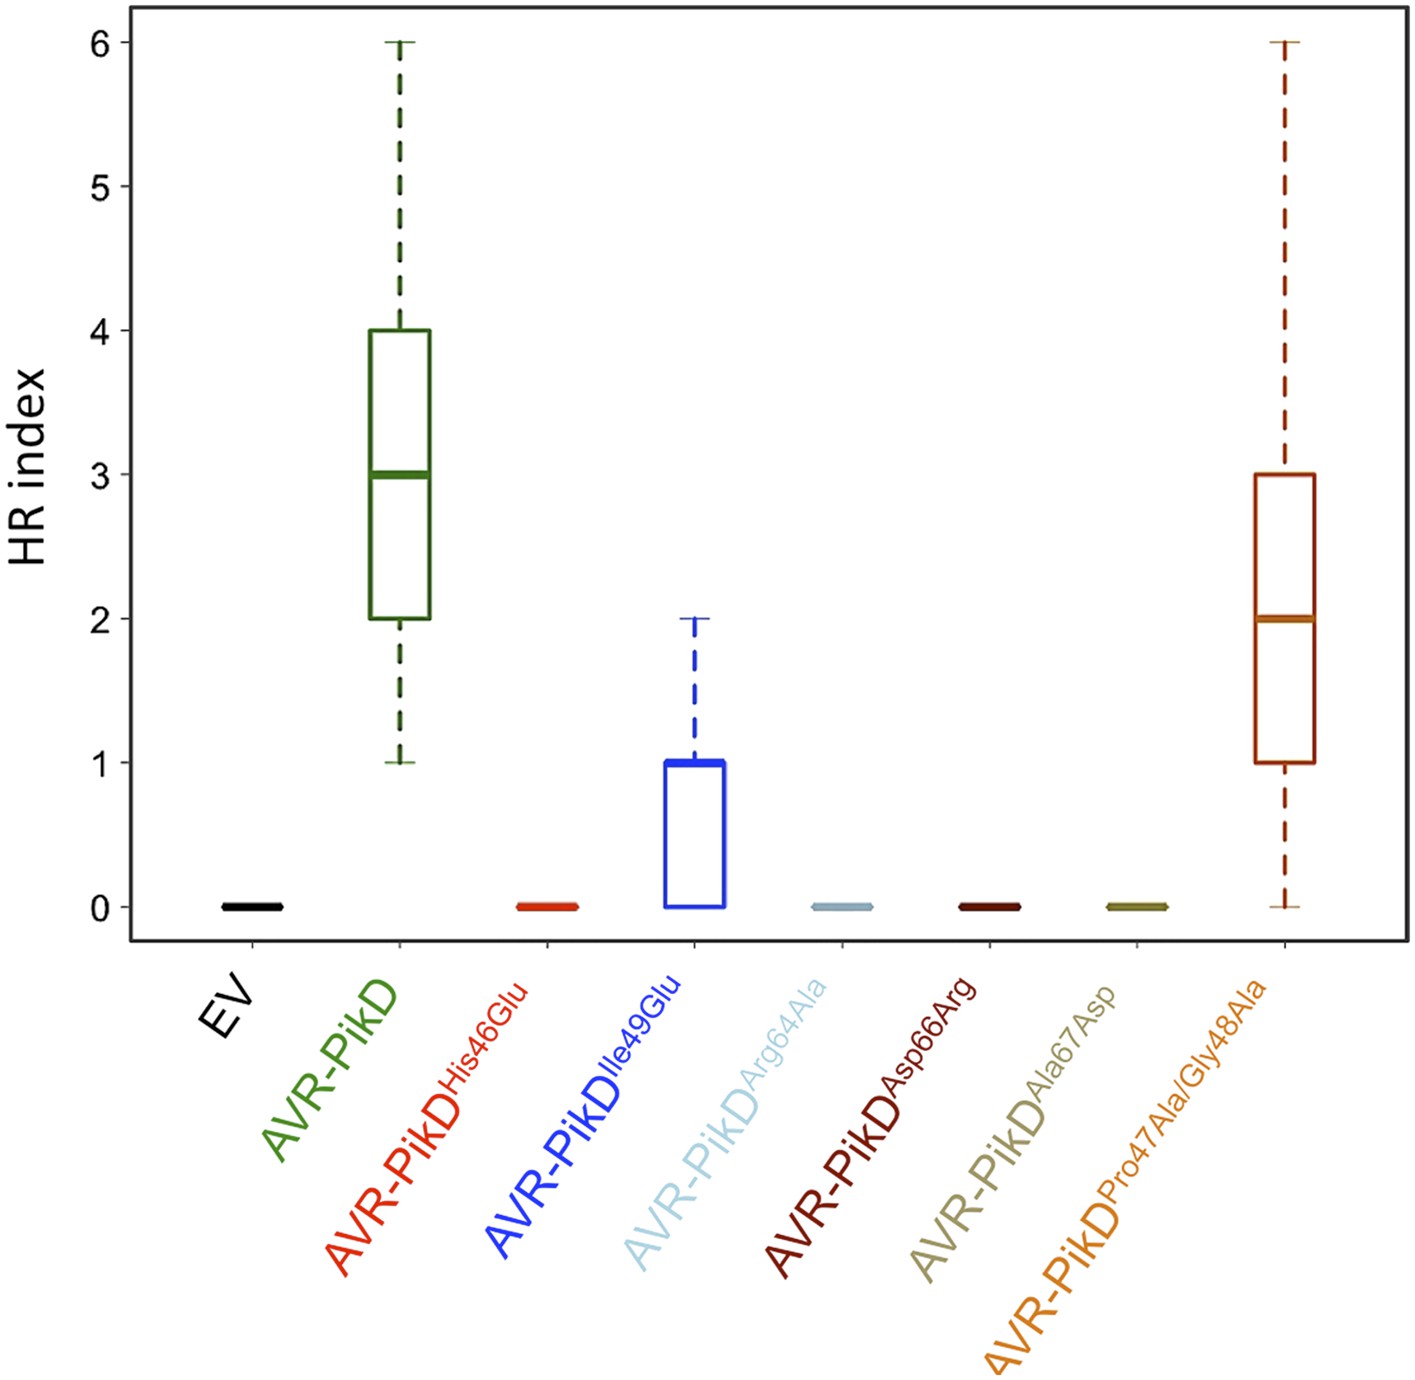
Box plots showing HR Index for repeats of the assay depicted in Figure 7.
For each sample the number of repeats used were, Empty Vector (EV) and AVR-PikD: 156, AVR-PikDHis46Glu, AVR-PikDIle49Glu and AVR-PikDArg64Ala: 70, AVR-PikDAsp66Arg and AVR-PikDAla67Asp: 69, AVR-PikDPro47Ala/Gly48Asp: 68. Note that the data presented here for EV and AVR-PikD are also presented in Figure 6—figure supplement 4 (all N. benthamiana assay repeats were conducted at similar times). The scoring system for the HR Index is shown in Figure 6—figure supplement 3.
Tables
Table 1
Summary Table showing the outcomes of in vitro and in planta assays used to investigate the interactions and responses of AVR-Pik effectors with Pikp-dependent readouts
| AVR-PikD | AVR-PikE | AVR-PikA | AVR-PikC | AVR-PikDHis46Glu | AVR-PikDIle49Glu | AVR-PikDArg64Ala | AVR-PikDAsp66Arg | AVR-PikDAla67Asp | AVR-PikDPro47Ala/Gly48Asp | |
|---|---|---|---|---|---|---|---|---|---|---|
| Interaction with Pikp-HMA in Y2H | +++ | + | − | − | − | +++ | − | − | ++ | + |
| Interaction with Pikp-HMA in SPR | +++ | ++ | + | − | − | ++ | − | − | + | ++ |
| Recognition in Pikp+ rice plants | +++ | + | (−) | (−) | − | + | − | − | +++ | +++ |
| CD response in Nicotiana benthamiana | +++ | − | − | − | − | ++ | − | − | − | +++ |
-
Y2H = yeast-2-hybrid, SPR = Surface Plasmon Resonance, Pikp+ = rice cv. K60, CD = cell death. Parentheses depict results from (Kanzaki et al., 2012).
Table 2
Intact masses for proteins expressed and purified in this study
| Protein | Vector | Molecular Mass (Da) | ||
|---|---|---|---|---|
| Calculated | Observed | Δ | ||
| Pikp-HMA | pOPINS3C* | 7805.23 | 7804.97 | −0.26 |
| AVR-PikD | pOPINS3C* | 10,835.31 | 10,832.95 | −2.36§ |
| AVR-PikD | pOPINA† | 10,812.33 | 10,809.99 | −2.34 |
| AVR-PikD | pOPINE‡ | 11,786.33 | 11,784.16 | −2.17 |
| AVR-PikE | pOPINS3C* | 10,812.27 | 10,809.91 | −2.36 |
| AVR-PikE | pOPINE‡ | 11,763.29 | 11,760.96 | −2.33 |
| AVR-PikA | pOPINS3C* | 10,844.27 | 10,841.80 | −2.47 |
| AVR-PikA | pOPINE‡ | 11,795.29 | 11,793.01 | −2.28 |
| AVR-PikC | pOPINS3C* | 10,856.28 | 10,853.72 | −2.56 |
| AVR-PikC | pOPINE‡ | 11,807.30 | 11,804.97 | −2.33 |
| AVR-PikDHis46Glu | pOPINE‡ | 11,778.30 | 11,776.07 | −2.23 |
| AVR-PikDIle49Glu | pOPINE‡ | 11,802.28 | 11,800.04 | −2.24 |
| AVR-PikDArg64Ala | pOPINE‡ | 11,701.22 | 11,698.94 | −2.28 |
| AVR-PikDAsp66Arg | pOPINE‡ | 11,827.43 | 11,825.31 | −2.12 |
| AVR-PikDAla67Asp | pOPINE‡ | 11,830.34 | 11,828.20 | −2.14 |
| AVR-PikDPro47Ala, Gly48Asp | pOPINE‡ | 11,818.32 | 11,816.20 | −2.12 |
-
*
Non-native residues remaining after 3C cleavage: N-terminal Gly–Pro.
-
†
Non-native residues remaining: N-terminal Met.
-
‡
Non-native residues remaining after 3C cleavage: N-terminal Gly–Pro; C-terminal Lys-His-His-His-His-His-His.
-
§
The measured mass of each AVR-Pik protein should be 2.0156 Da (2 × 1.0078) less than its calculated mass due to formation of the di-sulphide bond.
Table 3
X-ray data collection and refinement statistics
| Pikp-HMA | Pikp-HMA/AVR-PikD | ||
|---|---|---|---|
| Native | Iodide | ||
| Data collection | |||
| Wavelength (Å) | 1.20 | 2.00 | 0.90 |
| Space group | P6522 | P6522 | P41212 |
| Cell dimensions | |||
| a, b, c (Å) | 54.65, 54.65, 235.22 | 54.73, 54.73, 235.80 | 118.41, 118.41, 35.81 |
| α, β, γ, (°) | 90.00, 90.00, 120.00 | 90.00, 90.00, 120.00 | 90.00, 90.00, 90.00 |
| Resolution (Å)* | 47.33–2.10 (2.15–2.10) | 117.90–2.80 (2.87–2.80) | 39.47–1.60 (1.64–1.60) |
| Rmerge (%) | 8.4 (117.6) | 8.7 (45.8) | 4.7 (65.1) |
| I/σI | 32.3 (4.6) | 34.7 (7.3) | 32.3 (4.7) |
| Completeness (%) | |||
| Overall | 100 (99.9) | 99.9 (98.9) | 100 (100) |
| Anomalous | 99.9 (99.4) | ||
| Redundancy | |||
| Overall | 45 (46.8) | 32.8 (24.4) | 17.7 (17.4) |
| Anomalous | 19.4 (13.3) | ||
| CC(1/2) (%) | 100 (94.0) | 100 (98.0) | 100 (92.8) |
| Refinement and model | |||
| Resolution (Å) | 47.33–2.10 (2.15–2.10) | 39.47–1.60 (1.64–1.60) | |
| Reflections | 12356 (861) | 32549 (2379) | |
| Rwork/Rfree (%) | 20.2/22.9 (20.6/19.6) | 17.8/20.5 (19.6/24.7) | |
| No. atoms | |||
| Protein | 1063 | 1762 | |
| Water | 44 | 138 | |
| B-factors (Å2) | |||
| Protein | 29.96 | 23.38 | |
| Water | 57.31 | 34.07 | |
| R.m.s deviations | |||
| Bond lengths (Å) | 0.013 | 0.016 | |
| Bond angles (°) | 1.57 | 1.79 | |
| Ramachandran plot (%)† | |||
| Favoured | 97.1 | 98.7 | |
| Allowed | 2.9 | 1.3 | |
| Outliers | 0 | 0 | |
| MolProbity Score | 1.48 (98th percentile) | 1.21 (98th percentile) | |
-
*
The highest resolution shell is shown in parentheses.
-
†
As calculated by MolProbity.
Additional files
-
Supplementary file 1
Excel spreadsheet. Primers used in the construction of expression vectors.
- https://doi.org/10.7554/eLife.08709.030
Download links
A two-part list of links to download the article, or parts of the article, in various formats.
Downloads (link to download the article as PDF)
Open citations (links to open the citations from this article in various online reference manager services)
Cite this article (links to download the citations from this article in formats compatible with various reference manager tools)
Structural basis of pathogen recognition by an integrated HMA domain in a plant NLR immune receptor
eLife 4:e08709.
https://doi.org/10.7554/eLife.08709


