Regulation of alternative polyadenylation by Nkx2-5 and Xrn2 during mouse heart development
- Osaka University Graduate School of Medicine, Japan
- Kyoto University Graduate School of Medicine, Japan
- Graduate School of Frontier Biosciences, Osaka University, Japan
- University of Houston, Unites States
- The University of Tokyo, Japan
Figures
Figure 1 with 9 supplements
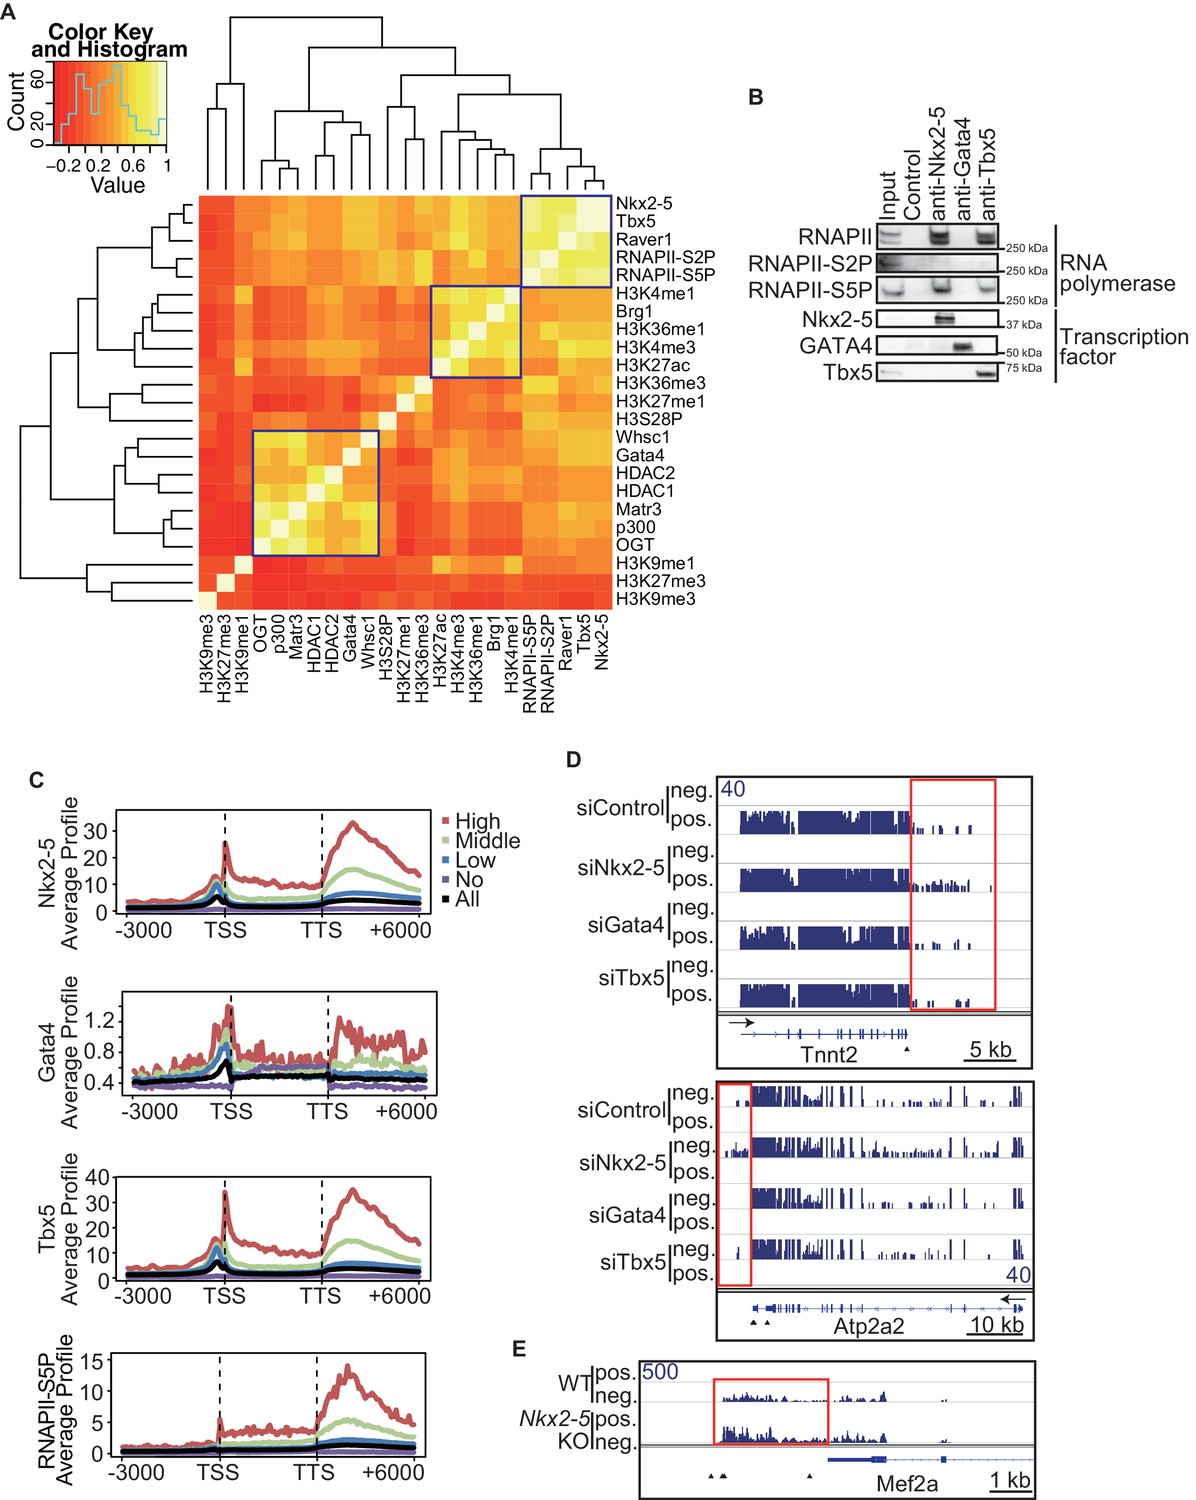
Nkx2-5 deficiency increases transcription from regions downstream of transcription termination sites.
(A) Co-occupancies of each pair of factors and histone modifications are shown. White indicates a high correlation, and red indicates a low correlation. (B) Nkx2-5, Tbx5, and Gata4 were immunoprecipitated from nuclear extracts of E12.5 hearts with the indicated antibodies. Co-immunoprecipitates and aliquots (6%) of the input proteins were analyzed by Western blotting with the indicated antibodies. (C) Average ChIP-seq signal profiles over a 3-kb meta-gene, including 3 kb upstream and 3 kb downstream. The lines correspond to genes with High, Middle, Low, and No expression and all RefSeq genes. (D and E) Genome browser representation of strand-specific RNA-seq tag counts from eCMs transfected with the indicated siRNAs (D) and E9.5 Nkx2-5-/- hearts (E). The red boxes indicate read-through RNAs. neg., negative strand; pos., positive strand. The arrow heads show polyadenylation sites.
-
Figure 1—source data 1
Overlap of peaks between transcription factors and between the results from this study and those from previousely published studies.
(A) Overlap of peaks between Nkx2-5, Tbx5, and Gata4 ChIPseq data in this study. (B) Overlap of Nkx2-5 peaks among E12.5 hearts (this study), HL1 cells with BirA-fused Nkx2-5 (HL1_BirA) (He et al., 2011), and Adult hearts (van den Boogaard et al., 2012). (C) Overlap of Tbx5 between E12.5 hearts (this study) and HL1 cells with BirA-fused Tbx5 (HL1_BirA) (He et al., 2011). (D) Overlap of Gata4 peaks between native ChIPseq in this study and previousely published crosslink ChIPseq (He et al., 2014).
- https://doi.org/10.7554/eLife.16030.004
Figure 1—figure supplement 1
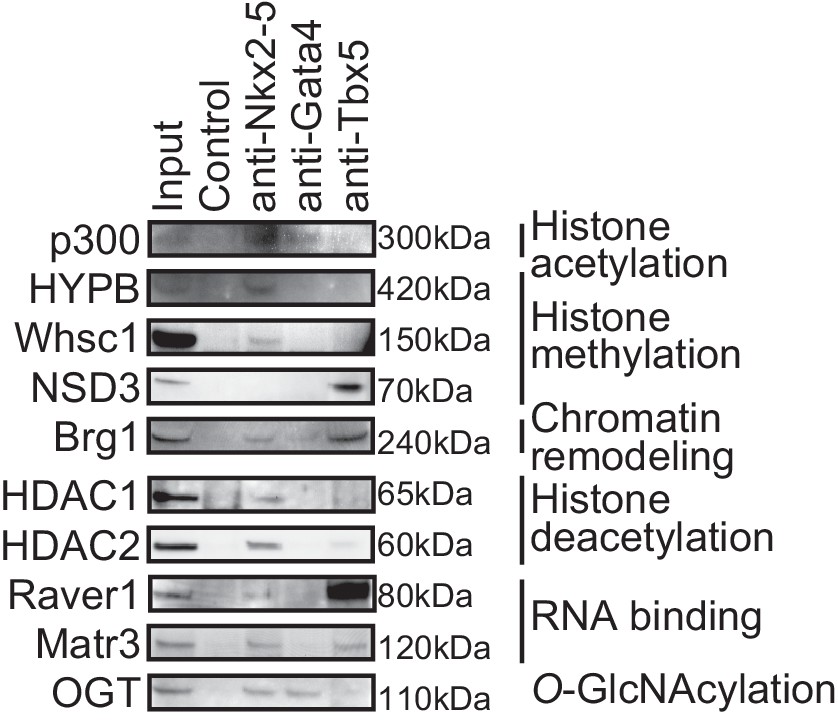
Transcription factors-associated proteins in E12.5 hearts.
This figure is related to Figure 1b.
Figure 1—figure supplement 2
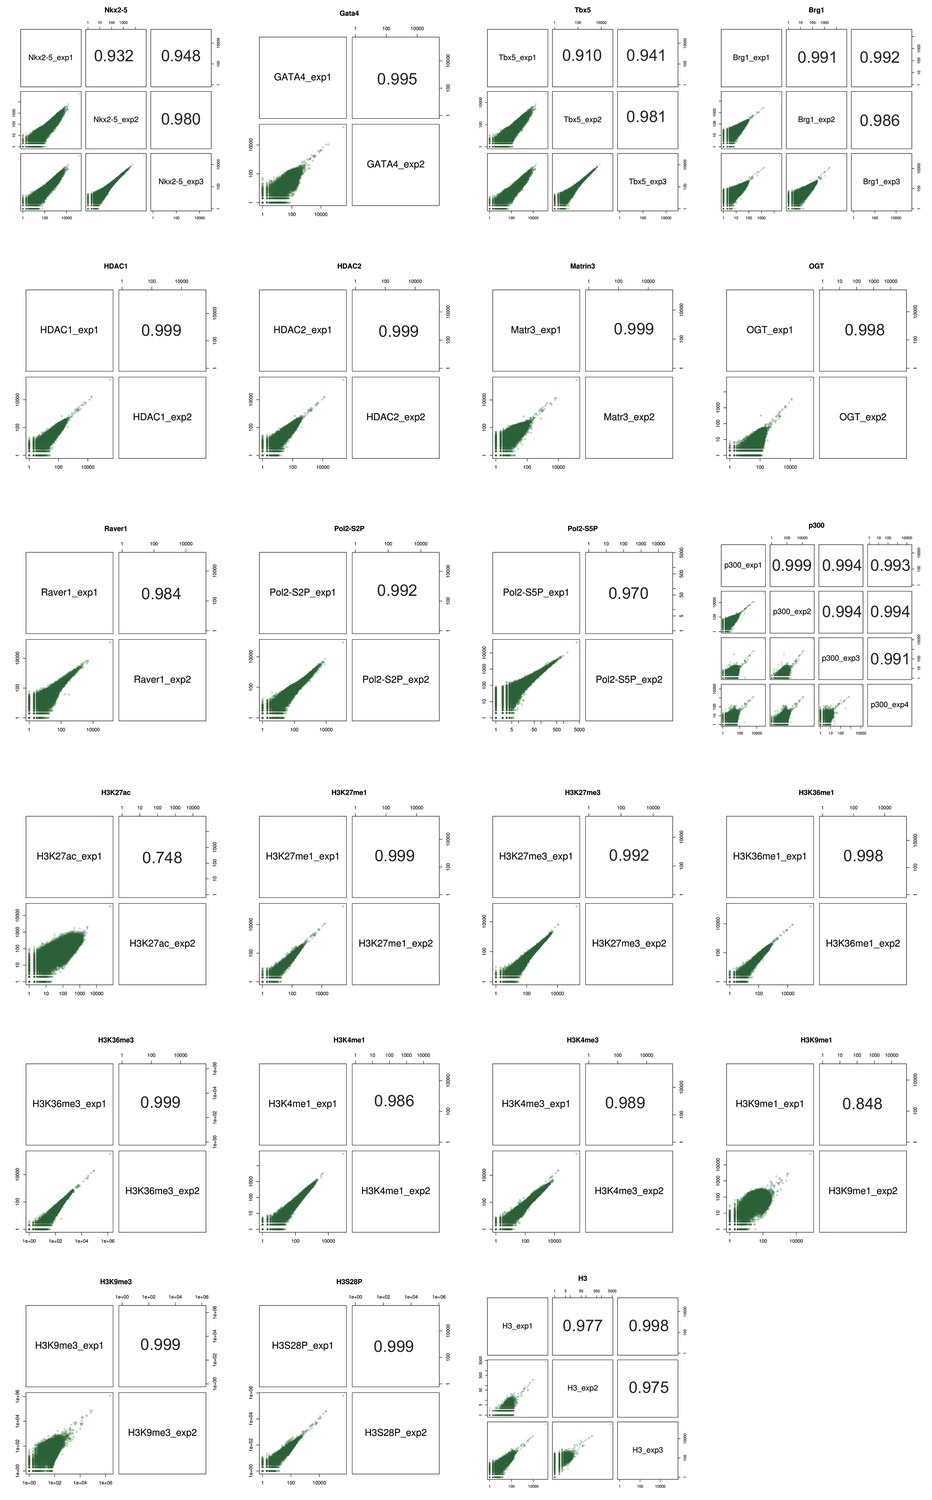
ChIPseq replicate correlations.
Scatterplots of pair-wise ChIPseq replicates and Pearson correlation are shown.
Figure 1—figure supplement 3

In vivo transcription factor binding motif by native ChIPseq.
De novo motif analysis by Homer using all peaks in ChIPseq data. Obtained motifs are compared with the most matched known motif, respectively. The motif (T/C)GATTGG found in Gata4 peaks is similar to the motif TGATTG that Gata proteins strongly bind (Merika and Orkin, 1993).
Figure 1—figure supplement 4
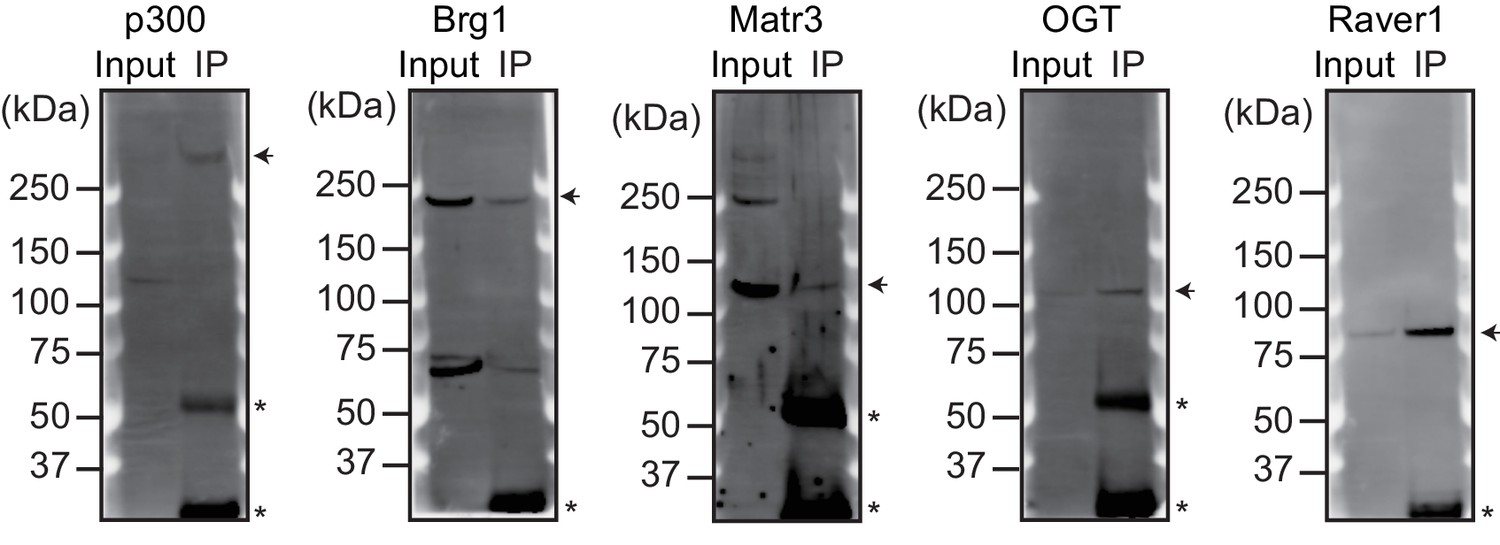
Validation of the antibodies used for ChIP-seq.
The indicated proteins were immunoprecipitated from nuclear extracts of E12.5 hearts using the corresponding antibodies. Arrowheads indicate immunoprecipitated proteins. Asterisks indicate the IgG heavy or light chains.
Figure 1—figure supplement 5
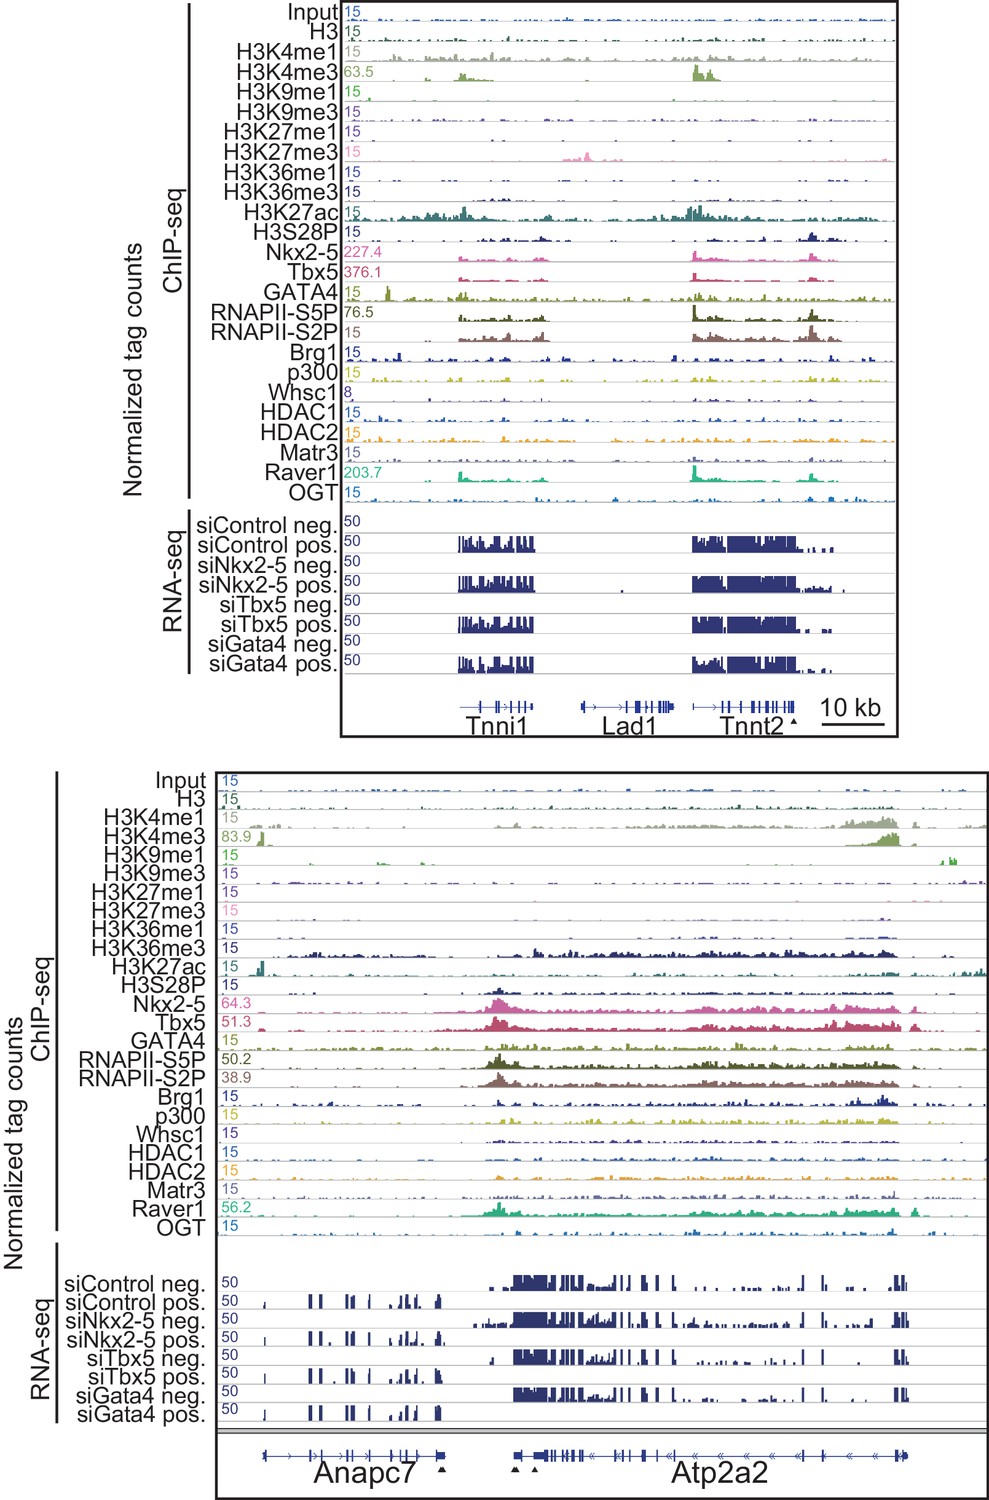
Genome browser representation at Tnnt2 and Atps2a2 loci.
Genome browser representation of the indicated histone modifications, transcription factors, and transcription factor-associated protein enrichment profiles in E12.5 hearts is shown for the Tnnt2 and Atp2a2 loci, with strand-specific RNA-seq tag counts from eCMs transfected with the indicated siRNA. The arrow heads show polyadenylation sites.
Figure 1—figure supplement 6
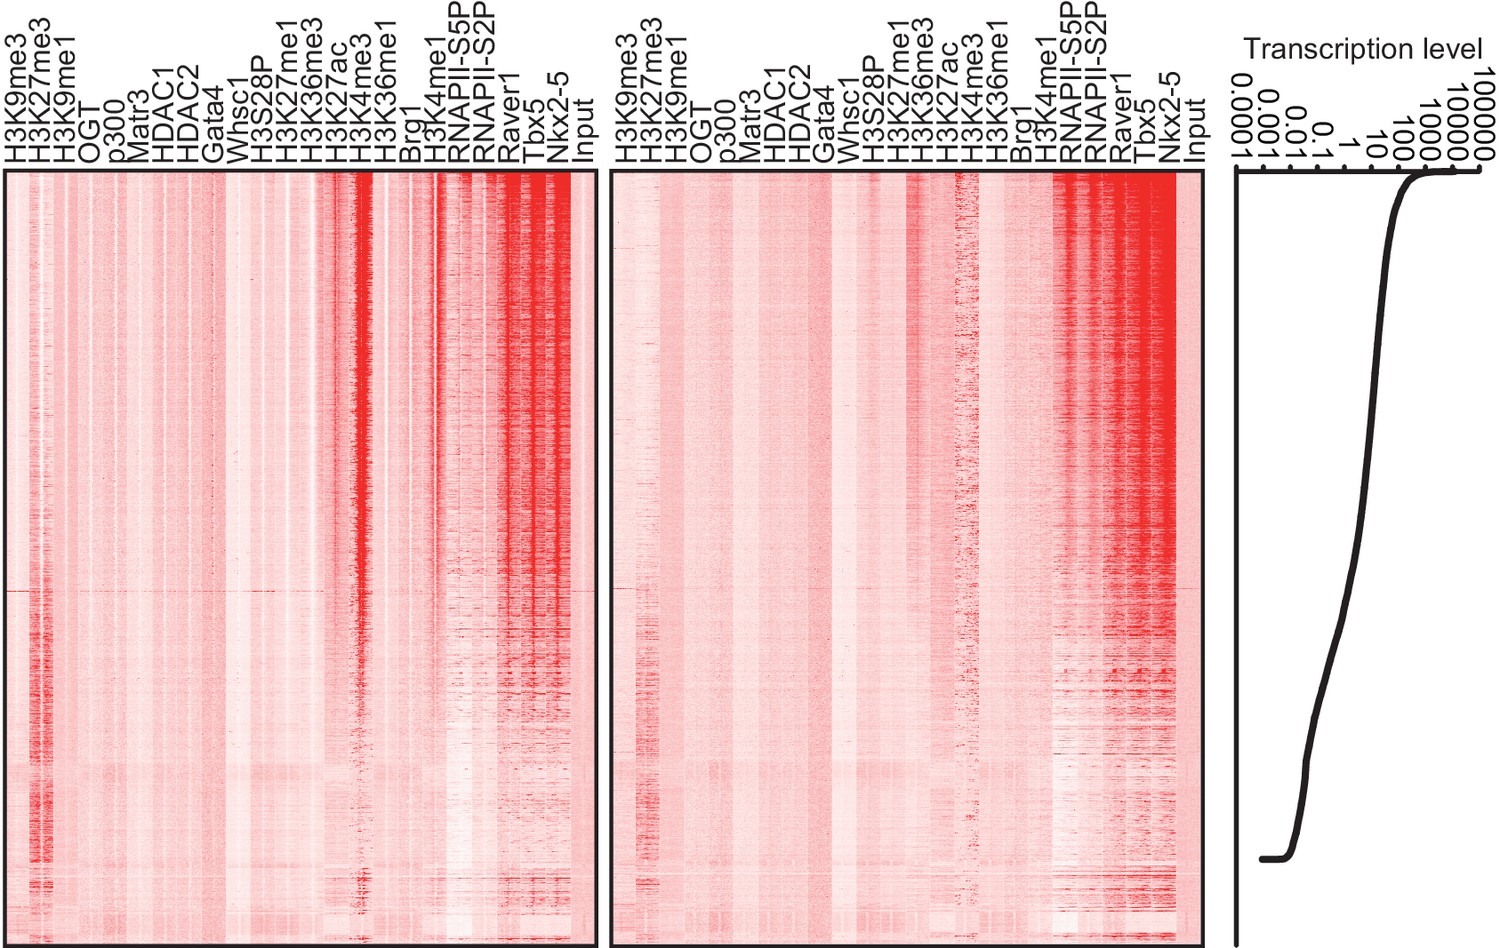
Heatmap of factor occupancy and histone modification enrichment for 8 kb regions centred on TSSs (left panel) and TTSs (middle panel) are shown with reference to the RefSeq gene expression level (right panel).
https://doi.org/10.7554/eLife.16030.010
Figure 1—figure supplement 7

Average signal profiles over a 3 kb meta-gene including 3 kb upstream and 3 kb downstream.
The ChIP-seq data were analysed using CEAS. The lines correspond to genes with High, Middle, Low, and No expression and all RefSeq genes.
Figure 1—figure supplement 8
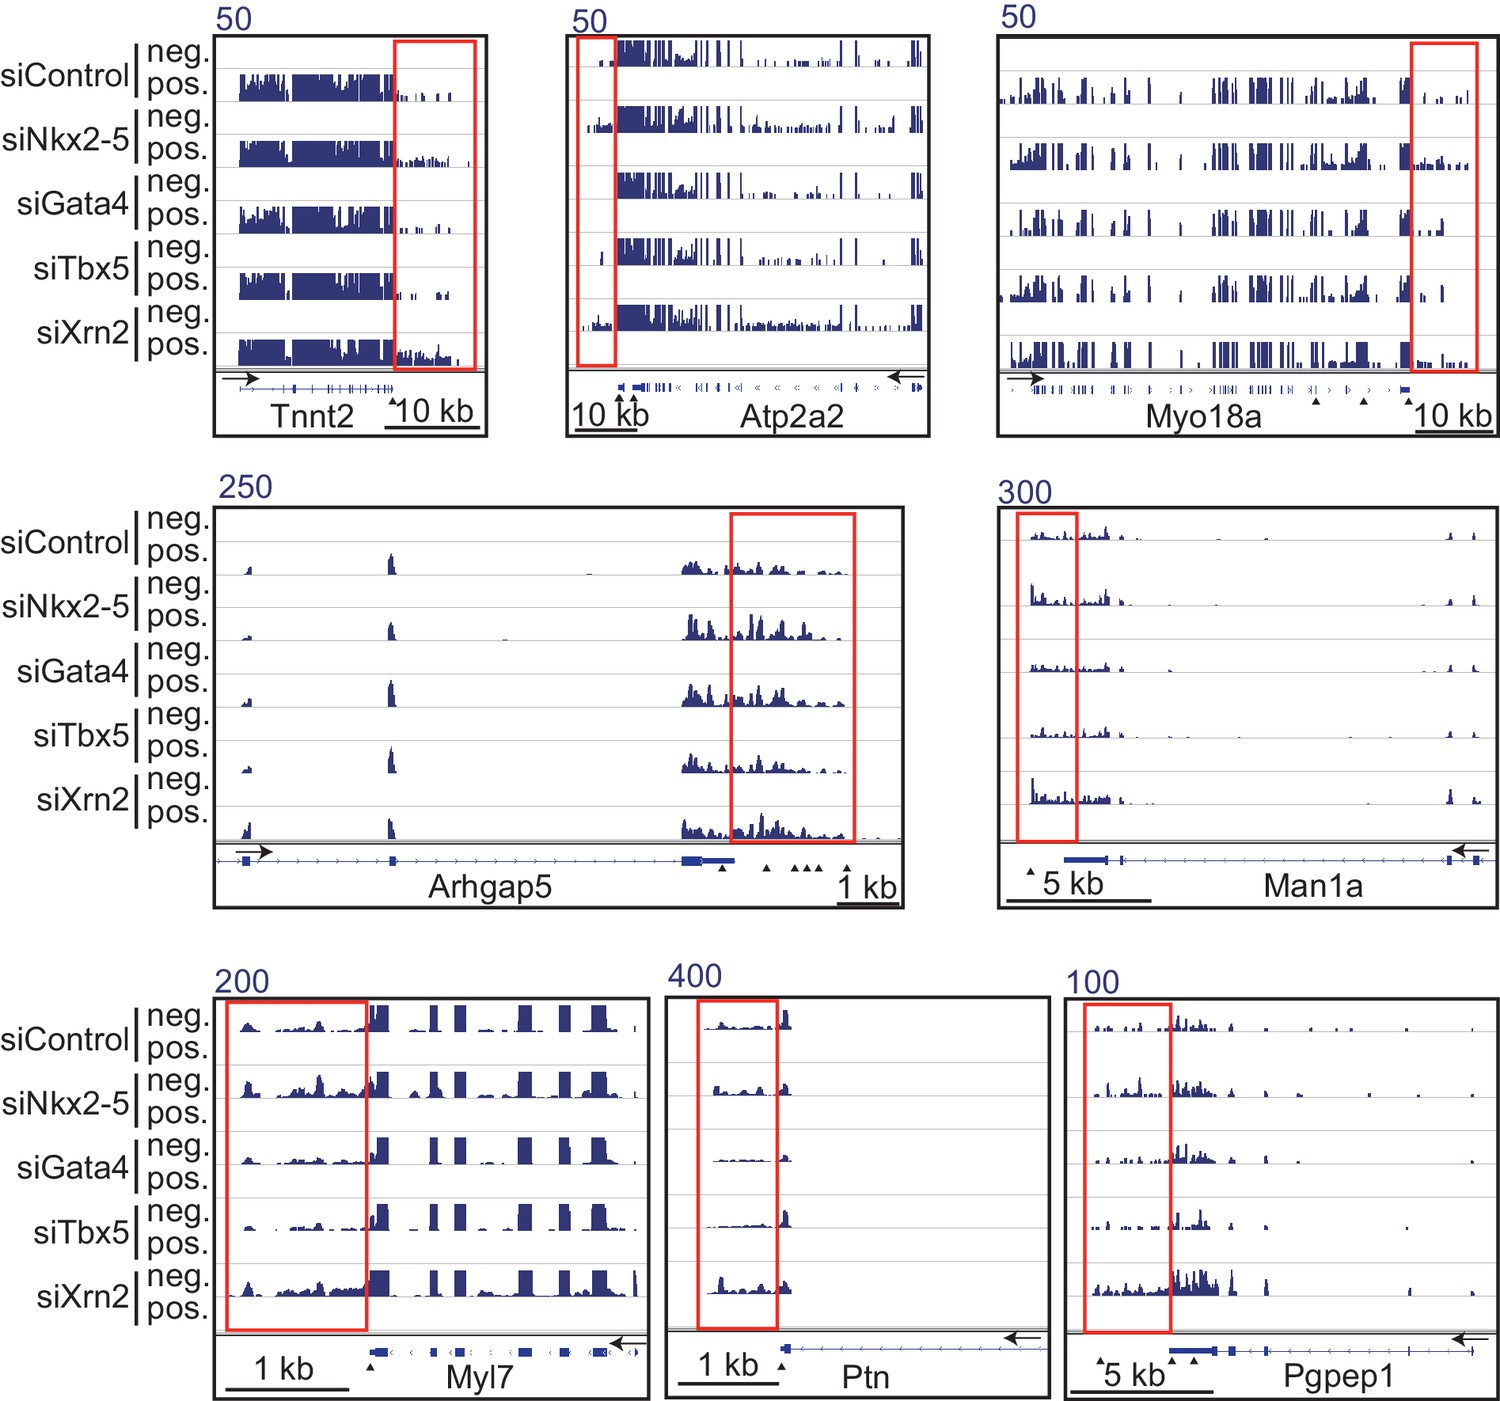
Genome browser representation of strand-specific RNA-seq tag counts from eCMs transfected with the indicated siRNAs.
Red boxes indicate read-through RNAs. neg., negative strand., pos., positive strand. The arrow heads show polyadenylation sites.
Figure 1—figure supplement 9
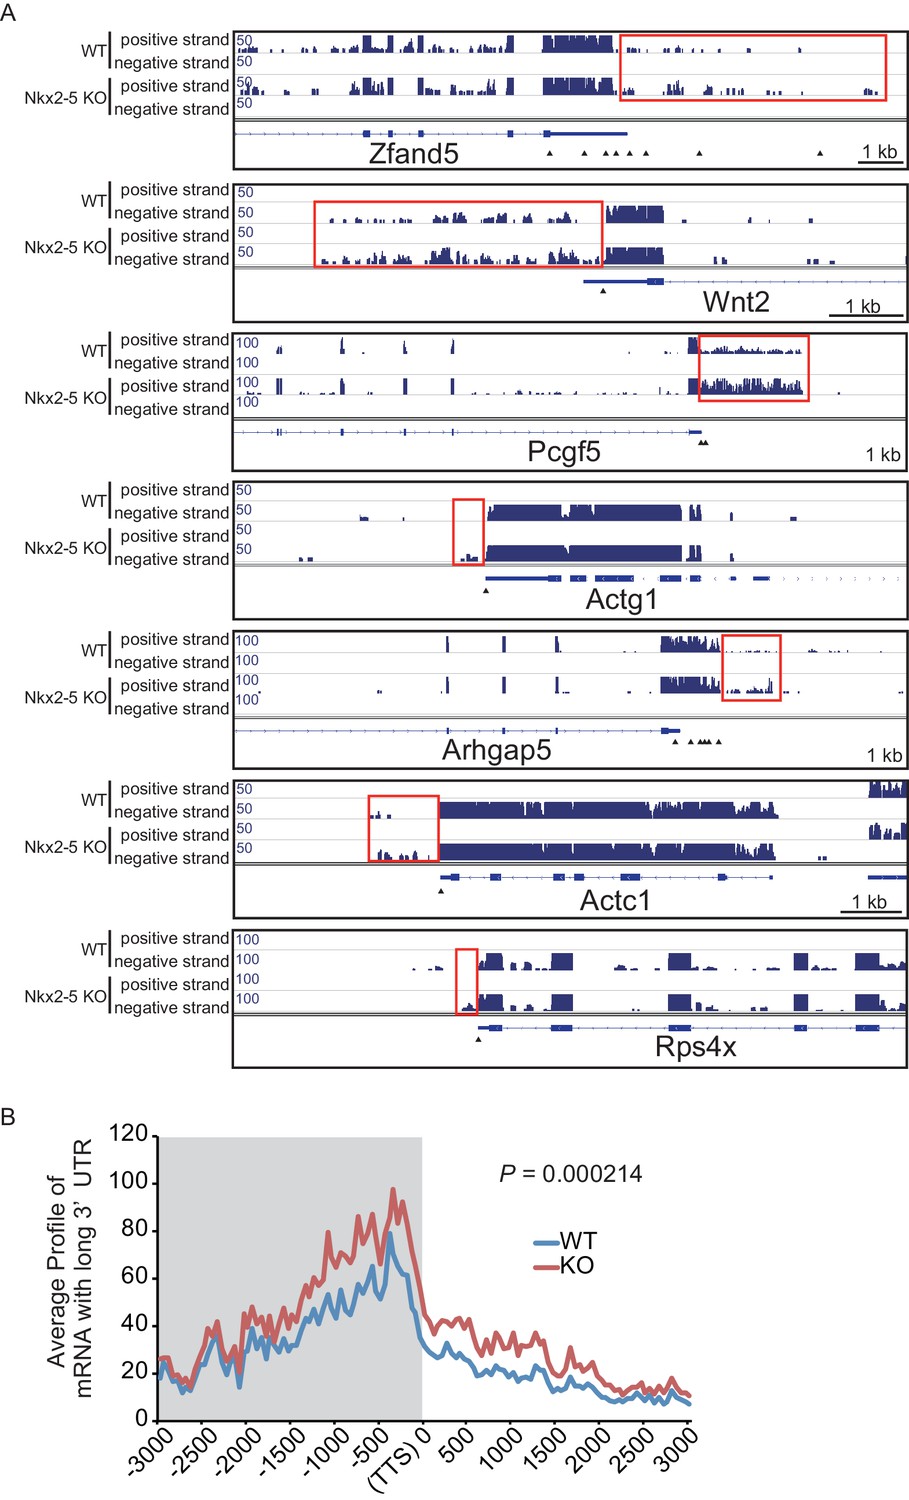
mRNA with long 3’UTR in Nkx2-5-knockout embryonic hearts.
(A) Genome browser representation of the read-through RNAs in Nkx2-5-knockout embryonic hearts. Red boxes indicate long 3’UTR. The arrow heads show polyadenylation sites. (B) Average profiles of read-through RNAs that are increased in Nkx2-5-knockout embryonic hearts. Significance was assessed using the two-sample Kolmogorov-Smirnov test.
Figure 2 with 4 supplements
A link between Nkx2-5-dependent chromatin conformation and RNAPII.
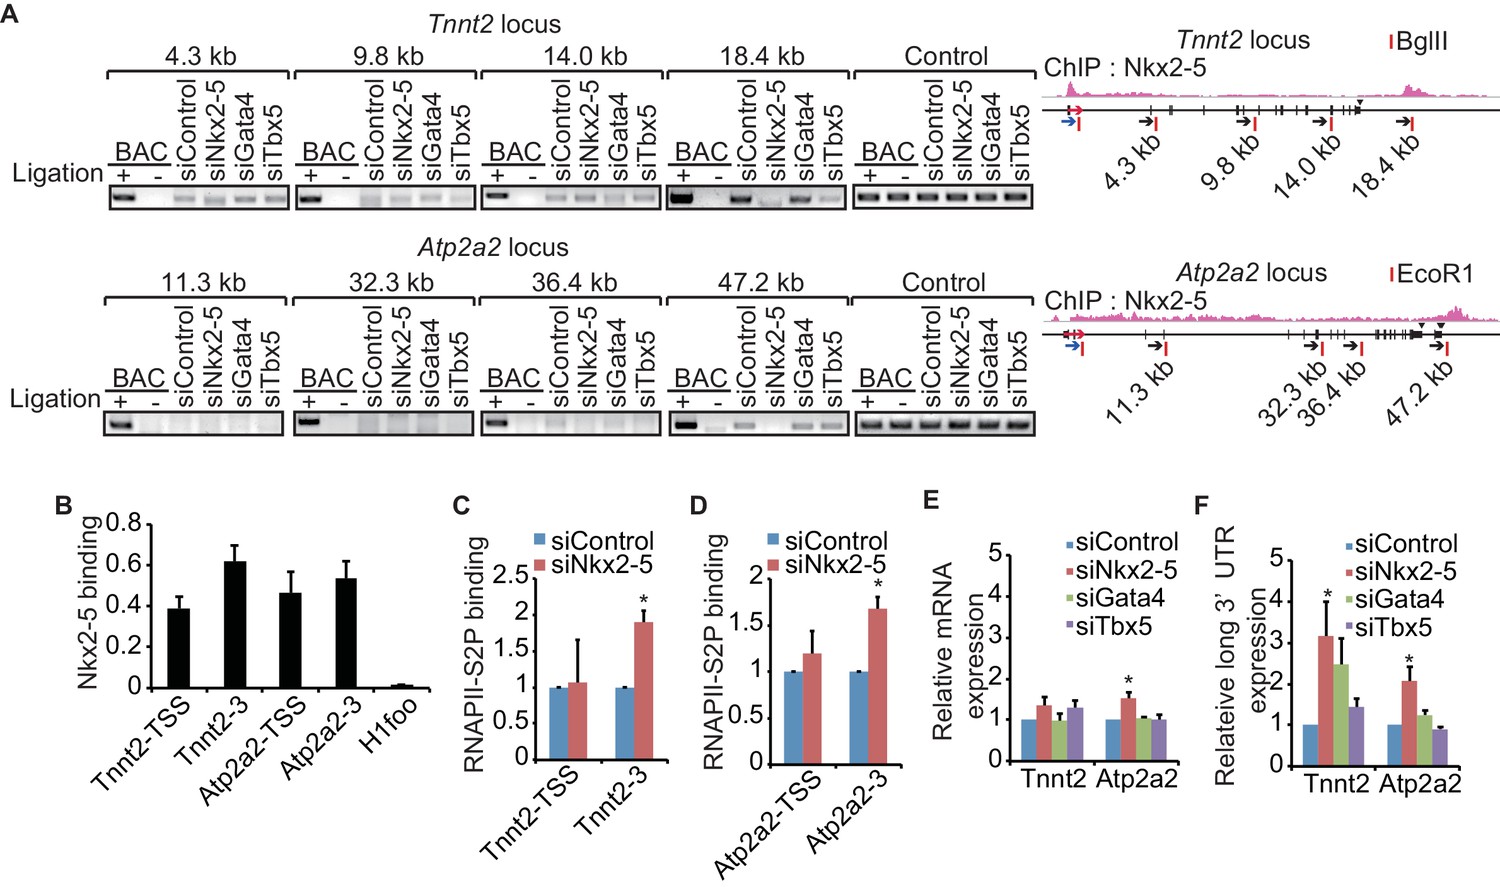
(A) Chromatin conformation capture (3C) analysis of the TSSs and downstream regions of Tnnt2 and Atp2a2 in the indicated siRNA-treated eCMs. The corresponding BACs for the regions were used as controls. Undigested regions at Tnnt2 and Atp2a2 were used as Controls. Red arrow, direction of transcription; blue arrow, anchoring primer; black arrow, primer; red line, restriction enzyme site. The arrow heads show polyadenylation sites. (B–D), Relative Nkx2-5 (B) and RNAPII-S2P occupancy (C and D) at the TSSs (-TSS) and downstream regions (-3) of Tnnt2 (18.4 kb), Atp2a2 (47.2 kb), and the silent histone H1foo gene, which served as a negative control, was analyzed by ChIP. (E and F) qRT-PCR analysis of mRNA expression from the coding region (E) and expression of long 3’ UTRs (F) of Tnnt2 and Atp2a2, normalized to Rplp2. Error bars indicate the mean ± s.e.m. (n = 3). *, p < 0.05.
-
Figure 2—source data 1
Source data for Figure 2 and Figure 2—figure supplement 1 and 3.
Numeric data for Figure 2B,C,D,E,F, Figure 2—figure supplement 1A,B, Figure 2—figure supplement 3A,B.
- https://doi.org/10.7554/eLife.16030.015
Figure 2—figure supplement 1
Quantification of 3C and western blotting data.
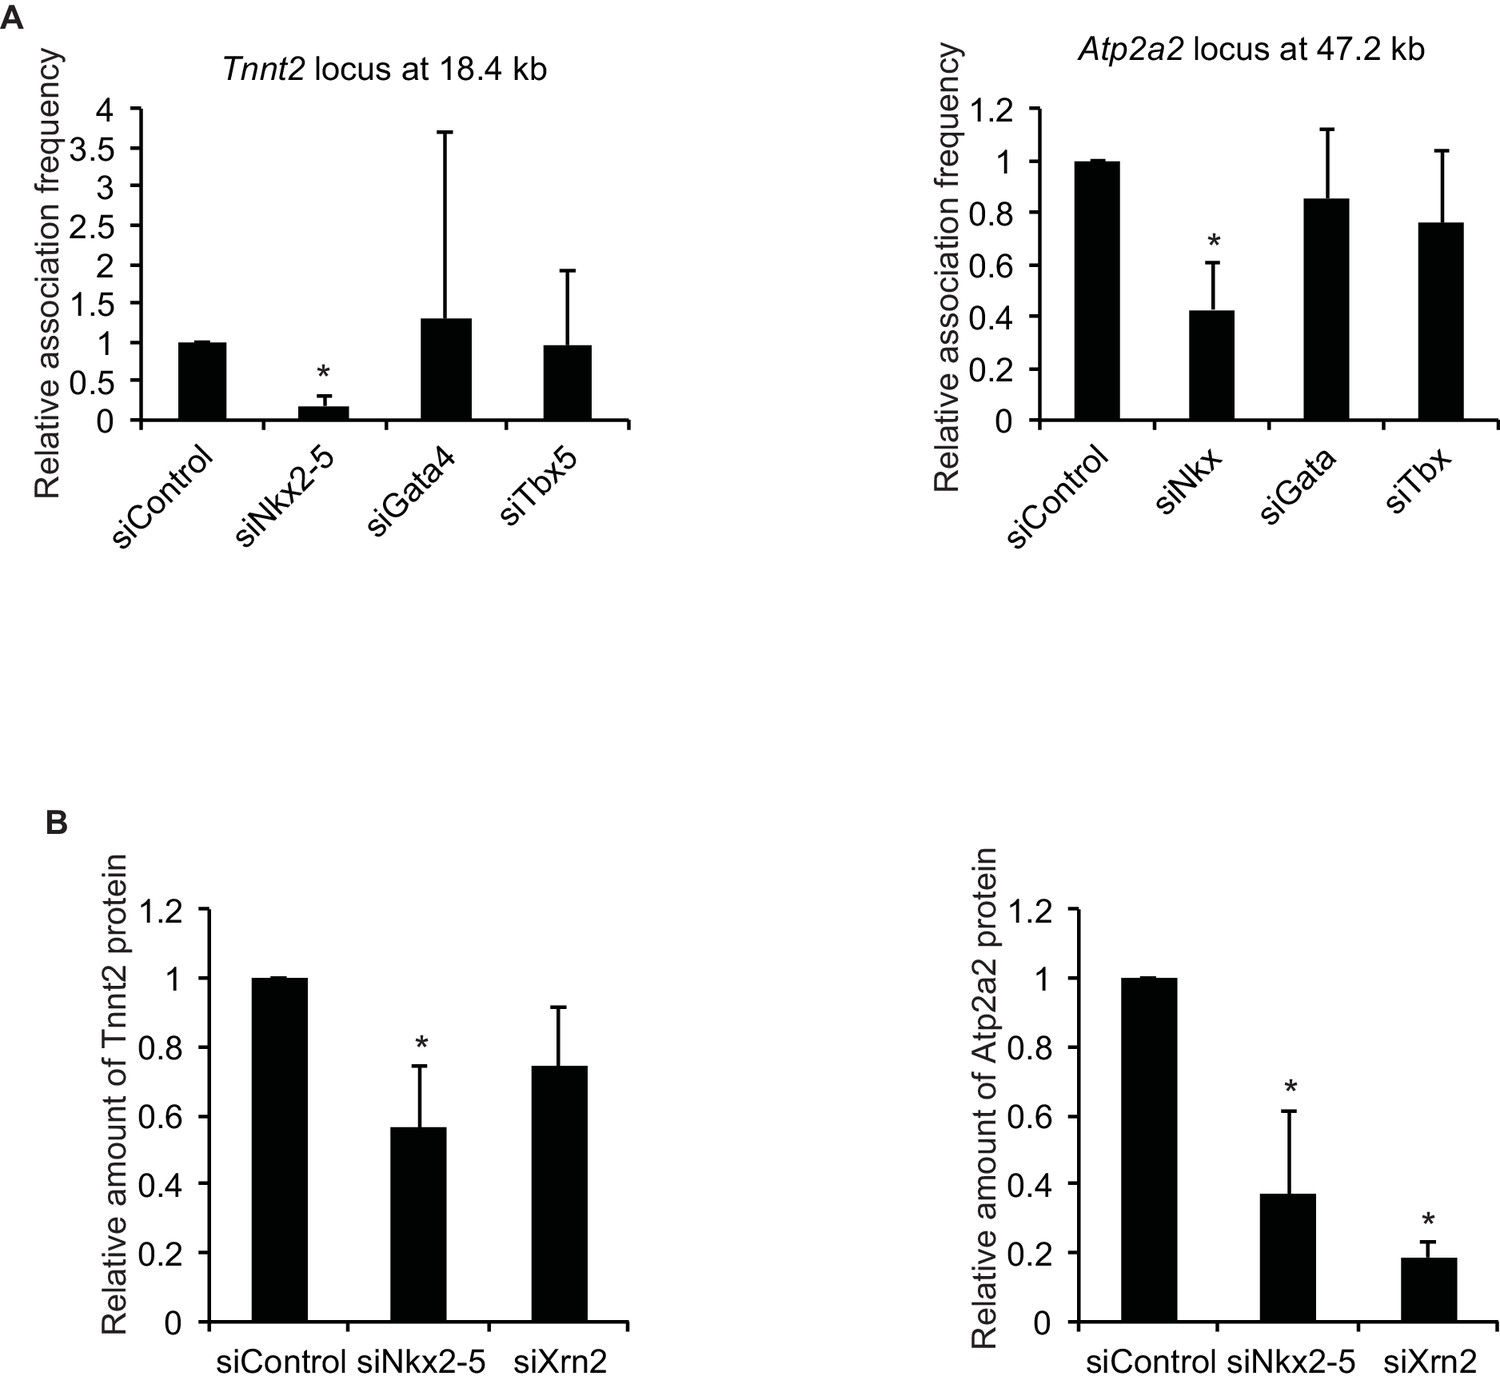
(A) Quantification of 3C data by qPCR at Figure 2A. Tnnt2, n = 5. Atp2a2, n = 4. *, p < 0.05. (B) Quantification of western blotting data at Figure 4H. n = 3. *, p < 0.05, compared to siControl.
Figure 2—figure supplement 2
The chromatin conformation of Tnni1 is independent of Nkx2-5.
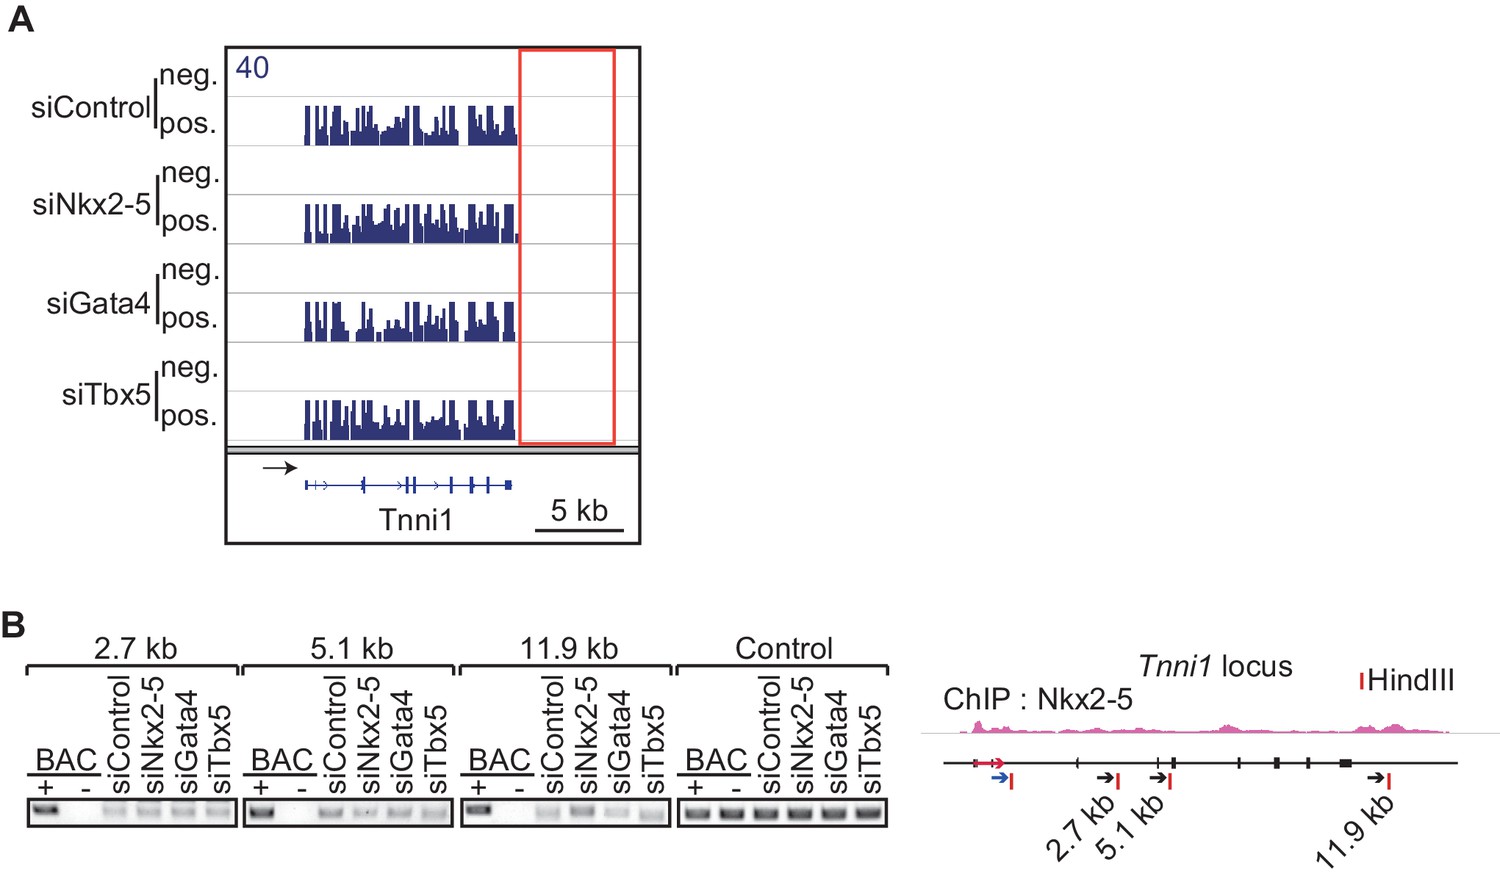
(A) Genome browser representation of strand-specific RNA-seq tag counts from eCMs transfected with the indicated siRNAs. neg., negative strand; pos., positive strand. (B) Chromatin conformation capture analysis of the TSS and the downstream region of Tnni1 in the indicated siRNA-treated eCMs. BACs corresponging to the region were used as a control. Red arrow, direction of gene; blue arrow, anchoring primer; black arrow, primer; red line, restriction enzyme site.
Figure 2—figure supplement 3
siRNA knockdown efficiencies of three different siRNAs for each gene.
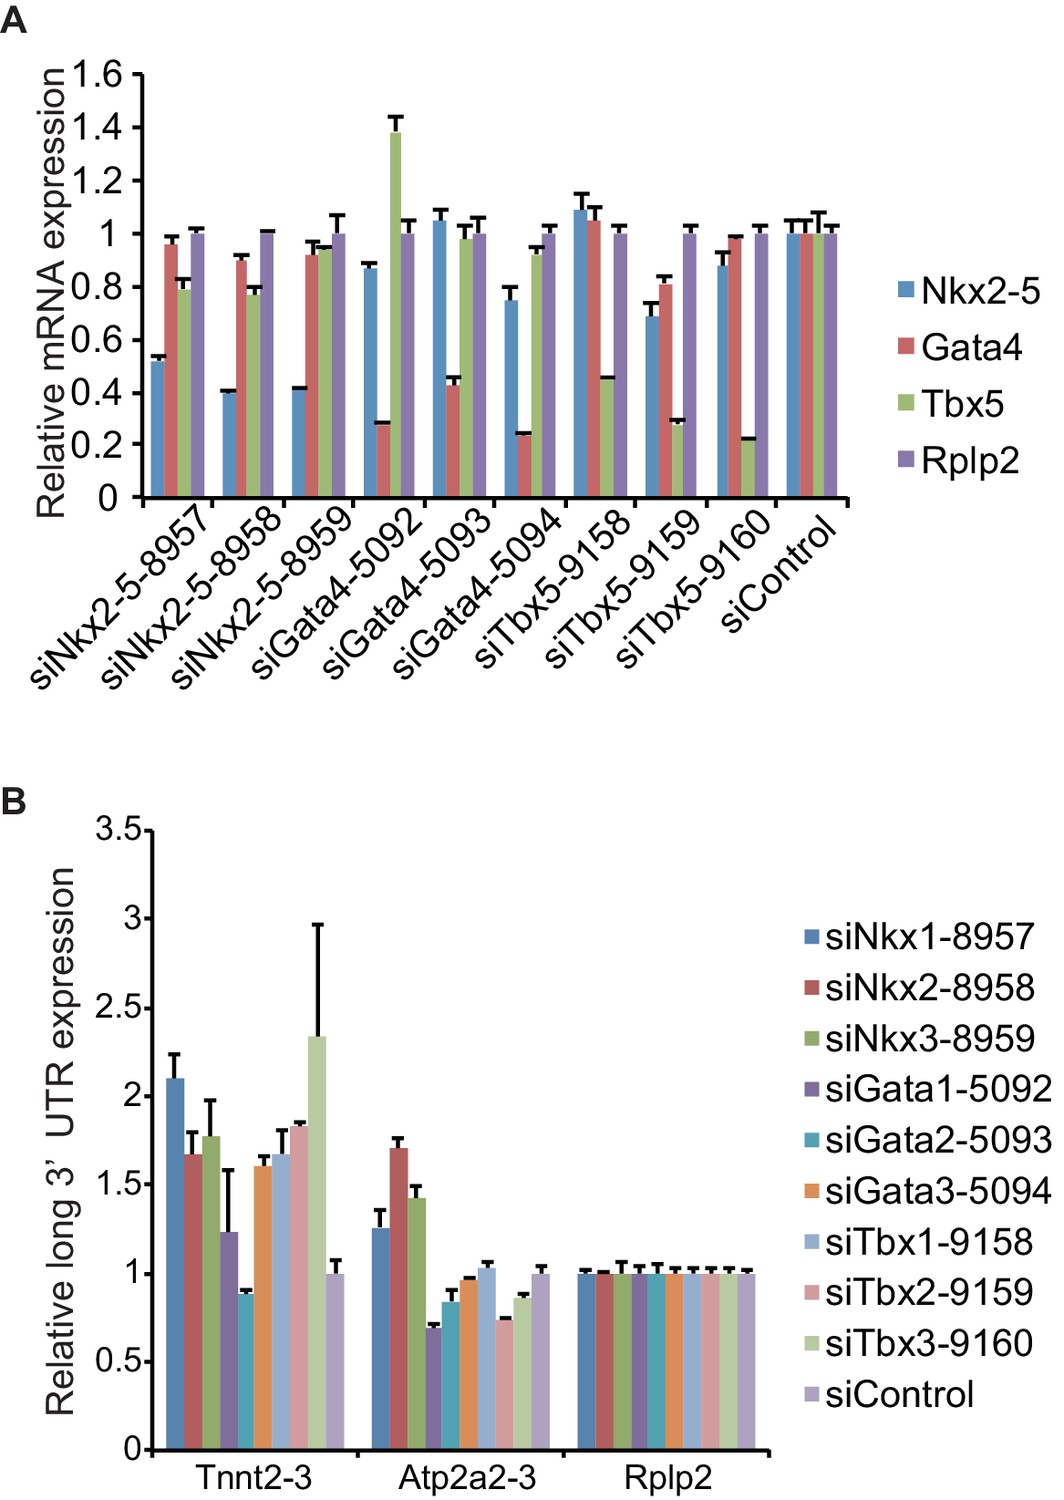
(A) eCMs were transfected with three different siRNAs for each gene, and the expression level of Nkx2-5, Gata4, and Tbx5 was measured by real-time PCR. Expression values were normalised against Rplp2 relative to control siRNA-treated eCMs. (B) Quantitative RT-PCR analysis of read-through RNA expression in eCMs transfected with the indicated siRNAs. Error bars indicate the mean ± s.e.m. (n = 3). siNkx2-5-8958, siGata4-5094, and siTbx5-9160 were used in this study because these siRNAs most efficiently reduced the expression of each target gene and minimally affect the expression of other genes.
Figure 2—figure supplement 4

Functional annotations of genes with increased and decreased mRNA with long 3’UTR.
(A) The knockdown of Nkx2-5, Gata4, and Tbx5 in eCMs was analysed by Western blotting. siNkx2-5, Nkx2-5 siRNA; siTbx5, Tbx5 siRNA; siGata4, Gata4 siRNA; WT, wild type. (B, C) Enriched gene ontologies in eCMs (for up-regulated genes: siNkx2-5,89 genes; siTbx5, 58 genes; siGata4, 182 genes. for down-regulated genes: siNkx2-5, 12 genes; siTbx5, 9 genes; siGata4, 13 genes) and E9.5 Nkx2-5-/- hearts (up-regulated genes, 200 genes; down-regulated genes, 90 genes) are shown. N.D., not detected. The p value is plotted on the x-axis.
Figure 3
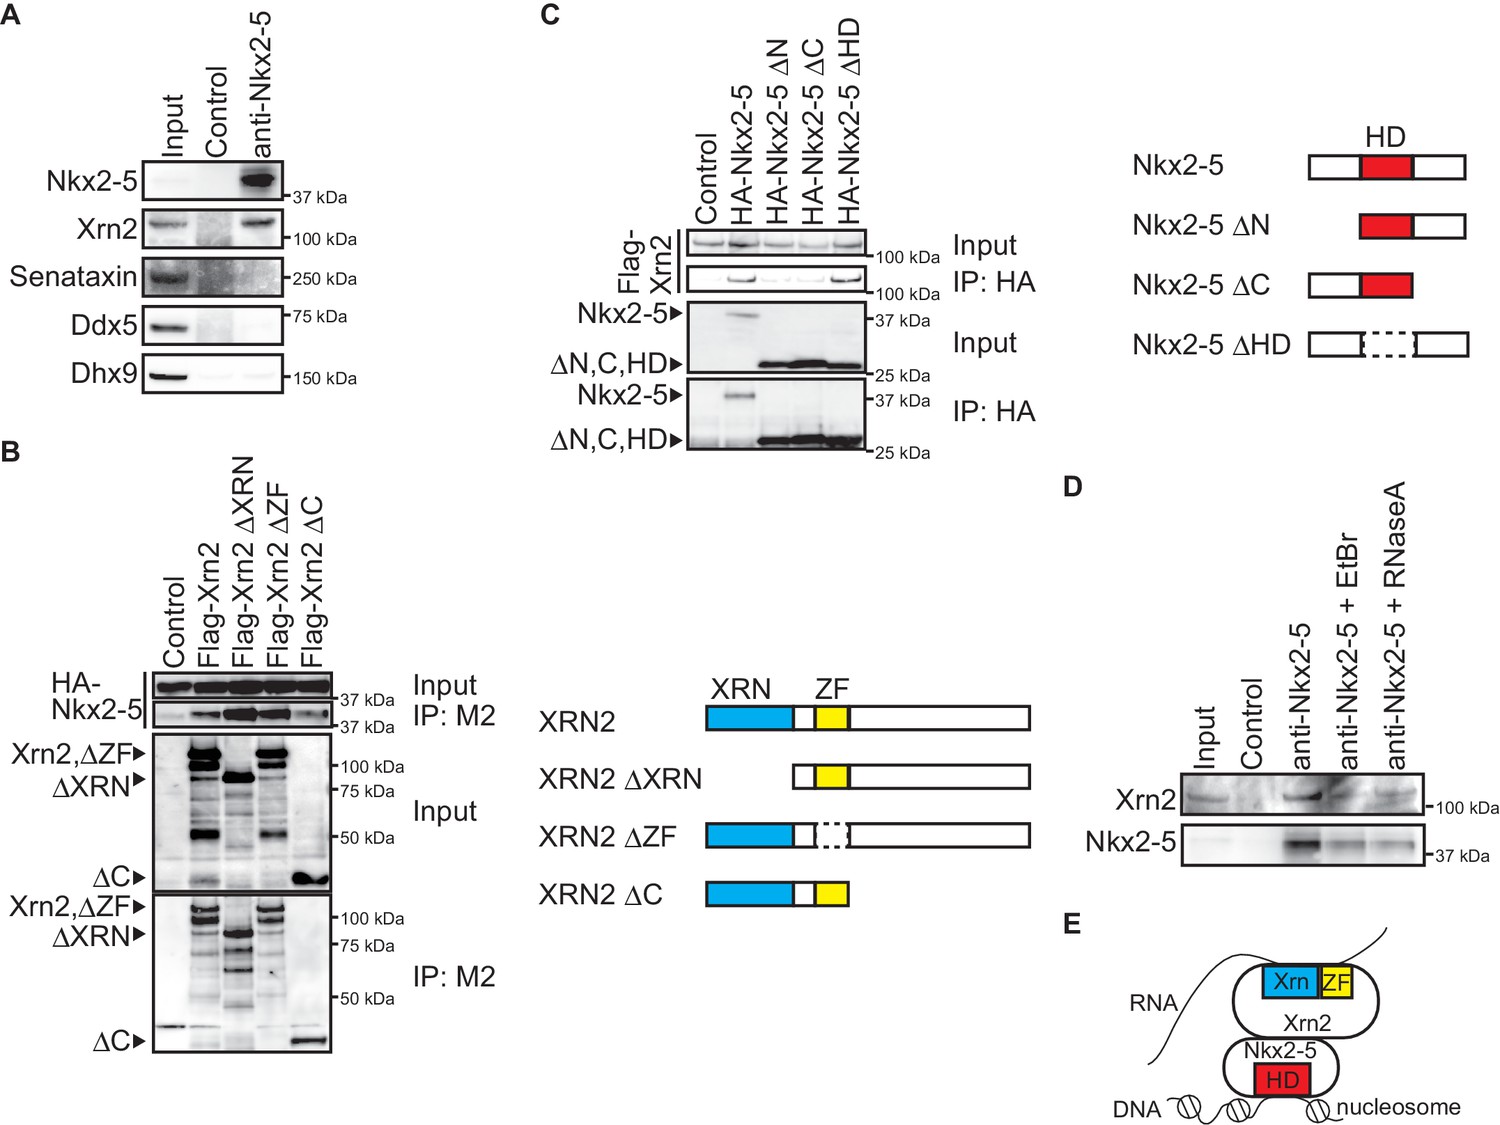
Nkx2-5 associates with the 5’-3’ exonuclease Xrn2.
(A) Co-immunoprecipitates derived using the indicated antibodies from nuclear extracts of E12.5 hearts and aliquots (6%) of the input proteins were analyzed by Western blotting. (B) Xrn2 and Nkx2-5 deletion mutants were transfected into C3H10T1/2 cells. Co-immunoprecipitates derived using the M2 antibody and aliquots (7%) of the input proteins were analyzed by Western blotting. Schematic presentation of Xrn2 and its deletion mutants is shown at the right panel. (C) Nkx2-5 and Xrn2 deleting mutants were transfected into C3H10T1/2 cells. Co-immunoprecipitates derived using the HA antibody and aliquots (7%) of the input proteins were analyzed by Western blotting. Schematic presentation of Nkx2-5 and its deletion mutants is shown at the right panel. (D) Co-immunoprecipitates derived using the indicated antibodies from nuclear extracts of E12.5 hearts exposed to 20 µg/ml EtBr or 50 µg/ml RNaseA as well as aliquots (6%) of the input proteins were analyzed by Western blotting. (E) Summary of interacting regions between Nkx2-5 and Xrn2. HD, homeodomain; Xrn, Xrn domain; ZF, zinc finger.
Figure 4 with 4 supplements
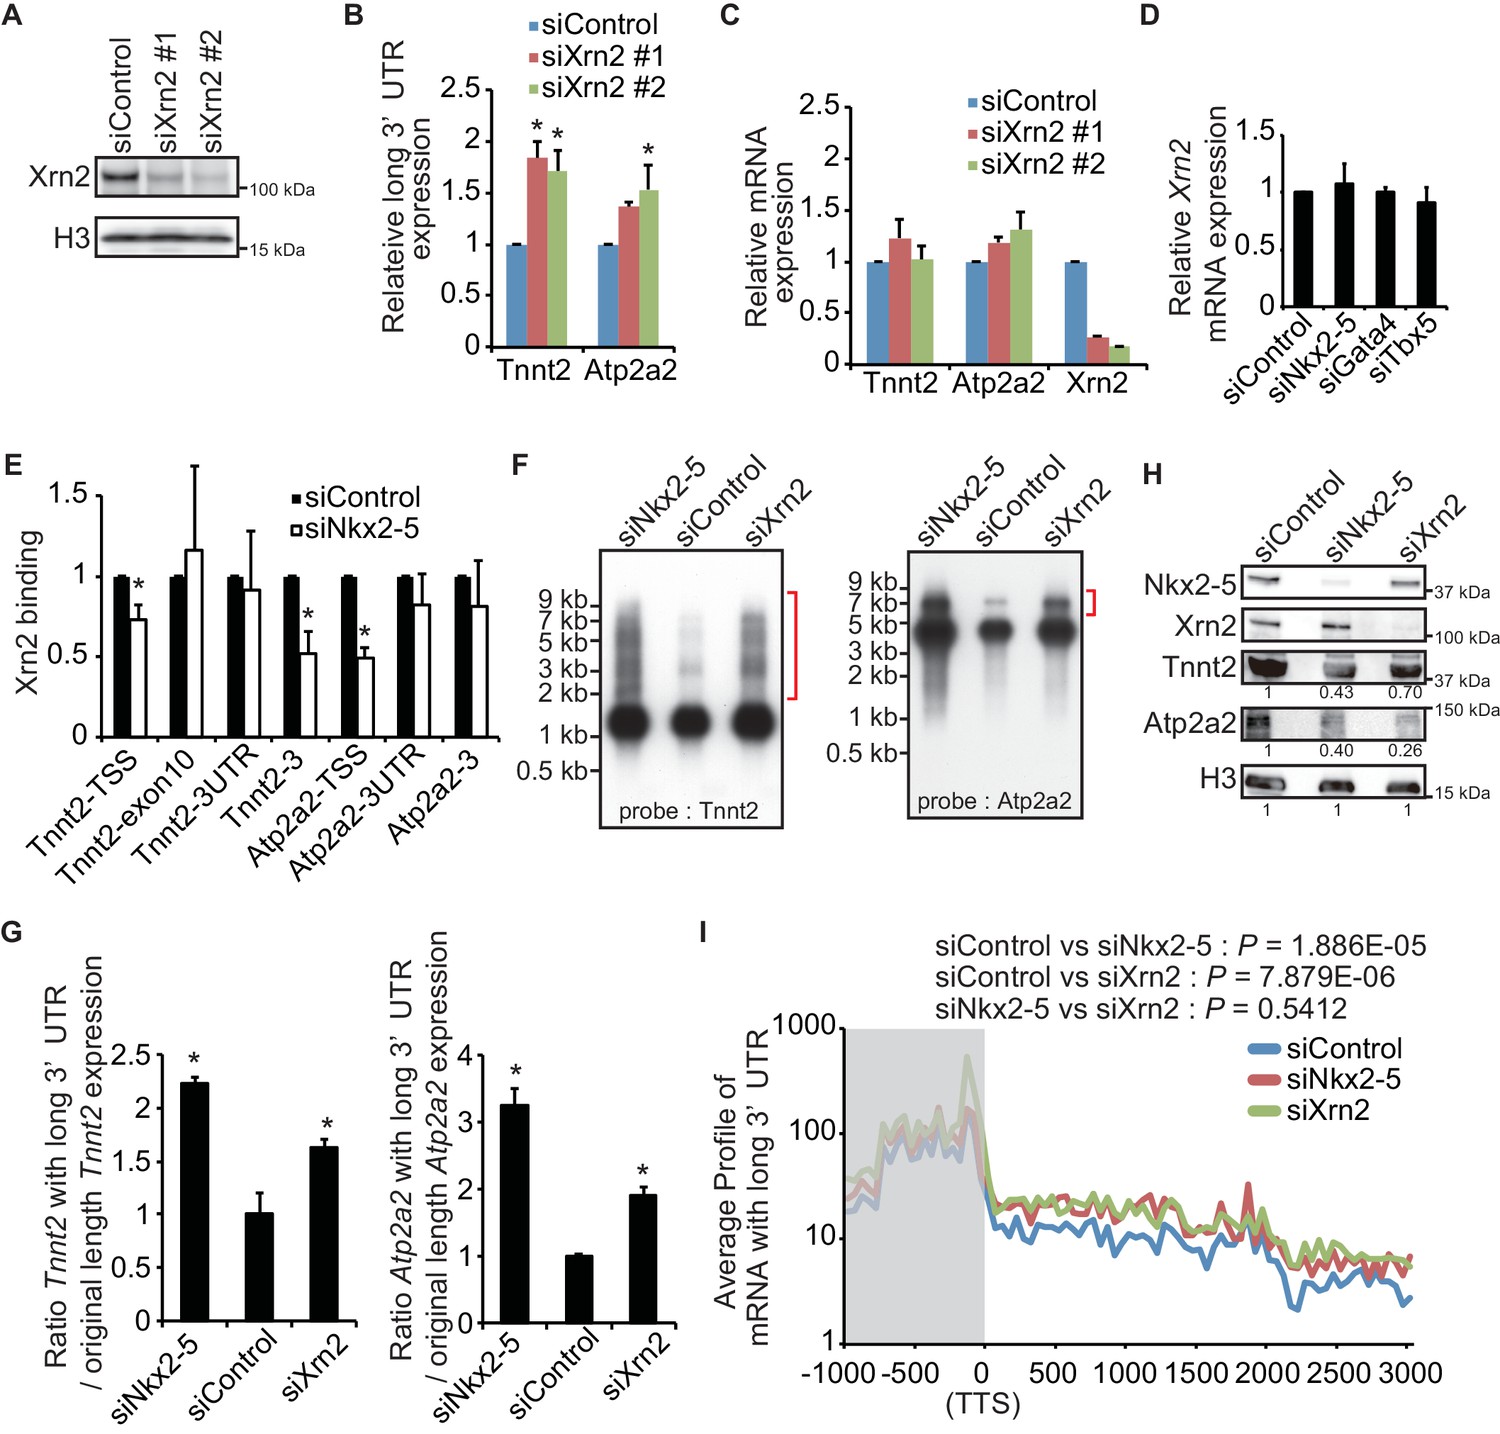
Nkx2-5 functions together with Xrn2 to regulate APA.
(A) Xrn2 knockdown was analyzed by Western blotting. (B and C) qRT-PCR analysis of mRNAs expression of the long 3’ UTRs (B) and gene bodies (C) of Tnnt2 and Atp2a2 in Xrn2-knockdown eCMs, normalized to Rplp2. (D) Xrn2 expression levels were measured by qRT-PCR and normalized to Rplp2. (E) Xrn2 binding in eCMs transfected with the indicated siRNAs was analyzed by ChIP-qPCR. The control values were set to 1.0. (F) Long 3’ UTRs in eCMs transfected with the indicated siRNA were analyzed by Northern blotting using probes against Tnnt2 and Atp2a2 mRNA. Red brackets indicate mRNAs with long 3’ UTRs. (G) The original lengths of the Tnnt2 and Atp2a2 mRNAs and the lengths of the Tnnt2 and Atp2a2 mRNAs with long 3’ UTRs that were used in the Northern blot analysis were measured by BAS5000. The ratio of the siControl was set to 1.0. (H) Tnnt2 and Atp2a2 proteins in Nkx2-5 and Xrn2 knockdown eCMs were analyzed by western blotting. (I) The average profiles of the mRNAs with long 3’ UTRs that were increased in Nkx2-5-knockdown eCMs are shown in eCMs transfected with the indicated siRNAs. The gray area indicates the coding region. Significance was assessed using the two-sample Kolmogorov-Smirnov test. For B, C, D, E, and G, error bars indicate the mean ± s.e.m. (n = 3). *, p < 0.05.
-
Figure 4—source data 1
Source data for Figure 4 and Figure 4-figure supplement 1 and 2.
Numeric data for Figure 4B,C,D,E,G, Figure 4—figure supplement 1B, Figure 4—figure supplement 2.
- https://doi.org/10.7554/eLife.16030.022
Figure 4—figure supplement 1

Knockdowns of Nkx2-5 or Xrn2 affect the expression of the long 3’UTR regions in chromatin-fractioned RNA.
(A) Genome browser representation of strand-specific chromatin-fractioned RNA-seq tag counts from eCMs transfected with the indicated siRNAs. (B) qRT-PCR analysis of mRNA expression of long 3’ UTRs of Tnnt2 and Atp2a2, normalized to Rplp2 on chromatin-fractioned RNA. Error bars indicate the mean ± s.e.m. (n = 3). *, p < 0.05. The arrow heads show polyadenylation sites.
Figure 4—figure supplement 2
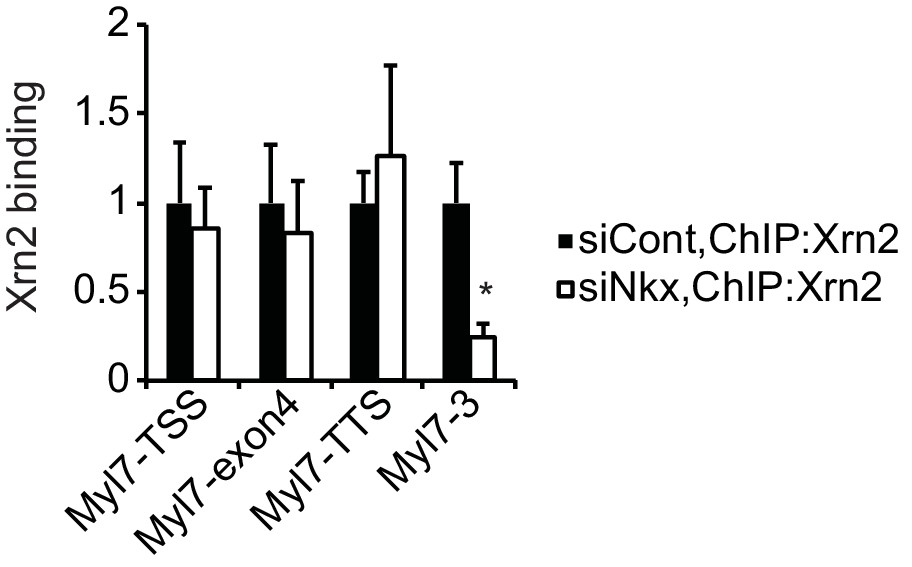
Knockdown of Nkx2-5 affects Xrn2-binding to Myl7.
Xrn2 binding in eCMs transfected with the indicated siRNAs was analyzed by ChIP-qPCR. The control values were set to 1.0. Error bars indicate the mean ± s.e.m. (n = 3). *, p < 0.05.
Figure 4—figure supplement 3
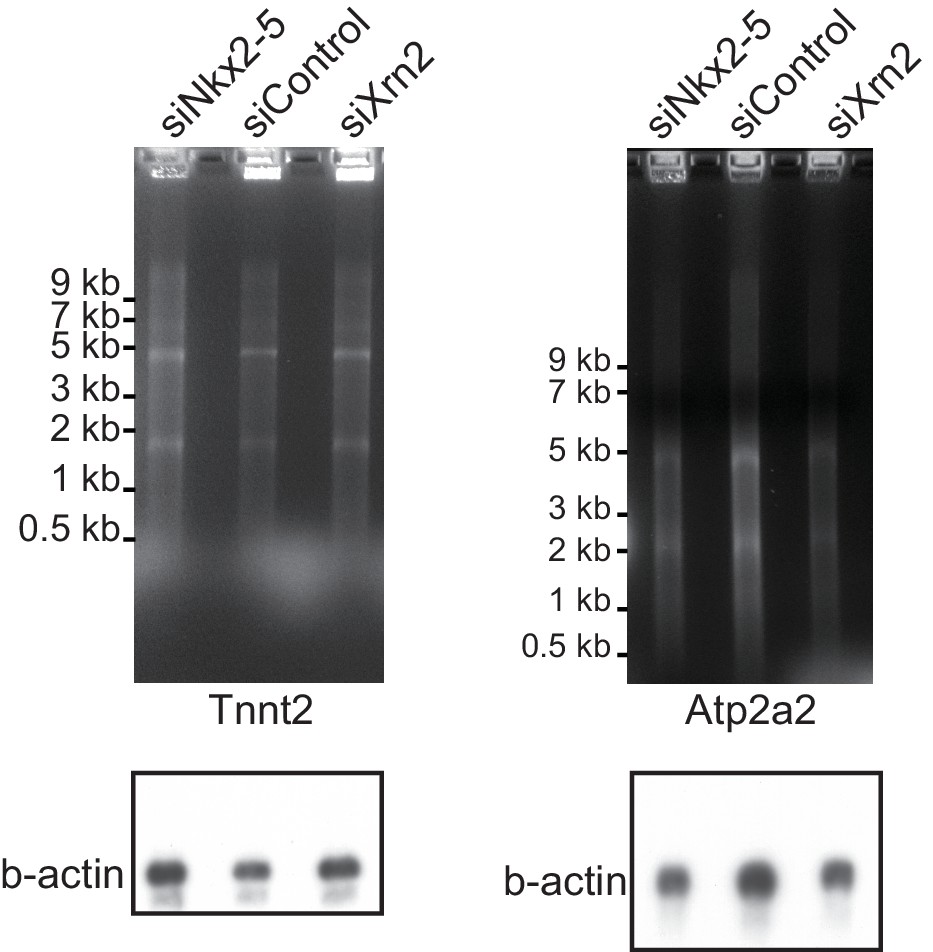
Nkx2-5 functions together with Xrn2 to regulate APA.
The EtBr staining gels and the blottings of b-actin as an internal control are shown, related to Figure 4F.
Figure 4—figure supplement 4

Correlation analysis of Nkx2-5 binding and long 3’UTR expression.
(A) The average profiles of the mRNAs with long 3’ UTRs in genes that Nkx2-5 binds to TTS (3997 genes) in eCMs transfected with the indicated siRNAs. The gray area indicates the coding region. Significance was assessed using the two-sample Kolmogorov-Smirnov test. (B) The average profiles of Nkx2-5, Gata4, and Tbx5 binding in genes that their long 3’ UTRs were increased in Nkx2-5-knockdown eCMs. (C) Correlation plot of long 3’UTR expression between indicated knockdowns and Pearson correlation, related to Figure 4I. (D) Violin plots of fold change in long 3’UTR expression with box plots.
Figure 5
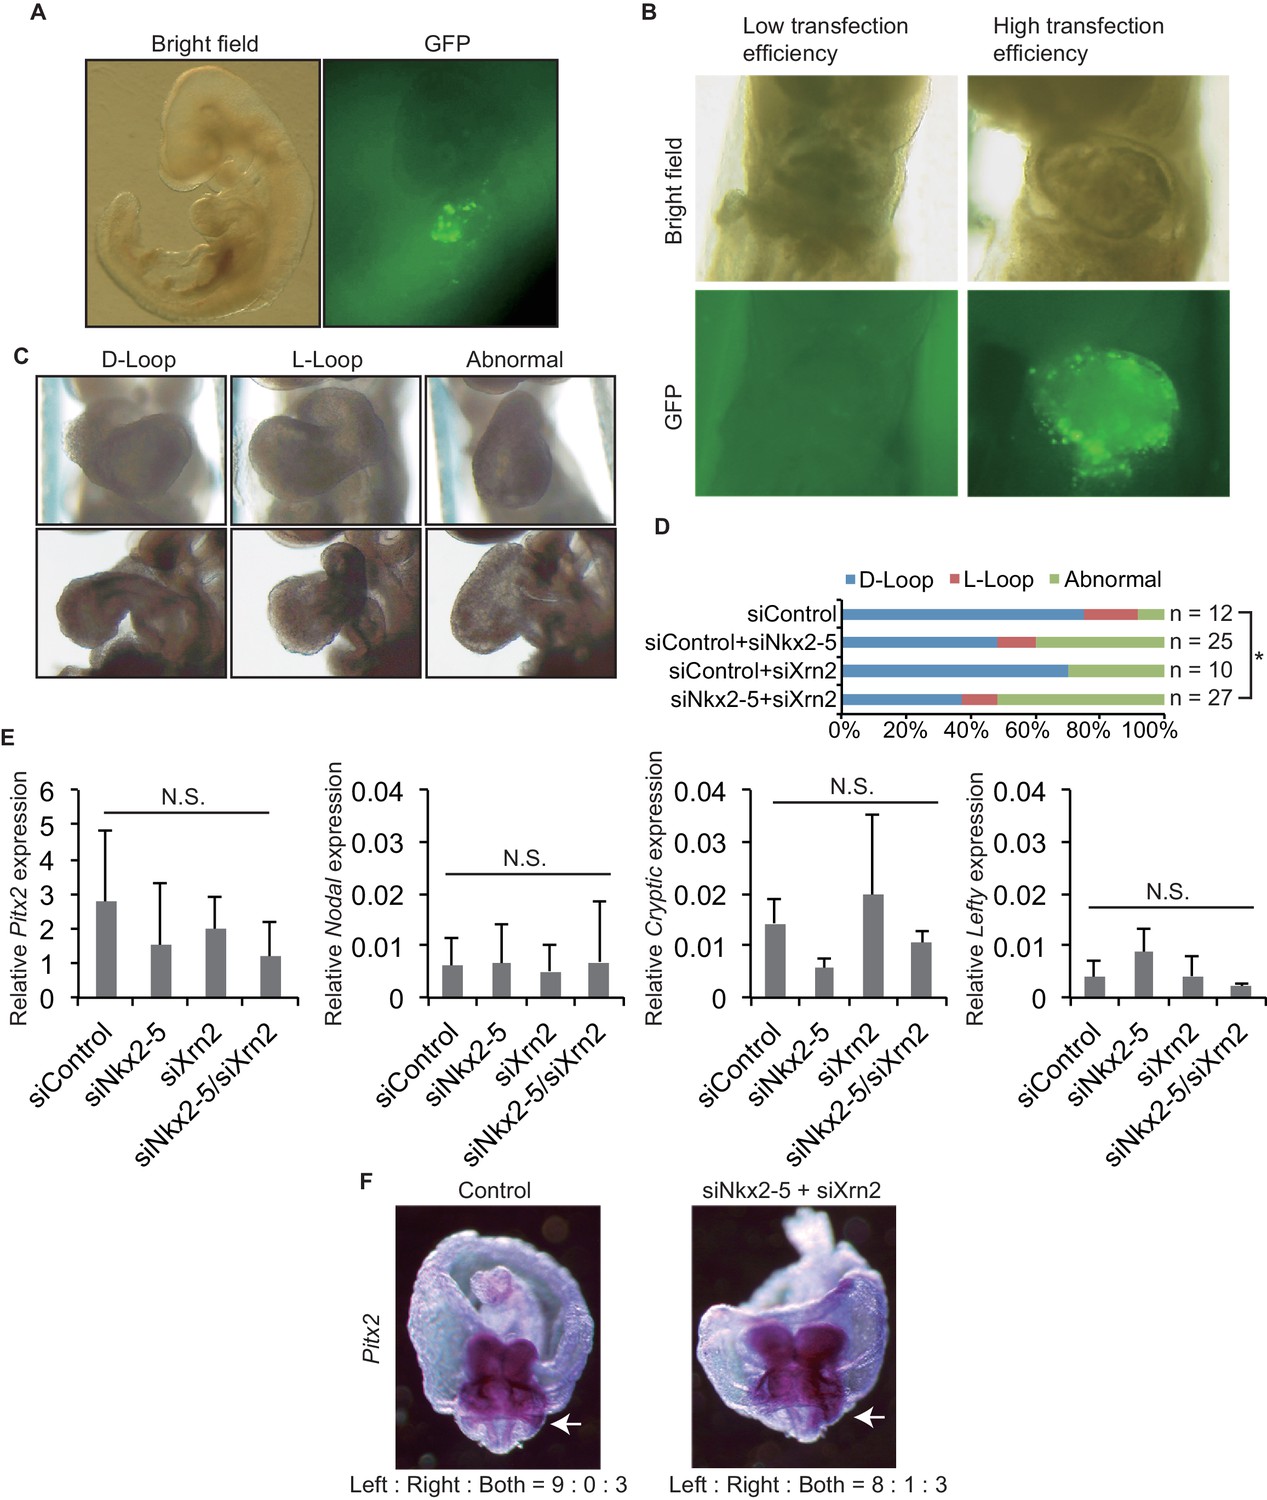
Knockdown of both Nkx2-5 and Xrn2 perturbs heart looping.
(A) Transfection of siRNA into embryonic hearts. GFP was used to detect transfected fields. (B) We discarded the embryos with low transfection efficiency. (C) Representative morphologies of heart looping. D-Loop, the normal rightward loop; L-Loop, situs inversus; abnormal, hearts remained in an essentially linear conformation. (D) Knockdown of Nkx2–5 and Xrn2 in embryonic hearts. Graph bars indicate the% morphologies of heart looping. Significance was examined with Fisher’s exact test. *, p < 0.05. (E) Looping-related genes expression level in siRNA-transfected embryonic hearts (n = 3), normalized to Rplp2 expression level. n.s., not significant. (F) In situ hybridization of Pitx2. The numbers indicate Pitx2 expression pattern among the right side, the left side, and the both sides. White arrows indicate lateral plate mesoderm.
Figure 6 with 1 supplement
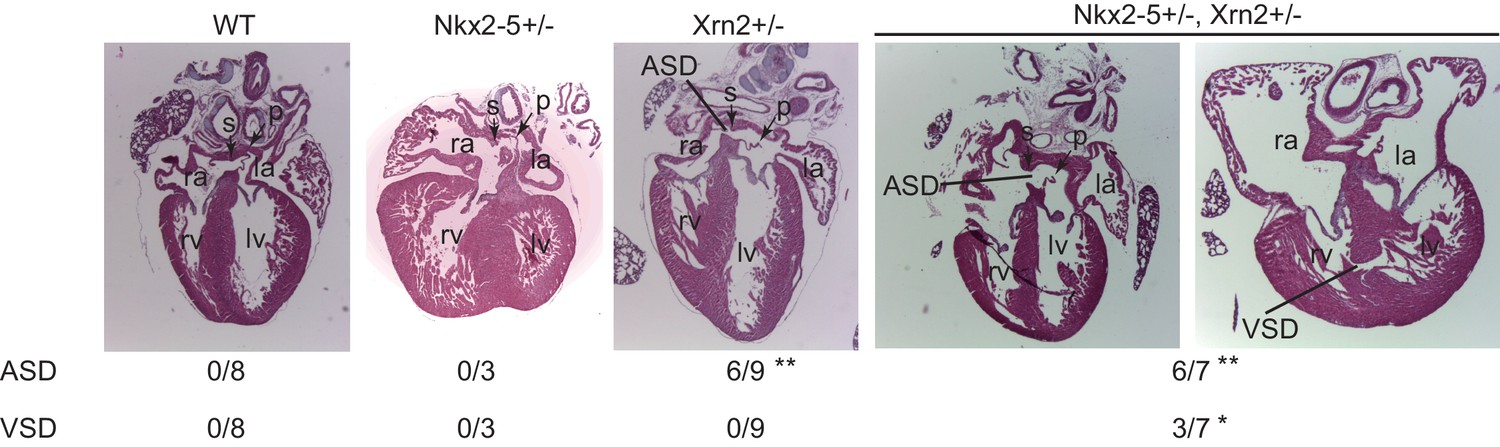
Nkx2-5 genetically interacts with Xrn2.
Histological analysis of Nkx2-5+/-and Xrn2+/- newborn hearts. Frontal sections from newborn hearts were stained with hematoxylin and eosin. ASD was observed in Xrn2+/-(n = 6 of 9) and Nkx2-5+/-Xrn2+/- (n = 6 of 7) newborns. VSD was observed in Nkx2-5+/-Xrn2+/- newborns (n = 3 of 7). lv, left ventricle; rv, right ventricle; la, left atrium; ra, right atrium; p, septum primum; s, septum secundum. *, p < 0.05. **, p < 0.01.
Figure 6—figure supplement 1
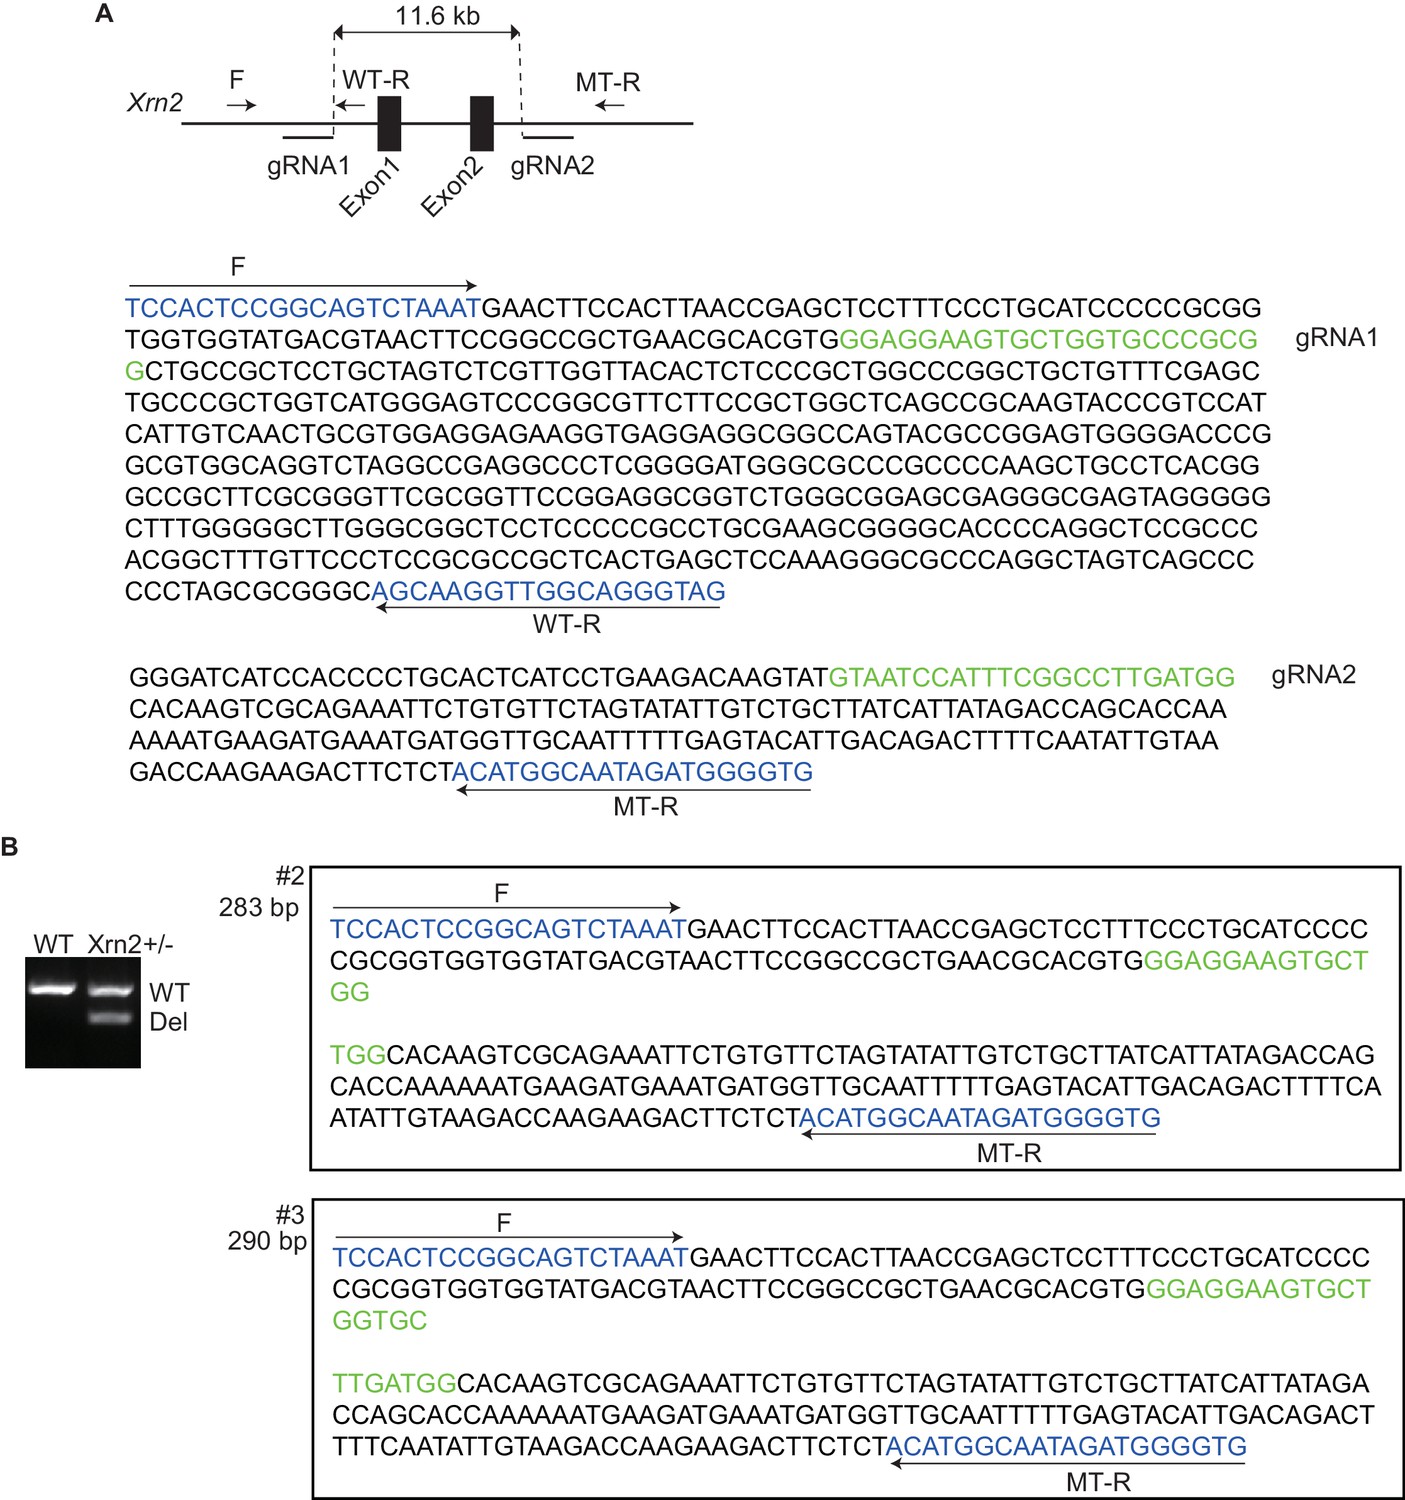
Nkx2-5 genetically interacts with Xrn2.
(A) Scheme illustrating the targeting of exon 1 and 2 in Xrn2. Two gRNAs and the Cas9 RNA were injected into fertilized eggs. F, Forward primer; WT-R, reverse primer for the wild-type allele; MT-R, Reverse primer for the deleted allele. The genomic sequences around the gRNAs are shown. (B) Genotyping of Xrn2+/- mice obtained from crossing Xrn2 F0 and wild-type mice. Sequences of two deleted alleles (#2 and #3) are shown. WT, wild-type allele, 582 bp; Del, deleted allele #2 is 283 bp and #3 is 290 bp.
Author response image 1
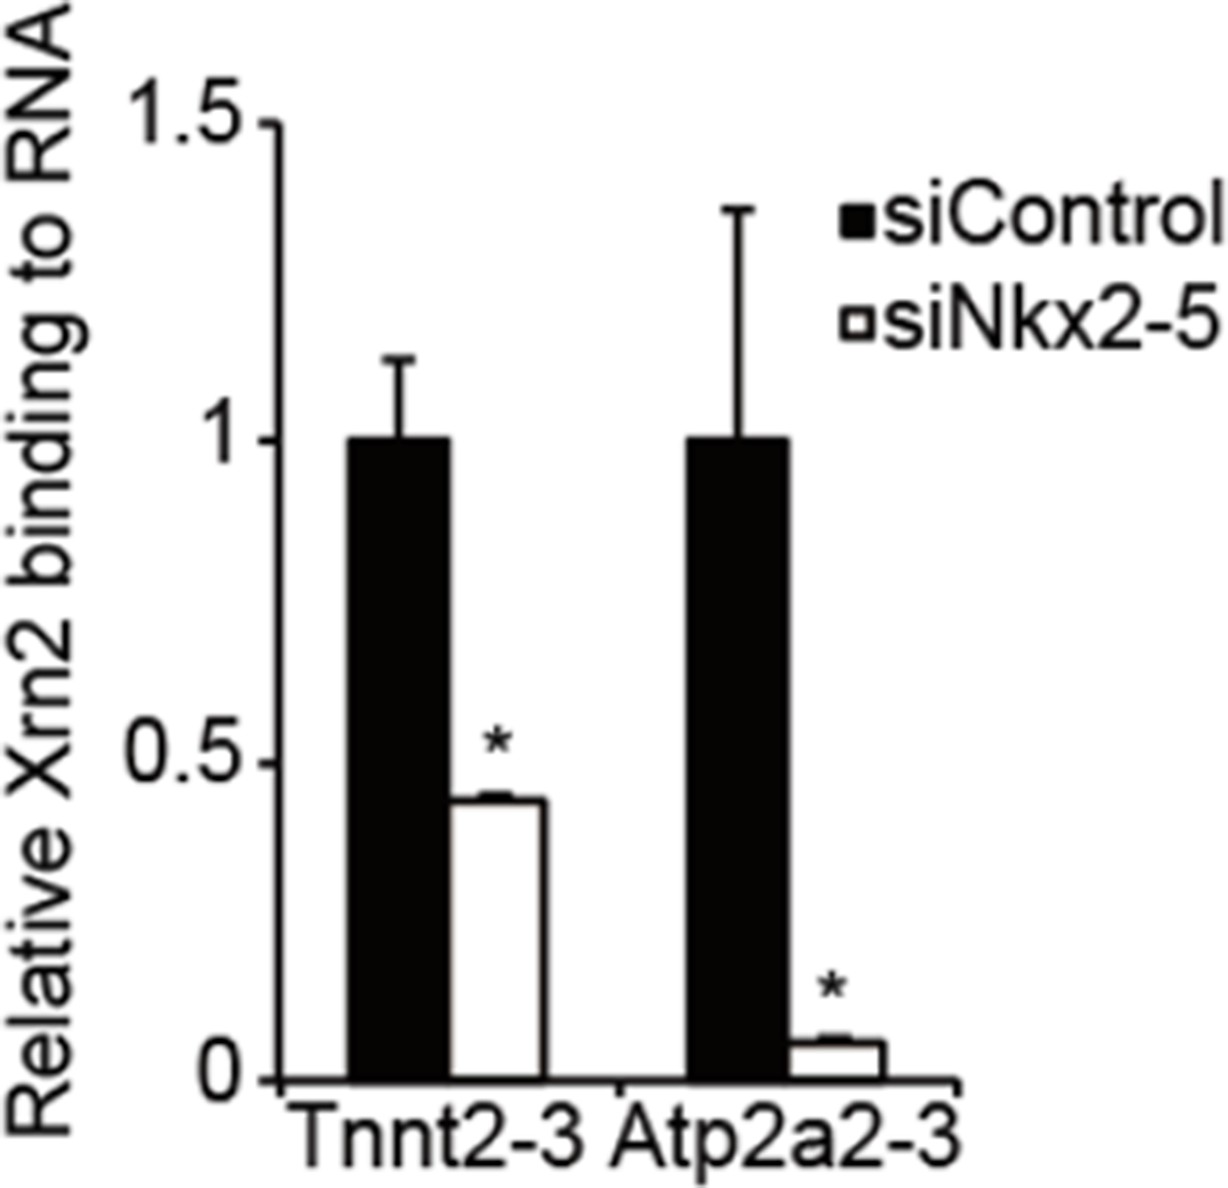
RNA-immunoprecipitation analysis of Xrn2 in eCMs.
Relative Xm2-binding to mRNA at the downstream regions (-3) of Tnnt2 (18.4 kb) and Atp2a2 (47.2 kb)was analyzed by RIP in eCMs transfected the indicated siRNAs. The mRNA of long 3’ UTRs of Tnnt2 and Atp2a2 values were normalized to input. The control values were set to 1.0. Error bars indicate the means ± s.e.m. (n = 3). *, p<0.05.
Additional files
-
Supplementary file 1
Lists of mapping results, primers, and antibodies.
(A) Mapping results of ChIP-seq . (B) Mapping results of RNA-seq. (C) Primers used in this study. (D) Antibodies used in this study.
- https://doi.org/10.7554/eLife.16030.030
Download links
A two-part list of links to download the article, or parts of the article, in various formats.
Downloads (link to download the article as PDF)
Open citations (links to open the citations from this article in various online reference manager services)
Cite this article (links to download the citations from this article in formats compatible with various reference manager tools)
Regulation of alternative polyadenylation by Nkx2-5 and Xrn2 during mouse heart development
eLife 5:e16030.
https://doi.org/10.7554/eLife.16030


