Dissection of the interaction between the intrinsically disordered YAP protein and the transcription factor TEAD
- Novartis Institutes for Biomedical Research, Switzerland
Figures
Figure 1
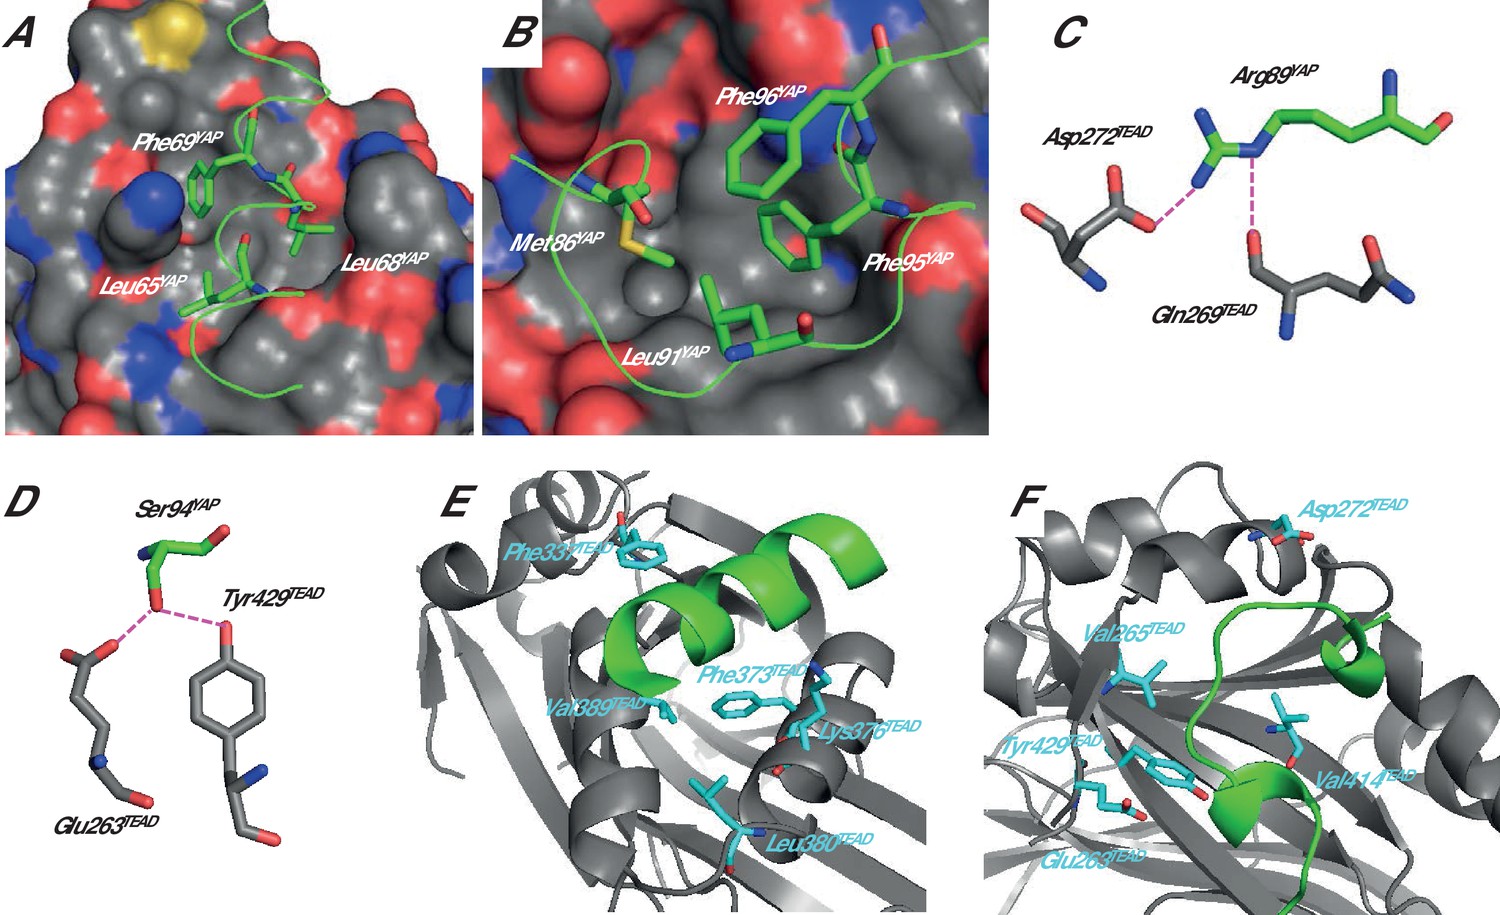
Structure of the YAP:TEAD complex.
The α-helix (A) and Ω-loop (B) binding interfaces. The surface of TEAD is represented and green ribbons indicate the α-helix (A, region 61–73) or the Ω-loop (B, region 85–99) of YAP. The different YAP residues that have been mutated are indicated. Interactions between hYAP Arg89 and TEAD (C) and between hYAP Ser94 and TEAD (D). The hydrogen bonds are represented by dotted purple lines. The TEAD α-helix (E) and Ω-loop (F) binding pockets. TEAD and YAP are represented by gray and green ribbons, respectively. The mutated TEAD residues for which a Kdeq has been measured are represented in cyan. These figures are drawn from the pdb structure 3KYS (Li et al., 2010). TEAD residues are labeled according to hTEAD4 primary sequence.
Figure 2 with 1 supplement
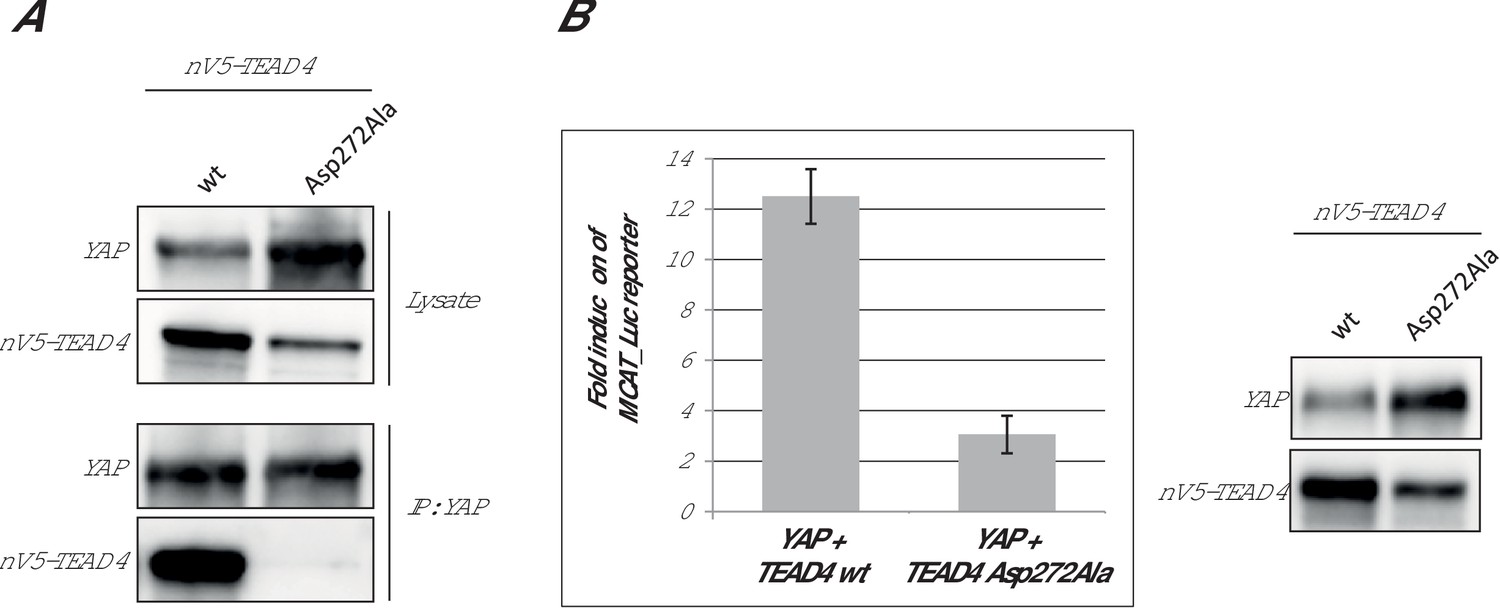
Effect of the hTEAD4 Asp272Ala mutation in cells.
(A) Co-immunoprecipitation: N-terminally V5-tagged hTEAD4 (wild-type (wt) or Asp272Ala mutant) were co-transfected with wt hYAP into HEK293FT cells. YAP was immunoprecipitated, and co-immunoprecipitated nV5-TEAD4 was determined by anti-V5 Western Blot. (B) MCAT_Luc reporter assay: N-terminally V5-tagged TEAD4 (wt or Asp272Ala mutant) were co-transfected with wt hYAP into the HEK293::MCAT_Luc reporter model. Resazurin-normalized luciferase activity was measured and is plotted as fold induction over baseline. YAP and nV5-TEAD expression levels were determined in parallel by Western Blot. The expression level of hTEAD4 Asp272Ala mutant versus wt hTEAD4 was quantified by Image J software to be reduced by a factor of approx. 1.6, indicating that the approximate fourfold reduction in MCAT_Luc reporter signal cannot be solely attributed to expression differences, but does truly reflect a reduced activity of the hTEAD4 Asp272Ala mutant.
Figure 2—figure supplement 1
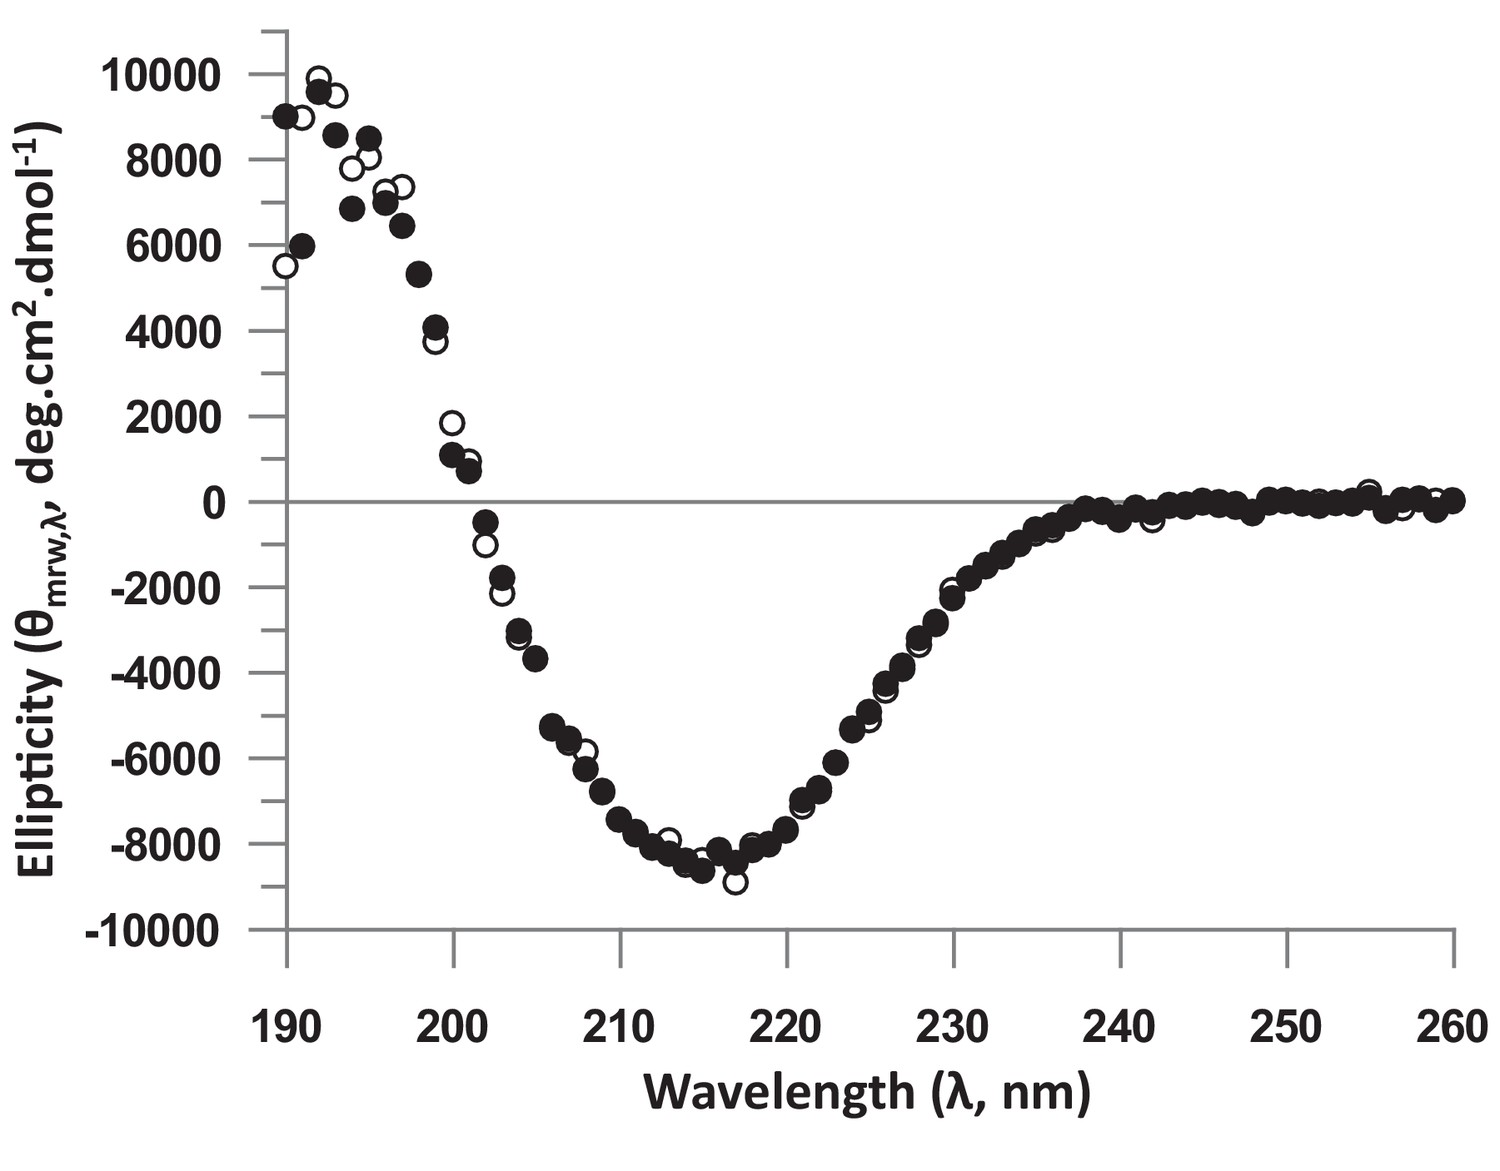
Analysis of the structure of the unbound hTEAD4 Asp272Ala mutant protein by Circular Dichroism (CD).
Proteins were dialyzed in 20 mM phosphate buffer pH 7.4, 100 mM KF, 0.25 mM TCEP and diluted in this buffer to 0.2 mg.mL−1. CD spectra were recorded on a J-815 spectropolarimeter (Jasco (France); 1 mm path length quartz cell, ‘standard’ sensitivity, 0.5 nm bandwidth, 10 nm.min−1 scanning, 2 s digital integration time, 1 nm step resolution). The measuring chamber was maintained in nitrogen (17 L.min−1). Each spectrum was recorded as an average of 4 scans to reduce noise. After baseline correction, the mean residue ellipticity was calculated [θ]MRW,λ = MRW.θλ/10.d.c, where MRW is the mean residue weight (MRW = M/(N-1)), M is the molecular mass of the protein, N is the number of amino acids in the protein, θλ is the observed ellipticity (degrees) at wavelength λ, d is the path length (cm) of the cell, and c is the protein concentration (g.ml−1). The figure represents the CD spectra of wt (white circles) and Asp272Ala (black circles) hTEAD4217-434.
Figure 3
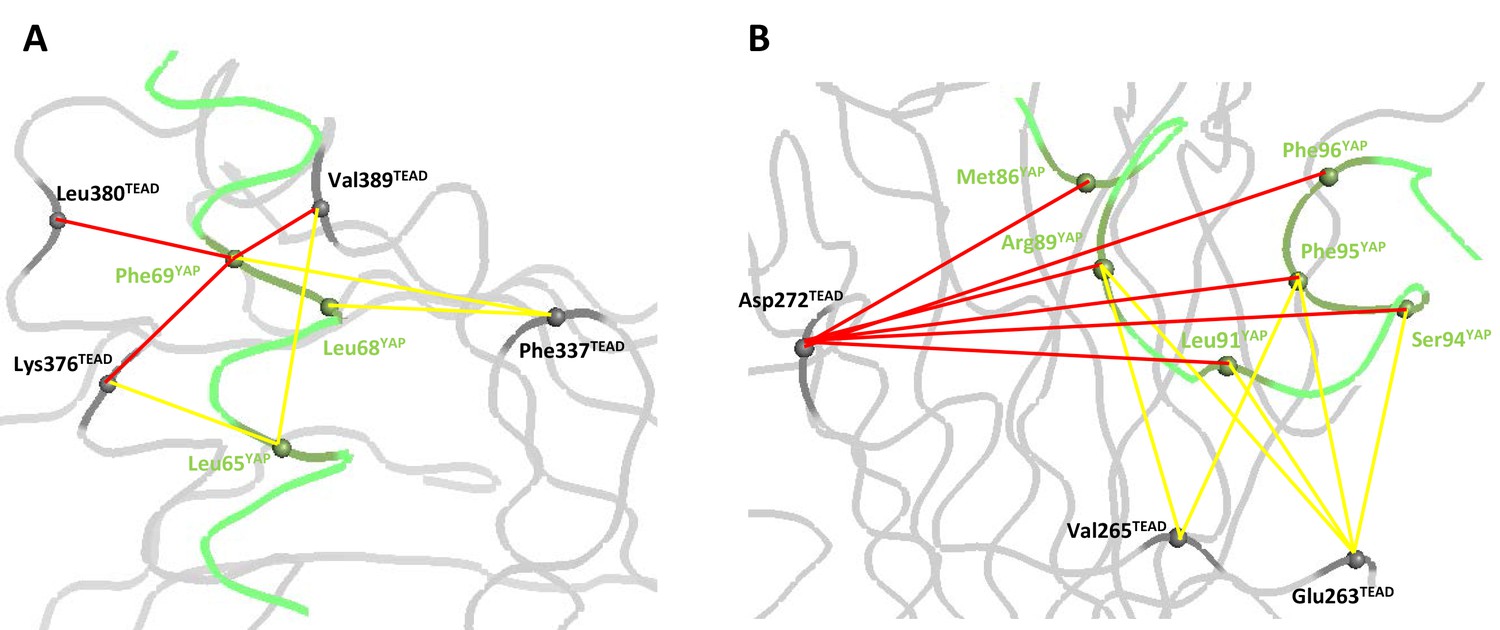
Coupling energies at the α-helix and Ω-loop binding pockets.
(A) α-helix interface. (B) Ω-loop interface. The gray and green ribbons represent the main polypeptide chain of TEAD and YAP, respectively. The Cα of the mutated amino acids are represented by spheres. The coupling energies (ΔΔGint) between the different residues are symbolized by lines. Yellow lines: −1 kcal/mol < ΔΔGint < −0.5 kcal/mol. Red lines: ΔΔGint < −1 kcal/mol.
Figure 4 with 1 supplement
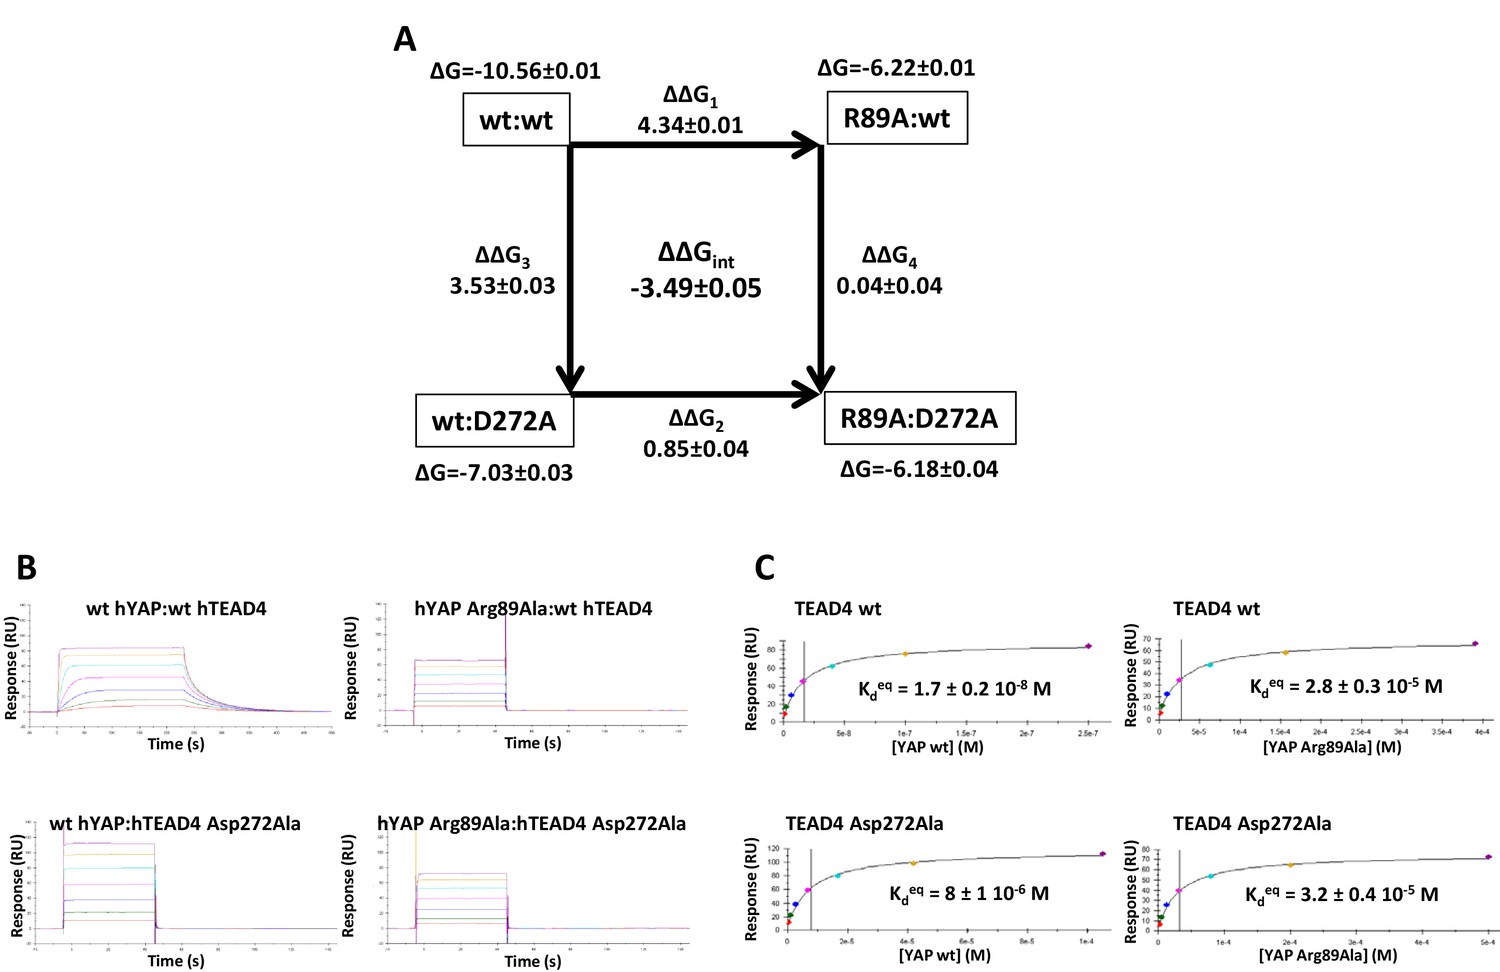
Double mutant cycle for the hYAP Arg89:hTEAD4 Asp272 interaction.
(A) The binding energies (kcal/mol) measured for the different pairwise interactions are indicated in boxes, and the differences between these binding energies (ΔΔG1-4) are shown. The coupling energy (ΔΔGint = ΔGwt:wt + ΔGR89A:D272A – ΔGR89A:wt – ΔGwt:D272A) is indicated (kcal/mol). Standard errors (SE) are given. (B) Representative sensorgrams of the Surface Plasmon Resonance experiments carried out to establish the double mutant cycle presented on A. wt or Asp272Ala hTEAD4 were immobilized on sensor chips and the binding of different concentrations of analyte (hYAP wt or Arg89Ala) was measured. Kd values were measured at equilibrium (Kdeq). The contact time in the experiments was varied according to the affinity of each of the YAP proteins. (C) Binding isotherms obtained from the sensorgrams presented on B. The experiments were fitted with the Biacore T200 evaluation software using a one site binding with background model. The Kdeq values and the standard error (SE) from the fit are indicated.
-
Figure 4—source data 1
The double mutant cycles established in this study.
The double mutant cycles have been grouped by hYAP residues. For explanations, see Figure 3 legend in the main text. The binding energies are in cal/mol and the standard errors (SE) are indicated.
- https://doi.org/10.7554/eLife.25068.010
Figure 4—figure supplement 1
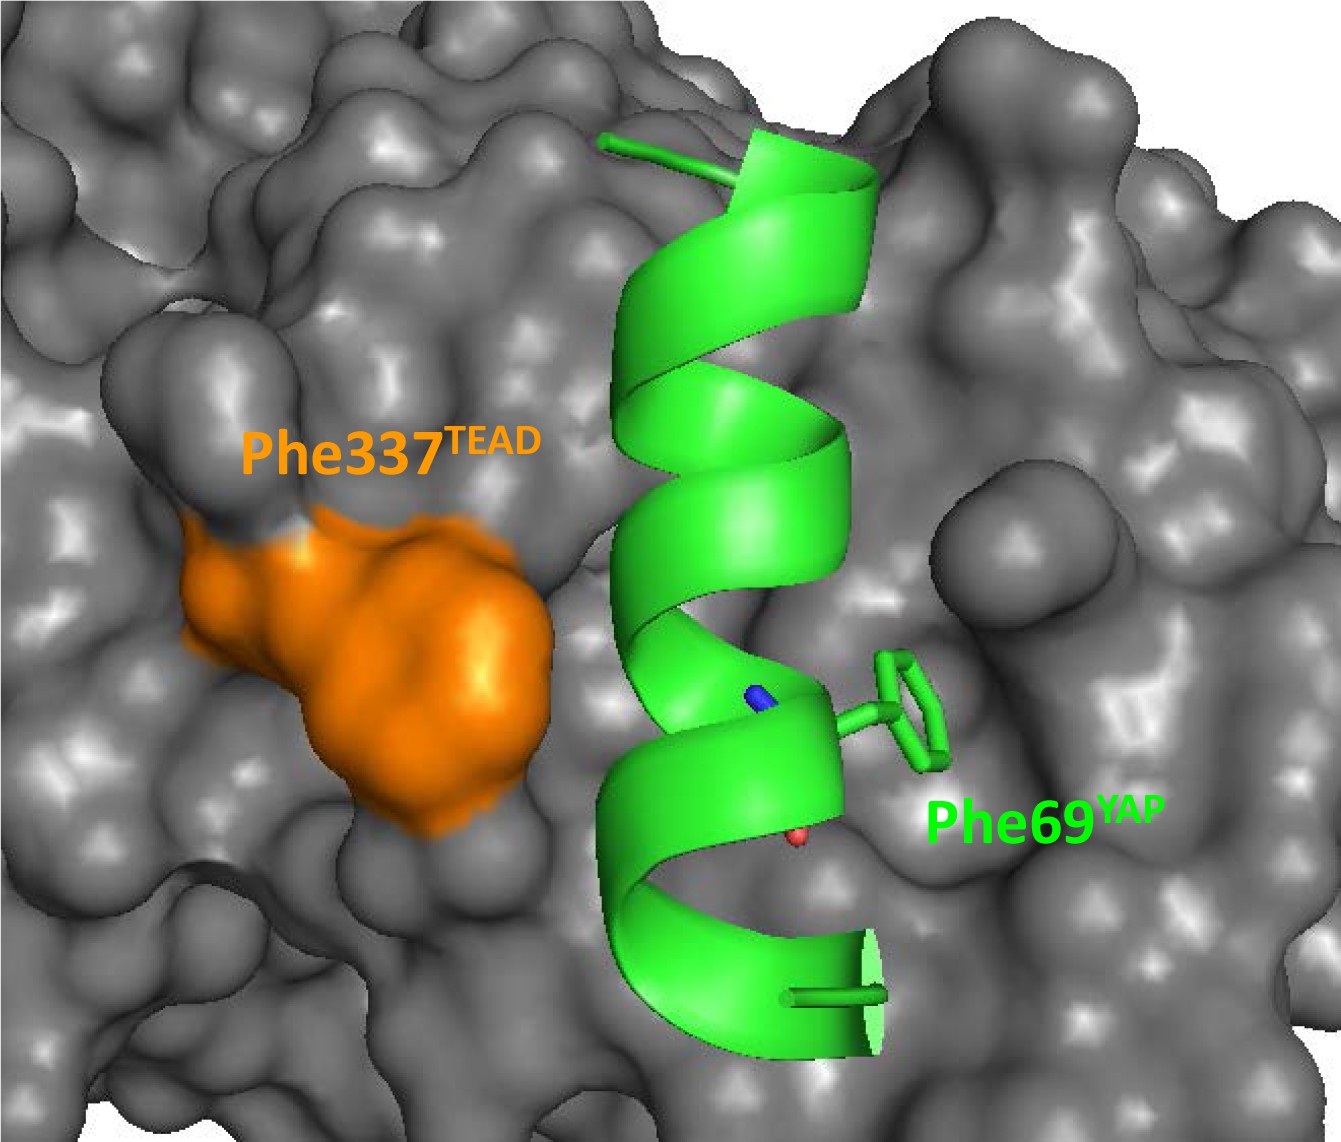
Position of hYAP Phe69 and hTEAD4 Phe337 at the α-helix binding pocket.
The α-helix (region 61–73) of YAP is represented by a green ribbon and hYAP Phe69 is indicated. The surface of TEAD is in gray and hTEAD4 Phe337 in orange. This figure was drawn from the pdb structure 3KYS (Li et al., 2010).
Tables
Table 1
Binding affinities of the different YAP50-151 proteins for wt hTEAD4217-434. The affinities were measured at 298°K by Surface Plasmon Resonance in n ≥ 3 independent experiments. N-Avitagged hTEAD4217-434 was immobilized on sensor chips. The Kd values were obtained from equilibrium data (Kdeq). Averages and standard errors (SE) are given. ΔΔG = ΔGmutant – ΔGwt and SEΔΔG = (SEΔGmutant2 + SEΔGwt2)1/2.
| Mutation site | YAP50-171 | Kdeq (nM) | ΔG (kcal/mol) | ΔΔG (kcal/mol) |
|---|---|---|---|---|
| Wild type | 18 ± 0 | −10.56 ± 0.01 | ||
| α-helix | Leu65Ala | 794 ± 4 | −8.31 ± 0.01 | 2.24 ± 0.01 |
| Leu68Ala | 464 ± 4 | −8.63 ± 0.01 | 1.92 ± 0.01 | |
| Phe69Ala | 6447 ± 400 | −7.08 ± 0.04 | 3.48 ± 0.04 | |
| Ω-loop | Met86Ala | 2080 ± 69 | −7.74 ± 0.02 | 2.81 ± 0.02 |
| Arg89Ala | 27423 ± 381 | −6.22 ± 0.01 | 4.34 ± 0.01 | |
| Leu91Ala | 30550 ± 2250 | −6.15 ± 0.04 | 4.40 ± 0.05 | |
| Ser94Ala | 5623 ± 341 | −7.16 ± 0.04 | 3.40 ± 0.04 | |
| Phe95Ala | 26045 ± 755 | −6.25 ± 0.02 | 4.31 ± 0.02 | |
| Phe96Ala | 4755 ± 245 | −7.25 ± 0.03 | 3.30 ± 0.03 |
Table 2
Properties of the different hTEAD4217-434 proteins. The melting temperatures (Tm) of the proteins were determined in n ≥ 3 independent experiments in a fluorescence-based thermal shift assay. Averages and standard errors (SE) are given. ΔTm = Tmmutant – Tmwt and SEΔTm = (SETmmutant2 + SETmwt2)1/2. For dissociation constant measurements, the different N-Avitagged hTEAD4217-434 proteins were immobilized on sensor chips and their affinity for wt hYAP50-171 was measured at 298°K by Surface Plasmon Resonance in n ≥ 3 independent experiments. Kd values were obtained from equilibrium data (Kdeq). Averages and standard errors (SE) are given. ΔΔG = ΔGmutant – ΔGwt and SEΔΔG = (SEΔGmutant + SEΔGwt)1/2. n. d.: not determined.
| Mutation site | hTEAD4217-434 | Tm (°C) | ΔTm (°C) | Kdeq (nM) | ΔG (kcal/mol) | ΔΔG (kcal/mol) |
|---|---|---|---|---|---|---|
| Wild type | 54.0 ± 0.1 | 18 ± 0 | −10.56 ± 0.01 | |||
| α-helix | Phe337Ala | 53.1 ± 0.1 | −0.9 ± 0.1 | 202 ± 8 | −9.12 ± 0.02 | 1.43 ± 0.02 |
| Tyr369Ala | 49.9 ± 0.2 | −4.2 ± 0.3 | n. d. | |||
| Phe373Ala | 53.0 ± 0.3 | −1.0 ± 0.3 | 12 ± 0 | −10.79 ± 0.00 | −0.24 ± 0.01 | |
| Lys376Ala | 53.4 ± 0.1 | −0.7 ± 0.1 | 203 ± 9 | −9.13 ± 0.03 | 1.43 ± 0.03 | |
| Leu377Ala | 49.8 ± 0.1 | −4.3 ± 0.2 | n. d. | |||
| Leu380Ala | 52.8 ± 0.1 | −1.3 ± 0.2 | 162 ± 7 | −9.26 ± 0.03 | 1.30 ± 0.03 | |
| Val389Ala | 53.0 ± 0.0 | −1.0 ± 0.1 | 304 ± 5 | −8.88 ± 0.01 | 1.67 ± 0.01 | |
| Ω-loop | Glu263Ala | 53.0 ± 0.2 | −1.1 ± 0.2 | 220 ± 9 | −9.07 ± 0.02 | 1.48 ± 0.03 |
| Val265Ala | 52.0 ± 0.0 | −2.0 ± 0.1 | 106 ± 3 | −9.51 ± 0.02 | 1.05 ± 0.02 | |
| Asp272Ala | 54.1 ± 0.1 | 0.1 ± 0.1 | 6995 ± 317 | −7.03 ± 0.03 | 3.53 ± 0.03 | |
| Lys273Ala | 48.1 ± 0.2 | −5.9 ± 0.3 | n. d. | |||
| Leu295Ala | 47.4 ± 0.1 | −6.6 ± 0.1 | n. d. | |||
| Lys297Ala | 48.4 ± 0.2 | −5.7 ± 0.3 | n. d. | |||
| Val414Ala | 50.9 ± 0.1 | −3.2 ± 0.1 | 14 ± 1 | −10.73 ± 0.02 | −0.17 ± 0.02 | |
| Tyr429Phe | 52.3 ± 0.1 | −1.7 ± 0.1 | 71 ± 6 | −9.75 ± 0.05 | 0.81 ± 0.05 |
Table 3
Summary of the coupling energy (ΔΔGint) measured for each pair of residues. ΔΔGint values are in kcal/mol and were calculated according to the description given in the Materials and methods section. Average and standard errors (SE) are shown. The gray cells indicate mutations of YAP and TEAD in the same binding pocket. n. m. (not measured) indicates that ΔΔGint could not be determined experimentally because the Kd values for the mutant YAP:mutant TEAD interaction in the corresponding double mutant cycles were above our assay limit (>200 µM).
| hYAP50-171 | |||||||||||
|---|---|---|---|---|---|---|---|---|---|---|---|
| α-helix | Ω-loop | ||||||||||
| Leu65 | Leu68 | Phe69 | Met86 | Arg89 | Leu91 | Ser94 | Phe95 | Phe96 | |||
| hTEAD217-434 | α-helix | Phe337 | −0.34 ±0.04 | −0.65 ±0.04 | −0.96 ±0.04 | 0.17 ±0.04 | −0.44 ±0.03 | n. m. | −0.09 ±0.05 | n. m. | 0.02 ±0.06 |
| Lys376 | −0.65 ±0.04 | −0.41 ±0.05 | −1.28 ±0.06 | 0.13 ±0.04 | −0.62 ±0.03 | −0.41 ±0.06 | −0.22 ±0.06 | −0.30 ±0.04 | −0.14 ±0.05 | ||
| Leu380 | −0.36 ±0.05 | −0.29 ±0.04 | −1.01 ±0.06 | 0.07 ±0.03 | −0.29 ±0.03 | −0.26 ±0.05 | −0.08 ±0.05 | −0.18 ±0.03 | −0.02 ±0.06 | ||
| Val389 | −0.52 ±0.06 | −0.29 ±0.05 | −1.11 ±0.05 | 0.16 ±0.03 | n. m. | n. m. | 0.03 ±0.05 | n. m. | −0.06 ±0.04 | ||
| Ω-loop | Glu263 | −0.05 ±0.05 | −0.09 ±0.03 | −0.10 ±0.06 | 0.07 ±0.05 | −0.59 ±0.06 | −0.62 ±0.05 | −0.96 ±0.05 | −0.51 ±0.05 | −0.04 ±0.07 | |
| Val265 | 0.26 ±0.03 | 0.15 ±0.03 | 0.13 ±0.05 | 0.09 ±0.03 | −0.58 ±0.02 | −0.28 ±0.06 | −0.06 ±0.06 | −0.61 ±0.04 | −0.22 ±0.06 | ||
| Asp272 | n. m. | −0.02 ±0.04 | n. m. | −1.85 ±0.04 | −3.49 ±0.05 | −2.74 ±0.06 | −1.65 ±0.05 | −2.50 ±0.07 | −1.67 ±0.06 | ||
Additional files
-
Supplementary file 1
Dissociation constants for the different YAP:TEAD complexes.
The N-Avitagged hTEAD4217-434 proteins were immobilized on sensor chips and their affinity for the hYAP50-171 proteins was measured at 298°K by Surface Plasmon Resonance in n ≥ 3 independent experiments. Kd values (in nM) were obtained from equilibrium data (Kdeq). Averages and standard errors (SE) are given.
- https://doi.org/10.7554/eLife.25068.012
-
Supplementary file 2
Calculated Kd for pairs of hYAP and hTEAD4 mutants.
Kd values were calculated (Kdcalc) assuming ΔΔGint = −500 cal/mol between the YAP:TEAD pairs. A calculation example for the hYAP Arg89:hTEAD4 Val389 pair is given in the following. The difference in binding energy between the two interactions wt hYAP:wt hTEAD4 and hYAP Arg89Ala:wt hTEAD4 is ΔΔG = 4338 cal/mol (Figure 4—source data 1, ΔΔG1 double mutant cycle for hYAP Arg89:hTEAD4 Val389). With ΔΔGint = −500 cal/mol, the difference in binding energy between the interactions wt hYAP:hTEAD4 Val389Ala and hYAP Arg89Ala:wt hTEAD4 Val389Ala should be ΔΔG = 3838 cal/mol. As ΔG = −8881 cal/mol for wt hYAP:hTEAD4 Val389Ala, the binding energy of the interaction between hYAP Arg89Ala and wt hTEAD4 Val389Ala should be ΔG = −5043 cal/mol. Using Kdcalc = eΔG/RT the dissociation constant for the interaction hYAP Arg89Ala:wt hTEAD4 Val389Ala should be Kdcalc = 199 µM. The last column gives the calculated Kd values for the interaction between the two mutant proteins (Kdadd) if no coupling exists between the two residues (ΔΔGint = 0 cal/mol in the above calculation). All Kdadd values are above 200 µM in agreement with our experimental data.
- https://doi.org/10.7554/eLife.25068.013
Download links
A two-part list of links to download the article, or parts of the article, in various formats.
Downloads (link to download the article as PDF)
Open citations (links to open the citations from this article in various online reference manager services)
Cite this article (links to download the citations from this article in formats compatible with various reference manager tools)
Dissection of the interaction between the intrinsically disordered YAP protein and the transcription factor TEAD
eLife 6:e25068.
https://doi.org/10.7554/eLife.25068


