
Peer review process
Revised: This Reviewed Preprint has been revised by the authors in response to the previous round of peer review; the eLife assessment and the public reviews have been updated where necessary by the editors and peer reviewers.
Read more about eLife’s peer review process.Editors
- Reviewing EditorAudrey SederbergGeorgia Institute of Technology, Atlanta, United States of America
- Senior EditorTirin MooreStanford University, Howard Hughes Medical Institute, Stanford, United States of America
Reviewer #1 (Public review):
Dwulet et al. combined experimental and modeling approaches to investigate how correlated spontaneous activity in the mouse's primary visual (V1) and primary somatosensory (S1) areas drives the development of multisensory integration in area RL. Notably, they focused on early developmental stages, before sensory experience occurs. Consistent with previous experimental findings, the authors first demonstrated that spontaneous activity becomes more sparse across development in all three areas, as measured by event amplitude, event duration, and participation ratio. Using a linear mixed model analysis to compare the maturation of this spontaneous activity, they found evidence that S1 matured the fastest. The authors then presented experimental evidence suggesting that these spontaneous events were moderately correlated both spatially and temporally.
They hypothesized that activity-dependent mechanisms use these correlations to establish connectivity across these regions. To test this hypothesis, the authors modeled a feedforward network with connections from S1 to RL and from V1 to RL, where the strength of connections depended on a Hebbian term for potentiation and a heterosynaptic term for depression. By investigating different levels of V1-S1 correlations, they found that moderate levels of correlation led to the significant development of topographically organized connectivity while maintaining a mix of bimodal and unimodal cells in RL. Additionally, when simulating a network with a more mature S1, they observed that topographical maps improved not only between S1 and RL but also between V1 and RL. Finally, the authors use linear regression to suggest that the mixture of bimodal and unimodal cells in RL is optimal for encoding the maximum amount of information from both V1 and S1.
Comments on revised version:
The revision closes most of the data-model gaps raised in my original review. The authors have clarified the experimental measures and statistical comparisons, improved the spatial correlation-map analysis, added a temporal-lag analysis that argues against stereotyped traveling waves, expanded the model description, and performed additional simulations examining the effects of differences in spontaneous activity. Taken together, these changes provide solid support for the paper's principal conclusion: structured and moderately correlated activity can, within the proposed model, guide the refinement of an initially coarse connectivity scaffold into aligned multisensory representations.
The remaining limitations primarily concern the more specific claim that the somatosensory pathway matures first and guides refinement of the visual pathway. The experiments support the conclusion that spontaneous activity in the somatosensory cortex matures earlier. However, the proposed consequence of this difference is carried in the model by an assumed stronger initial somatosensory-to-higher-order connectivity bias, motivated by pilot anatomical observations that are not included quantitatively in the manuscript. The new supplementary simulations suggest that differences in activity amplitude and frequency alone are insufficient, but the parameters are varied over ranges considerably smaller than the differences measured experimentally, and event duration is not varied. These simulations therefore do not strongly establish that the measured activity differences are insufficient to produce the effect. In addition, the Figure 4 caption and portions of the Discussion continue to imply that more mature somatosensory activity itself instructs map alignment, whereas the revised Results present the more qualified conclusion that an additional connectivity difference is required.
A few internal inconsistencies also remain. The abstract still describes activity in the three areas as being recorded simultaneously, although the cellular-resolution recordings were acquired sequentially; only the wide-field data were collected simultaneously across areas. The revised model also assigns spontaneous events durations and intervals in milliseconds, while the measured calcium events last several seconds and occur only a few times per minute.
Reviewer #2 (Public Review):
The revised manuscript has substantially improved, and the authors have satisfactorily addressed most of the concerns raised in my original review. Overall, the experimental evidence and its relationship to the computational model are now presented more clearly and rigorously, substantially strengthening the manuscript.
My main reservation in the original review concerned the role of the initial topographic connectivity bias in the computational model. The revised manuscript provides a clearer interpretation of this aspect. The initial bias represents a coarse activity-independent scaffold, while the final organization of the maps depends on its interaction with the structure and degree of correlated spontaneous activity. Importantly, the simulations show that the presence of the initial bias alone does not determine the final connectivity pattern. I therefore consider the computational results substantially better supported and interpreted in the revised manuscript. Nevertheless, as the model starts from a predefined coarse topographic organization of the projections from the primary sensory cortices to RL, in my opinion, the results demonstrate how structured spontaneous activity can refine and align an initially organized connectivity scaffold, rather than showing that spontaneous activity itself establishes this topographic organization.
This distinction is relevant when interpreting the central mechanistic conclusion of the study. The work provides convincing support for the idea that correlated spontaneous activity can contribute to the refinement and alignment of multisensory cortical maps, conditional on the existence of an initial coarse topographic organization. Establishing experimentally how this initial connectivity is organized during the relevant developmental period, and how spontaneous activity modifies it, remains an important question for future work.
Overall, I consider the revised manuscript considerably stronger than the original submission. Most of my previous concerns have been adequately resolved, and the study provides valuable experimental and computational insight into how spontaneous activity may contribute to the development of aligned multisensory representations.
Reviewer #3 (Public review):
Summary:
The study by Dwulet et al. explores how the development of spontaneous neural activity in primary sensory cortices influences the co-alignment of multiple sensory modalities in higher-order brain areas (HOAs). To address this question, they focus on connectivity between the primary visual (V1) and somatosensory (S1) cortices and an associative cortical area (RL) in mice. The authors combine experimental (wide-field and two-photon calcium imaging) and computational approaches to show that spontaneous activity matures at a different pace across these brain regions. Their data indicate that S1 develops more rapidly than V1, which is possibly beneficial for RL's integration of visual and somatosensory inputs through correlated spontaneous activity. Using a computational model, they demonstrate that a moderate correlation between V1 and S1 activity can optimally guide the formation of bimodal neurons in RL, which are crucial for maximizing the decodability of multisensory stimuli. This finding highlights the role of correlated spontaneous activity in primary sensory cortices in establishing co-aligned topographic multimodal sensory representations in downstream circuits.
Strengths:
The manuscript is well written and it provides strong enough evidence to support the main claim of the authors. The insights on the role of correlated activity on instructing co-aligned multisensory maps in HOAs are not trivial and are an important advancement for the field.
Weaknesses:
In the opinion of this reviewer, the study has no major weaknesses. A drawback of the work is that none of the predictions of the computational modeling have been corroborated through mechanistic experimental manipulations of early brain activity.
Comments on revised version:
The authors have addressed all my previous concerns. I have no further comments.
Author response:
Public Reviews:
Reviewer #1 (Public review):
Dwulet et al. combined experimental and modeling approaches to investigate how correlated spontaneous activity in the mouse's primary visual (V1) and primary somatosensory (S1) areas drives the development of multisensory integration in area RL. Notably, they focused on early developmental stages, before sensory experience occurs. Consistent with previous experimental findings, the authors first demonstrated that spontaneous activity becomes more sparse across development in all three areas, as measured by event amplitude, event duration, and participation ratio. Using a linear mixed model analysis to compare the maturation of this spontaneous activity, they found evidence that S1 matured the fastest. The authors then presented experimental evidence suggesting that these spontaneous events were moderately correlated both spatially and temporally.
They hypothesized that activity-dependent mechanisms use these correlations to establish connectivity across these regions. To test this hypothesis, the authors modeled a feedforward network with connections from S1 to RL and from V1 to RL, where the strength of connections depended on a Hebbian term for potentiation and a heterosynaptic term for depression. By investigating different levels of V1-S1 correlations, they found that moderate levels of correlation led to the significant development of topographically organized connectivity while maintaining a mix of bimodal and unimodal cells in RL. Additionally, when simulating a network with a more mature S1, they observed that topographical maps improved not only between S1 and RL but also between V1 and RL. Finally, the authors use linear regression to suggest that the mixture of bimodal and unimodal cells in RL is optimal for encoding the maximum amount of information from both V1 and S1.
However, there are significant gaps between the experimental data and the modeling setup, which weaken the paper's conclusions. Additionally, some key details are omitted, making it difficult to fully assess their analysis and interpret some of their figures.
(1) Some of the statistical measures and techniques in Figure 1 could benefit from clearer definitions. While the thresholds for activation (peak with at least 5% dF/F0) and events (20% of recorded cells activated simultaneously) are provided, event duration and participation rate are not clearly defined. Based on this definition of event alone, it is unclear why the minimum participation rate in Figure 1F is not 20%. Additionally, the conclusion that S1 matures earlier than RL and V1 could be strengthened by including a direct comparison between S1 and RL, as the current analysis only compares these areas to V1.
We thank the reviewer for this comment. We have now updated the Methods to include the event duration as time above half max, participation rate as % of cells out of total in that region active during an event. Also, the threshold of 20% recorded cells to identify an event was incorrectly stated, in fact the threshold was 5% consistent with what the reviewer observed in Figure 1F. This error has been corrected throughout the Methods. We chose 5% because spontaneous activity significantly sparsifies over development, with events involving far fewer cells, as previously shown by multiple studies (Golshani et al., 2009; Rochefort et al., 2009; Gribizis et al., 2019; Leighton et al., 2021; Murakami et al., 2022; Chini et al., 2022; reviewed in Lakhera et al., 2024).
For the linear mixed model (LMM) analysis, we used V1 as a reference just for convenience, but this has no influence on the results. We now added a direct comparison using each area as reference in the LMMs. Several Supplementary Tables (S1-3) now show these results with coefficient estimates and stars showing statistical significance and are mentioned in the legend of Figure 1 and the main text.
(2) The wide-field experiments in Figure 2 could be expanded to support the feedforward modeling assumptions. Currently, the spatial and temporal correlations presented leave open the possibility that these spontaneous events are traveling waves propagating from V1 to RL to S1 (or vice versa). This scenario would suggest a different connectivity scheme for the model. Clarifying this point with additional data analysis, specifically including temporal correlations involving RL, could provide stronger support for the model's assumptions.
We agree with the reviewer that the correlation analyses shown in Figure 2 do not differentiate between two possibilities: activity that travels smoothly from one cortical area to another, thereby correlating correlations between these areas, versus activity that is spatially confined to individual areas but occurs near-synchronously across those areas. To address this point, we have revised Figure 2 in two ways.
First, we added examples of spontaneous activity showing near-synchronous but spatially distinct activation of sub-areas in V1, RL and S1 (new Figure 2D). These examples show that localized activity can remain confined to individual sensory cortical areas and RL, while occurring at similar times across areas. Thus, the observed correlations are not simply due to single large events spreading continuously across the entire imaged field.
Second, we added a lagged cross-correlation analysis between V1 and S1 activity (new Figure 2G). This analysis shows that the correlation between V1 and S1 peaks close to zero lag and decays for both positive and negative lags. This argues against a stereotyped travelling-wave-like propagation from V1 to S1 or from S1 to V1 with a fixed delay. The cross-correlation curves show a mild asymmetry, with somewhat higher correlations when S1 precedes V1. However, because the dominant peak is centered near zero lag, we interpret the data primarily as evidence for near-synchronous, spatially structured coactivity across sensory areas, rather than fixed directional propagation.
Together, these two analyses support the modeling abstraction that V1 and S1 provide temporally correlated, spatially structured inputs to RL. We have added the new activity examples and the lagged cross-correlation analysis to Figure 2 and revised the Results accordingly. Although these analyses do not exclude all forms of propagating activity, they argue against the specific concern that the correlations are dominated by stereotyped traveling waves passing sequentially through V1, RL, and S1.
(3) The functional correlation map in Figure 2D appears contradictory to the authors' modeling assumption that inputs are correlated spatially in V1 and S1. While V1 seed points align topographically with RL, this organization breaks down when extended into S1. In contrast, and in support of the modeling assumption, Figure 2E shows clearer topography across all three regions. A discussion of this discrepancy would be helpful, as it's a key conclusion of the figure. Additionally, it is unclear when this data was collected during development. Clarifying the developmental stage and analyzing how this map changes over time could strengthen the results.
We thank the reviewer for pointing out this ambiguity. In the original version, the functional correlation maps were generated using separate seed locations in V1 and S1, and the interpretation relied heavily on thresholded RGB maps in which each pixel was assigned to the color channel with the strongest correlation. This representation made it difficult to directly compare the V1- and S1-seeded maps and may have given the impression that topographic organization was preserved in one direction but not the other.
We have therefore revised the analysis and presentation of Figure 2. Instead of using separate seeds in V1 and S1, we now use common seed locations in RL and compute the correlations of these RL seeds with activity across the imaged cortical field. This allows us to ask directly whether different RL locations are associated with spatially distinct regions in both V1 and S1. We now show both the raw correlation maps, in which the RGB channels reflect the correlation values for the three RL seeds (new Figure 2E), and the thresholded/maximum-channel representation, in which each pixel is assigned to the strongest of the three color channels (new Figure 2F). The raw correlation maps make the correlation structure visible without relying solely on thresholding, whereas the thresholded representation highlights the spatial ordering of the strongest correlations.
With this revised analysis, the topographic relationship across V1, RL, and S1 is clearer and no longer depends on comparing separate V1- and S1-seeded maps. We also clarified in the figure legend how the RGB maps are computed and how thresholded pixels are represented.
The reviewer also asked about the developmental stage and progression of this phenomenon. The example shown in Figure 2 was recorded at PN9, and we now state this explicitly. In addition, we added examples from PN9–PN13 in Supplementary Figure S1, showing that similar functional correlation-map structure is present across the developmental period analyzed here. This is consistent with previous work showing that retinotopy-like patterns in higher visual areas can be recovered from functional-connectivity analysis of spontaneous activity before eye opening (Murakami et al., 2022), and with recent work showing that retinotopy-like and somatotopy-like patterns of ongoing activity, together with their rough topographic correspondence in RL, are already present before eye opening at PN10–11 (Matsumoto, Murakami & Ohki, 2025).
(4) The modeling of spontaneous events with fixed amplitude and duration seems inconsistent with the experimental data in Figure 1, which shows variability in these parameters. This is particularly confusing in Figure 4, where S1 maturation is modeled as a stronger topographical alignment with RL, but the experimental data defines maturation based on amplitude, duration, and event rates. Justifying these modeling choices or adapting the model to reflect experimental variability would create a better connection between the theory and data.
We agree with the reviewer that the original presentation did not sufficiently distinguish between the experimentally measured maturation of spontaneous activity and the way S1 maturation was implemented in the model. In the experiments (Figure 1), earlier maturation of S1 was reflected by lower event amplitudes, shorter durations, and higher event rates. In contrast, the original model explored the effect of a stronger or more spatially refined S1-to-RL projection (Figure 4). This modeling choice was motivated by pilot anatomical data suggesting that projections from S1 to RL become more elaborate earlier than projections from V1 to RL at comparable developmental ages. We include examples of these pilot data (Author response image 1), but we have not included them in the manuscript because the dataset is preliminary and does not yet allow for a sufficiently complete quantitative analysis.
Author response image 1.
Projections from V1 and S1 to RL at different developmental ages. Pilot anatomical data suggest that the S1 projection to RL becomes more elaborate and mature earlier than the V1 projection.
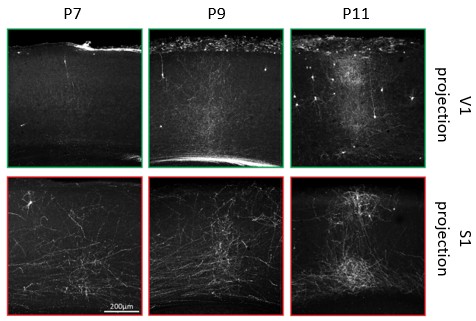
To address the reviewer’s concern more directly, we have now extended the model to incorporate differences in the spontaneous activity patterns of V1 and S1, including the lower amplitude and higher frequency of S1 events. We then examined how these activity differences interact with different levels of initial connectivity bias between the primary sensory cortices and RL (Supplementary Figure S2). We also quantified the resulting topography, map alignment, and fraction of bimodal RL neurons as a function of the S1 bias and included these additional plots in Figure 4 (panels C-E).
This analysis shows that incorporating the more mature S1-like activity patterns alone was not sufficient to generate the appropriate topographic and aligned maps. Rather, the model still required an initial connectivity bias, together with an appropriate level and structure of correlated activity. This is consistent with the results shown in Figure 3B,E,G–I and discussed in our response to Reviewer 2, point 3, where we show that the initial bias does not by itself determine the final map structure, but instead interacts with the level of V1–S1 correlation. We have added the new analysis to Supplementary Figure S2 and revised the text to clarify the interpretation. Rather than presenting the stronger S1 bias as a direct consequence of the more mature S1 activity dynamics revealed through the differences in amplitude, duration, and event rate, we now frame it as a model prediction: earlier S1 maturation may need to be accompanied by, or act through, a more advanced anatomical or functional S1-to-RL projection, whose refinement still depends on the temporal and spatial structure of spontaneous activity.
The results suggest that differences in spontaneous activity dynamics and differences in projection maturity may act together during the emergence of topographically aligned multisensory maps, with neither component alone being sufficient to determine the final organization. Future experiments will be needed to establish whether such an S1-to-RL connectivity bias is present systematically, to quantify its developmental progression, and to disentangle the relative contributions of more mature spontaneous activity dynamics and more mature connectivity.
(5) Several important details of the mathematical model are missing or unclear, partly due to typos. The Results section mentions the general framework of the input correlation matrix (e.g., "S1 and V1 neurons were driven by a combination of events, independent and shared in each V1 and S1" and "each independent event activated a randomly chosen, contiguous set of neurons"), but the specifics are not fully explained. Additionally, the caption of Figure 5 refers to a non-linear transfer function (a sigmoid), but these details are not provided in the Methods section, which instead suggests a linear model was used. A careful review of the main text and Methods section would help ensure that all the necessary details are included and that the story is both complete and accurate.
We thank the reviewer for pointing out these missing details and inconsistencies. We have carefully revised the Results, figure captions, and Methods to make the model description more complete and internally consistent.
First, we clarified how spontaneous input events were generated. Specifically, V1 and S1 activity was constructed from independent events in each area and shared events across the two areas. These event streams were generated using Poisson processes, with the rates chosen such that the total event rate was matched across simulations while varying the fraction of shared versus independent events. We also clarified that each event activated a spatially contiguous group of neurons, thereby implementing local spatial correlations within each primary sensory area, while shared events activated corresponding topographic locations in V1 and S1.
Second, in the Methods we clarified the use of the nonlinear transfer function in the decoding analysis shown in Figure 5. The simulated RL activity was transformed with a sigmoid nonlinearity before performing the regression analysis, and we have now added the corresponding equation (15) to the Methods.
Third, we clarified the distinction between the numerical decoding analysis and the analytical calculation of the optimal weight matrix. The decoding analysis uses the nonlinear transformation described above, whereas the analytical calculation uses a linearized version of the model to obtain a tractable closed-form solution. We now state this explicitly in the Methods to avoid the impression that two inconsistent models were used.
Finally, we corrected several typographical errors and checked that the Results, Methods, and figure captions use consistent terminology for the input generation, correlation structure, and decoding analysis.
(6) While Figure 5 supports the paper's conclusion that a mixture of unimodal and bimodal neurons in RL optimizes information encoding, the authors missed an opportunity to strengthen the connection between the model and experimental data. Specifically, they could apply this reconstruction method to the experimental data and examine how RL's ability to reconstruct V1/S1 activity changes across development. Their model predicts that this performance would improve over time, and if this trend is observed in the experimental data, it would provide strong validation that these feedforward connections are developing in line with the model's predictions.
We agree with the reviewer that applying the reconstruction analysis directly to the experimental data would provide an important additional test of the model. However, the current experimental datasets are not well suited for this analysis. The two-photon recordings used to characterize spontaneous activity in V1, S1, and RL were acquired sequentially rather than simultaneously, and therefore cannot be used to reconstruct V1/S1 activity from RL activity. In principle, a related analysis could be attempted using the wide-field recordings, which are simultaneous across cortical areas. However, these data have lower spatial resolution, include movement-related variability, and do not provide cellular-resolution measurements of RL activity. We explored this possibility, but the resulting reconstructions were not sufficiently reliable or interpretable to include in the manuscript.
We now state this explicitly as a limitation in the Discussion and identify simultaneous multiarea recordings at cellular resolution as an important future test of the model. Such experiments would make it possible to determine whether the ability of RL activity to reconstruct V1/S1 activity improves across development, as predicted by the model.
Reviewer #2 (Public review):
The authors aim to investigate the role of spontaneous activity in shaping the development of multisensory integration in the brain, specifically focusing on the connections between primary visual and somatosensory sensory areas (V1 and S1) and a higher-order cortical area rostrolateral to V1 (RL). They seek to understand how spontaneous activity guides the formation of aligned topographic maps and the emergence of bimodal neurons in RL.
First, the authors found that spontaneous activity in all three areas sparsifies over time, but S1 exhibits more mature patterns earlier than V1 and RL. They claimed that correlated activity among neighboring regions of these areas during development carries topographic information. These data were used to implement a computational model that employed Hebbian rules of synaptic plasticity. The model indicated that correlated spontaneous activity can generate topographic connectivity between S1/V1 and RL and bimodal neurons in RL. The model suggested that the more mature spontaneous activity in S1 can guide map alignment between V1 and RL. In addition, the model also suggested that a mixture of bimodal and unimodal neurons in RL is optimal for decoding information from V1 and S1.
While the data presented in the manuscript is promising and provides preliminary insights into the role of spontaneous activity in multisensory integration, it would be beneficial to strengthen the experimental foundation regarding the correlation between V1, S1, and RL. Incorporating more rigorous spatio-temporal analyses of spontaneous activity could enhance the robustness of these findings.
Here are some important concerns:
(1) The analysis of how spatial topography influences activity correlations in Figure 2 has several issues.
(1a) While squares in V1 and S1 covered a small area of these sensory areas, the correlated territories in RL covered the entire area of RL. The topographic map in V1 continues caudally, so where is the rest of the map in RL? Something similar applies to the relationship between S1 and RL.
We thank the reviewer for pointing out this ambiguity. In the original version, the functional correlation maps were generated using separate seed locations in V1 and S1, and the interpretation relied heavily on thresholded RGB maps in which each pixel was assigned to the color channel with the strongest correlation. This made it difficult to directly compare the V1- and S1-seeded maps and could give the impression that the correlation structure extended differently across RL depending on the chosen seed area.
We have therefore revised the analysis and presentation of Figure 2. Instead of using separate seeds in V1 and S1, we now use common seed locations in RL and compute the correlation of each RL seed with activity across the imaged cortical field. This allows us to ask more directly whether different locations in RL are associated with spatially distinct regions in both V1 and S1. We now show both the raw correlation maps, in which the RGB channels reflect the correlation values for the three RL seeds (new Figure 2E), and the thresholded/maximum channel representation, in which each pixel is assigned to the strongest of the three color channels (new Figure 2F). The raw correlation maps make the correlation structure visible without relying solely on thresholding, whereas the maximum-channel representation highlights the spatial ordering of the strongest correlations.
With this revised analysis, the topographic relationship across V1, RL, and S1 is clearer and no longer depends on comparing separate V1- and S1-seeded maps. We also clarified in the figure legend and Methods how the RGB maps are computed, how the maximum-channel maps are generated, and how thresholded pixels are represented. In addition, we added Supplementary Figure S1 to show further functional-correlation-map examples across PN9, PN10, and PN13 recordings, with seed locations in V1, S1, or RL as indicated in each panel.
(1b) It is essential to know how areas were drawn. High precision is required.
Consistent delineation of cortical areas is absolutely essential for interpreting the functional correlation maps. We have therefore expanded the Methods to describe how cortical areas were delineated from the wide-field recordings. Briefly, recordings were acquired in a field of view defined relative to lambda and the midline, and cortical-area outlines were assigned using published reference maps together with the spatial organization of spontaneous activity patterns and functional correlation maps. This approach follows the procedure we previously validated for developmental wide-field recordings (Leighton et al., 2021).
To make this transparent, we added Supplementary Figure S3, which illustrates how the reference-map-based outlines were overlaid on the imaging field of view and how functional correlation maps and individual network events helped identify the boundaries of V1 and neighboring areas. We also clarified this in the Methods.
(1c) It is not clear if correlated activity means different events in sync or large events that cover 2 or all 3 cortical areas of interest. The figure points to the second option, which contradicts the size of events at these stages, mainly in the oldest mice analyzed here.
The reviewer asks whether the correlations reflect spatially confined events occurring near-synchronously in different cortical areas, or instead large events spanning V1, RL, and S1. To clarify this point, we revised Figure 2 to show representative activity traces and individual frames from the wide-field recordings (new Figure 2B–D). These examples show that activity can be localized to distinct subregions within V1, RL, and S1 while occurring at similar times across areas. Thus, the observed correlations are not well explained by single large events spreading continuously across the entire imaged field.
We have revised the Results and Figure 2 to make this clearer. In addition, the lagged cross-correlation analysis in Figure 2G shows that V1–S1 correlations peak near zero lag and decay for both positive and negative lags, arguing against a stereotyped travelling-wave-like propagation between the two primary sensory cortices as the dominant explanation for the observed correlations.
(1d) It is fundamental to know in detail and provide examples of how the detection of events was performed. For instance, could the dispersion of light from an event in V1 close to RL cause the detection of activity in RL?
The reviewer asks how events were detected in the wide-field recordings and whether light dispersion could lead to false-positive correlations between neighboring areas. We have clarified this point in the Methods. For the functional correlation analyses shown in Figure 2, we did not perform event detection. Instead, the correlation maps were computed from the continuous fluorescence time courses by calculating Pearson correlations between seed region activity and the activity of every pixel in the field of view. Thus, the functional correlation maps do not depend on detecting or assigning individual events.
To address the concern about whether correlations could reflect light spread from large events rather than genuine co-activity across areas, we revised Figure 2 to include representative activity traces and individual frames from the wide-field recordings. These examples show that activity can be spatially confined to distinct subregions in V1, RL, and S1 while occurring at similar times across areas. This argues against the interpretation that the correlations are simply caused by a single event spreading continuously across the imaged field or by light dispersion from one area into another. We have also described the area delineation procedure in more detail in the Methods and added Supplementary Figure S3 to illustrate how activity patterns and functional correlation maps were used to assign outlines of distinct cortical areas.
Although wide-field imaging cannot completely exclude minor contributions from light scattering near area borders, the spatially localized activation patterns and the topographically ordered correlation maps support the interpretation that the correlations reflect genuine nearsynchronous co-activity across V1, RL, and S1.
(2) For the correlations among V1, S1, and RL, it is crucial to have a consistent method to delineate the borders of cortical areas. The authors mention in one sentence that areas were drawn according to a reference map. More details are needed to convince the reader that the borders are accurate, especially because their shape and position change with age.
As described in our response to point 1b, we have expanded the Methods to clarify how cortical-area borders were delineated in the wide-field recordings. Briefly, recordings were acquired in a field of view defined relative to lambda and the midline, and cortical area outlines were assigned using published reference maps together with the spatial organization of spontaneous activity patterns and functional correlation maps. We also added Supplementary Figure S3, which illustrates how the outlines based on reference maps were overlaid on the imaging field of view and how functional correlation maps and individual network events helped identify the boundaries of V1 and neighboring areas. This makes the delineation procedure more transparent across animals and developmental ages.
(3) The results from the model seem to be based on the initial bias in connectivity between neighboring cells from the different areas. Then, it seems straightforward that implementing correlated activity with Hebbian and synaptic depression rules will force the strengthening of connections between spatially close cells. Despite this apparent predisposition of the model towards a defined outcome, the flaws in the experimental data used prevent a rigorous interpretation of the computational model.
We understand the reviewer’s concern that the initial topographic bias could predispose the model toward the emergence of topographic maps. However, the model results show that this bias is not by itself sufficient to determine the final organization (Figure 3B,E,G– I). When V1–S1 correlations are weak, many RL neurons decouple from the primary sensory inputs, resulting in poor topography and few bimodal neurons (Figure 3E,G–I). Conversely, when V1–S1 correlations are very strong, the two input maps become highly aligned, but topography is degraded because many RL neurons receive similar visual and somatosensory inputs at the same topographic location, thereby overriding the initial topographic bias (Figure 3E,G,H). Thus, the initial bias does not simply determine the final map structure. Rather, appropriate topography, map alignment, and the emergence of a mixture of unimodal and bimodal neurons require an intermediate level of correlated activity.
We have revised the manuscript to make this interpretation clearer. We also strengthened the experimental basis for the activity structure used in the model by revising Figure 2 and the corresponding Results and Methods. The revised analyses now show near-synchronous but spatially distinct activation of V1, RL, and S1, a lagged cross-correlation analysis arguing against stereotyped travelling-wave-like propagation between V1 and S1, and functional correlation maps computed from common RL seed locations. Together, these additions clarify the spatial and temporal structure of the spontaneous activity used to motivate the model.
Finally, as described in our response to Reviewer 1, point 4, we have extended the model to test the role of the initial bias more directly in combination with experimentally measured differences in V1 and S1 activity patterns. In this analysis, we incorporated these activity differences and examined how they interact with different levels of initial connectivity bias (Supplementary Figure S2). These simulations show that more mature S1-like activity patterns alone are not sufficient to generate the appropriate topographic and aligned maps, and that an initial connectivity bias is required. At the same time, consistent with Figure 3, this bias does not by itself determine the final organization; the outcome also depends on the temporal correlation structure of V1 and S1 activity.
We agree that the initial topographic bias remains an important modeling assumption, consistent with the idea that coarse activity-independent mechanisms provide an initial scaffold for later activity-dependent refinement. We now present the model accordingly: not as showing that correlated activity alone creates topography from an entirely unstructured circuit, but as showing how structured spontaneous activity can refine an initially coarse topographic scaffold to produce aligned multisensory maps and a mixture of unimodal and bimodal RL neurons.
(4) In the Introduction, the authors nicely and briefly explain the role of primary and higher order sensory cortices in information processing. They also explain how spontaneous activity during development helps to build these circuits by refining connections or establishing hierarchies. They continue explaining the relevance of aligning different topographic maps to allow multisensory integration. Then they provide some examples of sites of multisensory integration. This provides a general context for the data presented in the Results section; however, and importantly, there is no specific introduction of why they are interested in RL and its interaction with V1 and S1. The authors should introduce the RL area and explain why it is an interesting site for multisensory processing.
We thank the reviewer for pointing this out. We have revised the Introduction to make the rationale for focusing on RL more explicit. Specifically, we now introduce RL as a higher-order cortical area located between V1 and S1 that receives topographically organized input from both primary sensory cortices and contains overlapping visual and tactile representations. We also clarify that RL is a particularly relevant area for studying multisensory map alignment because corresponding locations in visual and whisker space can converge onto the same RL neurons, including bimodal neurons. Finally, we expanded the Introduction to explain that RL has been implicated in visually guided tactile behaviors and cross-modal generalization, making it an appropriate model system for studying how aligned multisensory representations emerge during development.
(5) The results shown in Figure 1 corroborate published data from Golshani et al, Rochefort et al, Murakami et al. While the reproduction of data is more than welcome, the authors should specify which part of the data is completely new and acknowledge clearly the rest as corroboration of previous data. The sentence "As described in previous experiments ..." partially acknowledges this fact but is not clear enough. In addition, the transition between this part of the manuscript and the next data is not smooth. Data seems to be used to feed the model so perhaps the organization of the manuscript leaves room for improvement.
We thank the reviewer for pointing this out. We have therefore revised the Results to clarify that the developmental sparsification of spontaneous activity in V1 is consistent with previous work, including Portera-Cailliau, Konnerth, Hanganu-Opatz, Crair and Ohki labs as well as our own (Siegel et al. 2021) and that similar developmental trends in S1 and RL corroborate and extend these observations across the sensory and higher-order cortical areas analyzed here.
We also clarified what is new in the present analysis. Specifically, our contribution is not simply to reproduce previously described developmental sparsification, but to compare V1, S1, and RL within the same experimental and statistical framework, revealing that S1 exhibits more mature activity features earlier than V1 and RL. We also revised the transition to the next section to make clearer how these measurements motivate the subsequent analysis of temporally and spatially correlated spontaneous activity between V1, S1, and RL.
Reviewer #3 (Public review):
Summary:
The study by Dwulet et al. explores how the development of spontaneous neural activity in primary sensory cortices influences the co-alignment of multiple sensory modalities in higher order brain areas (HOAs). To address this question, they focus on connectivity between the primary visual (V1) and somatosensory (S1) cortices and an associative cortical area (RL) in mice. The authors combine experimental (wide-field and two-photon calcium imaging) and computational approaches to show that spontaneous activity matures at a different pace across these brain regions. Their data indicate that S1 develops more rapidly than V1, which is possibly beneficial for RL's integration of visual and somatosensory inputs through correlated spontaneous activity. Using a computational model, they demonstrate that a moderate correlation between V1 and S1 activity can optimally guide the formation of bimodal neurons in RL, which are crucial for maximizing the decodability of multisensory stimuli. This finding highlights the role of correlated spontaneous activity in primary sensory cortices in establishing co-aligned topographic multimodal sensory representations in downstream circuits.
Strengths:
The manuscript is well written and it provides strong enough evidence to support the main claim of the authors. The insights on the role of correlated activity on instructing co-aligned multisensory maps in HOAs are not trivial and are an important advancement for the field.
Weaknesses:
In the opinion of this reviewer, the study has no major weaknesses. A drawback of the work is that none of the predictions of the computational modeling have been corroborated through mechanistic experimental manipulations of early brain activity.
We thank the reviewer for their positive assessment of the manuscript and for highlighting the importance of the model predictions. We agree that a direct mechanistic perturbation of early spontaneous activity would provide an important future test of the model. Such experiments could, for example, perturb the temporal correlation structure between V1 and S1 during the relevant developmental window and then test whether this affects the alignment of V1/S1 maps in RL and the emergence of bimodal RL neurons.
In the present study, we focused on identifying candidate features of spontaneous activity that could instruct multisensory map alignment and testing their sufficiency in a computational model. We now explicitly acknowledge in the Discussion that causal perturbations of early spontaneous activity will be needed to validate the model predictions experimentally. We believe this provides an important direction for future work while preserving the main conclusion of the current study: that structured, moderately correlated spontaneous activity provides a plausible developmental mechanism for refining aligned multisensory representations in higher-order cortex.
Recommendations for the authors:
Reviewer #1 (Recommendations for the authors):
Additional comments/suggestions for the figures:
(1) In Figure 1D-G, some of the dots lie almost directly on top of each other, essentially "hiding" certain data points. Using different shapes for each of the three regions might help alleviate this issue and make the data more visually distinct.
We thank the reviewer for this suggestion. We have revised Figure 1D-G so that the three cortical regions are shown with different marker shapes. This should make overlapping data points easier to distinguish and clarify that each point corresponds to the average value for one animal and cortical region at the indicated postnatal age.
(2) In Figure 2D-E, RGB color values are used to represent the highest correlation coefficient across the three seeded areas. It would be more informative if these also depicted the magnitude of the correlations, possibly through a color gradient. Additionally, the black regions in these panels are not currently defined and should be clarified.
We have revised the functional correlation-map analysis and its presentation in Figure 2, as suggested by the reviewer. In the revised figure, the main correlation-map panels now use three seed locations in RL and show the resulting correlations across the imaged cortical field. We present the maps in two complementary ways. First, the raw RGB correlation map shows the correlation values for all three seed locations, with the intensity of each color channel reflecting the magnitude of the corresponding Pearson correlation coefficient (new Fig. 2E). Second, the maximum-channel representation assigns each pixel to the seed location with the strongest correlation, while still preserving correlation strength through pixel intensity (new Fig. 2F).
We have also added color scales to relate pixel intensity to correlation magnitude and clarified that black pixels in the maximum-channel representation correspond to pixels below the correlation threshold used for visualization. The figure legend and Methods now describe how the RGB maps and maximum-channel maps were computed. Finally, we added Supplementary Figure S1 with additional examples from PN9, PN10, and PN13 recordings, with seed locations in V1, S1, or RL as indicated in each panel. This illustrates that they are quite similar across the ages investigated here.
(3) I found Figure 3F a bit difficult to interpret without referring to the Methods section for the definitions of Topography and Alignment. Since these definitions are relatively short and essential for understanding all the modeling figures, I suggest moving them into the main text where they are first introduced.
The definitions of Topography and Alignment have been added to the text where they are introduced.
(4) In Figures 3-5, it is unclear what causes the variability in the model’s responses, as there are two potential sources of randomness: the initial random connectivity matrix and the correlated inputs driving the system. Are either of these fixed? For example, is the distribution of dots along the y-axis in Figure 3G-H, which corresponds to zero correlation between V1 and S1, driven by variability in the initial connectivity matrix, the random timing of input events, or a combination of both? If it’s a combination, it would be interesting to tease this effect apart by fixing one form of randomness and recreating these plots.
In the original simulations in Figures 3–5, neither source of randomness was fixed across runs: each point corresponds to an independent developmental realization with a newly sampled initial connectivity matrix and a newly sampled sequence of spontaneous input events. The initial connectivity was random but weakly biased toward matched topographic location, while spontaneous activity consisted of stochastic independent and shared events activating randomly chosen contiguous groups of neurons (as explained in the main text and Methods). Thus, for example, the spread of points at zero V1–S1 correlation in Figures 3G–H reflects a combination of variability in the initial connectivity and variability in the independent V1 and S1 event histories. At zero correlation, no shared V1–S1 events are present, so this spread does not reflect variability in correlated shared events, but rather run-to-run differences in the two independently refined maps.
We have clarified this point in the text and figure legend. We agree that fixing one source of randomness while varying the other would be an interesting additional analysis to decompose the relative contribution of initial wiring versus input history. However, the goal of the present simulations was to characterize the ensemble of possible developmental outcomes when both initial connectivity and spontaneous activity vary, as expected biologically.
This interpretation is also consistent with the earlier two-layer model from developmental refinements from retina/thalamus to V1 (Wosniack et al., eLife 2021) on which our model builds, where final receptive fields emerge from the interaction between weak biased initial connectivity and stochastic structured spontaneous activity. In the current three-layer extension, the same principle applies to two converging projections, from V1 to RL and from S1 to RL. The initial topographic bias constrains the possible map structure, while the spatiotemporal statistics of V1 and S1 activity determine whether the two maps remain separate, align, or collapse into overly bimodal representations.
(5) The specific parameter values used to create the panels in the modeling figures (Figures 3 and 4) should be made clearer, at least in the figure captions. For example, in Figure 3E, the exact values for the “weak,” “medium,” and “strong” correlations should be provided. Additionally, Figure 4 does not mention the strength of the correlated input considered, which should be specified as well.
The values for the weak, medium and strong correlations have been added to the figure caption of Figure 3. The input correlation for Figure 4 is also now specified in the figure caption.
(6) There is an odd vertical line in Figure 3I that doesn’t appear to be discussed or defined. Its purpose should be clarified, or the line should be removed if it is unintentional.
This line has been removed.
(7) There is a typo in the caption for Figure 3. Panel 'K' should be panel 'J'.
This typo has been corrected.
(8) In the text, the authors write "With these connectivity refinements, the generated activity in RL became sparser in terms of amplitude and participation rate (Figure 3J)." While this appears to be the case for this single example, it is difficult to confirm without zooming in on the panel. These quantities should be computed across multiple instances, and a summary plot should be provided to support this statement.
The experimentally measured developmental sparsification of RL activity is quantified (independent of the model) in Figure 1D–F.
We see how the original wording placed too much weight on the illustrative example in Figure 3J. We have revised the text to clarify that Figure 3J shows a representative simulation illustrating how RL activity changes as V1/S1-to-RL connectivity refines, rather than a separate population-level quantification across model instances.
At the same time, this example is not meant to introduce a new, unsupported mechanism. The model used here is an extension of our previous two-layer model of developmental refinements between retina/thalamus and V1, in which spontaneous activity refined feedforward receptive fields from thalamus to V1. In that study, we specifically quantified how receptive field refinement led to sparsification of cortical activity in V1 over development, including reduced event amplitude, reduced event size/participation, and reduced pairwise correlations (Wosniack et al., 2021). Thus, the example shown in Figure 3J is consistent with a mechanism that has already been systematically characterized in the simpler two-layer setting.
In the present manuscript, the central modeling results concern the emergence of topography, alignment, and the balance of unimodal and bimodal RL neurons. We therefore have softened the corresponding statement and explicitly refer to Figure 3J as an illustrative example.
(9) Figure 5C is a bit difficult to interpret. The corresponding text states, "However, when activity across V1 and S1 is moderately correlated, having some unimodal RL neurons can achieve a higher total maximum fraction of variance for both V1 and S1 compared to the purely bimodal case (Figure 5C)", from which I infer that these dots represent networks resulting from "moderate correlations." However, the exact range of correlations considered should be mentioned in the text or figure caption. Additionally, I find it unusual that some networks with close to 0% bimodal cells perform quite well in reconstructing both S1 and V1. Many data points overlap, but I notice quite a few pale dots in the upper right of the plot. I believe this should be addressed in the main text.
We thank the reviewer for this helpful comment. We have added the correlation values used for the simulations in Figure 5C to the figure caption and clarified the interpretation in the Results. The high reconstruction performance for some networks with relatively few bimodal cells arises because, when V1 and S1 activity are not perfectly correlated, unimodal RL neurons can provide unambiguous information about activity in one sensory area. In contrast, a purely bimodal population can make it more difficult to distinguish whether one or both primary sensory cortices were active. Thus, for moderately correlated inputs, a mixture of unimodal and bimodal RL neurons can reconstruct both sensory areas better than a population composed entirely of bimodal neurons. We have revised the main text to make this point explicit.
(10) The network schematics in Figures 3A and 5A could be improved to better illustrate the network setup using a similar approach as the one used by this research group in Wosniack et al. (2021). Adding arrowheads to the lines from V1/S1 to RL would clarify that these are purely feedforward inputs. It would also be helpful to depict that V1 and S1 are driven by correlated events that are spatially structured.
We thank the reviewer for this helpful suggestion. We have revised the schematics in Figures 3A and 5A to make the feedforward nature of the model clearer by adding arrowheads to the projections from V1 and S1 to RL. We have also clarified the depiction and description of the input activity. Specifically, Figure 3C shows the spontaneous events driving V1 and S1 in the model, including shared events that are both temporally correlated and spatially structured across corresponding topographic locations in the two primary sensory areas. These shared events activate matched contiguous groups of neurons in V1 and S1, while independent events activate randomly chosen contiguous groups within each area. We have clarified this point in the Results and Methods.
General comments regarding the text (including typos):
(1) In Statistical analysis, "In wide-field calcium imaging (we re-analyzed data from [46] (Figure 1))..." should be referencing Figure 2.
Typo fixed.
(2) Right before Table 1, the authors mention that they ran the simulations for 500,000 milliseconds, which is 500 seconds. This doesn't seem long enough for the weights to approach their steady-state values given the inter-event interval. Since the example simulations in Figure 3 are 1,000 seconds long, I'm guessing this is a typo.
Typo fixed. Indeed the simulations in Figure 3 were 1,000 ms (1 s) long.
(3) The specific time step used for the simulations should be specified. Currently, the text only mentions "sufficiently small time steps".
We have now specified the simulation time step in the Methods.
(4) In the Rate-based network model section, you write "These biased weights decay with a Gaussian profile with increasing distance (Figure 3)), with amplitude a and spread s", but Table 1 denotes these parameters differently.
We have corrected the notation so that the parameter names are consistent between the Methods and Table 1.
(5) Currently, all differential equations are written as 1/tau*df/dt. Based on the units of your time constants (seconds), I believe these equations should be tau*df/dt.
We have corrected the differential-equation notation.
(6) Equations 5-6 and 8 should be differential equations.
We have corrected these equations so that they are written as differential equations. These mistakes happened because we changed formats between from Word to Latex.
(7) The expectation in Equation 8 is not clearly defined and I would think here that the W_ij's should be within expectations. In the next paragraph, the authors specify that they are interested in a specific case of W_ij's, but this condition has not been introduced yet.
We thank the reviewer for pointing out this ambiguity. We have revised the text around Equation 8 to define the expectation more clearly and to introduce the specific steady-state connectivity configuration before it is used. Because the expectation is taken over the input activity statistics at steady state, the weights are fixed quantities in this calculation. Including W_ij inside the expectation would therefore not change the result, but we have revised the notation and explanatory text to make this clearer.
(8) The expectation in Equation 8 is not clearly defined, and I believe that the W_ij’s should be included within the expectations (in the following paragraph, the authors mention that they are interested in a specific case of W_ij’s, but this condition has not yet been introduced).
This comment is the same as the one above. Please see the point above for the reply.
(9) At the start of "Optimal weight matrix for correlated input populations", you write that the vector X is M x 1. If that is the case X'X would be a 1x1 matrix. I'm not sure if you meant to write X as 1 x M or to examine XX'.
We thank the reviewer for pointing out this dimensional inconsistency. We have corrected the notation in the Methods. The concatenated input vector X=[v; s] has size M x 1, so the relevant input covariance matrix is X X^T not X^T X. This covariance matrix has size M x M, as required for the eigenvector analysis. We revised the corresponding equations and explanatory text accordingly.
(10) Equation 11 has an s_i on the right-hand side that should be a \mu_s.
Typo fixed.
Reviewer #2 (Recommendations for the authors):
Some sentences may require more scientific rigor. For instance: "We found that activity between the visual and the somatosensory cortex is often, but not always, temporally synchronized.
We have revised the Results to state the quantitative observations more explicitly. Specifically for this example, we now report that the average activity in V1 and S1 across PN9PN12 animals showed a range of Pearson correlation coefficients with a mean of approximately 0.5. We also describe the examples in Figure 2B-D as near-synchronous but spatially distinct activation of subregions in V1, RL, and S1, and we use the lagged cross-correlation analysis in Figure 2G to support the conclusion that V1-S1 correlations peak near zero lag rather than reflecting stereotyped propagation with a fixed delay.
Reviewer #3 (Recommendations for the authors):
Minor suggestions on how to improve some specific aspects of the manuscript.
Introduction:
(1) What do the authors mean when they write "Higher-order areas (HOAs) situated between primary sensory areas"? This sentence might need some editing.
We have revised the sentence to clarify that we are referring to higher-order cortical areas that receive and combine inputs from multiple primary sensory areas. We now also state explicitly that some of these areas, including RL, are anatomically positioned between the primary sensory cortices whose inputs they integrate.
(2) In later portions of the manuscript, it becomes clear what the authors mean when they write “whereby sensory neurons converge onto higher-order cortex while preserving space”, but I think that it would be beneficial if this statement would be better explained also in the introduction.
This has been clarified in the introduction. Specifically, we now clarify that topographic convergence means that neurons representing corresponding regions of sensory space in different primary sensory areas can project to overlapping or nearby locations in higher-order cortex. In the case of RL, this means that visual and tactile representations with corresponding spatial organization can converge onto RL neurons, including bimodal neurons.
(3) Could the authors provide some more information about RL and the rationale as to why it was chosen as the HOA that they investigated in the study?
We have expanded the Introduction to make the rationale for focusing on RL more explicit. We now introduce RL as a higher-order cortical area located between V1 and S1 that receives topographically organized input from both primary sensory cortices. We also explain that RL contains overlapping visual and tactile representations, including bimodal neurons, and that corresponding locations in visual and whisker space can converge in RL. In addition, we now note that RL has been implicated in visually guided tactile behavior and cross-modal generalization. These anatomical and functional properties make RL a particularly suitable model system for studying how aligned multisensory representations emerge.
Results:
(1) "RL was found to slightly lag behind V1 and S1". On what evidence is this statement based upon? As far as I can understand, there are no significant differences between V1 and RL besides amplitudes being higher in RL, which I don't think can be univocally interpreted as a sign that RL lags behind V1 in the developmental profile.
The evidence for a delayed RL maturation relative to V1 and S1 is limited and comes from the pattern of coefficient estimates in the linear mixed models, now shown in Supplementary Tables S1-S3, rather than from a robust difference across all measured activity features. We have therefore revised the Results to state more conservatively that RL and V1 develop more similarly during the second postnatal week, while S1 shows more mature activity features earlier in development. The full linear mixed-model comparisons using V1, S1, and RL as reference areas are provided in Supplementary Tables S1-S3.
(2) Figure 1H is very hard to read.
(a) The slopes and the intercepts have values that differ by orders of magnitude, so the slopes get squeezed and become invisible. Further, the different parts of the plots (e.g. the one of amplitude and duration) are almost overlapping, which is a bit confusing. Slopes and intercepts should also have different units of measure (see Equation 3), so I wonder how they can lie on the same axis. Can the authors try to plot the data in a manner that is easier to visually inspect?
(b) Including the "reference" (V1) intercept in H is also a bit misleading, as one might intuitively interpret it as a difference between V1 and other brain areas. Perhaps the overall differences between brain areas (regardless of age) might be best represented in a plot without age on the x-axis (only brain area). Alternatively, one might point them out directly on the plots in DG.
(c) In D-G, what do the individual dots represent? The legend states N=10 animals, but I only see ~6 dots per plot.
We thank the reviewer for these helpful points. We have revised the caption of Figure 1H and added Supplementary Tables S1-S3, which provide the full linear mixed-model estimates for each choice of reference area. These tables report the intercepts, slopes, interaction terms, confidence intervals, and significance levels in a format that avoids placing quantities with different units and scales on the same visual axis.
For the caption of Figure 1H: The V1 value corresponds to the model intercept at PN8, whereas the age coefficient corresponds to the slope for V1. The S1, RL, Age: S1, and Age: RL terms represent differences relative to this reference model. To avoid the impression that the V1 intercept represents a difference between areas, we now explicitly state that the coefficients in Figure 1H are interpreted relative to V1 at PN8, and that the complete comparisons using S1 and RL as reference areas are provided in Supplementary Tables S2 and S3.
Finally, we clarified that the individual points in Figure 1D–G represent animal-level averages for each cortical area at the indicated age. The value N = 9 refers to the total number of animals included across the dataset, not to the number of animals at each postnatal age. Because recordings were distributed across ages and some points overlap visually, fewer points are visible in individual panels than the total N.
(3) Figure 2B-C: at which lag does this correlation peak? Is it at 0ms? Or does one brain area precede/follow the other one?
We thank the reviewer for this comment. We have revised Figure 2 to include a lagged V1–S1 cross-correlation analysis. The V1–S1 correlation peaks close to zero lag and decreases for both positive and negative lags, indicating that the dominant temporal relationship is near-synchronous rather than consistent with fixed-delay propagation from one primary sensory cortex to the other. The curves show a mild asymmetry, with somewhat stronger correlations when S1 precedes V1, but because the dominant peak is near zero lag, we interpret the data primarily as evidence for near-synchronous, spatially structured coactivity across areas rather than stereotyped travelling-wave propagation. We have added this interpretation to the Results and clarified the temporal-lag convention in the Figure 2 legend.
(4) Figure 2D-E: in the methods section the authors report that "The actual color of each pixel represents the highest coefficient of correlation value across the three channels." I think that this important information should be included in the main text or the legend of the figure.
We have changed Fig. 2 now to clarify the quantification of the functional correlation maps and also added the information requested by the reviewer to the figure legend.
(5) Figure 3D: I think that it would be beneficial if the authors would highlight directly in the figure that those connectivity matrices are between V1/S1 and RL.
This information has been added to the figure.
(6) Figure 3I: does the vertical line correspond to the "critical amount of temporal correlation" (eq. 2)? If so, could the authors provide this information in the figure or the figure legend?
This line was unintentional and has been removed.
(7) It would be nice if the data that was generated for this study (and the data that has already been published and was used to generate Figure 2) would be made publicly available on an open-access repository.
We agree that open data sharing is important. We have made the code used for the model and figure generation available in the repository listed in the Data and Code Availability section. At present, we are not able to deposit the complete raw imaging datasets in an open repository because the wide-field and two-photon imaging files are very large, amounting to multiple terabytes, and we do not currently have a sustainable hosting solution for these raw data. We will share data upon request, and we will deposit the raw imaging datasets in an appropriate open repository if a feasible long-term hosting solution becomes available.
References
M. Chini, T. Pfeffer, and I. Hanganu-Opatz. An increase of inhibition drives the developmental decorrelation of neural activity. eLife, 11:e78811, 2022.
P. Golshani, J. T. Gonçalves, S. Khoshkhoo, R. Mostany, S. Smirnakis, and C. PorteraCailliau. Internally mediated developmental desynchronization of neocortical network activity. Journal of Neuroscience, 29(35):10890–10899, 2009.
A. Gribizis, X. Ge, T. L. Daigle, J. B. Ackman, H. Zeng, D. Lee, and M. C. Crair. Visual cortex gains independence from peripheral drive before eye opening. Neuron, 104(4):711–723.e3, 2019.
S. Lakhera, E. Herbert, and J. Gjorgjieva. Modeling the emergence of circuit organization and function during development. Cold Spring Harbor Perspectives in Biology, 17(2):a041511, 2025.
A. H. Leighton, J. E. Cheyne, G. J. Houwen, P. P. Maldonado, F. De Winter, C. N. Levelt, and C. Lohmann. Somatostatin interneurons restrict cell recruitment to retinally driven spontaneous activity in the developing cortex. Cell Reports, 36(1):109316, 2021.
H. Matsumoto, T. Murakami, and K. Ohki. Topographic correspondence between retinotopic and whisker somatosensory map in mouse higher visual area and its development. Frontiers in Neural Circuits, 19:1552130, 2025.
T. Murakami, T. Matsui, M. Uemura, and K. Ohki. Modular strategy for development of the hierarchical visual network in mice. Nature, 608:578–585, 2022.
N. L. Rochefort, O. Garaschuk, R.-I. Milos, M. Narushima, N. Marandi, B. Pichler, Y. Kovalchuk, and A. Konnerth. Sparsification of neuronal activity in the visual cortex at eyeopening. Proceedings of the National Academy of Sciences of the United States of America, 106(35):15049–15054, 2009.



