Peer review process
Revised: This Reviewed Preprint has been revised by the authors in response to the previous round of peer review; the eLife assessment and the public reviews have been updated where necessary by the editors and peer reviewers.
Read more about eLife’s peer review process.Editors
- Reviewing EditorClare PressUniversity College London, London, United Kingdom
- Senior EditorYanchao BiPeking University, Beijing, China
Reviewer #1 (Public review):
Summary:
This paper proposes a new model of perceptual habituation and tests it over two experiments with both infants and adults. The model combines a neural network for visual processing with a Bayesian rational model for attention (i.e., looking time) allocation. This Bayesian framework allows the authors to measure elegantly diverse factors that might drive attention, such as expected information gain, current information gain, and surprise. The model is then fitted to infant and adult participants' data over two experiments, which systematically vary the amount of habituation trials (Experiment 1) and the type of dishabituation stimulus (familiarity, pose, number, identity and animacy). Results show that a model based on (expected) information gain performs better than a model based on surprise. Additionally, while novelty preference is observed when exposure to familiar stimuli is elevated, no familiarity preference is observed when exposure to familiar stimuli is low or intermediate, which is in contrast with past work.
Strengths:
There are three key strengths of this work:
(1) It integrates a neural network model with a Bayesian rational learner, thus bridging the gap between two fields that have often been disconnected. This is rarely seen in the cognitive science field, but the advantages are very clear from this paper: It is possible to have computational models that not only process visual information, but also actively explore the environment based on overarching attentional processes.
(2) By varying parametrically the amount of stimulus exposure and by testing the effects of multiple novel stimulus types, this work allowed the authors to put classical theories of habituation to the test on much finer scales than previous research has done.
(3) The Bayesian model allows the authors to test what specific aspects are different in infants and adults, showing that infants display greater values for the noise parameter.
Weaknesses:
This model pertains visual habituation. What drives infants' (dis)engagement of attention more broadly, for example, when learning the probabilistic structures of the environment around them (e.g., language, action prediction) may follow different principles and dynamics.
Author response:
The following is the authors’ response to the original reviews.
Reviewer #1 (Public review):
Weakness:
Although a familiarity preference is not found, it is possible that this is related to the nature of the stimuli and the amount of learning that they offer. While infants here are exposed to the same perceptual stimulus repeatedly, infants can also be familiarised to more complex stimuli or scenarios. Classical statistical learning studies for example expose infants to specific pseudo-words during habituation/familiarisation, and then test their preference for familiar vs novel streams of pseudo-words. The amount of learning progress in these probabilistic learning studies is greater than in perceptual studies, and familiarity preferences may thus be more likely to emerge there. For these reasons, I think it is important to frame this as a model of perceptual habituation. This would also fit well with the neural net that was used, which is processing visual stimuli rather than probabilistic structures. If statements in the discussion are limited to perceptual paradigms, they would make the arguments more compelling.
Thank you for your thoughtful feedback. We have now qualified our claims more explicitly throughout the manuscript to clarify the scope of our study. Specifically, we have made the following revisions:
(1) Title Update: We have modified the title to “A stimulus-computable rational model of visual habituation in infants and adults” to explicitly specify the domain of our model.
(2) Qualifying Language Throughout Introduction: We have refined our language throughout the introduction to ensure the scope of our claims is clear. Specifically, we have emphasized that our model applies to visual habituation paradigms by incorporating qualifying language where relevant. At the end of Section 1, we have revised the statement to: "Habituation and dishabituation to sequential visual stimuli are well described by a rational analysis of looking time." This clarification makes sure that our model is framed within the context of visual habituation paradigms, particularly those involving structured sequences of stimuli, while acknowledging that habituation extends beyond the specific cases we study.
(3) New Paragraph on Scope in the Introduction: We have added language in the Introduction acknowledging that while visual habituation is a fundamental mechanism for learning, it is not the only form of habituation. Specifically, we highlight that: “While habituation is a broadly studied phenomenon across cognitive domains—including language acquisition, probabilistic learning, and concept formation—our focus here is on visual habituation, where infants adjust their attention based on repeated exposure to a visual stimulus.”
(4) New Paragraph on Scope in the General Discussion: We have also revisited this issue in the General Discussion. We added a dedicated paragraph discussing the scope: “This current work focuses on visual habituation, a fundamental but specific form of habituation that applies to sequential visual stimuli. While habituation has been studied across various domains, our model is specifically designed to account for looking time changes in response to repeated visual exposure. This focus aligns with our choice of perceptual representations derived from CNNs, which process visual inputs rather than abstract probabilistic structures. Visual habituation plays a foundational role in infant cognition, as it provides a mechanism for concept learning based on visual experience. However, it does not encompass all forms of habituation, particularly those involving complex rule learning or linguistic structures. Future work should investigate whether models like RANCH can be extended to capture habituation mechanisms in other learning contexts.”
Reviewer #2 (Public review):
There are no formal tests of the predictions of RANCH against other leading hypotheses or models of habituation. This makes it difficult to evaluate the degree to which RANCH provides an alternative account that makes distinct predictions from other accounts. I appreciate that because other theoretical descriptions haven't been instantiated in formal models this might be difficult, but some way of formalising them to enable comparison would be useful.
We appreciate the reviewer's concern regarding formal comparisons between RANCH and other leading hypotheses of habituation. A key strength of RANCH is that it provides quantitative, stimulus-computable predictions of looking behavior—something that existing theoretical accounts do not offer. Because previous models can not generate predictions about behaviors, we can not directly compare the previous model with RANCH.
The one formal model that the reviewer might be referring to is the Goldilocks model, discussed in the introduction and shown in Figure 1. We did in fact spend considerable time in an attempt to implement a version of the Goldilocks model as a stimulus-computable framework for comparison. However, we found that it required too many free parameters, such as the precise shape of the inverted U-shape that the Goldilocks model postulates, making it difficult to generate robust predictions that we would feel confident attributing to this model specifically. This assertion may come as a surprise to a reader who expects that formal models should be able to make predictions across many situations, but prior models 1) cannot be applied to specific stimuli, and 2) do not generate dynamics of looking time within each trial. These are both innovations of our work. Instead, even prior formal proposals derive metrics (e.g., surprisal) that can only be correlated with aggregate looking time. And prior, non-formalized theories, such as the Hunter and Ames model, are simply not explicit enough to implement.
To clarify this point, we have now explicitly stated in the Introduction that existing models are not stimulus-computable and do not generate predictions for looking behavior at the level of individual trials:
“Crucially, RANCH is the first stimulus-computable model of habituation, allowing us to derive quantitative predictions from raw visual stimuli. Previous theoretical accounts have described broad principles of habituation, but they do not generate testable, trial-by-trial predictions of looking behavior. As a result, direct comparisons between RANCH and these models remain challenging: existing models do not specify how an agent decides when to continue looking or disengage, nor do they provide a mechanistic link between stimulus properties and looking time. By explicitly modeling these decision processes, RANCH moves beyond post-hoc explanations and offers a computational framework that can be empirically validated and generalized to new contexts.”
We also highlight that our empirical comparisons in Figure 1 evaluate theoretical predictions based on existing conceptual models using behavioral data, rather than direct model-to-model comparisons:
“Addressing these three challenges allowed us to empirically test competing hypotheses about habituation and dishabituation using our experimental data (Figure
\ref{fig:conceptual}). However, because existing models do not generate quantitative predictions, we could not directly compare RANCH to alternative computational models. Instead, we evaluated whether RANCH accurately captured key behavioral patterns in looking time.”
The justification for using the RMSEA fitting approach could also be stronger - why is this the best way to compare the predictions of the formal model to the empirical data? Are there others? As always, the main issue with formal models is determining the degree to which they just match surface features of empirical data versus providing mechanistic insights, so some discussion of the level of fit necessary for strong inference would be useful.
Thank you for recommending additional clarity on our choice of evaluation metrics. RMSE is a very standard measure (for example, it’s the error metric used in fitting standard linear regression!). On the other hand, it captures absolute rather than relative errors. Correlation-based measures (e.g., r and r2-type measures) provide a measure of relative distance between predictive measures. In our manuscript we reported both RMSE and R². In the revised manuscript, we have now:
(1) Added a paragraph in the main text explaining that RMSE captures the absolute error in the same units as looking time, whereas r² reflects the relative proportion of variance explained by the model:
“RANCH predictions qualitatively matched habituation and dishabituation in both infants and adults. To quantitatively evaluate these predictions, we fit a linear model (adjusting model‐generated samples by an intercept and scaling factor) and then assessed two complementary metrics. First, the root mean squared error (RMSE) captures the absolute error in the same units as looking time. Second, the coefficient of determination ($R^2$) measures the relative variation in looking time that is explained by the scaled model predictions. Since each metric relies on different assumptions and highlights distinct aspects of predictive accuracy, they together provide a more robust assessment of model performance. We minimized overfitting by employing cross‐validation—using a split‐half design for infant data and ten‐fold for adult data—to compute both RMSE and $R^2$ on held‐out samples.”
(2) We updated Table 1 to include both RMSE and R² for each model variant and linking hypothesis. We now reported both RMSE and R² across the two experiments.
We hope these revisions address your concerns by offering a more comprehensive and transparent assessment of our model’s predictive accuracy.
Regarding your final question, the desired level of fit for insight, our view is that – at least in theory development – measures of fit should always be compared between alternatives (rather than striving for some absolute level of prediction). We have attempted to do this by comparing fit within- and across-samples and via various ablation studies. We now make this point explicit in the General Discussion:
More generally, while there is no single threshold for what constitutes a “good” model fit, the strength of our approach lies in the relative comparisons across model variants, linking hypotheses, and ablation studies. In this way, we treat model fit not as an absolute benchmark, but as an empirical tool to adjudicate among alternative explanations and assess the mechanistic plausibility of the model’s components.
The difference in model predictions for identity vs number relative to the empirical data seems important but isn't given sufficient weight in terms of evaluating whether the model is or is not providing a good explanation of infant behavior. What would falsification look like in this context?
We appreciate the reviewer’s observation regarding the discrepancy between model predictions and the empirical data for identity vs.~number violations. We were also very interested in this particular deviation and we discuss it in detail in the General Discussion, noting that RANCH is currently a purely perceptual model, whereas infants’ behavior on number violations may reflect additional conceptual factors. Moreover, because this analysis reflects an out-of-sample prediction, we emphasize the overall match between RANCH and the data (see our global fit metrics) rather than focusing on a single data point. Infant looking time data also exhibit considerable noise, so we caution against over-interpreting small discrepancies in any one condition. In principle, a more thorough “falsification” would involve systematically testing whether larger deviations persist across multiple studies or stimulus sets, which is beyond the scope of the current work.
For the novel image similarity analysis, it is difficult to determine whether any differences are due to differences in the way the CNN encodes images vs in the habituation model itself - there are perhaps too many free parameters to pinpoint the nature of any disparities. Would there be another way to test the model without the CNN introducing additional unknowns?
Thank you for raising this concern. In our framework, the CNN and the habituation model operate jointly to generate predictions, so it can be challenging to parse out whether any mismatches arise specifically from one component or the other. However, we are not worried that the specifics of our CNN procedure introduces free parameters because:
(1) The CNN introduces no additional free parameters in our analyses, because it is a pre‐trained model not fitted to our data.
(2) We tested multiple CNN embeddings and observed similar outcomes, indicating that the details of the CNN are unlikely to be driving performance (Figure 12).
Moreover, the key contribution of our second study is precisely that the model can generalize to entirely novel stimuli without any parameter adjustments. By combining a stable, off‐the‐shelf CNN with our habituation model, we can make out‐of‐sample predictions—an achievement that, to our knowledge, no previous habituation model has demonstrated.
Related to that, the model contains lots of parts - the CNN, the EIG approach, and the parameters, all of which may or may not match how the infant's brain operates. EIG is systematically compared to two other algorithms, with KL working similarly - does this then imply we can't tell the difference between an explanation based on those two mechanisms? Are there situations in which they would make distinct predictions where they could be pulled apart? Also in this section, there doesn't appear to be any formal testing of the fits, so it is hard to determine whether this is a meaningful difference. However, other parts of the model don't seem to be systematically varied, so it isn't always clear what the precise question addressed in the manuscript is (e.g. is it about the algorithm controlling learning? or just that this model in general when fitted in a certain way resembles the empirical data?)
Thank you for highlighting these points about the model’s components and the comparison of EIG- vs. KL-based mechanisms. Regarding the linking hypotheses (EIG, KL, and surprisal), our primary goal was to assess whether rational exploration via noisy perceptual sampling could account for habituation and dishabituation phenomena in a stimulus-computable fashion. Although RANCH contains multiple elements—including the CNN for perceptual embedding, the learning model, and the action policy (EIG or KL)—we did systematically vary the “linking hypothesis” (i.e., whether sampling is driven by EIG, KL, or surprisal). We found that EIG and KL gave very similar fits, while surprisal systematically underperformed.
We agree that future experiments could be designed to produce diverging predictions between EIG and KL, but examining these subtle differences is beyond the scope of our current work. Here, we sought to establish that a rational model of habituation, driven by noisy perceptual sampling, can deliver strong quantitative predictions—even for out-of-sample stimuli—rather than to fully disentangle forward- vs. backward-looking information metrics.
We disagree, however, that we did not evaluate or formally compare other aspects of the model. In Table 1 we report ablation studies of different aspects of the model architecture (e.g., removal of learning and noise components). Further, the RMSE and R² values reported in Table 1 and Section 4.2.3 can be treated as out-of-sample estimates of performance and used for direct comparison (because Table 1 uses cross-validation and Section 4.2.3 reports out of sample predictions).
Perhaps the reviewer is interested in statistical hypothesis tests, but we do not believe these are appropriate here. Cross-validation provides a metric of out-of-sample generalization and model selection based on the resulting numerical estimates. Significance testing is not typically recommended, except in a limited subset of cases (see e.g. Vanwinckelen & Blokeel, 2012 and Raschka, 2018).
Reviewer #1 (Recommendations for the authors):
"We treat the number of samples for each stimulus as being linearly related to looking time duration." Looking times were not log transformed?
Thank you for your question. The assumption of a linear relationship between the model’s predicted number of samples and looking time duration is intended as a measurement transformation, not a strict assumption about the underlying distribution of looking times. This linear mapping is used simply to establish a direct proportionality between model-generated samples and observed looking durations.
However, in our statistical analyses, we do log-transform the empirical looking times to account for skewness and stabilize variance. This transformation is standard practice when analyzing infant looking time data but is independent of how we map model predictions to observed times. Since there is no a priori reason to assume that the number of model samples must relate to looking time in a strictly log-linear way, we retained a simple linear mapping while still applying a log transformation in our analytic models where appropriate.
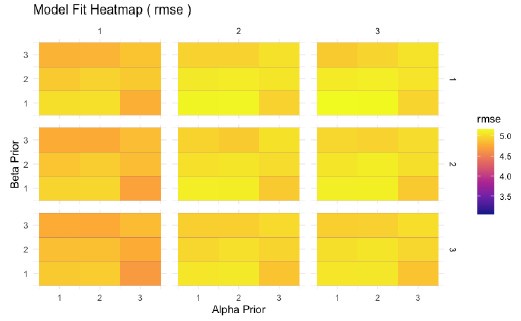
It would be nice to have figures showing the results of the grid search over the parameter values. For example, a heatmap with sigma on x and eta on y, and goodness of fit indicated by colour, would show the quality of the model fit as a function of the parameters' values, but also if the parameters estimates are correlated (they shouldn't be).
Thank you for the suggestion. We agree that visualizing the grid search results can provide a clearer picture of how different parameter values affect model fit. In the supplementary materials, we already present analyses where we systematically search over one parameter at a time to find the best-fitting values.
We also explored alternative visualizations, including heatmaps where sigma and eta are mapped on the x and y axes, with goodness-of-fit indicated by color. However, we found that the goodness of fit was very similar across parameter settings, making the heatmaps difficult to interpret due to minimal variation in color. This lack of variation in fit reflects the observation that our model predictions are robust to changes in parameter settings, which allows us to report strong out of sample predictions in Section 4. Instead, we opted to use histograms to illustrate general trends, which provide a clearer and more interpretable summary of the model fit across different parameter settings. Please see the heatmaps below, if you are interested.
Author response image 1.
Model fit (measured by RMSE) across a grid of prior values for Alpha, Beta, and V shows minimal variation. This indicates that the model’s performance is robust to changes in prior assumptions.
Regarding section 5.4, paragraph 2: It might be interesting to notice that a potential way to decorrelate these factors is to look at finer timescales (see Poli et al., 2024, Trends in Cognitive Sciences), which the current combination of neural nets and Bayesian inference could potentially be adapted to do.
Thank you for this insightful suggestion. We agree that examining finer timescales of looking behavior could provide valuable insights into the dynamics of attention and learning. In response, we have incorporated language in Section 5.4 to highlight this as a potential future direction:
Another promising direction is to explore RANCH’s applicability to finer timescales of looking behavior, enabling a more detailed examination of within-trial fluctuations in attention. Recent work suggests that analyzing moment-by-moment dynamics can help disentangle distinct learning mechanisms \autocite{poli2024individual}.Since RANCH models decision-making at the level of individual perceptual samples, it is well-suited to capture these fine-grained attentional shifts.
Previous work integrating neural networks with Bayesian (like) models could be better acknowledged: Blakeman, S., & Mareschal, D. (2022). Selective particle attention: Rapidly and flexibly selecting features for deep reinforcement learning. Neural Networks, 150, 408-421.
Thank you for this feedback. We have now incorporated this citation into our discussion section:
RANCH integrates structured perceptual representations with Bayesian inference, allowing for stimulus-computable predictions of looking behavior and interpretable parameters at the same time. This integrated approach has been used to study selective attention \autocite{blakeman2022selective}.
Unless I missed it, I could not find an OSF repository (although the authors refer to an OSF repository for a previous study that has not been included). In general, sharing the code would greatly help with reproducibility.
Thanks for this comment. We apologize that – although all of our code and data were available through github, we did not provide links in the manuscript. We have now added this at the end of the introduction section.
Reviewer #2 (Recommendations for the authors):
Page 7 "infants clearly dishabituated on trials with longer exposures" - what are these stats comparing? Novel presentation to last familiar?
Thank you for pointing out this slightly confusing passage. The statistics reported are comparing looking time in looking time between the novel and familiar test trials after longer exposures. We have now added the following language:
Infants clearly dishabituated on trials with longer exposures, looking longer at the novel stimulus than the familiar stimulus after long exposure.
Order effects were covaried in the model - does the RANCH model predict similar order effects to those observed in the empirical data, ie can it model more generic changes in attention as well as the stimulus-specific ones?
Thank you for this question. If we understand correctly, you are asking whether RANCH can capture order effects over the course of the experiment, such as general decreases in attention across blocks. Currently, RANCH does not model these block-level effects—it is designed to predict stimulus-driven looking behavior rather than more general attentional changes that occur over time such as fatigue. In our empirical analysis, block number was included as a covariate to account for these effects statistically, but RANCH itself does not have a mechanism to model block-to-block attentional drift independent of stimulus properties. This is an interesting direction for future work, where a model could integrate global attentional dynamics alongside stimulus-specific learning. To address this, we have added a sentence in the General Discussion saying:
Similarly, RANCH does not capture more global attention dynamics, such as block-to-block attentional drift independent of stimulus properties.
"We then computed the root mean squared error (RMSE) between the scaled model results and the looking time data." Why is this the most appropriate approach to considering model fit? Would be useful to have a brief explanation.
Thank you for pointing this out. We believe that we have now addressed this issue in Response to Comment #2 from Reviewer 1.
The title of subsection 3.3 made me think that you would be comparing RANCH to alternate hypotheses or models but this seems to be a comparison of ways of fitting parameters within RANCH - I think worth explaining that.
We have now added a sentence in the subsection to make the content of the comparison more explicit:
Here we evaluated different ways of specifying RANCH's decision-making mechanism (i.e., different "linking hypotheses" within RANCH).
3.5 would be useful to have some statistics here - does performance significantly improve?
As discussed above, we systematically compared model variants using cross-validated RMSE and R² values, which provide quantitative evidence of improved performance. While these differences are substantial, we do not report statistical hypothesis tests, as significance testing is not typically appropriate for model comparison based on cross-validation (see Vanwinckelen & Blockeel, 2012; Raschka, 2018). Instead, we rely on out-of-sample predictive performance as a principled basis for evaluating model variants.
It would be very helpful to have a formal comparison of RANCH and other models - this seems to be largely descriptive at the moment (3.6).
We believe that we have now addressed this issue in our response to the first comment.
Does individual infant data show any nonlinearities? Sometimes the position of the peak look is very heterogenous and so overall there appears to be no increase but on an individual level there is.
Thank you for your question. Given our experimental design, each exposure duration appears in separate blocks rather than in a continuous sequence for each infant. Because of this, the concept of an individual-level nonlinear trajectory over exposure durations does not directly apply. Instead, each infant contributes looking time data to multiple distinct conditions, rather than following a single increasing-exposure sequence. Any observed nonlinear trend across exposure durations would therefore be a group-level effect rather than a within-subject pattern.
In 4.1, why 8 or 9 exposures rather than a fixed number?
We used slightly variable exposure durations to reduce the risk that infants develop fixed expectations about when a novel stimulus will appear. We have now clarified this point in the text.
Why do results differ for the model vs empirical data for identity? Is this to do with semantic processing in infants that isn't embedded in the model?
Thank you for your comment. The discrepancy between the model and empirical data for identity violations is related to the discrepancy we discussed for number violations in the General Discussion. As noted there, RANCH relies on perceptual similarity derived from CNN embeddings, which may not fully capture distinctions that infants make.
The model suggests the learner’s prior on noise is higher in infants than adults, so produces potentially mechanistic insights.
We agree! One of the key strengths of RANCH is its ability to provide mechanistic insights through interpretable parameters. The finding that infants have a higher prior on perceptual noise than adults aligns with previous research suggesting that early visual processing in infants is more variable and less precise.


