Peer review process
Revised: This Reviewed Preprint has been revised by the authors in response to the previous round of peer review; the eLife assessment and the public reviews have been updated where necessary by the editors and peer reviewers.
Read more about eLife’s peer review process.Editors
- Reviewing EditorBrice BathellierCentre National de la Recherche Scientifique, Paris, France
- Senior EditorAndrew KingUniversity of Oxford, Oxford, United Kingdom
Reviewer #1 (Public review):
Summary:
Kang et al. provide the first experimental insights from holographic stimulation of auditory cortex. Using stimulation of functionally-defined ensembles, they test whether overactivation of a specific subpopulation biases simultaneous and subsequent sensory-evoked network activations.
Strengths:
The investigators use a novel technique to investigate the sensory response properties in functionally defined cell assemblies in auditory cortex. These data provide the first evidence of how acutely perturbing specific frequency-tuned neurons impacts the tuning across a broader population. Their revised manuscript appropriately tempers any claims about specific plasticity mechanisms involved.
Weaknesses:
Although the single cell analyses in this manuscript are comprehensive, questions about how holographic stimulation impacts population coding are left to future manuscripts, or perhaps re-analyses of this unique dataset.
Reviewer #2 (Public review):
The goal of HiJee Kang et al. in this study is to explore the interaction between assemblies of neurons with similar pure-tone selectivity in mouse auditory cortex. Using holographic optogenetic stimulation in a small subset of target cells selective for a given pure tone (PTsel), while optically monitoring calcium activity in surrounding non-target cells, they discovered a subtle rebalancing process: co-tuned neurons that are not optogenetically stimulated tend to reduce their activity. The cortical network reacts as if an increased response to PTsel in some tuned assemblies is immediately offset by a reduction in activity in the rest of the PTsel-tuned assemblies, leaving the overall response to PTsel unchanged. The authors show that this rebalancing process affects only the responses of neurons to PTsel, not to other pure tones. They also show that assemblies of neurons that are not selective for PTsel don't participate in the rebalancing process. They conclude that assemblies of neurons with similar pure-tone selectivity must interact in some way to organize this rebalancing process, and they suggest that mechanisms based on homeostatic signaling may play a role.
The authors have successfully controlled for potential artefacts resulting from their optogenetic stimulation. This study is therefore pioneering in the field of the auditory cortex (AC), as it is the first to use single-cell optogenetic stimulation to explore the functional organization of AC circuits in vivo. The conclusions of this paper are very interesting. They raise new questions about the mechanisms that could underlie such a rebalancing process.
(1) This study uses an all-optical approach to excite a restricted group of neurons chosen for their functional characteristics (their frequency tuning), and simultaneously record from the entire network observable in the FOV. As stated by the authors, this approach is applied for the first time to the auditory cortex, which is a tour de force. However, such approach is complex and requires precise controls to be convincing. The authors provide important controls to demonstrate the precise ability of their optogenetic methods. In particular, holographic patterns used to excite 5 cells simultaneously may be associated with out-of-focus laser hot spots. Cells located outside of the FOV could be activated, therefore engaging other cells than the targeted ones in the stimulation. This would be problematic in this study as their tuning may be unrelated to the tuning of the targeted cells. To control for such effect, the authors have decoupled the imaging and the excitation planes, and checked for the absence of out-of-focus unwanted excitation (Suppl Fig1).
(2) In the auditory cortex, assemblies of cells with similar pure-tone selectivity are linked together not only by their ability to respond to the same sound, but also by other factors. This study clearly shows that such assemblies are structured in a way that maintains a stable global response through a rebalancing process. If a group of cells within an assembly increases its response, the rest of the assembly must be inhibited to maintain the total response.
One surprising result is the clear boundary between assemblies: a rebalancing process occurring in one assembly does not affect the response in another assembly comprising cells tuned to a different frequency. However, this is slightly challenged by the data shown in Figure 3.
Figure 3B-left, for example, shows that, compared to controls, non-target 16 kHz-preferring neurons only decrease their response to a 16 kHz pure tone when the cells targeted by the opto stimulation also prefer 16 kHz, but not when the targeted cells prefer 54 kHz. However, the inverse is not entirely true. Again compared to controls, Figure 3B (right) shows that non-target 54 kHz-preferring neurons decrease their response to a 54 kHz pure tone when the targeted cells also prefer 54 kHz; however, they also tend to be inhibited when the targeted cells prefer 16 kHz.
The authors suggest this may be due to the partial activation of 54 kHz-preferring cells by 16 kHz tones and propose examining the response of highly selective neurons. The results are shown in Figure 3F. It would have been more logical to show the same results as in Figure 3B, but with the left part restricted to highly 16 kHz-selective cells and the right part to highly 54 kHz-selective cells. However, the authors chose to pool all responses to 16 kHz and 54 kHz tones in every triplet of conditions (control, opto stimulation on 16 kHz-preferring cells and opto stimulation on 54 kHz-preferring cells), which blurs the result of the analysis.
Author response:
The following is the authors’ response to the original reviews
We would like to thank you and the reviewers for valuable feedback on the first version of the manuscript. We now addressed all of the issues raised by reviewers, mostly by implementing the suggested changes and clarifying important details in the revised version of the manuscript. A detailed response to each comment is provided in the rebuttal letter. Briefly, the main changes were as follow:
- We changed homeostatic balance to network balance especially when describing the main finding as the response changes induced by the stimulation occurred on a fast timescale. We speculate the sustained changes observed in the post-stimulation condition are the result of homeostatic mechanisms.
- We added additional verification on the target stimulation effect by adding a supplementary result showing its effect between the target and off-target z-planes, as well as demonstrating the minimal impact of the imaging laser to rsChRmine.
- We added a simple toy model illustrating suppression specifically applied to co-tuned cells that yields the response amplitude decrease, to further support our findings.
Public Reviews:
Reviewer #1 (Public review):
Summary:
Kang et al. provide the first experimental insights from holographic stimulation of auditory cortex. Using stimulation of functionally-defined ensembles, they test whether overactivation of a specific subpopulation biases simultaneous and subsequent sensory-evoked network activations.
Strengths:
The investigators use a novel technique to investigate the sensory response properties in functionally defined cell assemblies in auditory cortex. These data provide the first evidence of how acutely perturbing specific frequency-tuned neurons impacts the tuning across a broader population.
Weaknesses:
I have several main concerns about the interpretation of these data:
(1) The premise of the paper suggests that sensory responses are noisy at the level of neurons, but that population activity is reliable and that different neurons may participate in sensory coding on different trials. However, no analysis related to single trial variance or overall stability of population coding is provided. Specifically, showing that population activity is stable across trials in terms of total activity level or in some latent low dimensional representation would be required to support the concept of "homeostatic balancing".
Thank you for raising an important point. We agree that the term ‘homeostatic balancing’ may be not the best term to be applied to explain the main results. We now have toned down on the homeostatic plasticity aspect to explain the main result. We have changed the term to a simple ‘network balance’, potentially due to various factors including rapid synaptic plasticity. We speculate the persistent activity of co-tuned cells in the post-stimulation session as a result of homeostatic balance, instead of rapidly changing back their responses to the baseline. Relevant changes are implemented throughout the manuscript including Introduction (e.g., lines 76-78) and Discussion sections (e.g., lines 453-456).
(2) Rebalancing would predict either that the responses of stimulated neurons would remain A) elevated after stimulation due to a hebbian mechanism or B) suppressed due to high activity levels on previous trials, a homeostatic mechanism. The authors report suppression in targeted neurons after stimulation blocks, but this appears similar to all other non-stimulated neurons. How do the authors interpret the post-stimulation effect in stimulated neurons?
It is true that the post stimulation effect of no response change both from co-tuned and non co-tuned neurons, and both from stimulation and control sessions. This could be due to neuronal activity being adapted and decreased enough from the consecutive presentation of acoustic stimuli themselves. However, we still think that if the stimulation driven co-tuned non stimulated neurons’ response decrease is highly driven by stimulation without homeostasis, at least their responses should bounce back during the post-stimulation. We agree that further investigation would be required to further confirm such effect. We elaborated this as another discussion point in the discussion section (lines 457-464).
(3) The authors suggest that ACtx is different from visual cortex in that neurons with different tuning properties are intermingled. While that is true at the level of individual neurons, there is global order, as demonstrated by the authors own widefield imaging data and others at the single cell level (e.g. Tischbirek et al. 2019). Generally, distance is dismissed as a variable in the paper, but this is not convincing. Work across multiple sensory systems, including the authors own work, has demonstrated that cortical neuron connectivity is not random but varies as a function of distance (e.g. Watkins et al. 2014). Better justification is needed for the spatial pattern of neurons that were chosen for stimulation. Further, analyses that account for center of mass of stimulation, rather than just the distance from any stimulated neuron would be important to any negative result related to distance.
Thank you for the further suggestion regarding the distance matter. While Watkins et al., 2014 and Levy and Reyes (2012) showed stronger connectivity for nearby cells as well as for more distant patches, on a functional level, Winkowski & Kanold 2013 showed high frequency heterogeneity especially in L2/3, where we targeted to image in this study. Thus, connected cells can have varied tuning consistent with spine imaging (Konnerth paper). We now also calculated the distance based on the center of mass of target cells to calculate the distance effect for an additional verification and still observed no distance related stimulation effect. We now replaced the Figure 4B with the result from the center of mass calculation.
(4) Data curation and presentation: Broadly, the way the data were curated and plotted makes it difficult to determine how well-supported the authors claims are. In terms of curation, the removal of outliers 3 standard deviations above the mean in the analysis of stimulation effects is questionable. Given the single-cell stimulation data presented in Figure 1, the reader is led to believe that holographic stimulation is quite specific. However, the justification for removing these outliers is that there may be direct stimulation 20-30 um from the target. Without plotting and considering the outliers as well, it is difficult to understand if these outsized responses are due to strong synaptic connections with neighboring neurons or rather just direct off-target stimulation. Relatedly, data presentation is limited to the mean + SEM for almost all main effects and pre-post stimulation effects are only compared indirectly. Whether stimulation effects are driven by just a few neurons that are particularly suppressed or distinct populations which are suppressed or enhanced remains unclear.
Thank you for pointing this out. Now we specifically removed neighboring cells that are < 20 um from the target point and we observed similar. We replaced all the relevant figures, texts, and statistical results to ensure that the exclusion was specific to overlapping neighboring cells.
Reviewer #2 (Public review):
The goal of HiJee Kang et al. in this study is to explore the interaction between assemblies of neurons with similar pure-tone selectivity in mouse auditory cortex. Using holographic optogenetic stimulation in a small subset of target cells selective for a given pure tone (PTsel), while optically monitoring calcium activity in surrounding non-target cells, they discovered a subtle rebalancing process: co-tuned neurons that are not optogenetically stimulated tend to reduce their activity. The cortical network reacts as if an increased response to PTsel in some tuned assemblies is immediately offset by a reduction in activity in the rest of the PTsel-tuned assemblies, leaving the overall response to PTsel unchanged. The authors show that this rebalancing process affects only the responses of neurons to PTsel, not to other pure tones. They also show that assemblies of neurons that are not selective for PTsel don't participate in the rebalancing process. They conclude that assemblies of neurons with similar pure-tone selectivity must interact in some way to organize this rebalancing process, and they suggest that mechanisms based on homeostatic signaling may play a role.
he conclusions of this paper are very interesting but some aspects of the study including methods for optogenetic stimulation, statistical analysis of the results and interpretation of the underlying mechanisms need to be clarified and extended.
(1) This study uses an all-optical approach to excite a restricted group of neurons chosen for their functional characteristics (their frequency tuning), and simultaneously record from the entire network observable in the FOV. As stated by the authors, this approach is applied for the first time to the auditory cortex, which is a tour de force. However, such an approach is complex and requires precise controls to be convincing. In the manuscript, several methodological aspects are not sufficiently described to allow a proper understanding.
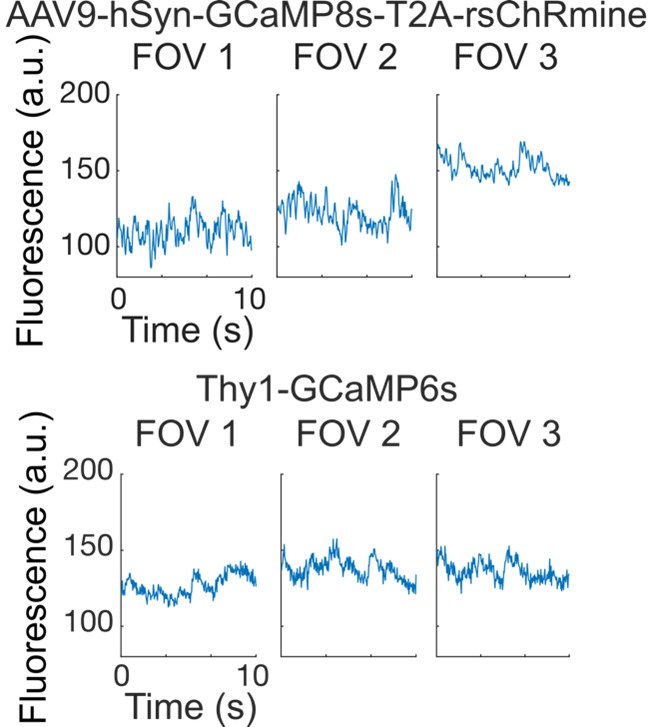
(i) The use of CRmine together with GCaMP8s has been reported as problematic as the 2Ph excitation of GCaMP8s also excites the opsin. Here, the authors use a red-shifted version of CRmine to prevent such cross excitation by the imaging laser. To be convincing, they should explain how they controlled for the absence of rsCRmine activation by the 940nm light. Showing the fluorescence traces immediately after the onset of the imaging session would ensure that neurons are not excited as they are imaged.
Thank you for pointing this out. We realized that the important reference was omitted. Kishi et al. 2022 validated the efficacy of the rsChRmine compared to ChRmine. In this paper, they compared regular ChRmine and rsChRmine activity to different wavelengths and setting and showed the efficiency of rsChRmine with reduced optical cross talk. This reference is now included in the manuscript (line 98). We also checked the spontaneous baseline activity that lasted about 10 sec. before any of the sound presentation and observed a relatively stable activity throughout, rather than any imaging session onset related activation, which is also similar to what we see from another group of GCaMP6s transgenic animals.
Author response image 1.
Baseline fluorescence activity across cells within FOVs from AAV9-hSyn-GCaMP8s-T2A-rsChRmine injected mice (top) and CBA X Thy1-GCaMP6s F1 transgenic mice (bottom). Fluorescence levels and activity patterns remain similar, suggesting no evident imaging laser-induced activation from rsChRmine. Note that GCaMP8s examples are smoothed by using moving average of 4 points as GCaMP8s show faster activity.
(ii) Holographic patterns used to excite 5 cells simultaneously may be associated with out-of-focus laser hot spots. Cells located outside of the FOV could be activated, therefore engaging other cells than the targeted ones in the stimulation. This would be problematic in this study as their tuning may be unrelated to the tuning of the targeted cells. To control for such an effect, one could in principle decouple the imaging and the excitation planes, and check for the absence of out-of-focus unwanted excitation.
We further verified whether the laser power at the targeted z-plane influences cells’ activity at nearby z-planes. As the Reviewer pointed out, the previous x- and y-axis shifts were tested by single-cell stimulation. This time, we stimulated five cells simultaneously, to match the actual experiment setup and assess potential artifacts in other planes. We observed no stimulation-driven activity increase in cells at a z-planed shifted by 20 µm (Supplementary Figure 1). This confirms the holographic stimulation accurately manipulates the pre-selected target cells and the effects we observe is not likely due to out-of-focus stimulation artifacts. It is true that not all pre-selected cells showing significant response changes prior to the main experiment are effectively activated t every trial during the experiments. We varied the target cell distances across FOVs, from nearby cells to those farther apart within the FOV. We have not observed a significant relationship between the target cell distances and stimulation effect. Lastly, cells within < 20 µm of the target were excluded to prevent potential excitation due to the holographic stimulation power. Given the spontaneous movements of the FOV during imaging sessions due to animal’s movement, despite our efforts to minimize them, we believe that any excitation from these neighboring neurons would be directly from the stimulation rather than the light pattern artifact itself.
(iii) The control shown in Figure 1B is intended to demonstrate the precision of the optogenetic stimulation: when the stimulation spiral is played at a distance larger or equal to 20 µm from a cell, it does not activate it. However, in the rest of the study, the stimulation is applied with a holographic approach, targeting 5 cells simultaneously instead of just one. As the holographic pattern of light could produce out-of-focus hot spots (absent in the single cell control), we don't know what is the extent of the contamination from non-targeted cells in this case. This is important because it would determine an objective criterion to exclude non-targeted but excited cells (last paragraph of the Result section: "For the stimulation condition, we excluded non-target cells that were within 15 µm distance of the target cells...")
Highly sensitive neurons to certain frequency also shows the greatest adaptation effect, which can be observed the control condition. Therefore, the high sensitive neurons showing greater amplitude change is first related to the neuronal adaptation to its sensitive information. However, by stimulating the co-tuned target neurons, other co-tuned non-target neurons shows significantly greater amplitude decrease, compared to either non co-tuned target neurons stimulation or control (the latter did not meet the significance level).
We also tried putting more rigorous criterion as 20 um instead of 15 um as you pointed out since the spiral size was 20 um. The result yielded further significant response amplitude decrease due to the stimulation effect only from co-tuned non-target neurons for processing their preferred frequency information.
(2) A strength of this study comes from the design of the experimental protocol used to compare the activity in non-target co-tuned cells when the optogenetic stimulation is paired with their preferred tone versus a non-preferred pure tone. The difficulty lies in the co-occurrence of the rebalancing process and the adaptation to repeated auditory stimuli, especially when these auditory stimuli correspond to a cell's preferred pure tones. To distinguish between the two effects, the authors use a comparison with a control condition similar to the optogenetic stimulation conditions, except that the laser power is kept at 0 mW. The observed effect is shown as an extra reduction of activity in the condition with the optogenetic paired with the preferred tone, compared to the control condition. The specificity of this extra reduction when stimulation is synchronized with the preferred tone, but not with a non-preferred tone, is a potentially powerful result, as it points to an underlying mechanism that links the assemblies of cells that share the same preferred pure tones.
The evidence for this specificity is shown in Figure 3A and 3D. However, the universality of this specificity is challenged by the fact that it is observed for 16kHz preferring cells, but not so clearly for 54kHz preferring cells: these 54kHz preferring cells also significantly (p = 0.044) reduce their response to 54kHz in the optogenetic stimulation condition applied to 16kHz preferring target cells compared to the control condition. The proposed explanation for this is the presence of many cells with a broad frequency tuning, meaning that these cells could have been categorized as 54kHz preferring cells, while they also responded significantly to a 16kHz pure tone. To account for this, the authors divide each category of pure tone cells into three subgroups with low, medium and high frequency preferences. Following the previous reasoning, one would expect at least the "high" subgroups to show a strong and significant specificity for an additional reduction only if the optogenetic stimulation is targeted to a group of cells with the same preferred frequency. Figure 3D fails to show this. The extra reduction for the "high" subgroups is significant only when the condition of opto-stimulation synchronized with the preferred frequency is compared to the control condition, but not when it is compared to the condition of opto-stimulation synchronized with the non-preferred frequency.
Therefore, the claim that "these results indicate that the effect of holographic optogenetic stimulation depends not on the specific tuning of cells, but on the co-tuning between stimulated and non-stimulated neurons" (end of paragraph "Optogenetic holographic stimulation decreases activity in non-target co-tuned ensembles") seems somewhat exaggerated. Perhaps increasing the number of sessions in the 54kHz target cell optogenetic stimulation condition (12 FOV) to the number of sessions in the 16kHz target cell optogenetic stimulation condition (18 FOV) could help to reach significance levels consistent with this claim.
We previously also tested by randomly subselecting 12 FOVs from 16kHz stimulation condition to match the same number of FOV between two groups and did not really see any result difference. However, to further ensure the results, we now added three more dataset for 54 kHz target cell stimulation condition (now 15 FOV) which yielded similar outcome. We have now updated the statistical values from added datasets.
(3) To interpret the results of this study, the authors suggest that mechanisms based on homeostatic signaling could be important to allow the rebalancing of the activity of assemblies of co-tuned neurons. In particular, the authors try to rule out the possibility that inhibition plays a central role. Both mechanisms could produce effects on short timescales, making them potential candidates. The authors quantify the spatial distribution of the balanced non-targeted cells and show that they are not localized in the vicinity of the targeted cells. They conclude that local inhibition is unlikely to be responsible for the observed effect. This argument raises some questions. The method used to quantify spatial distribution calculates the minimum distance of a non-target cell to any target cell. If local inhibition is activated by the closest target cell, one would expect the decrease in activity to be stronger for non-target cells with a small minimum distance and to fade away for larger minimum distances. This is not what the authors observe (Figure 4B), so they reject inhibition as a plausible explanation. However, their quantification doesn't exclude the possibility that non-target cells in the minimum distance range could also be close and connected to the other 4 target cells, thus masking any inhibitory effect mediated by the closest target cell. In addition, the authors should provide a quantitative estimate of the range of local inhibition in layers 2/3 of the mouse auditory cortex to compare with the range of distances examined in this study (< 300 µm). Finally, the possibility that some target cells could be inhibitory cells themselves is considered unlikely by the authors, given the proportions of excitatory and inhibitory neurons in the upper cortical layers. On the other hand, it should be acknowledged that inhibitory cells are more electrically compact, making them easier to be activated optogenetically with low laser power.
Minimum distance is defined as the smallest distance non-target cell to any of the target cells. Thus, if this is local inhibition, it is likely that the closest target cell would have affected the non-target cells’ response changes. We also calculated the distance based on the center of mass of target cells to calculate the distance effect for an additional verification, based on both Reviewers’ comments, and still observed no distance related stimulation effect. The result is now updated in Figure 4B.
Based on previous literature, such as Levy & Reyes 2012, the excitatory and inhibitory connectivity is known to range around 100 um distance. Our results do not necessarily show any further effect observed for cells with distance below 100 um. This suggests that such effect is not limited to local inhibition. We also added further speculation on why our results are less likely due to increased inhibition, albeit the biological characteristics of inhibitory neurons to optogenetics.
Reviewer #3 (Public review):
Summary:
The authors optogenetically stimulate 5 neurons all preferring the same pure tone frequency (16 or 54 kHz) in the mouse auditory cortex using a holography-based single cell resolution optogenetics during sound presentation. They demonstrate that the response boosting of target neurons leads to a broad suppression of surrounding neurons, which is significantly more pronounced in neurons that have the same pure tone tuning as the target neurons. This effect is immediate and spans several hundred micrometers. This suggests that the auditory cortical network balances its activity in response to excess spikes, a phenomenon already seen in visual cortex.
Strengths:
The study is based on a technologically very solid approach based on single-cell resolution two-photon optogenetics. The authors demonstrate the potency and resolution of this approach. The inhibitory effects observed upon targeted stimulation are clear and the relative specificity to co-tuned neurons is statistically clear although the effect size is moderate.
Weaknesses:
The evaluation of the results is brief and some aspects of the observed homeostatic are not quantified. For example, it is unclear whether stimulation produces a net increase or decrease of population activity, or if the homeostatic phenomenon fully balances activity. A comparison of population activity for all imaged neurons with and without stimulation would be instructive. The selectivity for co-tuned neurons is significant but weak. Although it is difficult to evaluate this issue, this result may be trivial, as co-tuned neurons fire more strongly. Therefore, the net activity decrease is expected to be larger, in particular, for the number of non-co-tuned neurons which actually do not fire to the target sound. The net effect for the latter neurons will be zero just because they do not respond. The authors do not make a very strong case for a specific inhibition model in comparison to a broad and non-specific inhibitory effect. Complementary modeling work would be needed to fully establish this point.
Thank you for raising important points. We agree that the term homeostatic balancing may have been an overstatement. We toned down regarding the homeostatic plasticity and conclude the result from the rapid plasticity at a single trial level now. Regardless, the average activity level did not differ among stimulation conditions (control, 16kHz stim, and 54kHz stim), which seems to suggest that overall activity level has been maintained regardless of the stimulation. We added a new figure of the global activity change as Fig. 4A.
We also added a simple model work in which a suppression term was applied either to all neurons or specifically to non-target co-tuned cells to test our results from the data.
Recommendations for the authors:
Reviewer #1 (Recommendations for the authors):
(1) For the first holography paper in A1, more information is needed about how holographic stimulation was performed and how stimulation artifacts were avoided or removed from the data set, especially as the text states that the PMTs were left open for the duration of the experiment.
We further clarified the rationale of leaving the shutter open to avoid any mechanic sounds to activate neurons in the AC. We further clarified that we keep the uncaging shutter open since the Bruker default setting (Software version: 5.7) opens and closes the shutter for the every iteration of the stimulation which generates extra heavy mechanical sounds which then hinders whether the activation is due to the sound or stimulation.
(2) The choice of the dF/F as the primary tool for quantifying data should be better justified. Presumably, cells have very different variances in baseline activity levels and baseline fluorescence levels that create a highly skewed distribution of responses across the population. Further, a
To take the baseline activity variances into account, we first calculate dF/F normalising to the baseline period (about 330 ms before the sound onset) right before each trial, per cell level. By doing so, we minimize any effect that could have been driven by variable baseline activity levels across neurons.
(3) More analysis should be performed to determine why 33% of stimulated cells are not activated, and instead are suppressed during stimulation. Is this related to a cells baseline fluorescence?
Great point. Although we tried our best to pre-select stimulation-responsive neurons before we start the actual experiments and head fix the animals as much as possible, these neurons do not stay as the “best stimulation-responsive neurons” throughout the entire imaging session. There can be various caveats on this. First, they seem to change their activity levels due to the optogenetic stimulation after they are exposed to acoustic stimulation. Second, since the AC is in the temporal side, it is likely to be more affected from the animals’ and their brain movements throughout the imaging session, which could be bigger than visual cortex or motor cortex. However, 33% of 5 cells is about 1.5 cells so it is usually missed about one cell on average, although some sessions have all 5 cells being stimulated while some other sessions have clearly less effective holographic stimulation effect.
We even manually visualised the fluorescence change due to the holographic stimulation before we start any imaging sessions. Regardless, they don’t stay as the ‘best stimulation responsive cells’ throughout which we cannot control the natural biological aspect of neuronal activities. Regardless, based on the significant stimulation effects observed by presenting different pure tone frequencies as well as delivering different target stimulation and no-stimulation control, we believe that the effect itself is valid. We added these caveats into the manuscript as a further discussion point and things to consider.
(4) The linear mixed-effects model should include time as a variable as A) the authors hypothesize that responses should be reduced over time due to sensory adaptation and that B) stimulation induced suppression might be dynamic (though they find it is not).
Since the stimulation effect seems to be independent from trial-by-trial changes among stimulation conditions (Fig. 4) and we now have toned down on the aspect of homeostasis, we kept the current mixed-effect model variables.
(5) More speculation is needed on why stimulation suppresses responses from the first trial onwards.
We further speculate such rapid response changes due to activity-dependent synaptic changes due to overall network energy shift from optogenetic stimulation to maintain the cortical circuit balance.
(6) What does each dot represent in Figure 4a vs. Figure 4B? They are very different in number.
In 4A, each dot is average amplitude change values per each trial level. They are exactly same number of dots between frequency, cell groups and conditions as each dot represents each trial (20 each). The reason why it may look differ could be only due to some overlaps between frequencies.
In 4B, each dot is each cell. The reason why it’s denser in Stimulation conditions’ 16kHz preferring cells panel is that it naturally had more FOVs thus more cells to be plotted. We further clarified these details in the figure legend.
(7) How sensory responsive neurons were selected should be shown in the figures. Specifically, which fraction of the 30% of most responsive neurons were stimulated should be stated. Depending on the exact yield in the field of view, all or only a minority of strongly sensory responsive neurons are being stimulated, which in either case would color the interpretation of the data.
We tried varying the FOV as much as possible across sessions to ensure that FOVs are directly in the A1 covering a range of frequencies. If we cannot observe more than 80 neurons as sound responsive neurons from processed suite2p data, we searched for another FOV.
We now included an example FOV of the widefield imaging we first conducted to identify A1, and another example FOV of the 2-photon imaging where we conducted a short sound presentation session to identify the sensory responsive neurons, as an inset of the ‘Cell selection’ part in Figure 1.
Reviewer #2 (Recommendations for the authors):
Minor points:
- p.4, last line: "of" probably missing "the processing the target..."
Fixed.
- p.5, top, end of the first paragraph of this page: Figure 3B and 3E don't show exemplar traces.
Corrected as Figure 2A and 2D.
- P.5, first sentence of the paragraph "Optogenetic holographic stimulation increases activity in targeted ensembles": reference to Figure 3A and 3D should rather be Figure 2A and 2D.
Corrected.
- P.9, 2nd paragraph: sentence with a strange syntax: "since their response amplitude..."
Corrected.
- Figure 2: panels C and F are missing.
Corrected.
- p.11, methods: "wasthen" should be "was then".
Corrected.
- p.12, analysis: it is not clearly explained why the sound evoked activity is computed based on the 160ms to 660ms after sound onset instead of 0ms to 660 ms. It is likely related to some potential contamination but it should be explicitly explained.
Due to the relatively slow calcium transient to more correctly capture the sound related evoked responses. Added this detail.
- Methods, analysis: the authors should better explain how they conducted the random permutation described in the Figures 1D, 2B and 2E. Which signals were permutated?
Random permutation to shuffle the target cell ID.
- References 55 and 56 don't explicitly state that excitatory neurons generally have stronger responses to sound than inhibitory neurons.
Thank you for pointing out this error. We replaced those references with Maor et al. 2016 and Kerlin et al. 2010, showing excitatory neurons show more selective tuning, and also changed the wording more appropriately.
- It is not explained whether the imaging sessions are performed on awake or anaesthetized animals. It is probably done on awake animals, but then it is not clear what procedure is used to get the animals used to the head restraint. It usually takes a few days for the mice to get used to it, and the stress level is often different at the beginning and end of an experiment. Given the experimental protocol used in the study, in which sessions are performed sequentially and compared to each other, this aspect could play a role. However, the main comparison made is probably safe as it compares a control condition (laser at 0mW) and conditions with optogenetic stimulation, all done with similar sequences of sessions.
The experiment was conducted on awake animals. Although we did not have any control on comparing their status in the beginning and the end of the experiment, they all had a widefield imaging session imaging session to identify the A1 region which uses the same head-fixation setup, thus they are more used to the setup when we conduct 2-photon imaging and stimulation. Regardless of the session, if animals show any sign of extra discomfort due to the unfamiliar setup, we keep them there for 10-15 minutes until they are accustomed to the setup with no movement. If they still show a sign of discomfort, we take them out and try for another day. We now included this detail on the manuscript.
Reviewer #3 (Recommendations for the authors):
- Evaluate the global effect of stimulation on the population activity averaged across all neurons (activated and non-activated).
Thank you for your suggestions. We now included a new Figure 3A that present the population activity across all responsive cells. The average activity level did not differ among stimulation conditions (control, 16kHz stim, and 54kHz stim).
- Evaluate with a simple model if a population of neurons with different sound tuning receiving non-specific inhibition would not produce the observed effect.
Thank you for the suggestion. We generated a simple model in which a suppression term was applied either to all neurons or specifically to non-target co-tuned cells to test our results from the data. We took a similar range of number of neurons and FOVs to closely simulate the model to the real dataset structure. On 50 simulated calcium traces of neurons (n),
Tracen(t) = Rn(t) – thetan + epsilonn(t)
Where Rn(t) is a response amplitude from either baseline or stimulation session, thetan is a suppression term applied either to all neurons or only to non-target co-tuned neurons, only during the stimulation session, and epsilonn(t) is additive noise. Theta was defined based on the average amount of increased activity amplitudes generated from target neurons due to the stimulation, implemented from the real dataset with extra neuron-level jitter. Similar to the real data analyses, we compared the response change between the stimulation and baseline sessions’ trace amplitudes. By comparing two different model outcomes and the real data, we observed a significant effect of the model type (F(2, 2535) = 34.943, p < 0.0001) and interaction between the model type and cell groups was observed (F(2, 2535) = 36.348, p < 0.0001). Applying suppression to only non-target co-tuned cells during the stimulation session yielded a significant response amplitude decrease for co-tuned cells compared to non co-tuned cells (F(1, 2535) = 45.62, p < 0.0001), which resembles the real data In contrast, applying suppression to all non-target cells led to similar amplitude changes in both co-tuned and non co-tuned neurons (F(1, 2535) = 0.87, p = 0.35), which was not observed in either the real data or the simulated data restricted to co-tuned cell suppression. Therefore, the model predicts correctly that the specific suppression given to only co-tuned neurons drove the real data outcome. All of this information is now added into Methods and Results sections and the figure is added as Figure 3C.


