Peer review process
Revised: This Reviewed Preprint has been revised by the authors in response to the previous round of peer review; the eLife assessment and the public reviews have been updated where necessary by the editors and peer reviewers.
Read more about eLife’s peer review process.Editors
- Reviewing EditorMarcelo FerreiraUniversity of São Paulo, São Paulo, Brazil
- Senior EditorDominique Soldati-FavreUniversity of Geneva, Geneva, Switzerland
Reviewer #1 (Public review):
Summary:
This study presents a new Bayesian approach to estimate importation probabilities of malaria combining epidemiological data, travel history, and genetic data through pairwise IBD estimates. Importation is an important factor challenging malaria elimination, especially in low transmission settings. This paper focus on Magude and Matutuine, two districts in south Mozambique with very low malaria transmission. The results show isolation-by-distance in Mozambique, with genetic relatedness decreasing with distances larger than 100 km, and no spatial correlation for distances between 10 and 100 km. But again strong spatial correlation in distances smaller than 10 km. They report high genetic relatedness between Matutuine and Inhambane, higher than between Matutuine and Magude. Inhambane is the main source of importation in Matutuine, accounting for 63.5% of imported cases. Magude, on the other hand, shows smaller importation and travel rates than Matutuine, as it is a rural area with less mobility. Additionally, they report higher levels of importation and travel in the dry season, when transmission is lower. Also, no association with importation was found for occupation, sex and other factors. These data have practical implications for public health strategies aiming malaria elimination, for example, testing and treating travelers from Matutuine in the dry season.
Strengths:
The strength of this study relies in the combination of different sources of data - epidemiological, travel and genetic data - to estimate importation probabilities, the statistical analyses.
Weaknesses:
The authors recognize the limitations related to sample size and the biases of travel reports.
Reviewer #2 (Public review):
Summary:
Based on a detailed dataset, the authors present a novel Bayesian approach to classify malaria cases as either imported or locally acquired.
Strengths:
The proposed Bayesian approach for case classification is simple, well justified, and allows the integration of parasite genomics, travel history, and epidemiological data.
Weakness:
While the authors aim to classify cases as imported or locally acquired, the work lacks a quantification of the contribution of each case type to overall transmission.
Comments on revisions:
All my questions and concerns were satisfactorily addressed.
Reviewer #3 (Public review):
This work provides a novel statistical model to identify imported malaria cases, which are an important challenge for elimination, particularly in low-transmission areas. This tool was applied in Plasmodium falciparum populations in Mozambique and determined differences in importation rates in 2 low-transmission districts in the South.
Strengths:
The study has several strengths, mainly the development of a novel Bayesian model that integrates genomic, epidemiological, and travel data to estimate importation probabilities. The results showed insights into malaria transmission dynamics, particularly identifying importation sources and differences in importation rates in Mozambique. Finally, the relevance of the findings is to suggest interventions focusing on the traveler population to support efforts for malaria elimination.
Weaknesses:
The study also has some limitations, although the authors have plans to address them. The sample collection was not representative of some provinces, and not all samples had sufficient metadata for the risk factor analysis. Additionally, the authors used a proxy for transmission intensity and assumed some other conditions to calculate the importation probability for specific scenarios. They plan to conduct a new sample collection and include monthly malaria incidence estimates in the future.
Comments on revisions:
- Delete "We added this text to the discussion" in line 302 (Discussion)
- I recommend adding the plans to address limitations indicated in the Response to Reviewers document in the Discussion. This would really strengthen the limitation section.
Author response:
The following is the authors’ response to the original reviews
Public Reviews:
Reviewer #1 (Public review):
Summary:
This study presents a new Bayesian approach to estimate importation probabilities of malaria, combining epidemiological data, travel history, and genetic data through pairwise IBD estimates. Importation is an important factor challenging malaria elimination, especially in low-transmission settings. This paper focuses on Magude and Matutuine, two districts in southern Mozambique with very low malaria transmission. The results show isolation-by-distance in Mozambique, with genetic relatedness decreasing with distances larger than 100 km, and no spatial correlation for distances between 10 and 100 km. But again, strong spatial correlation in distances smaller than 10 km. They report high genetic relatedness between Matutuine and Inhambane, higher than between Matutuine and Magude. Inhambane is the main source of importation in Matutuine, accounting for 63.5% of imported cases. Magude, on the other hand, shows smaller importation and travel rates than Matutuine, as it is a rural area with less mobility. Additionally, they report higher levels of importation and travel in the dry season, when transmission is lower. Also, no association with importation was found for occupation, sex, and other factors. These data have practical implications for public health strategies aiming for malaria elimination, for example, testing and treating travelers from Matutuine in the dry season.
Strengths:
The strength of this study lies in the combination of different sources of data - epidemiological, travel, and genetic data - to estimate importation probabilities, and the statistical analyses.
Weaknesses:
The authors recognize the limitations related to sample size and the biases of travel reports.
We appreciate the review and comment about the manuscript.
Reviewer #2 (Public review):
Summary:
Based on a detailed dataset, the authors present a novel Bayesian approach to classify malaria cases as either imported or locally acquired.
Strengths:
The proposed Bayesian approach for case classification is simple, well justified, and allows the integration of parasite genomics, travel history, and epidemiological data. The work is well-written, very organized, and brings important contributions both to malaria control efforts in Mozambique and to the scientific community. Understanding the origin of cases is essential for designing more effective control measures and elimination strategies.
Weakness:
While the authors aim to classify cases as imported or locally acquired, the work lacks a quantification of the contribution of each case type to overall transmission.
The method presented here allows for classifying individual cases according to whether the infection occurred locally or was imported during a trip. By definition, it does not look to secondary infections after an importation event. Our next step is to conduct outbreak investigation to quantify the impact of importation events on the overall transmission, but this activity goes beyond the scope of this manuscript. We clarify this in the discussion section.
The Bayesian rationale is sound and well justified; however, the formulation appears to present an inconsistency that is replicated in both the main text and the Supplementary Material.
Thank you for pointing out the inconsistency in the final formula. In fact, the final formula corresponds to P(IA | G), instead of P(IA), so:
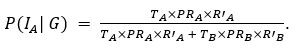
instead of
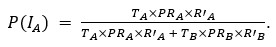
We have now corrected this error in the new version of the manuscript.
Reviewer #3 (Public review):
The authors present an important approach to identify imported P. falciparum malaria cases, combining genetic and epidemiological/travel data. This tool has the potential to be expanded to other contexts. The data was analyzed using convincing methods, including a novel statistical model; although some recognized limitations can be improved. This study will be of interest to researchers in public health and infectious diseases.
Strengths:
The study has several strengths, mainly the development of a novel Bayesian model that integrates genomic, epidemiological, and travel data to estimate importation probabilities. The results showed insights into malaria transmission dynamics, particularly identifying importation sources and differences in importation rates in Mozambique. Finally, the relevance of the findings is to suggest interventions focusing on the traveler population to help efforts for malaria elimination.
Weaknesses:
The study also has some limitations. The sample collection was not representative of some provinces, and not all samples had sufficient metadata for risk factor analysis, which can also be affected by travel recall bias. Additionally, the authors used a proxy for transmission intensity and assumed some conditions for the genetic variable when calculating the importation probability for specific scenarios. The weaknesses were assessed by the authors.
We acknowledge the limitations commented by the reviewer. We have the following plans to address the limitations. We will repeat the study for our data collected in 2023, which this time contains a good representation of all the provinces of Mozambique, and completeness of the metadata collection was ensured by implementing a new protocol in January 2023. Regarding the proxy for transmission intensity, we will refine the model by integrating monthly estimates of malaria incidence (previously calibrated to address testing and reporting rates) from the DHIS2 data, taking also into account the date of the reported cases in the analysis.
Reviewing Editor Comments:
The reviewers have made specific suggestions that could improve the clarity and accuracy of this report.
Reviewer #1 (Recommendations for the authors):
(1) Abstract, lines 36, 37 and 38: "Spatial genetic structure and connectivity were assessed using microhaplotype-based genetic relatedness (identity-by-descent) from 1605 P. falciparum samples collected (...)", but only 540 samples were successfully sequenced, therefore used in spatial genetic structure and connectivity analysis.
The 540 samples refer to those from Maputo province and are described in Fig. 1. The Spatial and connectivity analyses also included the samples from the rest of the provinces from the multi-cluster sampling scheme. Sample sizes from these provinces are described in Suppl. Table 2, and the total between them and the 540 samples from Maputo are the 1605 samples mentioned in the abstract. We specify this number in the caption of Sup. Fig. 4, and add it now into Fig. 3
(2) In the Introduction, some epidemiological context about Magude and Matutuine could be added. It is only mentioned in the Discussion section (lines 265-269).
We have added some context about both districts in the introduction now.
(3) In the Discussion, lines 241-244, could the lack of structure mean no barriers for gene flow due to high mobility in short distances? Maybe it could only be resolved with a large number of samples.
This could be an explanation (we mention it in the new version), although it is not something we can prove, or at least in this study.
Reviewer #2 (Recommendations for the authors):
The work is well written, very organized, and brings important contributions both to malaria control efforts in Mozambique and to the scientific community. Based on detailed datasets from Mozambique, the authors present a novel Bayesian approach to classify malaria cases as either imported or locally acquired. Understanding the origin of cases is essential for designing more effective control measures and elimination strategies. My review focuses on the Bayesian approach as well as on a few aspects of the presentation of results.
The authors combine travel history, parasite genetic relatedness, and transmission intensity from different areas to compute the probability of infection occurring in the study area, given the P. falciparum genome. The Bayesian rationale is sound and well justified; however, the formulation appears to present an inconsistency that is replicated in both the main text and the Supplementary Material. According to Bayes' Rule:
P(I_A |G) = (P(I_A) ∙ P(G|I_A)) / (P(G)),
with
P(I_A) = K ∙ T_A ∙ PR_A,
P(G│I_A) = R'_A,
and assuming
P(I_A│G) + P(I_B│G) = 1,
the expression,
(T_A ∙ PR_A ∙ R'_A) / (T_A ∙ PR_A ∙ R'_A + T_B ∙ PR_B ∙ R'_B)
appears to refer to P(I_A│G), not to P(I_A) (as indicated in the main text and Supplementary Material).
P(I_A│G) + P(I_B│G) = (P(I_A) ∙ P(G|I_A) + P(I_B) ∙ P(G|I_B)) / P(G) = 1
⇒P(G) = P(I_A) ∙ P(G|I_A) + P(I_B) ∙ P(G|I_B)
⇒P(G) = K ∙ T_A ∙ PR_A ∙ R'_A + K ∙ T_B ∙ PR_B ∙ R'_B
⇒P(I_A│G) = (T_A ∙ PR_A ∙ R'_A) / (T_A ∙ PR_A ∙ R'_A + T_B ∙ PR_B ∙ R'_B)
Please clarify this.
As mentioned in a previous comment, we acknowledge this point from the reviewer. In fact, the final formula corresponds to P(IA | G), instead of P(IA), so:
instead of
We have now corrected this error in the new version of the manuscript and in the supplementary information.
Additional comments:
(1) Figure 3A has a scale that includes negative values, which is not reasonable for R.
We agree that R estimates are not compatible with negative values. The intention of this scale was to show the overall mean R in the centre, in white, so that blue colours represented values below the average and red values above the average. However, we proceeded to update the figures according to your recommendations.
(2) I suggest using a common scale from 0 to 0.12 (maximum values among panels) across panels A, C, and D, as well as in Sup Fig 3, to facilitate comparison.
We updated the figures according to the recommendations.
(3) The x-axis labels in Figure 3A and Supplementary Figure 2A are not aligned with the x-axis ticks.
We updated the figures so that the alignment in the x-axis is clear.
(4) Supplementary Figure 5 would be better presented if the data were divided into four separate panels.
We have divided the figure into four separate panels.
(6) Figure 5D is not referenced in the main text.
We missed the mention, which is now fixed in the new version.
(7) The authors state: "No significant differences in R were found comparing parasite samples from Magude and the rest of the districts." However, Supplementary Figure 3 shows statistically significant relatedness between parasites from Magude and Matutuine. Please clarify this.
Answer: we added clarity to this sentence which was indeed confusing.
Reviewer #3 (Recommendations for the authors):
(1) Introduction: More background info about malaria in Mozambique would be appreciated.
We included some contextualisation about malaria in Mozambique and our study districts.
(2) Why were most of the samples collected from children? Is malaria most prevalent in that group? Information could be added in the introduction.
Children are usually considered an appropriate sentinel group for malaria surveillance for several reasons. First, most malaria cases reported from symptomatic outpatient visits are children, especially in areas with moderate to high burden. Second (and probably the cause for the first reason), their lower immunity levels, due to lower time of exposure, and their immature system, provides a cleaner scenario of the effects of malaria, since the body response is less adapted from past exposures. Finally, as a vulnerable population, they deserve a stronger focus in surveillance systems. We added a comment in the introduction referring to them as a common sentinel group for surveillance.
(3) Minor: Check spaces in the text (for example, line 333 and the start of the Discussion).
Thank you for noticing, we fixed in in the new version
(4) Minor: In my case, the micro (u) symbol can be observed in Word, but not in PDF.
One of the symbols produced an error, we hope that the new version is correct now.
(5) Were COI calculations with MOIRE performed across provinces and regions, or taking all samples as one population?
Wwe took all samples as one population. However, we validated that the same results (reaching equivalent numbers and the same conclusions) were obtained when run across different populations (regions or provinces). We mention this in the manuscript now.
(6) Have you tested lower values than 0.04 for PR in Maputo?
This would not have had any impact in the classification. Only two individuals reported a trip to Maputo city (where we assumed PR=0.04), and none of them were classified as imported. If lower values of PR were assumed, their probabilities of importation would have reduced, so that we would still obtain no imported cases.
(7) Map (Supplementary Figure 1): Please, improve the resolution (like in the zoom in) and add a scale and a compass rose.
We improved the resolution of the map. We did not add a scale and a compass rose, but labelled the coordinates as longitude and latitude to clarify the scale and orientation of the map. We added this in the rest of the maps of the manuscript as well.
(8) In this work, Pimp values were bimodal to 0 or 1, making the classification easy. I wonder in other scenarios, where Pimp values are more intermediate (0.4-0.6), is the threshold at 0.5 still useful? Is there another way, like having a confidence interval of Pimp, to ensure the final classification? A discussion on this topic may be appreciated.
In this case, we would recommend doing probabilistic analyses, keeping the probability of being imported as the final outcome, and quantifying the importation rates from the weighted sum of probabilities across individuals. We added this clarification in the Methods section: “ In case of obtaining a higher fraction of intermediate values (0.4-0.6), weighted sums of individual probabilities would be more appropriate to better quantify importation rates.”
(9) Results: More details per panel, not as the whole figure (Figure 2B, Figure 3A, etc) in the manuscript would be appreciated.
We appreciate the comment and added more details
(10) Figure 3: Please, add a color legend in panel B (not only in the caption, but in the panel, such as in A, C, D).
We added a color legend in panel B.
(11) Do the authors recommend routine surveillance to detect importation in Mozambique, or are these results solid enough to propose strategies? How possible is it that importation rates vary in the future in the south? If so, how feasible is it to implement all this process (including the amplicon sequencing) routinely?
We added the following text in the discussion: “While these results propose programmatic strategies for the two study districts, routine surveillance to detect importation in Mozambique would allow for identifying new strategies in other districts aiming for elimination, as well as monitoring changes in importation rates in Magude and Matutuine in the future. If scaling molecular surveillance is not feasible, travel reports could be integrated in the routing surveillance to extrapolate the case classification based on the results of this study. “
(12) Which other proxies of transmission intensity could have been used?
Better proxies of transmission intensity could be malaria incidence at the monthly level from national surveillance systems, or estimates of force of infection, for example from the use of molecular longitudinal data if available. We added this text in the discussion.
(13) Can this strategy be applied to P. vivax-endemic areas outside Africa?
This new method can also be applied to P. vivax-endemic areas outside Africa. Symptomatic P. vivax cases are not necessarily reflecting recent infections, so that travel reports might need to cover longer time periods, which does not require any essential adaptation to the method. We added this text to the discussion.


