Peer review process
Not revised: This Reviewed Preprint includes the authors’ original preprint (without revision), an eLife assessment, public reviews, and a provisional response from the authors.
Read more about eLife’s peer review process.Editors
- Reviewing EditorTomohiro KurosakiThe University of Osaka, Osaka, Japan
- Senior EditorBetty DiamondThe Feinstein Institute for Medical Research, Manhasset, United States of America
Reviewer #1 (Public review):
Summary:
In this manuscript, Cho et al. present a comprehensive and multidimensional analysis of glutamine metabolism in the regulation of B cell differentiation and function during immune responses. They further demonstrate how glutamine metabolism interacts with glucose uptake and utilization to modulate key intracellular processes. The manuscript is clearly written, and the experimental approaches are informative and well-executed. The authors provide a detailed mechanistic understanding through the use of both in vivo and in vitro models. The conclusions are well supported by the data, and the findings are novel and impactful. I have only a few, mostly minor, concerns related to data presentation and the rationale for certain experimental choices.
Detailed Comments:
(1) In Figure 1b, it is unclear whether total B cells or follicular B cells were used in the assay. Additionally, the in vitro class-switch recombination and plasma cell differentiation experiments were conducted without BCR stimulation, which makes the system appear overly artificial and limits physiological relevance. Although the effects of glutamine concentration on the measured parameters are evident, the results cannot be confidently interpreted as true plasma cell generation or IgG1 class switching under these conditions. The authors should moderate these claims or provide stronger justification for the chosen differentiation strategy. Incorporating a parallel assay with anti-BCR stimulation would improve the rigor and interpretability of these findings.
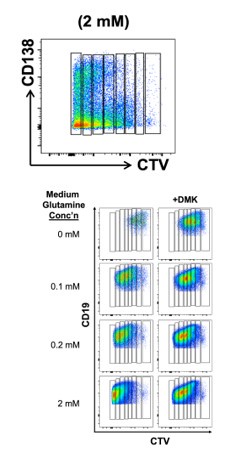
(2) In Figure 1c, the DMK alone condition is not presented. This hinders readers' ability to properly asses the glutaminolysis dependency of the cells for the measured readouts. Also, CD138+ in developing PCs goes hand in hand with decreased B220 expression. A representative FACS plot showing the gating strategy for the in vitro PCs should be added as a supplementary figure. Similarly, division number (going all the way to #7) may be tricky to gate and interpret. A representative FACS plot showing the separation of B cells according to their division numbers and a subsequent gating of CD138 or IgG1 in these gates would be ideal for demonstrating the authors' ability to distinguish these populations effectively.
(3) A brief explanation should be provided for the exclusive use of IgG1 as the readout in class-switching assays, given that naïve B cells are capable of switching to multiple isotypes. Clarifying why IgG1 was preferentially selected would aid in the interpretation of the results.
(4) The immunization experiments presented in Figures 1 and 2 are well designed, and the data are comprehensively presented. However, to prevent potential misinterpretation, it should be clarified that the observed differences between NP and OVA immunizations cannot be attributed solely to the chemical nature of the antigens - hapten versus protein. A more significant distinction lies in the route of administration (intraperitoneal vs. intranasal) and the resulting anatomical compartment of the immune response (systemic vs. lung-restricted). This context should be explicitly stated to avoid overinterpretation of the comparative findings.
(5) NP immunization is known to be an inducer of an IgG1-dominant Th2-type immune response in mice. IgG2c is not a major player unless a nanoparticle delivery system is used. However, the authors arbitrarily included IgG2c in their assays in Figures 2 and 3. This may be confusing for the readers. The authors should either justify the IgG2c-mediated analyses or remove them from the main figures. (It can be added as supplemental information with proper justification).
(6) Similarly, in affinity maturation analyses, including IgM is somewhat uncommon. I do not see any point in showing high affinity (NP2/NP20) IgMs (Figure 3d), since that data probably does not mean much.
(7) Following on my comment for the PC generation in Figure 1 (see above), in Figure 4, a strategy that relies solely on CD40L stimulation is performed. This is highly artificial for the PC generation and needs to be justified, or more physiologically relevant PC generation strategies involving anti-BCR, CD40L, and various cytokines should be shown.
(8) The effects of CB839 and UK5099 on cell viability are not shown. Including viability data under these treatment conditions would be a valuable addition to the supplementary materials, as it would help readers more accurately interpret the functional outcomes observed in the study.
(9) It is not clear how the RNA seq analysis in Figure 4h was generated. The experimental strategy and the setup need to be better explained.
Reviewer #2 (Public review):
Summary:
In this manuscript, the authors investigate the functional requirements for glutamine and glutaminolysis in antibody responses. The authors first demonstrate that the concentrations of glutamine in lymph nodes are substantially lower than in plasma, and that at these levels, glutamine is limiting for plasma cell differentiation in vitro. The authors go on to use genetic mouse models in which B cells are deficient in glutaminase 1 (Gls), the glucose transporter Slc2a1, and/or mitochondrial pyruvate carrier 2 (Mpc2) to test the importance of these pathways in vivo.
Interestingly, deficiency of Gls alone showed clear antibody defects when ovalbumin was used as the immunogen, but not the hapten NP. For the latter response, defects in antibody titers and affinity were observed only when both Gls and either Mpc2 or Slc2a1 were deleted. These latter findings form the basis of the synthetic auxotrophy conclusion. The authors go on to test these conclusions further using in vitro differentiations, Seahorse assays, pharmacological inhibitors, and targeted quantification of specific metabolites and amino acids. Finally, the authors document reduced STAT3 and STAT1 phosphorylation in response to IL-21 and interferon (both type 1 and 2), respectively, when both glutaminolysis and mitochondrial pyruvate metabolism are prevented.
Strengths:
(1) The main strength of the manuscript is the overall breadth of experiments performed. Orthogonal experiments are performed using genetic models, pharmacological inhibitors, in vitro assays, and in vivo experiments to support the claims. Multiple antigens are used as test immunogens--this is particularly important given the differing results.
(2) B cell metabolism is an area of interest but understudied relative to other cell types in the immune system.
(3) The importance of metabolic flexibility and caution when interpreting negative results is made clear from this study.
Weaknesses:
(1) All of the in vivo studies were done in the context of boosters at 3 weeks and recall responses 1 week later. This makes specific results difficult to interpret. Primary responses, including germinal centers, are still ongoing at 3 weeks after the initial immunization. Thus, untangling what proportion of the defects are due to problems in the primary vs. memory response is difficult.
(2) Along these lines, the defects shown in Figure 3h-i may not be due to the authors' interpretation that Gls and Mpc2 are required for efficient plasma cell differentiation from memory B cells. This interpretation would only be correct if the absence of Gls/Mpc2 leads to preferential recruitment of low-affinity memory B cells into secondary plasma cells. The more likely interpretation is that ongoing primary germinal centers are negatively impacted by Gls and Mpc2 deficiency, and this, in turn, leads to reduced affinities of serum antibodies.
(3) The gating strategies for germinal centers and memory B cells in Supplemental Figure 2 are problematic, especially given that these data are used to claim only modest and/or statistically insignificant differences in these populations when Gls and Mpc2 are ablated. Neither strategy shows distinct flow cytometric populations, and it does not seem that the quantification focuses on antigen-specific cells.
(4) Along these lines, the conclusions in Figure 6a-d may need to be tempered if the analysis was done on polyclonal, rather than antigen-specific cells. Alum induces a heavily type 2-biased response and is not known to induce much of an interferon signature. The authors' observations might be explained by the inclusion of other ongoing GCs unrelated to the immunization.
Reviewer #3 (Public review):
Summary:
In their manuscript, the authors investigate how glutaminolysis (GLS) and mitochondrial pyruvate import (MPC2) jointly shape B cell fate and the humoral immune response. Using inducible knockout systems and metabolic inhibitors, they uncover a "synthetic auxotrophy": When GLS activity/glutaminolysis is lost together with either GLUT1-mediated glucose uptake or MPC2, B cells fail to upregulate mitochondrial respiration, IL 21/STAT3 and IFN/STAT1 signaling is impaired, and the plasma cell output and antigen-specific antibody titers drop significantly. This work thus demonstrates the promotion of plasma cell differentiation and cytokine signaling through parallel activation of two metabolic pathways. The dataset is technically comprehensive and conceptually novel, but some aspects leave the in vivo and translational significance uncertain.
Strengths:
(1) Conceptual novelty: the study goes beyond single-enzyme deletions to reveal conditional metabolic vulnerabilities and fate-deciding mechanisms in B cells.
(2) Mechanistic depth: the study uncovers a novel "metabolic bottleneck" that impairs mitochondrial respiration and elevates ROS, and directly ties these changes to cytokine-receptor signaling. This is both mechanistically compelling and potentially clinically relevant.
(3) Breadth of models and methods: inducible genetics, pharmacology, metabolomics, seahorse assay, ELISpot/ELISA, RNA-seq, two immunization models.
(4) Potential clinical angle: the synergy of CB839 with UK5099 and/or hydroxychloroquine hints at a druggable pathway targeting autoantibody-driven diseases.
Weaknesses:
(1) Physiological relevance of "synthetic auxotrophy"
The manuscript demonstrates that GLS loss is only crippling when glucose influx or mitochondrial pyruvate import is concurrently reduced, which the authors name "synthetic auxotrophy". I think it would help readers to clarify the terminology more and add a concise definition of "synthetic auxotrophy" versus "synthetic lethality" early in the manuscript and justify its relevance for B cells.
While the overall findings, especially the subset specificity and the clinical implications, are generally interesting, the "synthetic auxotrophy" condition feels a little engineered. Therefore, the findings strongly raise the question of the likelihood of such a "double hit" in vivo and whether there are conditions, disease states, or drug regimens that would realistically generate such a "bottleneck". Hence, the authors should document or at least discuss whether GC or inflamed niches naturally show simultaneous downregulation/lack of glutamine and/or pyruvate. The authors should also aim to provide evidence that infections (e.g., influenza), hypoxia, treatments (e.g., rapamycin), or inflammatory diseases like lupus co-limit these pathways.
It would hence also be beneficial to test the CB839 + UK5099/HCQ combinations in a short, proof-of-concept treatment in vivo, e.g., shortly before and after the booster immunization or in an autoimmune model. Likewise, it may also be insightful to discuss potential effects of existing treatments (especially CB839, HCQ) on human memory B cell or PC pools.
(2) Cell survival versus differentiation phenotype
Claims that the phenotypes (e.g., reduced PC numbers) are "independent of death" and are not merely the result of artificial cell stress would benefit from Annexin-V/active-caspase 3 analyses of GC B cells and plasmablasts. Please also show viability curves for inhibitor-treated cells.
(3) Subset specificity of the metabolic phenotype
Could the metabolic differences, mitochondrial ROS, and membrane-potential changes shown for activated pan-B cells (Figure 5) also be demonstrated ex vivo for KO mouse-derived GC B cells and plasma cells? This would also be insightful to investigate following NP-immunization (e.g., NP+ GC B cells 10 days after NP-OVA immunization).
(4) Memory B cell gating strategy
I am not fully convinced that the memory-B-cell gate in Supplementary Figure 2d is appropriate. The legend implies the population is defined simply as CD19+GL7-CD38+ (or CD19+CD38++?), with no further restriction to NP-binding cells. Such a gate could also capture naïve or recently activated B cells. From the descriptions in the figure and the figure legend, it is hard to verify that the events plotted truly represent memory B cells. Please clarify the full gating hierarchy and, ideally, restrict the MBC gate to NP+CD19+GL7-CD38+ B cells (or add additional markers such as CD80 and CD273). Generally, the manuscript would benefit from a more transparent presentation of gating strategies.
(5) Deletion efficiency
mRNA data show residual GLS/MPC2 transcripts (Supplementary Figure 8). Please quantify deletion efficiency in GC B cells and plasmablasts.
Author response:
Reviewer #1 (Public review):
Summary:
In this manuscript, Cho et al. present a comprehensive and multidimensional analysis of glutamine metabolism in the regulation of B cell differentiation and function during immune responses. They further demonstrate how glutamine metabolism interacts with glucose uptake and utilization to modulate key intracellular processes. The manuscript is clearly written, and the experimental approaches are informative and well-executed. The authors provide a detailed mechanistic understanding through the use of both in vivo and in vitro models. The conclusions are well supported by the data, and the findings are novel and impactful. I have only a few, mostly minor, concerns related to data presentation and the rationale for certain experimental choices.
Detailed Comments:
(1) In Figure 1b, it is unclear whether total B cells or follicular B cells were used in the assay. Additionally, the in vitro class-switch recombination and plasma cell differentiation experiments were conducted without BCR stimulation, which makes the system appear overly artificial and limits physiological relevance. Although the effects of glutamine concentration on the measured parameters are evident, the results cannot be confidently interpreted as true plasma cell generation or IgG1 class switching under these conditions. The authors should moderate these claims or provide stronger justification for the chosen differentiation strategy. Incorporating a parallel assay with anti-BCR stimulation would improve the rigor and interpretability of these findings.
We will edit the manuscript to be more explicit that total splenic B cells were used in this set-up figure and the rest of the paper. In addition, we will try to perform new experiments to improve this "set-up figure" (and add old and new data for Supplemental Figure presentation). Specifically, we will increase the range of conditions tested - e.g., styles of stimulating proliferation and differentiation - to foster an increased sense of generality. We plan to compare mitogenic stimulation with anti-CD40 to anti-IgM and to anti-IgM + anti-CD40, all with BAFF, IL-4, and IL-5, bearing in mind excellent work from Aiba et al, Immunity 2006; 24: 259-268, and similar papers. We also will try to present some representative flow cytometric profiles (presumably in new Supplemental Figure panels).
To be transparent and add to a more open public discussion (using the virtues of this forum, the senior author and colleagues would caution about whether any in vitro conditions exist that warrant complete confidence. That is the reason for proceeding to immunization experiments in vivo. That is not said to cast doubt on our own in vitro data - there are some experiments (such as those of Fig. 1a-c and associated Supplemental Fig. 1) that only can be done in vitro or are better done that way (e.g., because of rapid uptake of early apoptotic B cells in vivo).
For instance: Well-respected papers use the CD40LB and NB21.2D9 systems to activate B cells and generate plasma cells. Those appear to be BCR-independent and unfortunately, we found that they cannot be used with a.a. deprivation or these inhibitors due to effects on the engineered stroma-like cells. In considering BCR engagement, Reth has published salient points about signaling and concentrations of the Ab, the upshot being that this means of activating mitogenesis and plasma cell differentiation (when the B cells are costimulated via CD40 or TLR(4 or 7/8) is probably more than a bit artificial. Moreover, although Aiba et al, Immunity 2006; 24: 259-268 is a laudable exception, one rarely finds papers using BAFF despite the strong evidence it is an essential part of the equation of B cell regulation in vivo and a cytokine that modulates BCR signaling - in the cultures.
(2) In Figure 1c, the DMK alone condition is not presented. This hinders readers' ability to properly asses the glutaminolysis dependency of the cells for the measured readouts. Also, CD138+ in developing PCs goes hand in hand with decreased B220 expression. A representative FACS plot showing the gating strategy for the in vitro PCs should be added as a supplementary figure. Similarly, division number (going all the way to #7) may be tricky to gate and interpret. A representative FACS plot showing the separation of B cells according to their division numbers and a subsequent gating of CD138 or IgG1 in these gates would be ideal for demonstrating the authors' ability to distinguish these populations effectively.
We agree that exact placement of divisions deconvolution by FlowJow is more fraught than might be thought forpresentations in many or most papers. For the revision, we will try to add one or several representative FACS plot(s) with old and new data to provide the gating on CTV fluorescence, bearing these points in mind when extending the experiments from ~7 years ago (Fig. 1b, c). With the representative examples of the old data pasted in here, we will aver, however, that using divisions 0-6, and ≥7 was reasonable.
Ditto for DMK with normal glutamine. However, in the spirit of eLife transparency lacking in many other journals, this comparison is more fraught than the referee comment would make things seem. The concentration tolerated by cells is highly dependent on the medium and glutamine concentration, and perhaps on rates of glutaminolysis (due to its generation of ammonia). In practice, we find that DMK becomes more toxic to B cells unless glutamine is low or glutaminolysis is restricted. Thus, the concentration of DMK that is tolerated and used in Fig. 1b, c can become toxic to the B cells when using the higher levels of glutamine in typical culture media (2 mM or more) - at which point the "normal conditions + DMK" "control" involves the surviving cells in conditions with far greater cell death and less population expansion than the "low glutamine + DMK". condition. Overall, we appreciate the suggestion to show more DMK data and will work to do so for the earlier proliferation data (shown above) and the new experiments.
Author response image 1.
(3) A brief explanation should be provided for the exclusive use of IgG1 as the readout in class-switching assays, given that naïve B cells are capable of switching to multiple isotypes. Clarifying why IgG1 was preferentially selected would aid in the interpretation of the results.
We will edit the text to be more explicit and harmonize in light of the referee's suggestion that we focus the presentation of serologic data on IgG1 in the immunization experiments.
[IgG1 provides the strongest signal and hence better signal/noise both in vitro and with the alum-based immunizations that are avatars for the adjuvant used in the majority of protein-based vaccines for humans.]
(4) The immunization experiments presented in Figures 1 and 2 are well designed, and the data are comprehensively presented. However, to prevent potential misinterpretation, it should be clarified that the observed differences between NP and OVA immunizations cannot be attributed solely to the chemical nature of the antigens - hapten versus protein. A more significant distinction lies in the route of administration (intraperitoneal vs. intranasal) and the resulting anatomical compartment of the immune response (systemic vs. lung-restricted). This context should be explicitly stated to avoid overinterpretation of the comparative findings.
We agree with the referee and will edit the text accordingly. Certainly, the difference in how the anti-ova response is elicited compared to the anti-NP response in the same mice or with a bit different an immunization regimen might be another factor - or the major factor - that could contribute towards explaining why glutaminolysis was important after ovalbumin inhalations (used because emergence of anti-ova Ab / ASCs is suppressed by the NP hapten after NP-ova immunization) but not needed for the anti-NP response unless Slc2a1 or Mpc2 also was inactivated. Thank you prompting addition of this caveat.
Nevertheless, it seems fair to note that in Figures 1 and 2, the ASCs and Ab are being analyzed for NP and ova in the same mice, albeit with the NP-specific components not being driven by the inhalations of ovalbumin. With that in mind, when one compares the IgG1 anti-NP ASC and Ab to those for IgG1 anti-ovalbumin (ASC in bone marrow; Ab), the ovalbumin-specific response was reduced whereas the anti-NP response was not.
(5) NP immunization is known to be an inducer of an IgG1-dominant Th2-type immune response in mice. IgG2c is not a major player unless a nanoparticle delivery system is used. However, the authors arbitrarily included IgG2c in their assays in Figures 2 and 3. This may be confusing for the readers. The authors should either justify the IgG2c-mediated analyses or remove them from the main figures. (It can be added as supplemental information with proper justification).
We will rearrange the Figure panels to move the IgM and IgG2c data to Supplemental Figures.
For purposes of public discourse, we note that the data of previous Figure 3(c, g) show a very strong NP-specific IgG2c response that seems to contradict the concept that IgG2c responses necessarily are weak in this setting, and the important role of IgG2c (mouse - IgG1 in humans) in controlling or clearing various pathogens as well as in autoimmunity. So from the standpoint of providing a better sense of generality to the loss-of-function effects, we continue to think that these measurements are quite important. That said, the main text has many figure panels and as the review notes, the class switching and in vitro ASC generation were done with IL-4 / IgG1-promoting conditions. If possible, we will try to assay in vitro class switching with IFN-g rather than IL-4 but there may not be enough resources (time before lab closure; money).
[As a collegial aside, we speculate that a greater or lesser IgG2c anti-NP response may arise due to different preparations of NP-carrier obtained from the vendor (Biosearch) having different amounts of TLR (e.g., TLR4) ligand. In any case, the points of presenting the IgG2c (and IgM) data were to push against the limiting boundaries of convention (which risks perpetuating a narrow view of potential outcomes) and make the breadth of results more apparent to readers.
(6) Similarly, in affinity maturation analyses, including IgM is somewhat uncommon. I do not see any point in showing high affinity (NP2/NP20) IgMs (Figure 3d), since that data probably does not mean much.
As noted in the reply immediately preceding this one, we appreciate this suggestion from the reviewer and will move the IgM and IgG2c to Supplemental status.
Nonetheless, in collegial discourse we disagree a bit with the referee in light of our data as well as of work that (to our minds) leads one to question why inclusion of affinity maturation of IgM is so uncommon - as the referee accurately notes. Of course a defect in the capacity to class-switch is highly deleterious in patients but that is not the same as concluding that recall IgM or its affinity is of little consequence.
In some of the pioneering work back in the 1980's, Bothwell showed that NP-carrier immunization generated hybridomas producing IgM Ab with extensive SHM (~11% of the 18 lineages; ~ 1/3 of the IgM hybridomas) [PMID: 8487778], IgM B cells appear to move into GC, and there is at least a reasonable published basis for the view that there are GC-derived IgM (unswitched) memory B cells (MBC) that would be more likely, upon recall activation, to differentiate into ASCs. [As an example, albeit with the Jenkins lab anti-rPE response, Taylor, Pape, and Jenkins generated quantitative estimates of the numbers of Ag-specific IgM+vs switched MBC that were GC-derived (or not). [PMID: 22370719]. While they emphasized that ~90% of IgM+ MBC appeared to be GC-independent, their data also indicated that ~1/2 of all GC-derived MBC were IgM+ rather than switched (their Fig. 8, B vs C; also 8E, which includes alum-PE). And while we immensely respect the referee, we are perhaps less confident that IgM or high-affinity Ag-specific IgM doesn't mean that much, if only because of evidence that localized Ab compete for Ag and may thus influence selective processes [PMCID: PMC2747358; PMID: 15953185; PMID: 23420879; PMID: 27270306].
(7) Following on my comment for the PC generation in Figure 1 (see above), in Figure 4, a strategy that relies solely on CD40L stimulation is performed. This is highly artificial for the PC generation and needs to be justified, or more physiologically relevant PC generation strategies involving anti-BCR, CD40L, and various cytokines should be shown.
In line with our response to point (1), we plan and will try to self-fund testing BCR-stimulated B cells (anti-CD40 to anti-IgM and to anti-IgM + anti-CD40, all with BAFF, IL-4, and IL-5).
(8) The effects of CB839 and UK5099 on cell viability are not shown. Including viability data under these treatment conditions would be a valuable addition to the supplementary materials, as it would help readers more accurately interpret the functional outcomes observed in the study.
We will add to the supplemental figures to present data that provide cues as to relative viability / survival under the experimental conditions used. [FSC X SSC as well as 7AAD or Ghost dye panels; we also hope to generate new data that include further experiments scoring annexin V staining.]
(9) It is not clear how the RNA seq analysis in Figure 4h was generated. The experimental strategy and the setup need to be better explained.
The revised manuscript will include more information (at minimum in the Methods, Legend), and we apologize that in this and a few other instances sufficiency of detail was sacrificed on the altar of brevity.
[Adding a brief synopsis to any reader before the final version of record, given the many months it will take to generate new data, thoroughly revise the manuscript, etc:
In three temporally and biologically independent experiments, cultures were harvested 3.5 days after splenic B cells were purified and cultured as in the experiments of Fig. 4a-e. total cellular RNA prepared from the twelve samples (three replicates for each of four conditions - DMSO vehicle control, CB839, UK5099, and CB839 + UK5099) was analyzed by RNA-seq. After the RNA-seq data were initially processed using the pipeline described in the Methods. For panels g & h of Fig 4, DE Seq2 was used to quantify and compare read counts in the three CB839 + UK5099 samples relative to the three independent vehicle controls and identify all genes for which variances yielded P<0.05. In Fig 4g, all such genes for which the difference was 'statistically significant' (i.e., P<0.05) were entered into the Immgen tool and thereby mapped to the B lineage subsets shown in the figure panels (i.e., g, h). In (g), these are displayed using one format, whereas (h) uses the 'heatmap' tool in MyGeneSet.
Reviewer #2 (Public review):
Summary:
In this manuscript, the authors investigate the functional requirements for glutamine and glutaminolysis in antibody responses. The authors first demonstrate that the concentrations of glutamine in lymph nodes are substantially lower than in plasma, and that at these levels, glutamine is limiting for plasma cell differentiation in vitro. The authors go on to use genetic mouse models in which B cells are deficient in glutaminase 1 (Gls), the glucose transporter Slc2a1, and/or mitochondrial pyruvate carrier 2 (Mpc2) to test the importance of these pathways in vivo.
Interestingly, deficiency of Gls alone showed clear antibody defects when ovalbumin was used as the immunogen, but not the hapten NP. For the latter response, defects in antibody titers and affinity were observed only when both Gls and either Mpc2 or Slc2a1 were deleted. These latter findings form the basis of the synthetic auxotrophy conclusion. The authors go on to test these conclusions further using in vitro differentiations, Seahorse assays, pharmacological inhibitors, and targeted quantification of specific metabolites and amino acids. Finally, the authors document reduced STAT3 and STAT1 phosphorylation in response to IL-21 and interferon (both type 1 and 2), respectively, when both glutaminolysis and mitochondrial pyruvate metabolism are prevented.
Strengths:
(1) The main strength of the manuscript is the overall breadth of experiments performed. Orthogonal experiments are performed using genetic models, pharmacological inhibitors, in vitro assays, and in vivo experiments to support the claims. Multiple antigens are used as test immunogens--this is particularly important given the differing results.
(2) B cell metabolism is an area of interest but understudied relative to other cell types in the immune system.
(3) The importance of metabolic flexibility and caution when interpreting negative results is made clear from this study.
Weaknesses:
(1) All of the in vivo studies were done in the context of boosters at 3 weeks and recall responses 1 week later. This makes specific results difficult to interpret. Primary responses, including germinal centers, are still ongoing at 3 weeks after the initial immunization. Thus, untangling what proportion of the defects are due to problems in the primary vs. memory response is difficult.
(2) Along these lines, the defects shown in Figure 3h-i may not be due to the authors' interpretation that Gls and Mpc2 are required for efficient plasma cell differentiation from memory B cells. This interpretation would only be correct if the absence of Gls/Mpc2 leads to preferential recruitment of low-affinity memory B cells into secondary plasma cells. The more likely interpretation is that ongoing primary germinal centers are negatively impacted by Gls and Mpc2 deficiency, and this, in turn, leads to reduced affinities of serum antibodies
We provisionally plan to edit the wording of the conclusion a bit to add a possibility we consider unlikely to avoid a conclusion that MBCs bearing switched BCRs are affected once reactivated. We also will perform a new experiment to investigate, but unfortunately time before lab closure has been and remains our enemy both for performance and multiple replication of the work presented in Figure 3, panels h & i, and the related Supplemental Data (Supplemental Fig. 3a-j). Unfortunately, it will not be possible to do a memory experiment with recall immunization out at 8 weeks. Despite the grant funding running out and institutional belt-tightening, however, we'll try to perform a new head-to-head comparison of 4 wk post-immunization with and without the boost at three weeks.
The intriguing concern (points 1 & 2) provides a springboard for consideration of generalizations and simplifications. Germinal center durability is not at all monolithic, and instead is quite variable**. The premise (cognitive bias, perhaps?) in the interpretation is that in our previous work we find few if any GC B cells - NP-APC-binding or otherwise - above the background (non-immunized controls) three weeks after immunization with NP-ovalbumin in alum. Recognizing that it is not NP-carrier in alum as immunizations, we note for the readers and referee that Fig. 1 of the Taylor, Pape, & Jenkins paper considered above [PMID: 22370719] reported 10-fold more Ag-specific MBCs than GC B cells at day 29 post-immunization (the point at which the boost / recall challenge was performed in our Figure 3h, i).
Viewed from that perspective, the surmise of the comment is that a major contribution to the differences in both all-affinity and high-affinity anti-NP IgG1 shown in Fig. 3i derives from the immunization at 4 wk stimulating GC B cells we cannot find as opposed to memory B cells. However, it is true that in the literature (especially with the experimentally different approach of transferring BCR-transgenic / knock-in versions of an NP-biased BCR) there may be meaningful pools of IgG1 and IgG2c GC B cells. Alternatively, our current reagents for immunizations may have become better at maintaining GC than those in the past - which we will try to test.
The issue and question also relate to rates of output of plasma cells or rises in the serum concentrations of class-switched Ab. To this point, our prior experiences agree with the long-published data of the Kurosaki lab in Figure 3c of the Aiba et al paper noted above (Immunity, 2006) (and other such time courses). Readers can note that the IgG1 anti-NP response (alum adjuvant, as in our work) hits its plateau at 2 wk, and did not increase further from 2 to 3 wk. In other words, GC are on the decline and Ab production has reached its plateau by the time of the 2nd immunization in Fig. 3h).
Assuming we understand the comment and line of reasoning correctly, we also lean towards disagreeing with the statement "This interpretation would only be correct if the absence of Gls/Mpc2 leads to preferential recruitment of low-affinity memory B cells into secondary plasma cells." Our evidence shows that both low-affinity as well as high-affinity anti-NP Ab (IgG1) went down as a result of combined gene-inactivation after the peak primary response (Fig. 3i). Recent papers show that affinity maturation is attributable to greater proliferation of plasmablasts with high-affinity BCR. Accordingly, the findings with loss of GLS and MPC function are quite consistent with the interpretation that much of the response after the second immunization draws on MBC differentiation into plasmablasta and then plasma cells, where the proliferative advantage of high-affinity cells is blunted by the impaired metabolism. The provisional plan, however, is to note the alternative, if less likely, interpretation proposed by the review.
** In some contexts, of course, especially certain viral infections or vaccination with lipid nanoparticles carrying modified mRNA, germinal centers are far more persistent; also, in humans even the seasonal flu vaccine **
(3) The gating strategies for germinal centers and memory B cells in Supplemental Figure 2 are problematic, especially given that these data are used to claim only modest and/or statistically insignificant differences in these populations when Gls and Mpc2 are ablated. Neither strategy shows distinct flow cytometric populations, and it does not seem that the quantification focuses on antigen-specific cells.
We will enhance these aspects of the presentation, using old and hopefully new data, but note for readers that many many other papers in the best journals show plots in which the separation of, say, GC-Tfh from overall Tfh is based on cut-off within what essentially is a continuous spectrum of emission as adjusted or compensated by the cytometer (spectral or conventional).
Perhaps incorrectly, we omitted presenting data that included the results with NP-APC-staining - in part because within the GC B cell gate the frequencies of NP-binding events (GCB cells) were similar in double-knockout samples and controls. In practice, that would mean that the metabolic requirement applied about equally to NP+ and the total population. We will try to rectify this point in the revision.
(4) Along these lines, the conclusions in Figure 6a-d may need to be tempered if the analysis was done on polyclonal, rather than antigen-specific cells. Alum induces a heavily type 2-biased response and is not known to induce much of an interferon signature. The authors' observations might be explained by the inclusion of other ongoing GCs unrelated to the immunization.
We will make sure the text is clear that the in vitro experiments do not represent GC B cells and that the RNA-seq data were not an Ag (SRBC)-specific subset.
We also will try to work in a schematic along with expanding the Legends to make it more readily clear that the RNA-seq data (and hence the GSEA) involved immunizations with SRBC (not the alum / NP system which - it may be noted - in these experiments actually generated a robust IgG2c (type 1-driven) response along with the type 2-enhanced IgG1 response.
Reviewer #3 (Public review):
Summary:
In their manuscript, the authors investigate how glutaminolysis (GLS) and mitochondrial pyruvate import (MPC2) jointly shape B cell fate and the humoral immune response. Using inducible knockout systems and metabolic inhibitors, they uncover a "synthetic auxotrophy": When GLS activity/glutaminolysis is lost together with either GLUT1-mediated glucose uptake or MPC2, B cells fail to upregulate mitochondrial respiration, IL 21/STAT3 and IFN/STAT1 signaling is impaired, and the plasma cell output and antigen-specific antibody titers drop significantly. This work thus demonstrates the promotion of plasma cell differentiation and cytokine signaling through parallel activation of two metabolic pathways. The dataset is technically comprehensive and conceptually novel, but some aspects leave the in vivo and translational significance uncertain.
Strengths:
(1) Conceptual novelty: the study goes beyond single-enzyme deletions to reveal conditional metabolic vulnerabilities and fate-deciding mechanisms in B cells.
(2) Mechanistic depth: the study uncovers a novel "metabolic bottleneck" that impairs mitochondrial respiration and elevates ROS, and directly ties these changes to cytokine-receptor signaling. This is both mechanistically compelling and potentially clinically relevant.
(3) Breadth of models and methods: inducible genetics, pharmacology, metabolomics, seahorse assay, ELISpot/ELISA, RNA-seq, two immunization models.
(4) Potential clinical angle: the synergy of CB839 with UK5099 and/or hydroxychloroquine hints at a druggable pathway targeting autoantibody-driven diseases.
We agree and thank the referee for the positive comments and this succinct summary of what we view as contributions of the paper.
Weaknesses:
(1) Physiological relevance of "synthetic auxotrophy"
The manuscript demonstrates that GLS loss is only crippling when glucose influx or mitochondrial pyruvate import is concurrently reduced, which the authors name "synthetic auxotrophy". I think it would help readers to clarify the terminology more and add a concise definition of "synthetic auxotrophy" versus "synthetic lethality" early in the manuscript and justify its relevance for B cells.
We will edit the Abstract, Introduction, and Discussion to try to do better on this score. Conscious of how expansive the prose and data are even in the original submission, we appear to have taken some shortcuts that we will try to rectify. Thank you for highlighting this need to improve on a key concept!
That said, we punctiliously & perhaps pedantically encourage readers to be completely accurate, in that under one condition of immunization GLS loss substantially reduced the anti-ovalbumin response (Fig. 1, Fig. 2a-c). And for this provisional response, we will expand a bit on the notion that synthetic auxotrophy represents effects on differentiation that appear to go beyond and not simply to be selective death, even though decreased population expansion is observed and one cannot exclude some contribution of enhanced death in vivo. Finally, we will note that this comment of the review raises interesting semantic questions about what represents "physiological relevance" but leave it at that.
While the overall findings, especially the subset specificity and the clinical implications, are generally interesting, the "synthetic auxotrophy" condition feels a little engineered.
One can readily say that CAR-T cells are 'a little engineered' so it is a matter of balancing this perspective of the referee against the strengths they highlight in points 1, 2, and 4. In any case, we will probably try to expand and be more explicit in the Discussion of the revised manuscript.
In brief, even were the money not all gone, we would not believe that expanding the heft of this already rather large manuscript and set of data would be appropriate. As matters stand, a basic new insight about metabolic flexibility and its limits leads to evidence of a way to reduce generation of Ab and a novel impairment of STAT transcription factor induction by several cytokine receptors. The vulnerability that could be tested in later work on B cell-dependent autoimmunity includes the capacity to test a compound that already has been to or through FDA phase II in patients together with an FDA-approved standard-of-care agent.
Put a different way, the point is that a basic curiosity to understand why decreasing glucose influx did not have an even more profound effect than what was observed, combined with curiosity as to why glutaminolysis was dispensable in relatively standard vaccine-like models of immunize / boost, provided a springboard to identification of new vulnerabilities. As above, we appreciate being made aware that this point merits being made more explicit in the Discussion of the edited version.
Therefore, the findings strongly raise the question of the likelihood of such a "double hit" in vivo and whether there are conditions, disease states, or drug regimens that would realistically generate such a "bottleneck".
Hence, the authors should document or at least discuss whether GC or inflamed niches naturally show simultaneous downregulation/lack of glutamine and/or pyruvate. The authors should also aim to provide evidence that infections (e.g., influenza), hypoxia, treatments (e.g., rapamycin), or inflammatory diseases like lupus co-limit these pathways.
Again, we appreciate some 'licensing' to be more expansive and explicit, and will try to balance editing in such points against undue tedium or tendentiously speculative length in the Discussion. In particular, we will note that a clear, simple implication of the work is to highlight an imperative to test CB839 in lupus patients already on hydroxychloroquine as standard-of-care, and to suggest development of UK5099 (already tested many times in mouse models of cancer) to complement glutaminase inhibition.
As backdrop, we note that the failure to advance imaging mass spectrometry to the capacity to quantify relative or absolute (via nano-DESI) concentrations of nutrients in localized interstitia is a critical gap in the entire field. Techniques that sample the interstitial fluid of tumor masses or in our case LN as a work-around have yielded evidence that there can be meaningful limitations of glucose and glutamine, but it needs to be acknowledged that such findings may be very model-specific and, as can be the case with cutting-edge science, are not without controversy. That said, yes, we had found that hypoxia reduced glutamine uptake but given the norms of focused, tidy packages only reported on leucine in an earlier paper [PMID27501247; PMCID5161594].
It would hence also be beneficial to test the CB839 + UK5099/HCQ combinations in a short, proof-of-concept treatment in vivo, e.g., shortly before and after the booster immunization or in an autoimmune model. Likewise, it may also be insightful to discuss potential effects of existing treatments (especially CB839, HCQ) on human memory B cell or PC pools.
We certainly agree that the suggestions offered in this comment are important next steps and the right approach to test if the findings reported here translate toward the treatment of autoimmune diseases that involve B cells, interferons, and pathophysiology mediated by auto-Ab. As practical points, performance and replication of such studies would take more time than the year allotted for return of a revised manuscript to eLife and in any case neither funds nor a lab remain to do these important studies.
Concrete evidence for our concurrence was embodied in a grant application to NIH that was essential for keeping a lab and doing any such studies. [We note, as a suggestion to others, that an essential component of such studies would be to test the effects of these compounds on B cells from patients and mice with autoimmunity]. Perhaps unfortunately for SLE patients, the review panelists did not agree about the importance of such studies. However, it can be hoped that the patent-holder of CB839 (and perhaps other companies developing glutaminase inhibitors) will see this peer-reviewed pre-print and the public dialogue, and recognize how positive results might open a valuable contribution to mitigation of diseases such as SLE.
(2) Cell survival versus differentiation phenotype
Claims that the phenotypes (e.g., reduced PC numbers) are "independent of death" and are not merely the result of artificial cell stress would benefit from Annexin-V/active-caspase 3 analyses of GC B cells and plasmablasts. Please also show viability curves for inhibitor-treated cell
This comment leads us to see that the wording on this point may have been overly terse in the interests of brevity, and thereby open to some misunderstanding. Accordingly, we will expand out the text of the Abstract and elsewhere in the manuscript, to be more clear. In addition, we will add in some data on the point, hopefully including some results of new experiments.
To clarify in this public context, it is not that an increase in death (along with the reported decrease in cell cycling) can be or is excluded - and in fact it likely exists in vitro. The point is that beyond any such increase, and taking into account division number (since there is evidence that PC differentiation and output numbers involve a 'division-counting' mechanism), the frequencies of CD138+ cells and of ASCs among the viable cells are lower, as is the level of Prdm1-encoded mRNA even before the big increase in CD138+ cells in the population.
(3) Subset specificity of the metabolic phenotype
Could the metabolic differences, mitochondrial ROS, and membrane-potential changes shown for activated pan-B cells (Figure 5) also be demonstrated ex vivo for KO mouse-derived GC B cells and plasma cells? This would also be insightful to investigate following NP-immunization (e.g., NP+ GC B cells 10 days after NP-OVA immunization).
We agree that such data could be nice and add to the comprehensiveness of the work. We will try to scrounge the resources (time; money; human) to test this roughly as indicated. That said, we would note that the frequencies and hence numbers of NP+ GC B cells are so low that even in the flow cytometer we suspect there will not be enough "events" to rely on the results with DCFDA in the tiny sub-sub-subset. It also bears noting that reliable flow cytometric identification of the small NP-specific plasmablast/plasma cell subset amidst the overall population, little of which arose from immunization or after deletion of the floxed segments in B cells, would potentially be misleading.
(4) Memory B cell gating strategy
I am not fully convinced that the memory-B-cell gate in Supplementary Figure 2d is appropriate. The legend implies the population is defined simply as CD19+GL7-CD38+ (or CD19+CD38++?), with no further restriction to NP-binding cells. Such a gate could also capture naïve or recently activated B cells. From the descriptions in the figure and the figure legend, it is hard to verify that the events plotted truly represent memory B cells. Please clarify the full gating hierarchy and, ideally, restrict the MBC gate to NP+CD19+GL7-CD38+ B cells (or add additional markers such as CD80 and CD273). Generally, the manuscript would benefit from a more transparent presentation of gating strategies.
We will further expand the supplemental data displays to include more of the gating and analytic scheme, and hope to be able to have performed new experiments and analyses (including additional markers) that could mitigate the concern noted here. In addition, we will include flow data from the non-immunized control mice that had been analyzed concurrently in the experiments illustrated in this Figure.
Although it should be noted that the labeling indicated that the gating included the important criterion that cells be IgD- (Supplemental Fig. 2b), which excludes the vast majority of naive B cells, in principle marginal zone (MZ) B cells might fall within this gate. However, the MZ B population is unlikely to explain the differences shown in Supplemental Fig. 2b-d.
(5) Deletion efficiency - [The] mRNA data show residual GLS/MPC2 transcripts (Supplementary Figure 8). Please quantify deletion efficiency in GC B cells and plasmablasts.
Even were there resources to do this, the degree of reduction in target mRNA (Gls; Mpc2) renders this question superfluous.
Are there likely to be some cells with only one, or even neither, allele converted from fl to D? Yes, but they would be a minor subset in light of the magnitude of mRNA reduction, in contrast to our published observations with Slc2a1. As to plasmablasts and plasma cells, the pre-existing populations make such an analysis misleading, while the scarcity of such cells recoverable with antigen capture techniques is so low as to make both RNA and genomic DNA analyses questionable.


