Peer review process
Revised: This Reviewed Preprint has been revised by the authors in response to the previous round of peer review; the eLife assessment and the public reviews have been updated where necessary by the editors and peer reviewers.
Read more about eLife’s peer review process.Editors
- Reviewing EditorGang PengIndiana University, Indianapolis, United States of America
- Senior EditorJoshua SchifferFred Hutch Cancer Center, Seattle, United States of America
Reviewer #1 (Public review):
Summary:
The manuscript "Adapting Clinical Chemistry Plasma as a Source for Liquid Biopsies" addresses a timely and practical question: whether residual plasma from heparin separator tubes can serve as a source of cfDNA for molecular profiling. This idea is attractive, since such samples are routinely generated in clinical chemistry labs and would represent a vast and accessible resource for liquid biopsy applications. The preliminary results are encouraging, and likely to benefit the research community.
Comments on revisions:
The concerns raised have been addressed. The heparin separator-based cfDNA method described in this study is likely to benefit the research community. I have no further scientific concerns.
Reviewer #2 (Public review):
Summary:
The authors propose that leftover heparin plasma can serve as a source for cfDNA extraction, which could then be used for downstream genomic analyses such as methylation profiling, CNV detection, metagenomics, and fragmentomics. While the study is potentially of interest, several major limitations reduce its impact; for example, the study does not adequately address key methodological concerns, particularly cfDNA degradation, sequencing depth limitations, statistical rigor, and the breadth of relevant applications.
Strengths:
The paper provides a cheap method to extract cfDNA, which has broad application if the method is solid.
Weaknesses:
(1) The introduction lacks a sufficient review of prior work. The authors do not adequately summarize existing studies on cfDNA extraction, particularly those comparing heparin plasma and EDTA plasma. This omission weakens the rationale for their study and overlooks important context.
(2) The evaluation of cfDNA degradation from heparin plasma is incomplete. The authors did not compare cfDNA integrity with that extracted from EDTA plasma under realistic sample handling conditions. Their analysis (lines 90-93) focuses only on immediate extraction, which is not representative of clinical workflows where delays are common. This is in direct conflict with findings from Barra et al. (2025, LabMed), who showed that cfDNA from heparin plasma is substantially more degraded than that from EDTA plasma. A systematic comparison of cfDNA yields and fragment sizes under delayed extraction conditions would be necessary to validate the feasibility of their proposed approach.
(3) The comparison of methylation profiles suffers from the same limitation. The authors do not account for cfDNA degradation and the resulting reduced input material, which in turn affects sequencing depth and data quality. As shown by Barra et al., quantifying cfDNA yield and displaying these data in a figure would strengthen the analysis. Moreover, the statistical method applied is inappropriate: the authors use Pearson correlation when Spearman correlation would be more robust to outliers and thus more suitable for methylation and other genomic comparisons.
(4) The CNV analysis also raises concerns. With low-coverage WGS (~5X) from heparin-derived cfDNA, only large CNVs (>100 kb) are reliably detectable. The authors used a 500 kb bin size for CNV calling, but they did not acknowledge this as a limitation. Evaluating CNV detection at multiple bin sizes (e.g., 1 kb, 10 kb, 50 kb, 100 kb, 250 kb) would provide a more complete picture. In addition, Figure 3 presents CNV results from only one sample, which risks bias. Similar bias would exist for illustrations of CNVs from other samples in the supplementary figures provided by the authors. Again, Spearman correlation should be applied in Figure 3c, where clear outliers are visible.
(5) It is important to point out that depth-based CNV calling is just one of the CNV calling methods. Other CNV calling software using SNVs, pair-reads, split-reads, and coverage depth for calling CNV, such as the software Conserting, would be severely affected by the low-quality WGS data. The authors need to evaluate at least two different software with specific algorithms for CNV calling based on current WGS data.
(6) The authors omit an important application of cfDNA: somatic mutation detection. Degraded cfDNA and reduced sequencing depth could substantially impact SNV calling accuracy in terms of both recall and precision. Assessing this aspect with their current dataset would provide a more comprehensive evaluation of heparin plasma-derived cfDNA for genomic analyses.
Comments on revisions:
As suggested previously, the Pearson correlation analysis tends to be overstated; please replace it with Spearman correlation in the whole manuscript. Currently, the authors include both of them in the abstract, method, results, and graphics, all of which are required to be updated to only use Spearman correlation results.
I don't have other concerns about the manuscript.
Author response:
The following is the authors’ response to the original reviews.
Public Reviews:
Reviewer #1 (Public review):
Summary:
The manuscript "Adapting Clinical Chemistry Plasma as a Source for Liquid Biopsies" addresses a timely and practical question: whether residual plasma from heparin separator tubes can serve as a source of cfDNA for molecular profiling. This idea is attractive, since such samples are routinely generated in clinical chemistry labs and would represent a vast and accessible resource for liquid biopsy applications. The preliminary results are encouraging, but in its current form, the study feels incomplete and requires additional work.
We thank the reviewer for the encouragement and for recognizing the potential of clinical chemistry plasma as an accessible source for cfDNA-based analyses. To address concerns about incompleteness, we conducted additional controlled experiments and a more thorough literature review.
My major concerns/suggestions are as follows:
(1) Context and literature
The introduction provides only limited background on prior attempts to use heparinized plasma for cfDNA work. It is well known that heparin can inhibit PCR and sequencing library preparation, which has historically discouraged its use. The authors should summarize the relevant literature more comprehensively and explain clearly why this approach has not been widely adopted until now, and how their work differs from or overcomes these earlier challenges.
Thank you, we agree that the review of prior work requires expansion. In the revised manuscript, we expanded the introduction to focus on prior studies and their gaps (lines 53-80).
(2) Genome-wide coverage
The analyses focus on correlations in methylation patterns and fragmentation metrics, but there is no evaluation of sequencing coverage across the genome. For both WGS and WMS, it would be important to demonstrate whether cfDNA from heparin plasma provides unbiased coverage, or whether certain genomic regions are systematically under-represented. A comparison against coverage profiles from cell-derived DNA (e.g., PBMC genomic DNA) would help to put the results in context and assess whether the material is suitable for whole-genome applications.
Thank you for raising this point. We agree that genome-wide coverage distributions should be evaluated alongside correlations in methylation and fragmentation metrics when assessing the effects of sample tube types.
To address this, we pooled the five healthy subjects in the Tube Comparison Study by tube type to generate two high-depth reference BAMs (EDTA vs. heparin separator). We calculated the mean depth per 1Mb bin across Chr1-22 and normalized with z-score. Overall, the heparin separator samples showed coverage profiles comparable to the matched EDTA samples (Pearson’s r = 0.9988, Spearman’s ρ = 0.9994). The figure has now been added as Supplementary Figure 1.
Also appreciate the suggestion to compare against gDNA. However, cfDNA and gDNA are expected to exhibit different coverage patterns because cfDNA undergoes non-random fragmentation during its generation and degradation, which makes a direct cfDNA–gDNA comparison difficult to interpret in terms of tube-related bias.
(3) Viral detection sensitivity
The study shows strong concordance in viral detection between EDTA and heparin samples, but the sensitivity analysis is lacking. For clinical relevance, it is critical to demonstrate how well heparin-derived plasma performs in low viral load cases. A quantitative comparison of viral read counts and genome coverage across tube types would strengthen the conclusions.
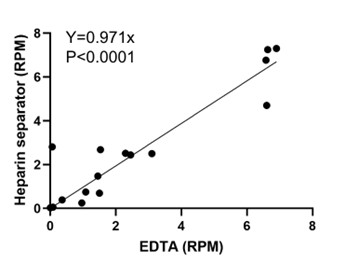
We agree that evaluating low viral loads is important for test development. While our goal is to evaluate the repurposing of residual plasma from the heparin separator, rather than to establish the analytical sensitivity, we recruited additional paired cases (n=4) together with viral reads below 10 RPM from existing cases (n=12) and examined the correlation of viral read counts between EDTA and heparin separators in this subset. As shown in Author response image 1, viral RPM is strongly correlated between tube types (Pearson’s r = 0.93, P < 0.0001), supporting that the heparin-derived plasma yields quantitatively consistent viral reads relative to EDTA samples. We have updated our sample sheet in Supplementary Table 1 and Fig. 3 accordingly.
Author response image 1.
Viral load correlation in cases below 10 RPM
Reviewer #2 (Public review):
Summary:
The authors propose that leftover heparin plasma can serve as a source for cfDNA extraction, which could then be used for downstream genomic analyses such as methylation profiling, CNV detection, metagenomics, and fragmentomics. While the study is potentially of interest, several major limitations reduce its impact; for example, the study does not adequately address key methodological concerns, particularly cfDNA degradation, sequencing depth limitations, statistical rigor, and the breadth of relevant applications.
We thank the reviewer for the insightful comments. In the revised manuscript, we added controlled experiments specifically designed to address the concerns regarding cfDNA degradation. We have also addressed other concerns in the responses below.
Strengths:
The paper provides a cheap method to extract cfDNA, which has broad application if the method is solid.
We thank the reviewer for the encouraging comment.
Weaknesses:
(1) The introduction lacks a sufficient review of prior work. The authors do not adequately summarize existing studies on cfDNA extraction, particularly those comparing heparin plasma and EDTA plasma. This omission weakens the rationale for their study and overlooks important context.
Thank you for this important point. We have expanded the introduction to include a thorough review of relevant prior studies (lines 53-80).
(2) The evaluation of cfDNA degradation from heparin plasma is incomplete. The authors did not compare cfDNA integrity with that extracted from EDTA plasma under realistic sample handling conditions. Their analysis (lines 90-93) focuses only on immediate extraction, which is not representative of clinical workflows where delays are common. This is in direct conflict with findings from Barra et al. (2025, LabMed), who showed that cfDNA from heparin plasma is substantially more degraded than that from EDTA plasma. A systematic comparison of cfDNA yields and fragment sizes under delayed extraction conditions would be necessary to validate the feasibility of their proposed approach.
The concern about degradation is very reasonable based on the literature. In the revised manuscript, we added a controlled experiment mimicking the real-world clinical specimens unprocessed at room temperature.
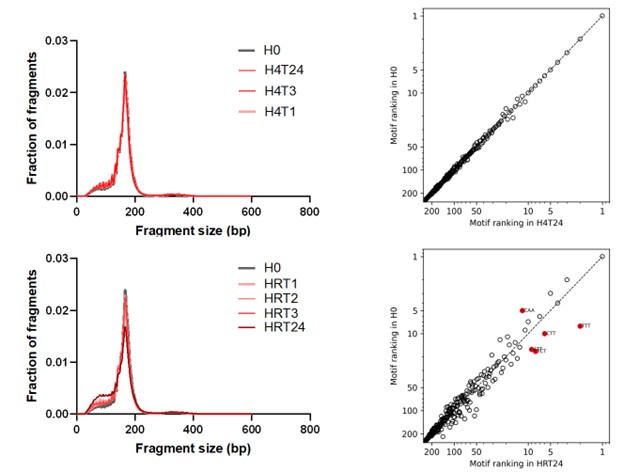
In the controlled experiment with delayed processing, paired EDTA and heparin separator tubes from the same blood draw from 6 volunteers were processed with the first soft spin (1600g 10min) after room temperature or 4°C delays (0, 1, 3, and 24 hours) to simulate the real-world delayed processing at the inpatient hospital setting, and then the original tubes were kept in 4°C for a week before the second spin (16000g 10min) to simulate the delayed processing at the research laboratory (Fig. 2). This simulation cannot mimic the outpatient or remote clinic setting that requires transportation. Therefore, we noted this caveat in the Discussion and Abstract.
From our results, EDTA samples remained largely stable across all test settings (Author response image 2). In contrast, heparin separator tubes held at room temperature showed a clear time-dependent shift in fragmentation, with the most pronounced degradation at 24 hours. Importantly, heparin separator samples processed within a short pre-centrifugation window (for example, within 3 hours) and maintained refrigerated thereafter showed only minimal changes relative to the time 0 controls (Author response image 3). We have updated the Discussion to emphasize this short window plus refrigeration condition as a practical boundary for fragmentomics in heparin separator tubes.
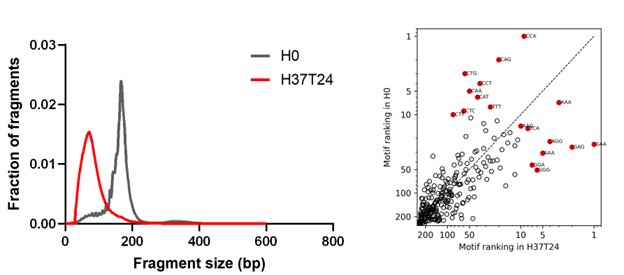
We addressed the work of Barra et al. (2025, LabMed) in the introduction. In that study, whole blood in heparin tubes was first soft spun and then incubated at 37°C for 24 hours, leading to severe DNA fragmentation. Our data agrees: two matched 37°C, 24-hour pairs of samples produced similar severe fragmentation in heparinized blood (Author response image 4). However, this is not representative of routine (Stanford/UCSF) clinical transport and processing. We revised the manuscript to emphasize that heparin separator tubes are most suitable for downstream cfDNA fragmentomic analyses when the pre-centrifugation interval is minimized and samples are maintained refrigerated before processing whenever feasible.
Author response image 2.
Size distribution and end motif rank concordance in EDTA tubes across conditions. Left panels show fragment size distributions. The right panels show the corresponding scatter plots comparing end-motif abundance rankings between conditions. E0, EDTA processed immediately; E4T24, EDTA incubated at 4°C for 24 h; ERT24, EDTA incubated at room temperature for 24 h.

Author response image 3.
Size distribution and end motif rank concordance in Heparin separators across conditions. Left panels show fragment size distributions. The right panels show scatter plots comparing end-motif abundance rankings between conditions. H0, heparin processed immediately; H4T1/H4T3/H4T24, heparin incubated at 4°C for 1, 3, or 24 h; HRT1/HRT2/HRT3/HRT24, heparin incubated at room temperature for 1, 2, 3, or 24 h.
Author response image 4.
Size distribution and end motif rank concordance in extreme incubation conditions. Left panels show fragment size distributions. The right panels show scatter plots comparing end-motif abundance rankings between conditions. H0, heparin processed immediately; H37T24, heparin incubated at 37°C for 24 h.
(3) The comparison of methylation profiles suffers from the same limitation. The authors do not account for cfDNA degradation and the resulting reduced input material, which in turn affects sequencing depth and data quality. As shown by Barra et al., quantifying cfDNA yield and displaying these data in a figure would strengthen the analysis. Moreover, the statistical method applied is inappropriate: the authors use Pearson correlation when Spearman correlation would be more robust to outliers and thus more suitable for methylation and other genomic comparisons.
We appreciate the reasonable concerns regarding cfDNA degradation and agree that the methylation profile is not a metric for degradation. This point regarding measuring degradation is addressed with new experiments and in our above response to comment (2). We appreciate the suggestion to use Spearman correlation, and we have now incorporated Spearman’s ρ into the updated figures.
(4) The CNV analysis also raises concerns. With low-coverage WGS (~5X) from heparin-derived cfDNA, only large CNVs (>100 kb) are reliably detectable. The authors used a 500 kb bin size for CNV calling, but they did not acknowledge this as a limitation. Evaluating CNV detection at multiple bin sizes (e.g., 1 kb, 10 kb, 50 kb, 100 kb, 250 kb) would provide a more complete picture. In addition, Figure 3 presents CNV results from only one sample, which risks bias. Similar bias would exist for illustrations of CNVs from other samples in the supplementary figures provided by the authors. Again, Spearman correlation should be applied in Figure 3c, where clear outliers are visible.
We appreciate the reviewer’s constructive comments regarding the CNV analysis. We added an analysis using 50kb as the bin size (data uploaded to Zenodo). Across matched CNV-positive samples, the CNV patterns remained consistent across tube types, while the expected higher noise was observed. We did not extend the bin size to 1-10kb because at ~5x coverage, such resolution would mainly be noise, rendering the results uninterpretable for CNV calling.We agree that illustrative examples alone are insufficient and that quantitative measures are required. To address this concern, we evaluated concordance across all paired cases by measuring the copy ratio and calculating the Spearman correlation (Fig. 4b). CNV-positive samples had high concordance (n = 6, Spearman’s ρ=0.72-0.96) between tube types and were used primarily for interpretation. Low correlations in CNV-negative samples are not unexpected and were not used for interpretation. In these samples, log2 ratios across all bins cluster tightly around zero in both tube types. Correlation coefficients are highly sensitive to minor fluctuations, thus not informative of biological concordance.
(5) It is important to point out that depth-based CNV calling is just one of the CNV calling methods. Other CNV calling software using SNVs, pair-reads, split-reads, and coverage depth for calling CNV, such as the software Conserting, would be severely affected by the low-quality WGS data. The authors need to evaluate at least two different software with specific algorithms for CNV calling based on current WGS data.
We appreciate this suggestion. We used another popular and independent CNV caller, CNVkit, in addition to ichorCNA. Although both methods use sequencing depth, they differ in their segmentation algorithm. ichorCNA uses a hidden Markov model-based segmentation optimized for low-pass cfDNA WGS, whereas CNVkit uses circular binary segmentation by default and works well with targeted panels. The CNVkit results are also consistent across different tube types. We have added the CNVkit results to Supplementary Fig. 3.
(6) The authors omit an important application of cfDNA: somatic mutation detection. Degraded cfDNA and reduced sequencing depth could substantially impact SNV calling accuracy in terms of both recall and precision. Assessing this aspect with their current dataset would provide a more comprehensive evaluation of heparin plasma-derived cfDNA for genomic analyses.
We thank the reviewer for highlighting somatic SNV detection as an important cfDNA application. Robust SNV benchmarking typically requires larger plasma input and substantially deeper, targeted sequencing than is feasible with remnant chemistry specimens. In routine workflows, chemistry testing leaves only ~0.5–2 mL residual plasma per tube, which limits the achievable depth for sensitive SNV calling. We have added this limitation to the Abstract and the Discussion (lines 281-285) and clarified that our goal is to repurpose heparin separator residual plasma as a complementary resource to expand biobanking, rather than to replace collection protocols optimized for mutation testing.
Reviewer #2 (Recommendations for the authors):
The manuscript does not seem to have been edited thoroughly prior to submission. For example, at lines 94-97, the line spacing is double, which is apparently different from the other surrounding lines. In addition, Figure 5a contains a wrong label of "|y=x" at its top. Figure 5b strongly suggests that Spearman, but not Pearson correlation, should be appropriate for the analysis.
We thank the reviewer for carefully noting these formatting and labeling issues. Corrections for all points are made in the revised version.


