Distinct involvements of the subthalamic nucleus subpopulations in reward-biased decision-making in monkeys

  1. Department of Neuroscience, University of Pennsylvania, Philadelphia, United States

Peer review process

Revised: This Reviewed Preprint has been revised by the authors in response to the previous round of peer review; the eLife assessment and the public reviews have been updated where necessary by the editors and peer reviewers.

Read more about eLife’s peer review process.

Editors

  • Reviewing Editor
    Timothy Hanks
    University of California, Davis, Davis, United States of America
  • Senior Editor
    Michael Frank
    Brown University, Providence, United States of America

Reviewer #1 (Public review):

Summary:

This manuscript offers a careful and technically impressive dissection of how subpopulations within the subthalamic nucleus (STN) support reward-biased perceptual decision-making. The authors recorded STN neurons in monkeys performing an asymmetric-reward visual motion discrimination task, then combined single-unit analyses, regression modeling, and drift-diffusion model (DDM) fitting to identify functionally distinct neuronal clusters. Each subpopulation shows unique relationships to computational decision variables - evidence accumulation rate, decision bound, and non-decision time - as well as to post-decision evaluative signals including choice accuracy and reward expectation. The revised manuscript substantially strengthens the original submission by improving both the objectivity of neuron selection and the robustness of the clustering solution.

Strengths:

The asymmetric-reward paradigm cleanly separates perceptual and motivational contributions to STN activity, allowing the authors to characterize how neurons blend these distinct sources of information. The dataset is extensive and well-controlled, and the behavioral and neural analyses are tightly integrated. Relating cluster-specific activity to DDM parameters provides an interpretable computational link between population signals and behavior. The clustering solution is now validated across two algorithms, two monkeys, and subsets of trials - establishing that the three-cluster structure is robust. The new Figure 9 offers a conceptually useful, if necessarily speculative, synthesis connecting the identified subpopulations to distinct basal-ganglia pathways (hyperdirect versus indirect). The new Figure 8 documenting the anatomical intermingling of subpopulations is also important, as it directly informs the interpretation of prior and future STN stimulation studies.

Weaknesses:

The inferred relationships between neural clusters and DDM parameters remain correlational - the authors now appropriately flag this throughout, and the causal inference gap is acknowledged in the Discussion with concrete proposals for future targeted perturbation strategies. While a generative multi-cluster model would further strengthen mechanistic interpretation, the conceptual framework in Figure 9 provides a reasonable intermediate step given the scope of the study and the absence of simultaneous population recordings, which preclude direct inter-cluster covariation analyses. These remaining limitations are inherent to the experimental design rather than analytical oversights.

Reviewer #2 (Public review):

This study uses monkey single-unit recordings to examine the role of the STN in combining noisy sensory information with reward bias during decision-making between saccade directions. Using multiple linear regressions and clustering approaches, the authors overall show that a highly heterogeneous activity in the STN reflects almost all aspects of the task, including choice direction, stimulus coherence, reward context and expectation, choice evaluation, and their interactions. The authors report in particular how three classes of neurons map to different decision processes evaluated via the fitting of a drift-diffusion model. Overall, the study provides evidence for functionally diverse and anatomically intermingled populations of STN neurons, supporting multiple roles in perceptual and reward-based decision-making.

This study follows up on work conducted in previous years by the same team and complements it. Extracellular recordings in monkeys trained to perform a complex decision-making task remain a remarkable achievement, particularly in brain structures that are difficult to target, such as the sub-thalamic nucleus. The authors conducted numerous analyses of STN activities, using sophisticated statistical approaches and functional computational modeling.

One criticism that I would still make in the revised version of the paper concerns the description of the behavior of the two monkeys which is still minimal, while acknowledging differences in their choice and RT performance that reflect "individual differences in sensitivity to motion stimulus and a common heuristic-based satisficing strategy". This sentence is not clear to me. Moreover, the potential consequences of these differences on neuronal activity are only considered in the cluster analysis done for each of the two animals separately and for which it turns out there is no notable difference.

Compared to the first version of the paper, the cluster analysis in this revised version yields three distinct populations instead of the previous four. While the authors suggest that these subpopulations play important roles in encoding different aspects of decision-making, the identification of three rather than four subpopulations seems to me an important update that warrants discussion.

Finally, I think it would have been interesting to identify the level of collinearity in the model proposed by the authors (equation 7). Indeed, one can expect significant collinearity between some of the proposed explanatory factors of neuronal activity, such as choice and coherence level, for example.
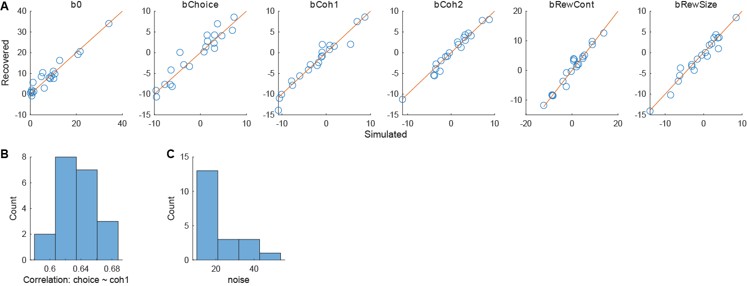
 Similarly, for the analysis relating neuron activity to decision evaluation signals (p 16), firing rates calculated using sliding averages with 1-ms steps are compared, but the method does not specify controls for multiple comparisons or for non-independent data.

Author response:

The following is the authors’ response to the original reviews.

Reviewer #1 (Public review):

(1) The inferred relationships between neural clusters and specific drift‑diffusion parameters (e.g., bound height, scaling factor, non‑decision time) are intriguing but inherently correlational. The authors should clarify that these associations do not necessarily establish distinct computational mechanisms.

We agree and have revised the text to avoid any mention of a causal relationship.

(2) While the k‑means approach is well described, it remains somewhat heuristic. Including additional cross‑validation (e.g., cluster reproducibility across monkeys or sessions) would strengthen confidence in the four‑cluster interpretation.

We took several steps to increase our confidence in the clustering results. First, we made improvements in how we used the k-means method, primarily by using activity vectors with finer time resolution and filtering out “outlier” neurons (details in Methods) that were dissimilar to other neurons to reduce spurious clustering results. Second, we performed a new set of clustering procedures based on the linkage method, in addition to the k-means method that we originally used. The two clustering methods generated very similar neuron groupings, with a Rand index of 0.93. We now present k-means results in the main figures and linkage results as supplements (e.g., compare Fig 5 and Fig 5-S2). Third, following the reviewer’s suggestion, we performed clustering based on the two monkeys’ data both combined and separately (new Fig 5-S3). Clustering of data from both monkeys combined, compared to each monkey considered separately, had rand index values of 0.94 and 1 for monkeys C and F, respectively (i.e., neurons from one monkey tended to be assigned to the same cluster regardless of whether the clustering was based on data from that monkey alone or both monkeys together), indicating comparable cluster boundaries for the two monkeys. Lastly, we performed clustering based on pseudo-vectors derived from sampling a subset of trials for each neuron and found that the clustering results were stable and robust based on as low as 40% of the trials (new Fig 5-S4).

Because most neurons were recorded in separate sessions, we cannot perform session-based cross validation.

(3) The functional dissociations across clusters are clearly described, but how these subgroups interact within the STN or through downstream basal‑ganglia circuits remains speculative.

We agree and have made sure any speculative claims we make are clearly described as such.

(4) A natural next step would be to construct a generative multi‑cluster model of STN activity, in which each cluster is treated as a computational node (e.g., evidence integrator, bound controller, urgency or evaluative signal).

(5) Such a low‑dimensional, coupled model could reproduce the observed diversity of firing patterns and predict how interactions among clusters shape decision variables and behavior.

(6) Population‑level modeling of this kind would move the interpretation beyond correlational mapping and serve as an intermediate framework between single‑unit analysis and in‑vivo perturbation.

We agree that such a model would be extremely useful. However, given that designing, implementing, and testing a model like that would require a good deal of speculation about functional and anatomical interactions that we did not measure, it is also well outside the scope of the current study.

That said, we appreciate the suggestions, which spurred us to go further in terms of providing a summary of our findings (new Figure 9) with a bit of informed speculation about how the different functionally defined subgroups of STN neurons that we characterized might relate to not only different computations but also different pathways through the basal ganglia (i.e., the hyperdirect versus indirect pathway, both of which include the STN). We hope that this summary, along with our more detailed findings, will inform new modeling studies by us and others.

(7) Causal inference gap - Without perturbation data, it is difficult to determine whether the identified neural modulations are necessary or sufficient for the observed behavioral effects. A brief discussion of this limitation - and how future causal manipulations could test these cluster functions - would be valuable.

As suggested, we have added the following to the Discussion (line 365): “The exact contributions of these subpopulations are challenging to elucidate, as their intermingled localization make common perturbation techniques, such as electrical microstimulation or optogenetic manipulations, not suitable. It would be interesting to examine if these subpopulations differ in molecular or connectivity properties (e.g., as we speculated above) that can be capitalized to precisely target each subpopulation.”

Reviewer #1 (Recommendations for the authors):

(1) Develop or outline a generative multi‑cluster model:

Consider constructing, even at a conceptual level, a generative network model in which the identified STN clusters serve as interacting computational nodes (e.g., evidence integration, bound modulation, urgency, or evaluative nodes).

Such a framework could reproduce the simultaneous presence of ramping, transient, and context-sensitive activity patterns observed across clusters.

Even a simulated or schematic implementation - showing how parameter coupling among these clusters gives rise to the reported firing diversity and behavioral effects - would help clarify the mechanistic implications of your findings.

As noted above, we believe that a full modeling study is well outside the scope of the present work. However, we have provided a conceptual framework, shown in Figure 9, summarizing our findings and providing some informed speculation about how different subgroups of STN neurons could provide different functions along distinct anatomical pathways.

(2) Strengthen the link between cluster activity and computation:

Use cross‑validated or hierarchical regression models to verify the robustness of correlations between cluster‑specific firing measures and fitted drift‑diffusion parameters. This would make the mapping between neural activity and model components more statistically grounded.

We appreciate the suggestion and thought hard about how we might implement it but ultimately decided our approach is most appropriate, given the strengths and limitations of our dataset. The fundamental issue is that it takes many trials to obtain reliable estimates of DDM parameters. Our approach of creating twelve “pseudo-sessions” for each neuron (half of those for trials with high firing rates, half for trials with low firing rates) balances our ability to obtain those estimates while testing for relationships with firing rate. Any further subdivision of the data for cross validation yields unreliable parameter estimates (i.e., with big error bars). We also chose not to use a hierarchical model and instead took a more unbiased approach by considering how all of the DDM parameters relate to firing rate.

Despite the simplicity of our approach, we believe that these results are statistically grounded. It is possible that more complex regression models may reveal additional (e.g., non-linear) relationships, but those results would also be less intuitive to interpret. We therefore decided to retain our analysis choice.

(3) Assess cluster reproducibility:

Report or include in the supplement the degree of correspondence of cluster identities across monkeys or across independent subsets of trials. Cluster stability metrics (e.g., bootstrap or split‑half analysis) would reassure readers that cluster structure is not dataset‑specific.

Please see our response above to the main comment #2 regarding the robustness and stability of clustering results.

(4) Explore population interactions directly:

You could analyze pairwise or population‑level covariations (e.g., principal components or canonical correlation analysis) to test whether inter‑cluster interactions correspond to model‑predicted dynamics such as competition or normalization.

Because most of the neurons were recorded in separate sessions and not simultaneously, the suggested population analyses are not feasible.

Discuss briefly how the proposed generative or dynamical multi‑cluster model could be empirically tested-e.g., using selective perturbation (microstimulation, optogenetic, or pharmacological) in future studies-to evaluate interactions inferred from the current dataset. If feasible, mention how this framework might generalize to other decision contexts beyond oculomotor tasks, such as effort‑reward tradeoffs or inhibitory control, reinforcing the broad relevance of STN computations.

As suggested, we have added the following to the Discussion (line 366): “The exact contributions of these subpopulations are challenging to elucidate, as their intermingled localization make common perturbation techniques, such as electrical microstimulation or optogenetic manipulations, not suitable. It would be interesting to examine if these subpopulations differ in molecular or connectivity properties (e.g., as we speculated above) that can be capitalized to precisely target each subpopulation.”

Reviewer #2 (Public review):

One criticism I would make is that the authors sometimes seem to assume that readers are familiar with their previous work. Indeed, the motivation and choices behind some analyses are not clearly explained. It might be interesting to provide a little more context and insight into these methodological choices. The same is true for the description of certain results, such as the behavioral results, which I find insufficiently detailed, especially since the two animals do not perform exactly the same way in the task.

We apologize for the lack of detail regarding the behavioral results and analysis choices. To address this issue, we substantially revised the text, particularly in Results and Methods.

The differences in behavior for the two monkeys were the subject of an entire published study (Fan Y, Gold JI, Ding L, 2018, Ongoing, rational calibration of reward-driven perceptual biases. Elife 7: e36018.). That study showed that these differences most likely arose from the monkeys’ individual sensitivity to the motion stimulus, combined with a heuristic-based strategy to gain satisficing rewards that they all seem to use. We revised the text to acknowledge the individual differences and refer readers to our previous study (line 78): “Both monkeys showed consistent biases toward the large-reward choice (Figure 1B, C). The individual differences in their choice and RT performance reflect individual differences in sensitivity to motion stimulus and a common heuristic-based satisficing strategy, as we demonstrated in a previous study (Fan et al., 2018).”

Another criticism is the difficulty in following and absorbing all the presented results, given their heterogeneity. This heterogeneity stems from analytical choices that include defining multiple time windows over which activities are studied, multiple task-related or monkey behavioral factors that can influence them, multiple parameters underlying the decision-making phenomena to be captured, and all this without any a priori hypotheses. The overall impression is of an exploratory description that is sometimes difficult to digest, from which it is hard to extract precise information beyond the very general message that multiple subpopulations of neurons exist and therefore that the STN is probably involved in multiple roles during decision-making.

In response to the three reviewers’ comments on data inclusion and the clustering analysis we presented, we have substantially improved the objectivity and robustness of our approaches, by: 1) applying a data-driven criterion for identifying neurons with robust task-relevant modulation (Figure 4C), 2) removing “outlier” neurons that appear not to share activity profiles with any other neurons in our sample (note that these outlier neurons would be at the outskirts in the cluster space instead of between clusters), 3) increasing the temporal resolution for generating firing rate vectors, and 4) comparing clustering results based on two methods (k-means and linkage). These improvements both sharpened the cluster boundaries and allowed us to observe more robust and distinctive subpopulation-specific relationships between neural activity and computational components in the DDM framework (new Figures 5–7 and their supplementary figures). We believe these updated results clearly demonstrate that: 1) there are different STN subpopulations, and 2) each of the subpopulations encodes a distinct set of functions.

It would also have been interesting to have information regarding the location of the different identified subpopulations of neurons in the STN and their level of segregation within this nucleus. Indeed, since the STN is one of the preferred targets of electrical stimulation aimed at improving the condition of patients suffering from various neurological disorders, it would be interesting to know whether a particular stimulation location could preferentially affect a specific subpopulation of neurons, with the associated specific behavioral consequences.

We have added a new Figure 8 to show the localization of neurons with and without task modulation and of neurons from different subpopulations. Consistent with our previous demonstration of intermingled distribution of STN subpopulations, we did not observe any activity pattern-based segregation.

To relate the activity patterns to previously reported stimulation effects, we added the following to the Discussion (line 307): “This functional diversity, along with a lack of clear anatomical organization, is consistent with the multiple effects of STN stimulation in patient populations on decision-making and out previous results in monkeys, including reductions in response times, a weaker dependence on evidence, and changes in the maximal value and trajectories of the decision bound (Frank et al., 2007; Cavanagh et al., 2011; Coulthard et al., 2012; Green et al., 2013; Zavala et al., 2014; Herz et al., 2016; Pote et al., 2016; Branam et al., 2024).”

Therefore, this paper is interesting because it complements other work from the same team and other studies that demonstrate the likely important role of the STN in decision-making. This will be of interest to the decision-making neuroscience community, but it may leave a sense of incompleteness due to the difficulty in connecting the conclusions of these different studies. For example, in the discussion section, the authors attempt to relate the different neuronal populations identified in their study and describe some relatively consistent results, but others less so.

We hope that our revised Results and Discussion clarify the conclusions that can be drawn from this and other related studies.

Reviewer #2 (Recommendations for the authors):

(1) Introduction, l. 47-48: It would be interesting to provide more details on these three populations in order to better understand why we need additional experiments to more comprehensively define their roles.

We now give more details in the Introduction about the remaining questions we aimed to address in this study (line 50): “However, the specific computational roles that these different subpopulations play in decision-making and other cognitive functions remain not well understood. For example, two of the subpopulation had overall activity patterns that were consistent with two different models in which the STN modulated the decision bound (Ratcliff and Frank, 2012; Wei et al., 2015), but the exact nature of this modulation is not known. The other subpopulation’s general activity patterns were consistent with a model of STN mediating evidence accumulation (Bogacz and Gurney, 2007), but it is unclear if and how this activity contributes to how evidence is weighed, biased, or accumulated.”

Our previous attempt to distinguish these alternatives using electrical microstimulation was unsuccessful because that manipulation likely affected highly intermingled subpopulations with different functions.”

(2) Results, l. 71-73: A slightly more detailed description of the behavioral results would be appreciated, especially since the two monkeys do not behave exactly the same way in the task, particularly in terms of reaction times (Figure 1B top-right versus bottom-right).

We revised the text to acknowledge the individual differences and refer readers to our previous study (line 78): “Both monkeys showed consistent biases toward the large-reward choice (Figure 1B, C). The individual differences in their choice and RT performance reflect individual differences in sensitivity to motion stimulus and a common heuristic-based satisficing strategy, as we demonstrated in a previous study (Fan et al., 2018).”

(3) Figure 2G-I: Were the multiple linear regressions performed only in the asymmetric reward condition?

Yes. We added in Methods (line 487): “All analyses were performed on activity from the asymmetric-reward task.”

(4) Very often in the text, the authors use terms that refer to concepts or methods that are difficult to grasp on the first reading, especially if we are not familiar with the team's previous publications. This is the case, for example, with "joint modulation," "reward context," "reward expectation," "k-means clustering," "tSNE," "Silhouette score for neurons," "Rand index," etc. All the explanations are minimal, and it would be helpful to clearly define these terms and provide some justification and insight to support the use of the analyses and the resulting variables, all of which would facilitate the reading of the manuscript.

We now define these terms explicitly in the text (emphasis added here for clarity):

(Results, line 129): “Using a previous definition of “joint modulation” (Doi et al., 2020), including modulation separately by motion coherence and reward context or reward size and modulation by the interaction of motion coherence and reward size, we found that ~40% of the neurons showed joint modulation during motion viewing.”

(Results, line 71): “… for which we separately manipulated the noisy evidence (motion direction and strength) and reward context (a larger juice reward for a correct choice associated with one of the two directions).”

(Results, line 250): “Choice accuracy describes the probability that a choice is correct given the evidence. Reward expectation describes the the expected reward given a choice.”

(Methods, line 550): “To quantify the consistency between two runs of clustering, we computed the Rand index as the number of neuron pairs with consistent grouping (i.e., they were placed in the same cluster for both runs or they were placed in different clusters for both runs), normalized by the total number of possible neuron pairs. A value of 1 indicates that the two clustering runs produce identical results, and a value of 0 indicates that the two runs do not agree on any pairs of neurons.”

To quantify the separation of clusters, we computed silhouette scores as the difference between mean intra-cluster distance and the mean nearest-cluster distance, normalized by the maximum of the two values. A positive score indicates that the member is closer to its same-cluster neighbors than different-cluster neighbors. Clustering runs with high mean silhouette score were considered to have better cluster separation.

We no longer use tSNE visualization.

(5) Figure 5A, caption: A quick description of the parameters would be useful.

We added the description of DDM parameters in the caption of new Figure 4.

(6) Results l. 222: Why does the analysis only concern epoch 5? I suggest justifying this choice. Also, the text indicates a "trend" but Figure 5C shows a significant result (p=0.0129).

These statements have been removed from the updated manuscript.

(7) Methods, l. 443: The authors should report more details about how they decided that neurons were task-related or not. "Visual inspection" sounds like a very vague and subjective criterion.

We now apply a more objective criterion for identifying neurons with task-relevant modulation:

(Results, line 145): “To focus on neurons with the most robust task-relevant activity, we measured firing rates during a baseline period (300 ms before motion onset) and sliding 100 ms windows from motion onset to 150 ms after saccade onset in 50 ms steps. We identified the maximal and minimal z-scores, representing the peak activation and suppression, respectively, for each neuron across all trial conditions (Figure 4C). We applied a threshold of z-score >1.5 for either activation or suppression and focused further analyses on the 87 neurons that met this selection criterion (n = 62 and 25 for monkeys C and F, respectively).”

(8) A map of the location of the different STN neuron clusters found in this study within the structure would be very interesting.

We have added a new Figure 8 to show the localization of neurons with/without task modulation and of neurons from different subpopulations.

(9) Unless I am mistaken, there is no mention of data availability in this manuscript.

The data availability statement was/is on the submission form.

Data Availability: All electrophysiological data and the code for the analyses presented in the paper will be deposited in a publicly accessible domain when the paper is published.

Previously Published Datasets: Source data for Figure 3-S2 in eLife paper:

https://doi.org/10.7554/eLife.60535.: Fan, Doi, Gold, Ding, 2020,

https://cdn.elifesciences.org/articles/60535/elife-60535-fig3-data1-v1.csv,

https://cdn.elifesciences.org/articles/60535/elife-60535-fig3-data1-v1.csv

Reviewer #3 (Public review):

The primary weakness of the paper lies in the claim that STN contains multiple sub-populations with distinct involvements in decision making, which is inadequately supported by the paper's methods and analyses.

First, while it is clear that the ~150 recorded neurons across 2 monkeys (91, 59 respectively) display substantial heterogeneity in their activity profiles across time and across stimulus/reward conditions, the claim of sub-populations largely rests on clustering a *subset of less than half the population - 66 neurons (48, 15 respectively) - chosen manually by visual inspection*. The full population seems to contain far more decision-modulated neurons, whose response profiles seem to interpolate between clusters. Moreover, it is unclear if the 4 clusters hold for each of the 2 monkeys, and the choice of 4-5 clusters does not seem well supported by metrics such as silhouette score, etc, that peak at 3 (1 or 2 were not attempted). From the data, it is easier to draw the conclusion that the STN population contains neurons with heterogeneous response profiles that smoothly vary in their tuning to different decision variables, rather than distinct sub-populations.

In response to the three reviewers’ comments on data inclusion and the clustering analysis we presented, we have substantially improved the objectivity and robustness of our approaches, by: 1) applying a data-driven criterion for identifying neurons with robust task-relevant modulation (Figure 4C), 2) removing “outlier” neurons that appear not to share activity profiles with any other neurons in our sample (note that these outlier neurons would be at the outskirts in the cluster space instead of between clusters), 3) increasing the temporal resolution for generating firing rate vectors, and 4) comparing clustering results based on two methods (K-means and linkage). These improvements both sharpened the cluster boundaries and allowed us to observe more robust and distinctive subpopulation-specific relationships between neural activity and computational components in the DDM framework (new Figures 5–7 and their supplementary figures). We believe these updated results clearly demonstrate that: 1) there are different STN subpopulations, and 2) each of the subpopulations encodes a distinct set of functions.

We performed additional analysis to assess the robustness of the clustering results. First, following the reviewer’s suggestion, we performed clustering based on the two monkeys’ data both combined and separately (new Fig 5-S3). Clustering of data from both monkeys combined compared to each monkey considered separately had rand index values of 0.94 and 1 for monkeys C and F, respectively (i.e., neurons from one monkey were assigned to the same cluster regardless of whether the clustering was based on data from that monkey alone or both monkeys together), indicating comparable cluster boundaries for the two monkeys. Second, we performed clustering based on pseudo-vectors derived from sampling a subset of trials for each neuron and found that the clustering results were stable and robust based on as low as 40% of the trials (new Fig 5-S4). Third, we generated a new figure (Figure 5-S1), using dendrograms to visualize how the neurons relate to each other. The dendrogram in Figure 5-S2 is more consistent with (at least) three distinct subpopulations of neurons than with the null hypothesis of a continuous distribution with smoothly-varying response profiles.

Second, assuming the existence of sub-populations, it is unclear how their time- and condition-varying relationship with DDM parameters is to be interpreted. These relationships are inferred by splitting trials based on individual neurons' firing rates in different task epochs and reward contexts, and regressing onto the parameters of separate DDMs fit to those subsets of trials. The result is that different sub-populations show heterogeneous relationships to different DDM parameters over time - a result that, while interesting, leaves the computational involvement of these sub-populations/implementation of the decision process unclear.

The improvements we made of the clustering procedure both sharpened the cluster boundaries and allowed us to observe more robust and distinctive subpopulation-specific relationships between neural activity and computational components in the DDM framework (new Figures 5-7 and their supplementary figures). These updated results demonstrate that: 1) there are different STN subpopulations, and 2) each of the subpopulations encodes a particular set of functions.

  1. Howard Hughes Medical Institute
  2. Wellcome Trust
  3. Max-Planck-Gesellschaft
  4. Knut and Alice Wallenberg Foundation