Peer review process
Not revised: This Reviewed Preprint includes the authors’ original preprint (without revision), an eLife assessment, public reviews, and a provisional response from the authors.
Read more about eLife’s peer review process.Editors
- Reviewing EditorFadel TissirUCLouvain, Brussels, Belgium
- Senior EditorMurim ChoiSeoul National University, Seoul, Republic of Korea
Reviewer #1 (Public review):
Summary:
In this manuscript, Ampartzidis et al. report the establishment of an iPSC-derived neuroepithelial model to examine how mutations from spina bifida patients disrupt fundamental cellular properties that underlie neural tube closure. The authors utilize an adherent neural induction protocol that relies on dual SMAD inhibition to differentiate three previously established iPSC lines with different origins and reprogramming methods. The analysis is comprehensive and outstanding, demonstrating reproducible differentiation, apical-basal elongation, and apical constriction over an 8-day period among the 3 lines. In inhibitor studies, it is shown that apical constriction is dependent on ROCK and generates tension, which can be measured using an annular laser ablation assay. Since this pathway is dependent on PCP signaling, which is also implicated in neural tube defects, the authors investigated whether VANGL2 is required by generating 2 lines with a pathogenic patient-derived sequence variant. Both lines showed reduced apical constriction and reduced tension in the laser ablation assays. The authors then established lines obtained from amniocentesis, including 2 control and 2 spina bifida patient-derived lines. These remarkably exhibited different defects. One line showed defects in apical-basal elongation, while the other showed defects in neural differentiation. Both lines were sequenced to identify candidate variants in genes implicated in NTDs. While no smoking gun was found in the line that disrupts neural differentiation (as is often the case with NTDs), compound heterozygous MED24 variants were found in the patient whose cells were defective in apical-basal elongation. Since MED24 has been linked to this phenotype, this finding is especially significant.
Some details are missing regarding the method to evaluate the rigor and reproducibility of the study.
Major Comments:
It is mentioned throughout the manuscript that 3 plates were evaluated per line. I believe these are independently differentiated plates. This detail is critical concerning rigor and reproducibility. This should be clearly stated in the Methods section and in the first description of the experimental system in the Results section for Figure 1.
For the patient-specific lines - how many lines were derived per patient?
Was the Vangl2 variant introduced by prime editing? Base editing? The details of the methods are sparse.
Significance:
This paper is significant not only for verifying the cell behaviors necessary for neural tube closure in a human iPSC model, but also for establishing a robust assay for the functional testing of NTD-associated sequence variants. This will not only demonstrate that sequence variants result in loss of function but also determine which cellular behaviors are disrupted.
Reviewer #2 (Public review):
Summary:
The authors' work focuses on studying cell morphological changes during differentiation of hPSCs into neural progenitors in a 2D monolayer setting. The authors use genetic mutations in VANGL2 and patient-derived iPSCs to show that (1) human phenotypes can be captured in the 2D differentiation assay, and (2) VANGL2 in humans is required for neural contraction, which is consistent with previous studies in animal models. The results are solid and convincing, the data are quantitative, and the manuscript is well written. The 2D model they present successfully addresses the questions posed in the manuscript. However, the broad impact of the model may be limited, as it does not contain NNE cells and does not exhibit tissue folding or tube closure, as seen in neural tube formation. Patient-derived lines are derived from amniotic fluid cells, and the experiments are performed before birth, which I find to be a remarkable achievement, showing the future of precision medicine.
Major comments:
(1) Figure 1. The authors use F-actin to segment cell areas. Perhaps this could be done more accurately with ZO-1, as F-actin cables can cross the surface of a single cell. In any case, the authors need to show a measure of segmentation precision: segmented image vs. raw image plus a nuclear marker (DAPI, H2B-GFP), so we can check that the number of segmented cells matches the number of nuclei.
(2) Lines 156-166. The authors claim that changes in gene expression precede morphological changes. I am not convinced this is supported by their data. Fig. 1g (epithelial thickness) and Fig. 1k (PAX6 expression) seem to have similar dynamics. The authors can perform a cross-correlation between the two plots to see which Δt gives maximum correlation. If Δt < 0, then it would suggest that gene expression precedes morphology, as they claim. Fig. 1j shows that NANOG drops before the morphological changes, but loss of NANOG is not specific to neural differentiation and therefore should not be related to the observed morphological changes.
(3) Figure 2d. The laser ablation experiment in the presence of ROCK inhibitor is clear, as I can easily see the cell outlines before and after the experiment. In the absence of ROCK inhibitor, the cell edges are blurry, and I am not convinced the outline that the authors drew is really the cell boundary. Perhaps the authors can try to ablate a larger cell patch so that the change in area is more defined.
(4) Figure 2d. Do the cells become thicker after recoil?
(5) Figure 3. The authors mention their previous study in which they show that Vangl2 is not cell-autonomously required for neural closure. It will be interesting to study whether this also the case in the present human model by using mosaic cultures.
(6) Lines 403-415. The authors report poor neural induction and neuronal differentiation in GOSB2. As far as I understand, this phenotype does not represent the in vivo situation. Thus, it is not clear to what extent the in vitro 2D model describes the human patient.
(7) The experimental feat to derive cell lines from amniotic fluid and to perform experiments before birth is, in my view, heroic. However, I do not feel I learned much from the in vitro assays. There are many genetic changes that may cause the in vivo phenotype in the patient. The authors focus on MED24, but there is not enough convincing evidence that this is the key gene. I would like to suggest overexpression of MED24 as a rescue experiment, but I am not sure this is a single-gene phenotype. In addition, the fact that one patient line does not differentiate properly leads me to think that the patient lines do not strengthen the manuscript, and that perhaps additional clean mutations might contribute more.
Significance:
This study establishes a quantitative, reproducible 2D human iPSC-to-neural-progenitor platform for analyzing cell-shape dynamics during differentiation. Using VANGL2 mutations and patient-derived iPSCs, the work shows that (1) human phenotypes can be captured in a 2D differentiation assay and (2) VANGL2 is required for neural contraction (apical constriction), consistent with animal studies. The results are solid, the data are quantitative, and the manuscript is well written. Although the planar system lacks non-neural ectoderm and does not exhibit tissue folding or tube closure, it provides a tractable baseline for mechanistic dissection and genotype-phenotype mapping. The derivation of patient lines from amniotic fluid and execution of experiments before birth is a remarkable demonstration that points toward precision-medicine applications, while motivating rescue strategies and additional clean genetic models. However, overall, I did not learn anything substantively new from this manuscript; the conclusions largely corroborate prior observations rather than extend them. In addition, the model was unsuccessful in one of the two patient-derived lines, which limits generalizability and weakens claims of patient-specific predictive value.
Reviewer #3 (Public review):
Summary:
This manuscript by Ampartzidis et al., significantly extends the human induced pluripotent stem cell system originally characterized by the same group as a tool for examining cellular remodeling during differentiation stages consistent with those of human neural tube closure (Ampartzidis et al., 2023). Given that there are no direct ways to analyze cellular activity in human neural tube closure in vivo, this model represents an important platform for investigating neural tube defects which are a common and deleterious human developmental disease. Here, the authors carefully test whether this system is robust and reproducible when using hiPSC cells from different donors and pluripotency induction methods and find that despite all these variables the cellular remodeling programs that occur during early neural differentiation are statistically equivalent, suggesting that this system is a useful experimental substrate. Additionally, the carefully selected donor populations suggest these aspects of human neural tube closure are likely to be robust to sexual dimorphism and to reasonable levels of human genetic background variation, though more fully testing that proposition would require significant effort and be beyond the scope of the current work. Subsequent to this careful characterization, the authors next tested whether this system could be used to derive specific insights into cell remodeling during early neural differentiation. First, they used a reverse genetics approach to knock in a human point mutation in the critical regulator of planar cell polarity and apical constriction, Vangl2. Despite being identified in a patient, this R353C variant has not been directly functionally tested in a human system. The authors find that this variant, despite showing normal expression and phospho-regulation, leads to defects consistent with a failure in apical constriction, a key cell behavior required to drive curvature change during cranial closure. Finally, the authors test the utility of their hiPSC platform to understand human patient-specific defects by differentiating cells derived from two clinical spina bifida patients. The authors identify that one of these patients is likely to have a significant defect in fully establishing early proneural identity as well as defects in apicobasal thickening. While early remodeling occurs normally in the other patient, the authors observe significant defects in later neuronal induction and maturation. In addition, using whole exome sequencing the authors identify candidate variant loci that could underly these defects.
Major comments:
(1) One of my few concerns with this work is that the relative constriction of the apical surface with respect to the basal surface is not directly quantified for any of the experiments. This worry is slightly compounded by the 3D reconstructions Figure 1h, and the observation that overall cell volume is reduced and cell height increased simultaneously to area loss. Additionally, the net impact of apical constriction in tissues in vivo is to create local or global curvature change, but all the images in the paper suggest that the differentiated neural tissues are an uncurved monolayer even missing local buckles. I understand that these cells are grown on flat adherent surfaces limiting global curvature change, but is there evidence of localized buckling in the monolayer? While I believe-along with the authors-that their phenotypes are likely failures in apical constriction, I think they should work to strengthen this conclusion. I think the easiest way (and hopefully using data they already have) would be to directly compare apical area to basal area on a cell wise basis for some number of cells. Given the heterogeneity of cells, perhaps 30-50 cells per condition/line/mutant would be good? I am open to other approaches; this just seems like it may not require additional experiments.
(2) Another slight experimental concern I have regards the difference in laser ablation experiments detailed in Figure 3h-i from those of Figure 2d-e. It seems like WT recoil values in 3h-I are more variable and of a lower average than the earlier experiments and given that it appears significance is reached mainly by impact of the lower values, can the authors explain if this variability is expected to be due to heterogeneity in the tissue, i.e. some areas have higher local tension? If so, would that correspond with more local apical constriction?
Significance:
Overall, I am enthusiastic about this work and believe it represents a significant step forward in the effort to establish precision medicine approaches for diagnoses of the patient-specific causative cellular defects underlying human neural tube closure defects. This work systematizes an important and novel tool to examine the cellular basis of neural tube defects. While other hiPSC models of neural tube closure capture some tissue level dynamics, which this model does not, they require complex microfluidic approaches and have limited accessibility to direct imaging of cell remodeling. Comparatively, the relative simplicity of the reported model and the work demonstrating its tractability as a patient-specific and reverse genetic platform make it unique and attractive. This work will be of interest to a broad cross section of basic scientists interested in the cellular basis of tissue remodeling and/or the early events of nervous system development as well as clinical scientists interested in modeling the consequences of patient specific human genetic deficits identified in neural tube defect pregnancies.
Author response:
General Statements
In this manuscript we characterize an exquisitely reproducible model of iPSC differentiation into neuroepithelial cells, use it to mechanistically study cell shape changes and planar cell polarity signaling activation during this transition, then apply it to identify patient-specific cell deficiencies in both forward and reverse genetic screens as a power tool for patient-stratification in personalized medicine. To our knowledge, we provide the first evidence of a human pathogenic mutation directly impairing apical constriction: an evolutionarily conserved behavior of epithelial cells which is the subject of intense research.
We are very pleased with the balanced and rigorous reviews generated through Review Commons, which we have already used to improve our manuscript. Reviewer 1 highlights that our study “is significant not only for verifying the cell behaviors necessary for neural tube closure in a human iPSC model, but also for establishing a robust assay for the functional testing of NTD-associated sequence variants.” Reviewer 2 agrees that “results are solid and convincing, the data are quantitative, and the manuscript is well written”, and that our “derivation of patient lines from amniotic fluid and execution of experiments before birth is a remarkable demonstration that points toward precision-medicine applications, while motivating rescue strategies and additional clean genetic models.” Reviewer 3 is “enthusiastic about this work and believe it represents a significant step forward in the effort to establish precision medicine approaches for diagnoses of the patient-specific causative cellular defects underlying human neural tube closure defects.”
Below, we have replied to each of the reviewers’ comments.
Description of the planned revisions
R2.2. Lines 156-166. The authors claim that changes in gene expression precede morphological changes. I am not convinced this is supported by their data. Fig. 1g (epithelial thickness) and Fig. 1k (PAX6 expression) seem to have similar dynamics. The authors can perform a cross-correlation between the two plots to see which Δt gives maximum correlation. If Δt < 0, then it would suggest that gene expression precedes morphology, as they claim. Fig. 1j shows that NANOG drops before the morphological changes, but loss of NANOG is not specific to neural differentiation and therefore should not be related to the observed morphological changes.
We are happy to do this analysis fully in revision. Our initial analysis performing crosscorrelation between apical area and CDH2 protein in one line shows the highest crosscorrelation at Δt = -1, suggesting neuroepithelial CDH2 increases before apical area decreases. In contrast, the same analysis comparing apical area versus PAX6 shows Δt = 0, suggesting concurrence. This analysis will be expanded to include the other markers we quantified and the manuscript text amended accordingly. We are keen to undertake additional experiments to test whether these cells swap their key cadherins – CDH1 and CDH2 - before they begin to undergo morphological changes (see the response to Reviewer 3’s minor comment 1 immediately below).
R3.1(Minor) There seems to be a critical window at day 5 of the differentiation protocol, both in terms of cell morphology and the marker panel presented in Figure 1i. Do the authors have any data spanning the hours from day 5 to 6? If not, I don't think they need to generate any, but do I think this is a very interesting window worthy of further discussion for a couple of reasons. First, several studies of mouse neural tube closure have shown that various aspects of cell remodeling are temporally separable. For example, between Grego-Bessa et al 2016 and Brooks et al 2020 we can infer that apicobasal elongation rapidly increases starting at E8.5, whereas apical surface area reduction and constriction are apparent somewhat earlier at E8.0. I think it would be interesting to see if this separability is conserved in humans. Second, is there a sense of how the temporal correlation between the pluripotent and early neural fate marker data presented here corroborate or contradict the emerging set of temporally resolved RNA seq data sets of mouse development at equivalent early neural stages?
Cell shape analysis between days 5 and 6 has now been added (see the response to point 2.1 below). As the reviewer predicted, this is a transition point when apical area begins to decrease and apicobasal elongation begins to increase.
We also thank the reviewer for this prompt to more closely compare our data to the previous mouse publications, which we have added to the discussion. The Grego-Bessa 2016 paper appears to show an increase in thickness between E7.75 and E8.5, but these are not statistically compared. Previous studies showed rapid apicobasal elongation during the period of neural fold elevation, when neuroepithelial cells apically constrict. This has now been added to the discussion:
Discussion: “In mice, neuroepithelial apicobasal thickness is spatially-patterned, with shorter cells at the midline under the influence of SHH signalling[14,77,78]. Apicobasal thickness of the cranial neural folds increases from ~25 µm at E7.75 to ~50 µm at E8.5[79]: closely paralleling the elongation between days 2 and 8 of differentiation in our protocol. The rate of thickening is non-uniform, with the greatest increase occurring during elevation of the neural folds[80], paralleled in our model by the rapid increase in thickness between days 4-6 as apical areas decrease. Elevation requires neuroepithelial apical constriction and these cells’ apical area also decreases between E7.75 and E8.5 in mice[79], but we and others have recently shown that this reduction is both region and sex-specific[14,81]. Specifically, apical constriction occurs in the lateral (future dorsal) neuroepithelium: this corresponds with the identity of the cells generated by the dual SMAD inhibition model we use[56]. More recently, Brooks et al[82] showed that the rapid reduction in apical area from E8-E8.5 is associated with cadherin switching from CDH1 (E-cadherin) to CDH2 (N-cadherin). This is also directly paralleled in our human system, which shows low-level co-expression of CDH1 and CDH2 at day 4 of differentiation, immediately before apical area shrinks and apicobasal thickness increases.”
Prompted by the in vivo data in Brooks et al (2025)[82], we are keen to further explore the timing of CDH1/CDH2 switching versus apical constriction with new experimental data in revisions.
R3.2(Minor) 2) Can the authors elaborate a bit more on what is known regarding apicobasal thickening and pseudo-stratification and how their work fits into the current understanding in the discussion? This is a very interesting and less well studied mechanism critical to closure, which their model is well suited to directly address. I am thinking mainly of the Grego-Bessa at al., 2016 work on PTEN, though interestingly the work of Ohmura et al., 2012 on the NUAK kinases also shows reduced tissue thickening (and apical constriction) and I am sure I have missed others. Given that the authors identify MED24 as a likely candidate for the lack of apicobasal thickening in one of their patient derived lines, is there any evidence that it interacts with any of the known players?
We have now added further discussion on the mechanisms by which the neuroepithelium undergoes apicobasal elongation. Nuclear compaction is likely to be necessary to allow pseudostratification and apicobasal elongation. The reviewer’s comment has led us to realise that diminished chromatin compaction is a potential outcome of MED24 down-regulation in our GOSB2 patient-derived line. Figure 4D suggests the nuclei of our MED24 deficient patientderived line are less compacted than control equivalents and we propose to quantify nuclear volume in more detail to explore this possibility.
Additionally, we have already expanded our discussion as suggested by the reviewer:
Discussion: “Mechanistic separability of apical constriction and apicobasal elongation is consistent with biomechanical modelling of Xenopus neural tube closure showing that both are independently required for tissue bending[61]. Nonetheless, neuroepithelial apical constriction and apicobasal elongation are co-regulated in mouse models: for example, deletion of Nuak1/2[83], Cfl1[84], and Pten[79] all produce shorter neuroepithelium with larger apical areas. Neuroepithelial cells of the GOSB2 line described here, which has partial loss of MED24, similarly produces a thinner neuroepithelium with larger apical areas. Although apical areas were not analysed in mouse models of Med24 deletion, these embryos also have shorter and non-pseudostratified neuroepithelium.
Our GOSB2 line – which retains readily detectable MED24 protein – is clearly less severe than the mouse global knockout, and the clinical features of the patient from which this line was derived are milder than the phenotype of Med24 knockout embryos[68]. Mouse embryos lacking one of Med24’s interaction partners in the mediator complex, Med1, also have thinner neuroepithelium and diminished neuronal differentiation but successfully close their neural tube[85]. As general regulators of polymerase activity, MED proteins have the potential to alter the timing or level of expression of many other genes, including those already known to influence pseudostratification or apicobasal elongation. MED depletion also causes redistribution of cohesion complexes[86] which may impact chromatin compaction, reducing nuclear volume during differentiation.”
R3.3(Minor) 3) Is there any indication that Vangl2 is weakly or locally planar polarized in this system? Figure 2F seems to suggest not, but Supplementary Figure 5 does show at least more supracellular cable like structures that may have some polarity. I ask because polarization seems to be one of the properties that differs along the anteroposterior axis of the neural plate, and I wonder if this offers some insight into the position along the axis that this system most closely models?
VANGL2 does not appear to be planar polarised in this system. This is similar to the mouse spinal neuroepithelium, in which apical VANGL2 is homogenous but F-actin is planar polarised (Galea et al Disease Models and Mechanisms 2018). We do observe local supracellular cablelike enrichments of F-actin in the apical surface of iPSC-derived neuroepithelial cells:
Author response image 1.
Preliminary identification of apical supracellular cables suggestive of local polarity. Top: F-actin staining shown in inverted grey LUT highlighting enrichment along directionally-polarised cell borders (blue arrows). Bottom: Staining orientation (blue ~ X axis, red ~ Y axis) based on OrientationJ analysis illustrating localised organisation of F-actin enrichment.
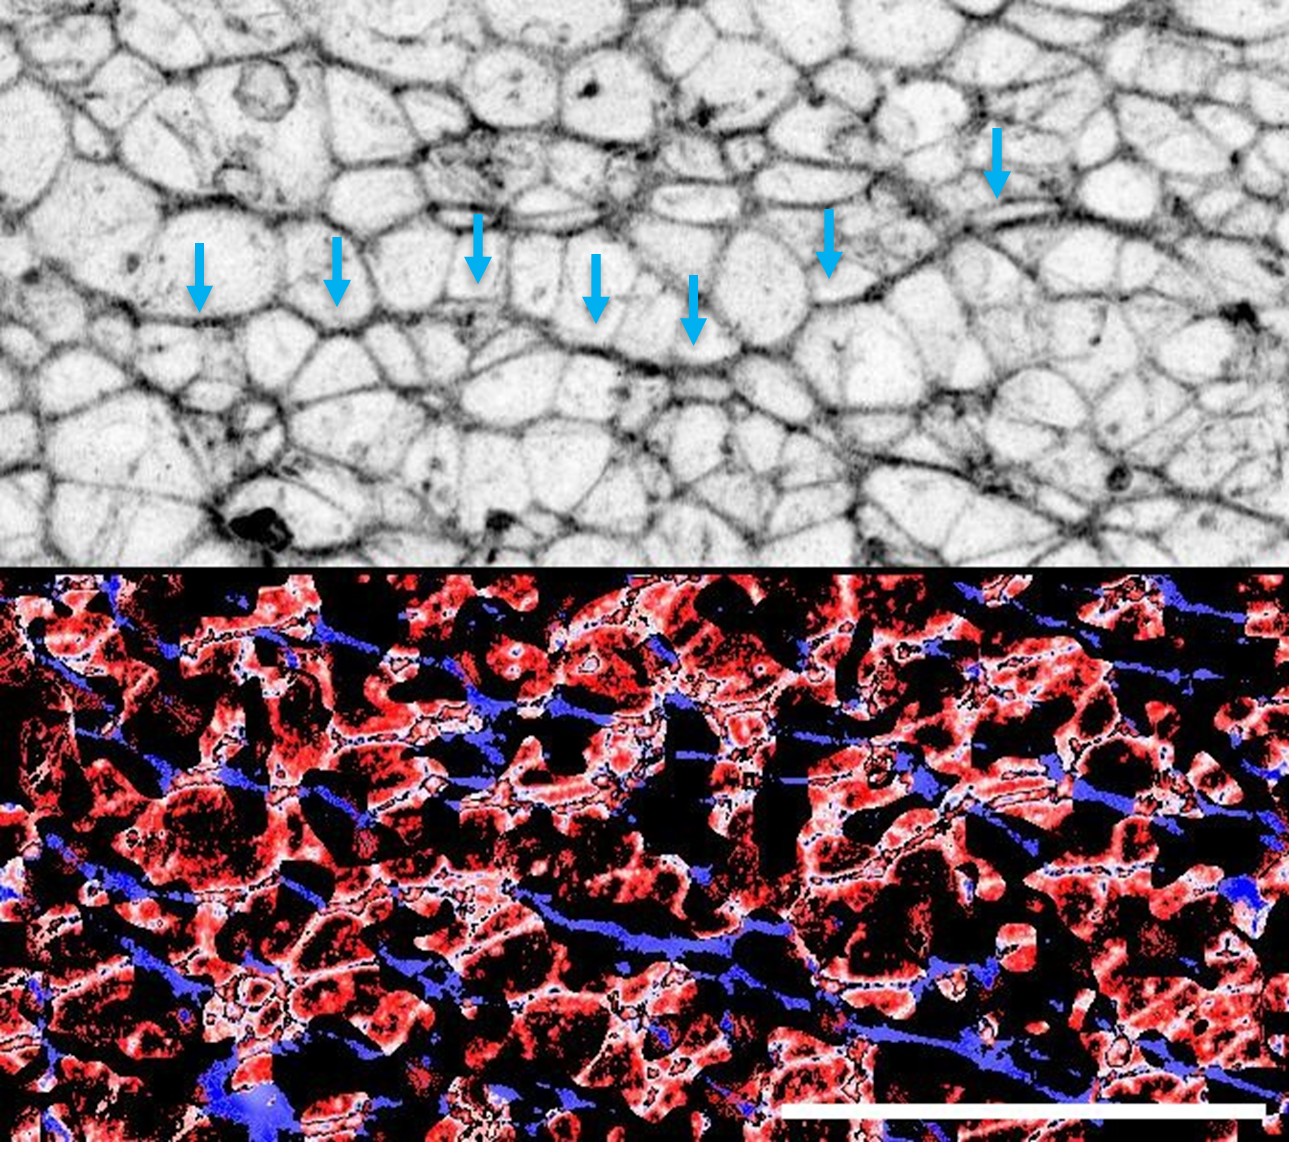
We propose to compare the length of F-actin cables and coherency of their orientation at the start and end of neuroepithelial differentiation, and in wild-type versus VANGL2mutant epithelia.
Description of the revisions that have already been incorporated in the transferred manuscript
Reviewer #1:
Major points
(1) It is mentioned throughout the manuscript that 3 plates were evaluated per line. I believe these are independently differentiated plates. This detail is critical concerning rigor and reproducibility. This should be clearly stated in the Methods section and in the first description of the experimental system in the Results section for Figure 1.
These experimental details have now been clarified. Unless otherwise stated, all findings were confirmed in three independently differentiated plates from the same line or at least one differentiation from each of three lines.
Methods: Unless otherwise stated, for each iPSC line three independently differentiated plates were generated and analysed, with each plate representing a separate differentiation experiment performed on different days.
(2) For the patient-specific lines - how many lines were derived per patient?
This has now been clarified in the methods. Microfluidic reprogramming of a small number of amniocytes produces one line per patient representing a pool of clones. Subcloning from individual cells would not be possible within the timeframe of a pregnancy.
Methods: For patient-specific iPSC lines, one independent iPSC line was obtained per patient following microfluidic mmRNA reprogramming.
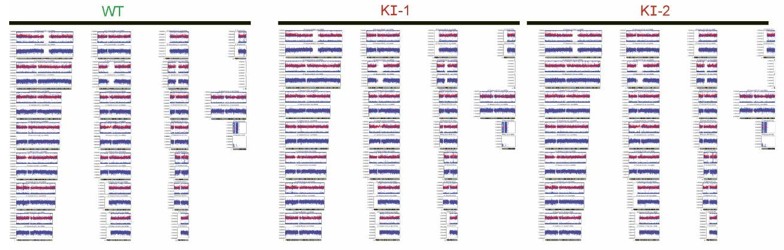
(3) Was the Vangl2 variant introduced by prime editing? Base editing? The details of the methods are sparse.
We have now expanded these details:
Methods: “VANGL2 knock-in lines were generated using CRSIPR-Cas9 homology directed repair editing by Synthego (SO-9291367-1). The guide sequence was AUGAGCGAAGGGUGCGCAAG and the donor sequence was CAATGAGTACTACTATGAGGAGGCTGAGCATGAGCGAAGGGTGTGCAAGAGGAGGGCCAGGTGGGTCCCTGGGGGAGAAGAGGAGAG.
Sequence modification was confirmed by Sanger sequencing before delivery of the modified clones, and Sanger sequencing was repeated after expansion of the lines (Supplementary Figure 5) as well as SNP arrays (Illumina iScan, not shown) confirming genomic stability.”
Author response image 2.
Snapshot of Illumina iScan SNP array showing absence of chromosomal duplications or deletions in the CRISPR-modified VANGL2-knockin lines or their congenic control.
(4) Suggested text changes.
Some additional suggestions for improvement.
The abstract could be more clearly written to effectively convey the study's importance. Here are some suggestions
Line 26: Insert "apicobasal" before "elongation" - the way it is written, I initially interpreted it as anterior-posterior elongation.
Line 29: Please specify that the lines refer to 3 different established parent iPSC lines with distinct origins and established using different reprogramming methods, plus 2 control patient-derived lines. - The reproducibility of the cell behaviors is impressive, but this is not captured in the abstract.
Line 32: add that this mutation was introduced by CRISPR-Cas9 base/prime editing.
The last sentence of the abstract states that the study only links apical constriction to human NTDs, but also reveals that neural differentiation and apical-basal elongation were found. The introduction could also use some editing.
Line 71: insert "that pulls actin filaments together" after "power strokes" Line 73: "apically localized," do you mean "mediolaterally" or "radially"?
Line 75: Can you specify that PCP components promote "mediolaterally orientated" apical constriction Lines 127: Specify that NE functions include apical basal elongation and neurodifferentiation are disrupted in patient-derived models
All have now been corrected.
Reviewer #2:
Major comments:
(1) Figure 1. The authors use F-actin to segment cell areas. Perhaps this could be done more accurately with ZO-1, as F-actin cables can cross the surface of a single cell. In any case, the authors need to show a measure of segmentation precision: segmented image vs. raw image plus a nuclear marker (DAPI, H2B-GFP), so we can check that the number of segmented cells matches the number of nuclei.
We used ZO-1 to quantify apical areas of the VANGL2-konckin lines in Figure 3. Segmentation of neuroepithelial apical areas based on F-actin staining is commonplace in the field (e.g. in the Brooks et al 2022 paper cited by another reviewer), and is generally robust because the cell junctions are much brighter than any apical fibres not associated with the apical cortex. However, we accept that at earlier stages of differentiation there may be more apical fibres when cells are cuboidal. We have therefore repeated our analysis of apical area using ZO-1 staining as suggested, analysing a more temporally-detailed time course in one iPSC line. This new analysis confirms our finding of lack of apical area change between days 2-4 of differentiation, then progressive reduction of apical area between days 4-8, further validating our system. Including nuclear images is not helpful because of the high nuclear index of pseudostratified epithelia (e.g. see Supplementary Figure 7) which means that nuclei overlap along the apicobasal axis. Individual nuclei cannot be related to their apical surface in projected images.
(3) Figure 2d. The laser ablation experiment in the presence of ROCK inhibitor is clear, as I can easily see the cell outlines before and after the experiment. In the absence of ROCK inhibitor, the cell edges are blurry, and I am not convinced the outline that the authors drew is really the cell boundary. Perhaps the authors can try to ablate a larger cell patch so that the change in area is more defined.
The outlines on these images are not intended to show cell boundaries, but rather link landmarks visible at both timepoints to calculate cluster (not cell) change in area. This is as previously shown in Galea et al Nat Commun 2021 and Butler et al J Cell Sci 2019. We have now amended the visualisation of retraction to make representation of differences between conditions more intuitive.
(4) Figure 2d. Do the cells become thicker after recoil?
This is unlikely because the ablated surface remains in the focal plane. Unfortunately, we are unable to image perpendicularly to the direction of ablation to test whether their apical surface moves in Z even by a very small amount. This has now been clarified in the results:
Results: “The ablated surface remained within the focal plane after ablation, indicating minimal movement along the apical-basal axis.”
(6) Lines 403-415. The authors report poor neural induction and neuronal differentiation in GOSB2. As far as I understand, this phenotype does not represent the in vivo situation. Thus, it is not clear to what extent the in vitro 2D model describes the human patient.
The GOSB2 iPSC line we describe does represent the in vivo situation in Med24 knockout mouse embryos, but is clearly less severe because we are still able to detect MED24 protein expressed in this line. We do not have detailed clinical data of the patient from which this line was obtained to determine whether their neurological development is normal. However, it is well established that some individuals who have spina bifida also have abnormalities in supratentorial brain development. It is therefore likely that abnormalities in neuron differentiation/maturation are concomitant with spina bifida. Our findings in the GOSB2 line complement earlier studies which also identified deficiencies in the ability of patient-derived lines to form neurons, but were unable to functionally assess neuroepithelial cell behaviours we studied. This has now been clarified in the discussion:
Discussion: “Neuroepithelial cells of the GOSB2 line described here, which has partial loss of MED24, similarly produces a thinner neuroepithelium with larger apical areas. Although apical areas were not analysed in mouse models of Med24 deletion, these embryos also have shorter and non-pseudostratified neuroepithelium.
Our GOSB2 line – which retains readily detectable MED24 protein – is clearly less severe than the mouse global knockout, and the clinical features of the patient from which this line was derived are milder than the phenotype of Med24 knockout embryos[68].
Mouse embryos lacking one of Med24’s interaction partners in the mediator complex, Med1, also have thinner neuroepithelium and diminished neuronal differentiation but successfully close their neural tube[85].”
(7) The experimental feat to derive cell lines from amniotic fluid and to perform experiments before birth is, in my view, heroic. However, I do not feel I learned much from the in vitro assays. There are many genetic changes that may cause the in vivo phenotype in the patient. The authors focus on MED24, but there is not enough convincing evidence that this is the key gene. I would like to suggest overexpression of MED24 as a rescue experiment, but I am not sure this is a single-gene phenotype. In addition, the fact that one patient line does not differentiate properly leads me to think that the patient lines do not strengthen the manuscript, and that perhaps additional clean mutations might contribute more.
We appreciate the reviewer’s praise of our personalised medicine approach and fully agree that neural tube defects are rarely monogenic. The patient lines we studied were not intended to provide mechanistic insight, but rather to demonstrate the future applicability of our approach to patient care. Our vision is that every patient referred for fetal surgery of spina bifida will have amniocytes (collected as part of routine cystocentesis required before surgery) reprogrammed and differentiated into neuroepithelial cells, then neural progenitors, to help stratify their postnatal care. One could also picture these cells becoming an autologous source for future cellbased therapies if they pass our reproducible analysis pipeline as functional quality control. This has now been clarified in the discussion:
Discussion: “The multi-genic nature of neural tube defect susceptibility, compounded by uncontrolled environmental risk factors (including maternal age and parity[102]), mean that patient-derived iPSC models are unlikely to provide mechanistic insight. They do provide personalised disease models which we anticipate will enable functional validation of genetic diagnoses for patients and their parents’ recurrence risk in future pregnancies, and may eventually stratify patients’ postnatal care. We also envision this model will enable quality control of patient-derived cells intended for future autologous cell replacement therapies, as is being developed in post-natal spinal cord injury[103]. Thus, the highly reproducible modelling platform we evaluate – which is robust to differences in iPSC reprogramming method, sex and ethnicity – represents a valuable tool for future mechanistic insights and personalised disease modelling applications.”
Significance:
In addition, the model was unsuccessful in one of the two patient-derived lines, which limits generalizability and weakens claims of patient-specific predictive value.
We disagree with the reviewer that “the model was unsuccessful in one of the two patientderived lines”. The GOSB1 line demonstrated deficiency of neuron differentiation independently of neuroepithelial biomechanical function, whereas the GOSB2 line showed earlier failure of neuroepithelial function. We also do not, at this stage, make patient-specific predictive claims: this will require longer-term matching of cell model findings with patient phenotypes over the next 5-10 years.
Reviewer #3:
Major comments
(1) One of my few concerns with this work is that the relative constriction of the apical surface with respect to the basal surface is not directly quantified for any of the experiments. This worry is slightly compounded by the 3D reconstructions Figure 1h, and the observation that overall cell volume is reduced and cell height increased simultaneously to area loss. Additionally, the net impact of apical constriction in tissues in vivo is to create local or global curvature change, but all the images in the paper suggest that the differentiated neural tissues are an uncurved monolayer even missing local buckles. I understand that these cells are grown on flat adherent surfaces limiting global curvature change, but is there evidence of localized buckling in the monolayer? While I believe-along with the authors-that their phenotypes are likely failures in apical constriction, I think they should work to strengthen this conclusion. I think the easiest way (and hopefully using data they already have) would be to directly compare apical area to basal area on a cell wise basis for some number of cells. Given the heterogeneity of cells, perhaps 30-50 cells per condition/line/mutant would be good? I am open to other approaches; this just seems like it may not require additional experiments.
As the reviewer observes, our cultures cannot bend because they are adhered on a rigid surface. The apical and basal lengths of the cultures will therefore necessarily be roughly equal in length. Some inwards bending of the epithelium is expected at the edges of the dish, but these cannot be imaged. The live imaging we show in Figure 2 illustrates that, just as happens in vivo, apical constriction is asynchronous. This means not all cells will have ‘bottle’ shapes in the same culture. We now illustrate the evolution of these shapes in more detail in Supplementary Figure 1.
Additionally, the reviewer’s comment motivated us to investigate local buckles in the apical surface of our cultures when their apical surfaces are dilated by ROCK inhibition. We hypothesised that the very straight apical surface in normal cultures is achieved by a balance of apical cell size and tension with pressure differences at the cell-liquid interface. Consistent with our expectation, the apical surface of ROCK-inhibited cultures becomes wrinkled (Supplementary figure 4). The VANGL2-KI lines do not develop this tortuous apical surface (as shown in Figure 3), which is to be expected given their modification is present throughout differentiation unlike the acute dilation caused by ROCK inhibition.
This new data complements our visualisation of apical constriction in live imaging, apical accumulation of phospho-myosin, and quantification of ROCK-dependent apical tension as independent lines of evidence that our cultures undergo apical constriction.
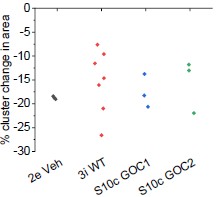
(2) Another slight experimental concern I have regards the difference in laser ablation experiments detailed in Figure 3h-i from those of Figure 2d-e. It seems like WT recoil values in 3h-I are more variable and of a lower average than the earlier experiments and given that it appears significance is reached mainly by impact of the lower values, can the authors explain if this variability is expected to be due to heterogeneity in the tissue, i.e. some areas have higher local tension? If so, would that correspond with more local apical constriction?
There is no significant difference in recoil between the control lines in Figures 2 and 3, albeit the data in Figure 3 is more variable (necessitating more replicates: none were excluded). We also showed laser ablation recoil data in Supplementary Figure 10, in which we did identify a graphing error (now corrected, also no significant difference in recoil from the other control groups as shown in Author response image 3).
Author response image 3.
Recoil following laser ablation is not significantly different between different experiments. X axis labels indicate the figure panel each set of ablation data is shown in. Points represent an independent differentiation dish.
(4)(Minor) I think some of the commentary on the strengths and limitations of the model found in the Results section should be collated and moved to the discussion in a single paragraph. For example, this could also briefly touch on/compare to some of the other models utilizing hiPSCs (These are mentioned briefly in the intro, but this comparison could be elaborated on a bit after seeing all the great data in this work).
These changes have now been made:
Discussion: “Some of these limitations, potentially including inclusion of environmental risk factors, can be addressed by using alternative iPSC-derived models[93,94]. For example, if patients have suspected causative mutations in genes specific to the surface (non-neural) ectoderm, such as GRHL2/3, 3D models described by Karzbrun et al[49] or Huang et al[95] may be informative. Characterisation of surface ectoderm behaviours in those models is currently lacking. These models are particularly useful for high-throughput screens of induced mutations[95], but their reproducibility between cell lines, necessary to compare patient samples to non-congenic controls, remains to be validated. Spinal cell identities can be generated in human spinal cord organoids, although these have highly variable morphologies[96,97]. As such, each iPSC model presents limitations and opportunities, to which this study contributes a reductionist and highly reproducible system in which to quantitatively compare multiple neuroepithelial functions.”
(5) While the authors are generally good about labeling figures by the day post smad inhibition, in some figures it is not clear either from the images or the legend text. I believe this includes supplemental figures 2,5,6,8, and 10 (apologies if I simply missed it in one or more of them)
These have now been added.
(6) The legend for Figure 2 refers to a panel that is not present and the remaining panel descriptions are off by a letter. I'm guessing this is a versioning error as the text itself seems largely correct, but it may be good to check for any other similar errors that snuck in
This has now been corrected.
(7) The cell outlines in Figure 3d are a bit hard to see both in print and on the screen, perhaps increase the displayed intensity?
This has now been corrected.
Description of analyses that authors prefer not to carry out
R2.5. Figure 3. The authors mention their previous study in which they show that Vangl2 is not cell-autonomously required for neural closure. It will be interesting to study whether this also the case in the present human model by using mosaic cultures.
The reviewer is correct that this is one of the exciting potential future applications of our model, which will first require us to generate stable fluorescently-tagged lines (to identify those cells which lack VANGL2). We will also need to extensively analyze controls to validate that mixing fluo-tagged and untagged lines does not alter the homogeneity of differentiation, or apical constriction, independently of VANGL2 deletion. As such, the reviewer is suggesting an altogether new project which carries considerable risk and will require us to secure dedicated funding to undertake.
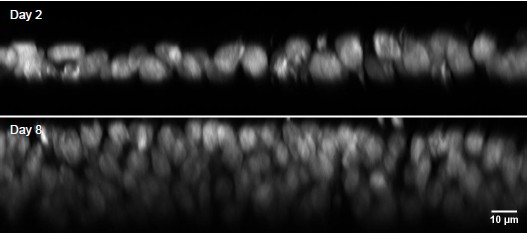
R3.8(Minor) The authors show a fascinating piece of data in Supplementary Figure 1, demonstrating that nuclear volume is halved by day 8. Do they have any indication if the DNA content remains constant (e.g., integrated DAPI density)? I suppose it must, and this is a minor point in the grand scheme, but this represents a significant nuclear remodeling and may impact the overall DNA accessibility.
We agree with the reviewer that the reduction in nuclear volume is important data both because it informs understanding of the reduction in total cell volume, and because it suggests active chromatin compaction during differentiation. Unfortunately, the thicker epithelium and superimposition of nuclei in the differentiated condition means the laser light path is substantially different, making direct comparisons of intensity uninterpretable. Additionally, the apical-most nuclei will mostly be in G2/M phase due to interkinetic nuclear migration. As such, the comparison of DAPI integrated density between epithelial morphologies would not be informative (Author response image 4).
Author response image 4.
Lateral views of DAPI-stained nuclei on Days 2 and 8 of differentiation. Note the rapid loss of staining intensity below the apical pseudo-row of nuclei on Day 8. This intensity change is likely due to the apical nuclei being in G2/M phase and therefore having more DNA, and rapid loss of 405nm wavelength signal at depth.