Peer review process
Revised: This Reviewed Preprint has been revised by the authors in response to the previous round of peer review; the eLife assessment and the public reviews have been updated where necessary by the editors and peer reviewers.
Read more about eLife’s peer review process.Editors
- Reviewing EditorInna SlutskyTel Aviv University, Tel Aviv, Israel
- Senior EditorJohn HuguenardStanford University School of Medicine, Stanford, United States of America
Reviewer #1 (Public Review):
Summary:
Chartampila et al. describe the effect of early-life choline supplementation on cognitive functions and epileptic activity in a mouse model of Alzheimer's disease. The cognitive abilities were assessed by the novel object recognition test and the novel object location test, performed in the same cohort of mice at 3 months and 6 months of age. Neuronal loss was tested using NeuN immunoreactivity, and neuronal hyperexcitability was examined using FosB and video-EEG recordings, providing multi-level correlations between these different parameters.
Strengths:
The study was designed as a 6-month follow-up, with repeated behavioral and EEG measurements through disease development and multilevel correlations providing valuable and interesting findings on AD progression and the effect of early-life choline supplementation. Moreover, the behavioral data that suggest an adverse effect of low choline in WT mice are interesting and important also beyond the context of AD, highlighting the dramatic effect of diet on the phenotypes of animal models.
Weaknesses:
The readability could be improved.
Author response:
The following is the authors’ response to the original reviews.
Reviewer #1 (Public Review):
Strengths:
The study was designed as a 6-month follow-up, with repeated behavioral and EEG measurements through disease development, providing valuable and interesting findings on AD progression and the effect of early-life choline supplantation. Moreover, the behavioral data that suggest an adverse effect of low choline in WT mice are interesting and important beyond the context of AD.
Thank you for identifying several strengths.
Weaknesses:
(1) The multiple headings and subheadings, focusing on the experimental method rather than the narrative, reduce the readability.
We have reduced the number of headings.
(2) Quantification of NeuN and FosB in WT littermates is needed to demonstrate rescue of neuronal death and hyperexcitability by high choline supplementation and also to gain further insights into the adverse effect of low choline on the performance of WT mice in the behavioral test.
We agree and have added WT data for the NeuN and ΔFosB analyses. These data are included in the text and figures. For NeuN, the Figure is Figure 6. For ΔFosB it is Figure 7. In brief, the high choline diet restored NeuN and ΔFosB to the levels of WT mice.
Below is Figure 6 and its legend to show the revised presentation of data for NeuN. Afterwards is the revised figure showing data for ΔFosB. After that are the sections of the Results that have been revised.
Author response image 1.
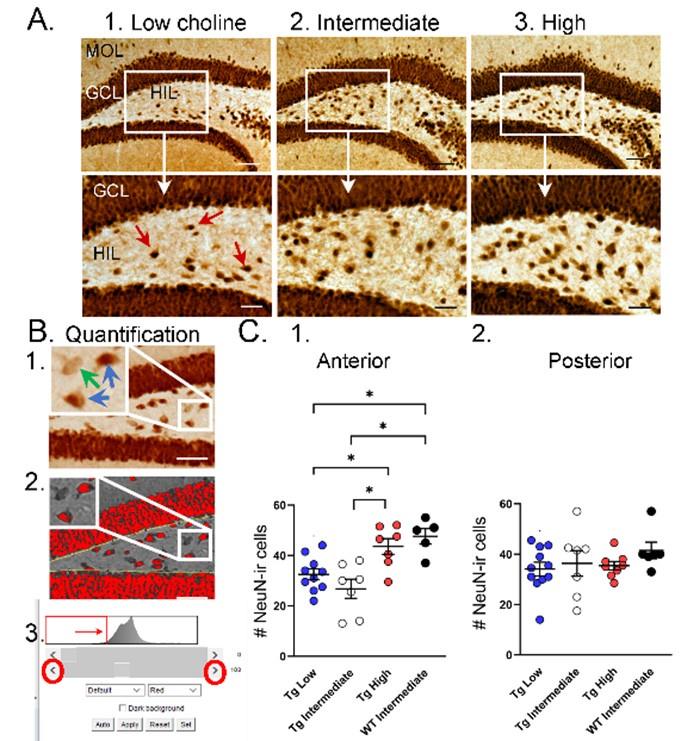
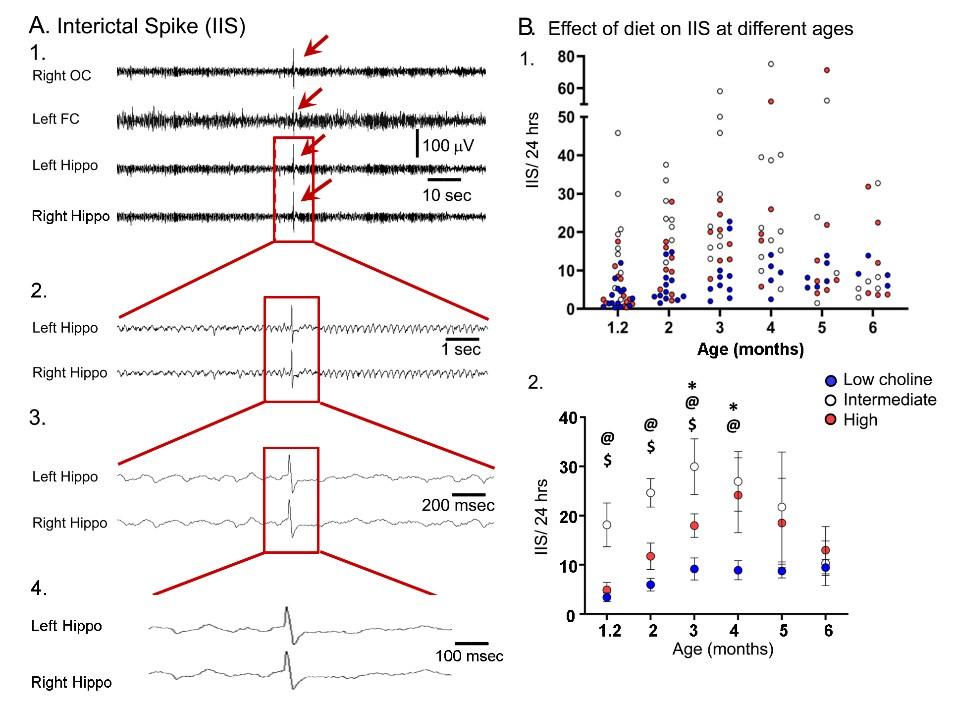
Choline supplementation improved NeuN immunoreactivity (ir) in hilar cells in Tg2576 animals. A. Representative images of NeuN-ir staining in the anterior DG of Tg2576 animals. (1) A section from a Tg2576 mouse fed the low choline diet. The area surrounded by a box is expanded below. Red arrows point to NeuN-ir hilar cells. Mol=molecular layer, GCL=granule cell layer, HIL=hilus. Calibration for the top row, 100 µm; for the bottom row, 50 µm. (2) A section from a Tg2576 mouse fed the intermediate diet. Same calibrations as for 1. (3) A section from a Tg2576 mouse fed the high choline diet. Same calibrations as for 1. B. Quantification methods. Representative images demonstrate the thresholding criteria used to quantify NeuN-ir. (1) A NeuN-stained section. The area surrounded by the white box is expanded in the inset (arrow) to show 3 hilar cells. The 2 NeuN-ir cells above threshold are marked by blue arrows. The 1 NeuN-ir cell below threshold is marked by a green arrow. (2) After converting the image to grayscale, the cells above threshold were designated as red. The inset shows that the two cells that were marked by blue arrows are red while the cell below threshold is not. (3) An example of the threshold menu from ImageJ showing the way the threshold was set. Sliders (red circles) were used to move the threshold to the left or right of the histogram of intensity values. The final position of the slider (red arrow) was positioned at the onset of the steep rise of the histogram. C. NeuN-ir in Tg2576 and WT mice. Tg2576 mice had either the low, intermediate, or high choline diet in early life. WT mice were fed the standard diet (intermediate choline). (1) Tg2576 mice treated with the high choline diet had significantly more hilar NeuN-ir cells in the anterior DG compared to Tg2576 mice that had been fed the low choline or intermediate diet. The values for Tg2576 mice that received the high choline diet were not significantly different from WT mice, suggesting that the high choline diet restored NeuN-ir. (2) There was no effect of diet or genotype in the posterior DG, probably because the low choline and intermediate diet did not appear to lower hilar NeuN-ir.
Author response image 2.
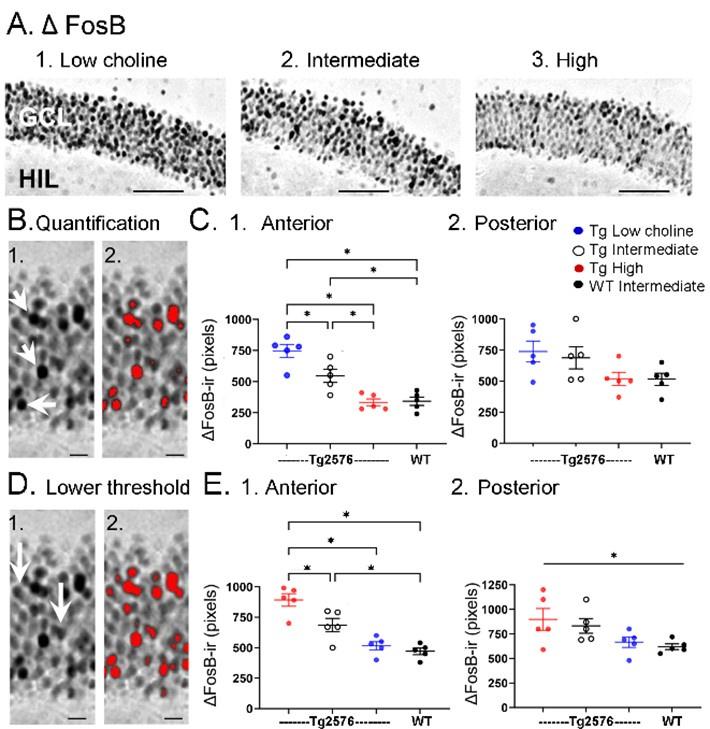
Choline supplementation reduced ∆FosB expression in dorsal GCs of Tg2576 mice. A. Representative images of ∆FosB staining in GCL of Tg2576 animals from each treatment group. (1) A section from a low choline-treated mouse shows robust ∆FosB-ir in the GCL. Calibration, 100 µm. Sections from intermediate (2) and high choline (3)-treated mice. Same calibration as 1. B. Quantification methods. Representative images demonstrating the thresholding criteria established to quantify ∆FosB. (1) A ∆FosB -stained section shows strongly-stained cells (white arrows). (2) A strict thresholding criteria was used to make only the darkest stained cells red. C. Use of the strict threshold to quantify ∆FosB-ir. (1) Anterior DG. Tg2576 mice treated with the choline supplemented diet had significantly less ∆FosB-ir compared to the Tg2576 mice fed the low or intermediate diets. Tg2576 mice fed the high choline diet were not significantly different from WT mice, suggesting a rescue of ∆FosB-ir. (2) There were no significant differences in ∆FosB-ir in posterior sections. D. Methods are shown using a threshold that was less strict. (1) Some of the stained cells that were included are not as dark as those used for the strict threshold (white arrows). (2) All cells above the less conservative threshold are shown in red. E. Use of the less strict threshold to quantify ∆FosB-ir. (1) Anterior DG. Tg2576 mice that were fed the high choline diet had less ΔFosB-ir pixels than the mice that were fed the other diets. There were no differences from WT mice, suggesting restoration of ∆FosB-ir by choline enrichment in early life. (2) Posterior DG. There were no significant differences between Tg2576 mice fed the 3 diets or WT mice.
Results, Section C1, starting on Line 691:
“To ask if the improvement in NeuN after MCS in Tg256 restored NeuN to WT levels we used WT mice. For this analysis we used a one-way ANOVA with 4 groups: Low choline Tg2576, Intermediate Tg2576, High choline Tg2576, and Intermediate WT (Figure 5C). Tukey-Kramer multiple comparisons tests were used as the post hoc tests. The WT mice were fed the intermediate diet because it is the standard mouse chow, and this group was intended to reflect normal mice. The results showed a significant group difference for anterior DG (F(3,25)=9.20; p=0.0003; Figure 5C1) but not posterior DG (F(3,28)=0.867; p=0.450; Figure 5C2). Regarding the anterior DG, there were more NeuN-ir cells in high choline-treated mice than both low choline (p=0.046) and intermediate choline-treated Tg2576 mice (p=0.003). WT mice had more NeuN-ir cells than Tg2576 mice fed the low (p=0.011) or intermediate diet (p=0.003). Tg2576 mice that were fed the high choline diet were not significantly different from WT (p=0.827).”
Results, Section C2, starting on Line 722:
“There was strong expression of ∆FosB in Tg2576 GCs in mice fed the low choline diet (Figure 7A1). The high choline diet and intermediate diet appeared to show less GCL ΔFosB-ir (Figure 7A2-3). A two-way ANOVA was conducted with the experimental group (Tg2576 low choline diet, Tg2576 intermediate choline diet, Tg2576 high choline diet, WT intermediate choline diet) and location (anterior or posterior) as main factors. There was a significant effect of group (F(3,32)=13.80, p=<0.0001) and location (F(1,32)=8.69, p=0.006). Tukey-Kramer post-hoc tests showed that Tg2576 mice fed the low choline diet had significantly greater ΔFosB-ir than Tg2576 mice fed the high choline diet (p=0.0005) and WT mice (p=0.0007). Tg2576 mice fed the low and intermediate diets were not significantly different (p=0.275). Tg2576 mice fed the high choline diet were not significantly different from WT (p>0.999). There were no differences between groups for the posterior DG (all p>0.05).”
“∆FosB quantification was repeated with a lower threshold to define ∆FosB-ir GCs (see Methods) and results were the same (Figure 7D). Two-way ANOVA showed a significant effect of group (F(3,32)=14.28, p< 0.0001) and location (F(1,32)=7.07, p=0.0122) for anterior DG but not posterior DG (Figure 7D). For anterior sections, Tukey-Kramer post hoc tests showed that low choline mice had greater ΔFosB-ir than high choline mice (p=0.0024) and WT mice (p=0.005) but not Tg2576 mice fed the intermediate diet (p=0.275); Figure 7D1). Mice fed the high choline diet were not significantly different from WT (p=0.993; Figure 7D1). These data suggest that high choline in the diet early in life can reduce neuronal activity of GCs in offspring later in life. In addition, low choline has an opposite effect, suggesting low choline in early life has adverse effects.”
(3) Quantification of the discrimination ratio of the novel object and novel location tests can facilitate the comparison between the different genotypes and diets.
We have added the discrimination index for novel object location to the paper. The data are in a new figure: Figure 3. In brief, the results for discrimination index are the same as the results done originally, based on the analysis of percent of time exploring the novel object.
Below is the new Figure and legend, followed by the new text in the Results.
Author response image 3.
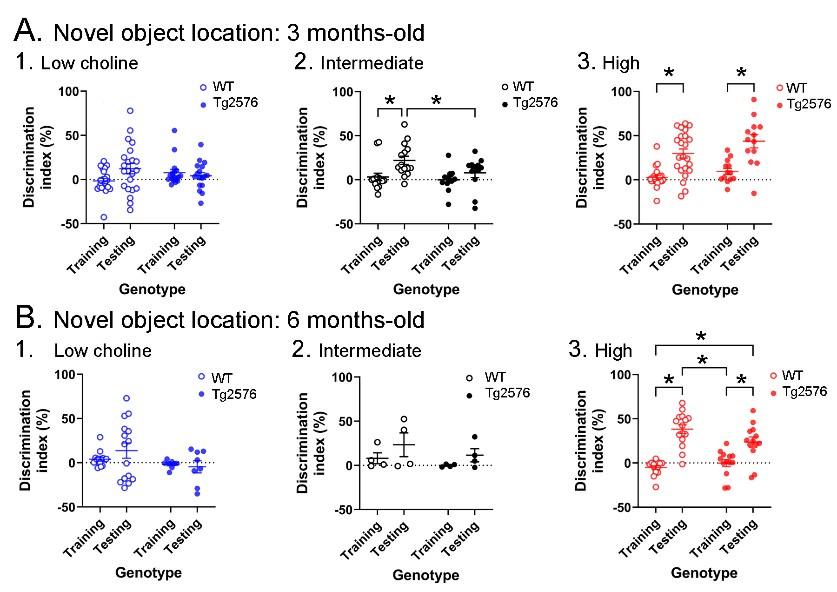
Novel object location results based on the discrimination index. A. Results are shown for the 3 months-old WT and Tg2576 mice based on the discrimination index. (1) Mice fed the low choline diet showed object location memory only in WT. (2) Mice fed the intermediate diet showed object location memory only in WT. (3) Mice fed the high choline diet showed memory both for WT and Tg2576 mice. Therefore, the high choline diet improved memory in Tg2576 mice. B. The results for the 6 months-old mice are shown. (1-2) There was no significant memory demonstrated by mice that were fed either the low or intermediate choline diet. (3) Mice fed a diet enriched in choline showed memory whether they were WT or Tg2576 mice. Therefore, choline enrichment improved memory in all mice.
Results, Section B1, starting on line 536:
“The discrimination indices are shown in Figure 3 and results led to the same conclusions as the analyses in Figure 2. For the 3 months-old mice (Figure 3A), the low choline group did not show the ability to perform the task for WT or Tg2576 mice. Thus, a two-way ANOVA showed no effect of genotype (F(1,74)=0.027, p=0.870) or task phase (F(1,74)=1.41, p=0.239). For the intermediate diet-treated mice, there was no effect of genotype (F(1,50)=0.3.52, p=0.067) but there was an effect of task phase (F(1,50)=8.33, p=0.006). WT mice showed a greater discrimination index during testing relative to training (p=0.019) but Tg2576 mice did not (p=0.664). Therefore, Tg2576 mice fed the intermediate diet were impaired. In contrast, high choline-treated mice performed well. There was a main effect of task phase (F(1,68)=39.61, p=<0.001) with WT (p<0.0001) and Tg2576 mice (p=0.0002) showing preference for the moved object in the test phase. Interestingly, there was a main effect of genotype (F(1,68)=4.50, p=0.038) because the discrimination index for WT training was significantly different from Tg2576 testing (p<0.0001) and Tg2576 training was significantly different from WT testing (p=0.0003).”
“The discrimination indices of 6 months-old mice led to the same conclusions as the results in Figure 2. There was no evidence of discrimination in low choline-treated mice by two-way ANOVA (no effect of genotype, (F(1,42)=3.25, p=0.079; no effect of task phase, F(1,42)=0.278, p=0.601). The same was true of mice fed the intermediate diet (genotype, F(1,12)=1.44, p=0.253; task phase, F(1,12)=2.64, p=0.130). However, both WT and Tg2576 mice performed well after being fed the high choline diet (effect of task phase, (F(1,52)=58.75, p=0.0001, but not genotype (F(1,52)=1.197, p=0.279). Tukey-Kramer post-hoc tests showed that both WT (p<0.0001) and Tg2576 mice that had received the high choline diet (p=0.0005) had elevated discrimination indices for the test session.”
(4) The longitudinal analyses enable the performance of multi-level correlations between the discrimination ratio in NOR and NOL, NeuN and Fos levels, multiple EEG parameters, and premature death. Such analysis can potentially identify biomarkers associated with AD progression. These can be interesting in different choline supplementation, but also in the standard choline diet.
We agree and added correlations to the paper in a new figure (Figure 9). Below is Figure 9 and its legend. Afterwards is the new Results section.
Author response image 4.
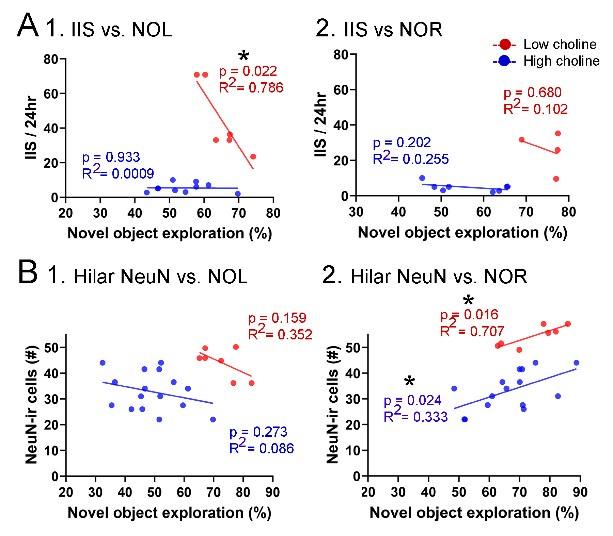
Correlations between IIS, Behavior, and hilar NeuN-ir. A. IIS frequency over 24 hrs is plotted against the preference for the novel object in the test phase of NOL. A greater preference is reflected by a greater percentage of time exploring the novel object. (1) The mice fed the high choline diet (red) showed greater preference for the novel object when IIS were low. These data suggest IIS impaired object location memory in the high choline-treated mice. The low choline-treated mice had very weak preference and very few IIS, potentially explaining the lack of correlation in these mice. (2) There were no significant correlations for IIS and NOR. However, there were only 4 mice for the high choline group, which is a limitation. B. IIS frequency over 24 hrs is plotted against the number of dorsal hilar cells expressing NeuN. The dorsal hilus was used because there was no effect of diet on the posterior hilus. (1) Hilar NeuN-ir is plotted against the preference for the novel object in the test phase of NOL. There were no significant correlations. (2) Hilar NeuN-ir was greater for mice that had better performance in NOR, both for the low choline (blue) and high choline (red) groups. These data support the idea that hilar cells contribute to object recognition (Kesner et al. 2015; Botterill et al. 2021; GoodSmith et al. 2022).
Results, Section F, starting on Line 801:
“F. Correlations between IIS and other measurements
As shown in Figure 9A, IIS were correlated to behavioral performance in some conditions. For these correlations, only mice that were fed the low and high choline diets were included because mice that were fed the intermediate diet did not have sufficient EEG recordings in the same mouse where behavior was studied. IIS frequency over 24 hrs was plotted against the preference for the novel object in the test phase (Figure 9A). For NOL, IIS were significantly less frequent when behavior was the best, but only for the high choline-treated mice (Pearson’s r, p=0.022). In the low choline group, behavioral performance was poor regardless of IIS frequency (Pearson’s r, p=0.933; Figure 9A1). For NOR, there were no significant correlations (low choliNe, p=0.202; high choline, p=0.680) but few mice were tested in the high choline-treated mice (Figure 9B2).
We also tested whether there were correlations between dorsal hilar NeuN-ir cell numbers and IIS frequency. In Figure 9B, IIS frequency over 24 hrs was plotted against the number of dorsal hilar cells expressing NeuN. The dorsal hilus was used because there was no effect of diet on the posterior hilus. For NOL, there was no significant correlation (low choline, p=0.273; high choline, p=0.159; Figure 9B1). However, for NOR, there were more NeuN-ir hilar cells when the behavioral performance was strongest (low choline, p=0.024; high choline, p=0.016; Figure 9B2). These data support prior studies showing that hilar cells, especially mossy cells (the majority of hilar neurons), contribute to object recognition (Botterill et al. 2021; GoodSmith et al. 2022).”
We also noted that all mice were not possible to include because they died or other reasons, such a a loss of the headset (Results, Section A, Lines 463-464): Some mice were not possible to include in all assays either because they died before reaching 6 months or for other reasons.
Reviewer #2 (Public Review):
Strengths:
The strength of the group was the ability to monitor the incidence of interictal spikes (IIS) over the course of 1.2-6 months in the Tg2576 Alzheimer's disease model, combined with meaningful behavioral and histological measures. The authors were able to demonstrate MCS had protective effects in Tg2576 mice, which was particularly convincing in the hippocampal novel object location task.
We thank the Reviewer for identifying several strengths.
Weaknesses:
Although choline deficiency was associated with impaired learning and elevated FosB expression, consistent with increased hyperexcitability, IIS was reduced with both low and high choline diets. Although not necessarily a weakness, it complicates the interpretation and requires further evaluation.
We agree and we revised the paper to address the evaluations that were suggested.
Reviewer #1 (Recommendations For The Authors):
(1) A reference directing to genotyping of Tg2576 mice is missing.
We apologize for the oversight and added that the mice were genotyped by the New York University Mouse Genotyping core facility.
Methods, Section A, Lines 210-211: “Genotypes were determined by the New York University Mouse Genotyping Core facility using a protocol to detect APP695.”
(2) Which software was used to track the mice in the behavioral tests?
We manually reviewed videos. This has been clarified in the revised manuscript. Methods, Section B4, Lines 268-270: Videos of the training and testing sessions were analyzed manually. A subset of data was analyzed by two independent blinded investigators and they were in agreement.
(3) Unexpectedly, a low choline diet in AD mice was associated with reduced frequency of interictal spikes yet increased mortality and spontaneous seizures. The authors attribute this to postictal suppression.
We did not intend to suggest that postictal depression was the only cause. It was a suggestion for one of many potential explanations why seizures would influence IIS frequency. For postictal depression, we suggested that postictal depression could transiently reduce IIS. We have clarified the text so this is clear (Discussion, starting on Line 960):
If mice were unhealthy, IIS might have been reduced due to impaired excitatory synaptic function. Another reason for reduced IIS is that the mice that had the low choline diet had seizures which interrupted REM sleep. Thus, seizures in Tg2576 mice typically started in sleep. Less REM sleep would reduce IIS because IIS occur primarily in REM. Also, seizures in the Tg2576 mice were followed by a depression of the EEG (postictal depression; Supplemental Figure 3) that would transiently reduce IIS. A different, radical explanation is that the intermediate diet promoted IIS rather than low choline reducing IIS. Instead of choline, a constituent of the intermediate diet may have promoted IIS.
However, reduced spike frequency is already evident at 5 weeks of age, a time point with a low occurrence of premature death. A more comprehensive analysis of EEG background activity may provide additional information if the epileptic activity is indeed reduced at this age.
We did not intend to suggest that premature death caused reduced spike frequency. We have clarified the paper accordingly. We agree that a more in-depth EEG analysis would be useful but is beyond the scope of the study.
(4) Supplementary Fig. 3 depicts far more spikes / 24 h compared to Fig. 7B (at least 100 spikes/24h in Supplementary Fig. 3 and less than 10 spikes/24h in Fig. 7B).
We would like to clarify that before and after a seizure the spike frequency is unusually high. Therefore, there are far more spikes than prior figures.
We clarified this issue by adding to the Supplemental Figure more data. The additional data are from mice without a seizure, showing their spikes are low in frequency.
All recordings lasted several days. We included the data from mice with a seizure on one of the days and mice without any seizures. For mice with a seizure, we graphed IIS frequency for the day before, the day of the seizure, and the day after. For mice without a seizure, IIS frequency is plotted for 3 consecutive days. When there was a seizure, the day before and after showed high numbers of spikes. When there was no seizure on any of the 3 days, spikes were infrequent on all days.
The revised figure and legend are shown below. It is Supplemental Figure 4 in the revised submission.
Author response image 5.
IIS frequency before and after seizures. A. Representative EEG traces recorded from electrodes implanted in the skull over the left frontal cortex, right occipital cortex, left hippocampus (Hippo) and right hippocampus during a spontaneous seizure in a 5 months-old Tg2576 mouse. Arrows point to the start (green arrow) and end of the seizure (red arrow), and postictal depression (blue arrow). B. IIS frequency was quantified from continuous video-EEG for mice that had a spontaneous seizure during the recording period and mice that did not. IIS frequency is plotted for 3 consecutive days, starting with the day before the seizure (designated as day 1), and ending with the day after the seizure (day 3). A two-way RMANOVA was conducted with the day and group (mice with or without a seizure) as main factors. There was a significant effect of day (F(2,4)=46.95, p=0.002) and group (seizure vs no seizure; F(1,2)=46.01, p=0.021) and an interaction of factors (F(2,4)=46.68, p=0.002)..Tukey-Kramer post-hoc tests showed that mice with a seizure had significantly greater IIS frequencies than mice without a seizure for every day (day 1, p=0.0005; day 2, p=0.0001; day 3, p=0.0014). For mice with a seizure, IIS frequency was higher on the day of the seizure than the day before (p=0.037) or after (p=0.010). For mice without a seizure, there were no significant differences in IIS frequency for day 1, 2, or 3. These data are similar to prior work showing that from one day to the next mice without seizures have similar IIS frequencies (Kam et al., 2016).
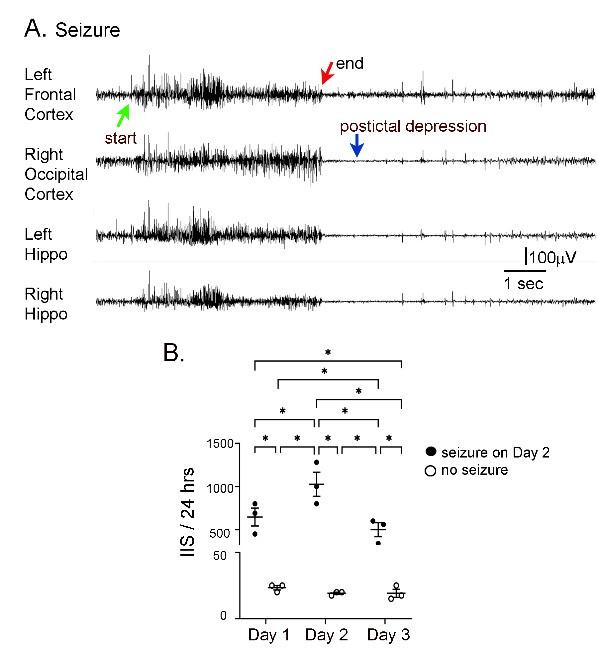
In the text, the revised section is in the Results, Section C, starting on Line 772:
“At 5-6 months, IIS frequencies were not significantly different in the mice fed the different diets (all p>0.05), probably because IIS frequency becomes increasingly variable with age (Kam et al. 2016). One source of variability is seizures, because there was a sharp increase in IIS during the day before and after a seizure (Supplemental Figure 4). Another reason that the diets failed to show differences was that the IIS frequency generally declined at 5-6 months. This can be appreciated in Figure 8B and Supplemental Figure 6B. These data are consistent with prior studies of Tg2576 mice where IIS increased from 1 to 3 months but then waxed and waned afterwards (Kam et al., 2016).”
(5) The data indicating the protective effect of high choline supplementation are valuable, yet some of the claims are not completely supported by the data, mainly as the analysis of littermate WT mice is not complete.
We added WT data to show that the high choline diet restored cell loss and ΔFosB expression to WT levels. These data strengthen the argument that the high choline diet was valuable. See the response to Reviewer #1, Public Review Point #2.
• Line 591: "The results suggest that choline enrichment protected hilar neurons from NeuN loss in Tg2576 mice." A comparison to NeuN expression in WT mice is needed to make this statement.
These data have been added. See the response to Reviewer #1, Public Review Point #2.
• Line 623: "These data suggest that high choline in the diet early in life can reduce hyperexcitability of GCs in offspring later in life. In addition, low choline has an opposite effect, again suggesting this maternal diet has adverse effects." Also here, FosB quantification in WT mice is needed.
These data have been added. See the response to Reviewer #1, Public Review Point #2.
(7) Was the effect of choline associated with reduced tauopathy or A levels?
The mice have no detectable hyperphosphorylated tau. The mice do have intracellular A before 6 months. This is especially the case in hilar neurons, but GCs have little (Criscuolo et al., eNeuro, 2023). However, in neurons that have reduced NeuN, we found previously that antibodies generally do not work well. We think it is because the neurons become pyknotic (Duffy et al., 2015), a condition associated with oxidative stress which causes antigens like NeuN to change conformation due to phosphorylation. Therefore, we did not conduct a comparison of hilar neurons across the different diets.
(8) Since the mice were tested at 3 months and 6 months, it would be interesting to see the behavioral difference per mouse and the correlation with EEG recording and immunohistological analyses.
We agree that would be valuable and this has been added to the paper. Please see response to Reviewer #1, Public Review Point #4.
Reviewer #2 (Recommendations For The Authors):
There were several areas that could be further improved, particularly in the areas of data analysis (particularly with images and supplemental figures), figure presentation, and mechanistic speculation.
Major points:
(1) It is understandable that, for the sake of labor and expense, WT mice were not implanted with EEG electrodes, particularly since previous work showed that WT mice have no IIS (Kam et al. 2016). However, from a standpoint of full factorial experimental design, there are several flaws - purists would argue are fatal flaws. First, the lack of WT groups creates underpowered and imbalanced groups, constraining statistical comparisons and likely reducing the significance of the results. Also, it is an assumption that diet does not influence IIS in WT mice. Secondly, with a within-subject experimental design (as described in Fig. 1A), 6-month-old mice are not naïve if they have previously been tested at 3 months. Such an experimental design may reduce effect size compared to non-naïve mice. These caveats should be included in the Discussion. It is likely that these caveats reduce effect size and that the actual statistical significance, were the experimental design perfect, would be higher overall.
We agree and have added these points to the Limitations section of the Discussion. Starting on Line 1050: In addition, groups were not exactly matched. Although WT mice do not have IIS, a WT group for each of the Tg2576 groups would have been useful. Instead, we included WT mice for the behavioral tasks and some of the anatomical assays. Related to this point is that several mice died during the long-term EEG monitoring of IIS.
(2) Since behavior, EEG, NeuN and FosB experiments seem to be done on every Tg2576 animal, it seems that there are missed opportunities to correlate behavior/EEG and histology on a per-mouse basis. For example, rather than speculate in the discussion, why not (for example) directly examine relationships between IIS/24 hours and FosB expression?
We addressed this point above in responding to Reviewer #1, Public Review Point #4.
(3) Methods of image quantification should be improved. Background subtraction should be considered in the analysis workflow (see Fig. 5C and Fig. 6C background). It would be helpful to have a Methods figure illustrating intermediate processing steps for both NeuN and FosB expression.
We added more information to improve the methods of quantification. We did use a background subtraction approach where ImageJ provides a histogram of intensity values, and it determines when there is a sharp rise in staining relative to background. That point is where we set threshold. We think it is a procedure that has the least subjectivity.
We added these methods to the Methods section and expanded the first figure about image quantification, Figure 6B. That figure and legend are shown above in response to Reviewer #1, Point #2.
This is the revised section of the Methods, Section C3, starting on Line 345:
“Photomicrographs were acquired using ImagePro Plus V7.0 (Media Cybernetics) and a digital camera (Model RET 2000R-F-CLR-12, Q-Imaging). NeuN and ∆FosB staining were quantified from micrographs using ImageJ (V1.44, National Institutes of Health). All images were first converted to grayscale and in each section, the hilus was traced, defined by zone 4 of Amaral (1978). A threshold was then calculated to identify the NeuN-stained cell bodies but not background. Then NeuN-stained cell bodies in the hilus were quantified manually. Note that the threshold was defined in ImageJ using the distribution of intensities in the micrograph. A threshold was then set using a slider in the histogram provided by Image J. The slider was pushed from the low level of staining (similar to background) to the location where staining intensity made a sharp rise, reflecting stained cells. Cells with labeling that was above threshold were counted.”
(4) This reviewer is surprised that the authors do not speculate more about ACh-related mechanisms. For example, choline deficiency would likely reduce Ach release, which could have the same effect on IIS as muscarinic antagonism (Kam et al. 2016), and could potentially explain the paradoxical effects of a low choline diet on reducing IIS. Some additional mechanistic speculation would be helpful in the Discussion.
We thank the Reviewer for noting this so we could add it to the Discussion. We had not because we were concerned about space limitations.
The Discussion has a new section starting on Line 1009:
“Choline and cholinergic neurons
There are many suggestions for the mechanisms that allow MCS to improve health of the offspring. One hypothesis that we are interested in is that MCS improves outcomes by reducing IIS. Reducing IIS would potentially reduce hyperactivity, which is significant because hyperactivity can increase release of A. IIS would also be likely to disrupt sleep since it represents aberrant synchronous activity over widespread brain regions. The disruption to sleep could impair memory consolidation, since it is a notable function of sleep (Graves et al. 2001; Poe et al. 2010). Sleep disruption also has other negative consequences such as impairing normal clearance of A (Nedergaard and Goldman 2020). In patients, IIS and similar events, IEDs, are correlated with memory impairment (Vossel et al. 2016).
How would choline supplementation in early life reduce IIS of the offspring? It may do so by making BFCNs more resilient. That is significant because BFCN abnormalities appear to cause IIS. Thus, the cholinergic antagonist atropine reduced IIS in vivo in Tg2576 mice. Selective silencing of BFCNs reduced IIS also. Atropine also reduced elevated synaptic activity of GCs in young Tg2576 mice in vitro. These studies are consistent with the idea that early in AD there is elevated cholinergic activity (DeKosky et al. 2002; Ikonomovic et al. 2003; Kelley et al. 2014; Mufson et al. 2015; Kelley et al. 2016), while later in life there is degeneration. Indeed, the chronic overactivity could cause the degeneration.
Why would MCS make BFCNs resilient? There are several possibilities that have been explored, based on genes upregulated by MCS. One attractive hypothesis is that neurotrophic support for BFCNs is retained after MCS but in aging and AD it declines (Gautier et al. 2023). The neurotrophins, notably nerve growth factor (NGF) and brain-derived neurotrophic factor (BDNF) support the health of BFCNs (Mufson et al. 2003; Niewiadomska et al. 2011).”
Minor points:
(1) The vendor is Dyets Inc., not Dyets.
Thank you. This correction has been made.
(2) Anesthesia chamber not specified (make, model, company).
We have added this information to the Methods, Section D1, starting on Line 375: The animals were anesthetized by isoflurane inhalation (3% isoflurane. 2% oxygen for induction) in a rectangular transparent plexiglas chamber (18 cm long x 10 cm wide x 8 cm high) made in-house.
(3) It is not clear whether software was used for the detection of behavior. Was position tracking software used or did blind observers individually score metrics?
We have added the information to the paper. Please see the response to Reviewer #1, Recommendations for Authors, Point #2.
(4) It is not clear why rat cages and not a true Open Field Maze were used for NOL and NOR.
We used mouse cages because in our experience that is what is ideal to detect impairments in Tg2576 mice at young ages. We think it is why we have been so successful in identifying NOL impairments in young mice. Before our work, most investigators thought behavior only became impaired later. We would like to add that, in our experience, an Open Field Maze is not the most common cage that is used.
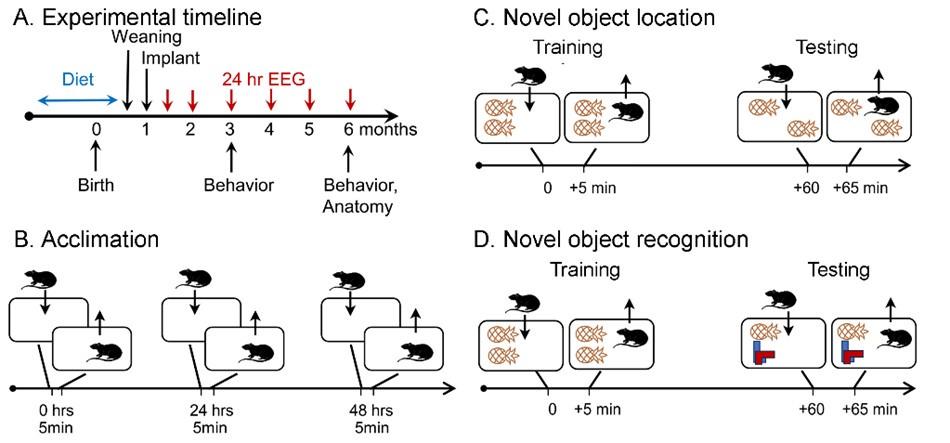
(5) Figure 1A is not mentioned.
It had been mentioned in the Introduction. Figure B-D was the first Figure mentioned in the Results so that is why it might have been missed. We now have added it to the first section of the Results, Line 457, so it is easier to find.
6) Although Fig 7 results are somewhat complicated compared to Fig. 5 and 6 results, EEG comes chronologically earlier than NeuN and FosB expression experiments.
We have kept the order as is because as the Reviewer said, the EEG is complex. For readability, we have kept the EEG results last.
(7) Though the statistical analysis involved parametric and nonparametric tests, It is not clear which normality tests were used.
We have added the name of the normality tests in the Methods, Section E, Line 443: Tests for normality (Shapiro-Wilk) and homogeneity of variance (Bartlett’s test) were used to determine if parametric statistics could be used. We also added after this sentence clarification: When data were not normal, non-parametric data were used. When there was significant heteroscedasticity of variance, data were log transformed. If log transformation did not resolve the heteroscedasticity, non-parametric statistics were used. Because we added correlations and analysis of survival curves, we also added the following (starting on Line 451): For correlations, Pearson’s r was calculated. To compare survival curves, a Log rank (Mantel-Cox) test was performed.
Figures:
(1) In Fig. 1A, Anatomy should be placed above the line.
We changed the figure so that the word “Anatomy” is now aligned, and the arrow that was angled is no longer needed.
In Fig. 1C and 1D, the objects seem to be moved into the cage, not the mice. This schematic does not accurately reflect the Fig. 1C and 1D figure legend text.
Thank you for the excellent point. The figure has been revised. We also updated it to show the objects more accurately.
Please correct the punctuation in the Fig. 1D legend.
Thank you for mentioning the errors. We corrected the legend.
For ease of understanding, Fig. 1C and 1D should have training and testing labeled in the figure.
Thank you for the suggestion. We have revised the figure as suggested.
Author response image 6.
(2) In Figure 2, error bars for population stats (bar graphs) are not obvious or missing. Same for Figure 3.
We added two supplemental figures to show error bars, because adding the error bars to the existing figures made the symbols, colors, connecting lines and error bars hard to distinguish. For novel object location (Fig. 2) the error bars are shown in Supp. Fig. 2. For novel object recognition, the error bars are shown in Supplemental Fig. 3.
(3) The authors should consider a Methods figure for quantification of NeuN and deltaFOSB (expansions of Fig. 5C and Fig. 6C).
Please see Reviewer #1, Public Review Point #2.
(4) In Figure 5, A should be omitted and mentioned in the Methods/figure legend. B should be enlarged. C should be inset, zoomed-in images of the hilus, with an accompanying analysis image showing a clear reduction in NeuN intensity in low choline conditions compared to intermediate and high choline conditions. In D, X axes could delineate conditions (figure legend and color unnecessary). Figure 5C should be moved to a Methods figure.
We thank the review for the excellent suggestions. We removed A as suggested. We expanded B and included insets. We used different images to show a more obvious reduction of cells for the low choline group. We expanded the Methods schematics. The revised figure is Figure 6 and shown above in response to Reviewer 1, Public Review Point #2.
(5) In Figure 6, A should be eliminated and mentioned in the Methods/figure legend. B should be greatly expanded with higher and lower thresholds shown on subsequent panels (3x3 design).
We removed A as suggested. We expanded B as suggested. The higher and lower thresholds are shown in C. The revised figure is Figure 7 and shown above in response to Reviewer 1, Public Review Point #2.
(6) In Figure 7, A2 should be expanded vertically. A3 should be expanded both vertically and horizontally. B 1 and 2 should be increased, particularly B1 where it is difficult to see symbols. Perhaps colored symbols offset/staggered per group so that the spread per group is clearer.
We added a panel (A4) to show an expansion of A2 and A3. However, we did not see that a vertical expansion would add information so we opted not to add that. We expanded B1 as suggested but opted not to expand B2 because we did not think it would enhance clarity. The revised figure is below.
Author response image 7.
(7) Supplemental Figure 1 could possibly be combined with Figure 1 (use rounded corner rat cage schematic for continuity).
We opted not to combine figures because it would make one extremely large figure. As a result, the parts of the figure would be small and difficult to see.
(8) Supplemental Figure 2 - there does not seem to be any statistical analysis associated with A mentioned in the Results text.
We added the statistical information. It is now Supplemental Figure 4:
Author response image 8.
Mortality was high in mice treated with the low choline diet. A. Survival curves are shown for mice fed the low choline diet and mice fed the high choline diet. The mice fed the high choline diet had a significantly less severe survival curve. B. Left: A photo of a mouse after sudden unexplained death. The mouse was found in a posture consistent with death during a convulsive seizure. The area surrounded by the red box is expanded below to show the outstretched hindlimb (red arrow). Right: A photo of a mouse that did not die suddenly. The area surrounded by the box is expanded below to show that the hindlimb is not outstretched.
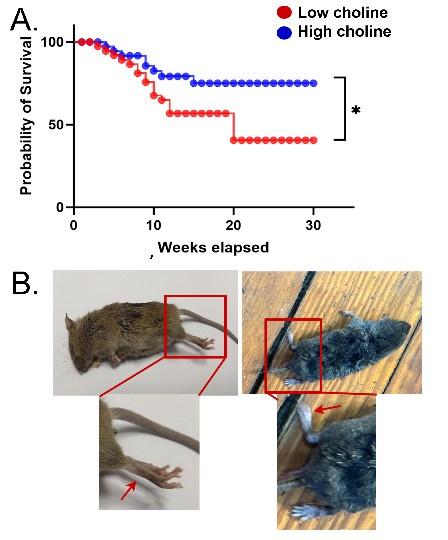
The revised text is in the Results, Section E, starting on Line 793:
“The reason that low choline-treated mice appeared to die in a seizure was that they were found in a specific posture in their cage which occurs when a severe seizure leads to death (Supplemental Figure 5). They were found in a prone posture with extended, rigid limbs (Supplemental Figure 5). Regardless of how the mice died, there was greater mortality in the low choline group compared to mice that had been fed the high choline diet (Log-rank (Mantel-Cox) test, Chi square 5.36, df 1, p=0.021; Supplemental Figure 5A).”
Also, why isn't intermediate choline also shown?
We do not have the data from the animals. Records of death were not kept, regrettably.
Perhaps labeling of male/female could also be done as part of this graph.
We agree this would be very interesting but do not have all sex information.
B is not very convincing, though it is understandable once one reads about posture.
We have clarified the text and figure, as well as the legend. They are above.
Are there additional animals that were seen to be in a specific posture?
There are many examples, and we added them to hopefully make it more convincing.
We also added posture in WT mice when there is a death to show how different it is.
Is there any relationship between seizures detected via EEG, as shown in Supplemental Figure 3, and death?
Several mice died during a convulsive seizure, which is the type of seizure that is shown in the Supplemental Figure.
(9) Supplemental Figure 3 seems to display an isolated case in which EEG-detected seizures correlate with increased IIEs. It is not clear whether there are additional documented cases of seizures that could be assembled into a meaningful population graph. If this data does not exist or is too much work to include in this manuscript, perhaps it can be saved for a future paper.
We have added other cases and revised the graph. This is now Supplemental Figure 4 and is shown above in response to Reviewer #1, Recommendation for Authors Point #4.
Frontal is misspelled.
We checked and our copy is not showing a misspelling. However, we are very grateful to the Reviewer for catching many errors and reading the manuscript carefully.
(10) Supplemental Figure 4 seems incomplete in that it does not include EEG data from months 4, 5, and 6 (see Fig. 7B).
We have added data for these ages to the Supplemental Figure (currently Supplemental Figure 6) as part B. In part A, which had been the original figure, only 1.2, 2, and 3 months-old mice were shown because there were insufficient numbers of each sex at other ages. However, by pooling 1.2 and 2 months (Supplemental Figure 6B1), 3 and 4 months (B2) and 5 and 6 months (B3) we could do the analysis of sex. The results are the same – we detected no sex differences.
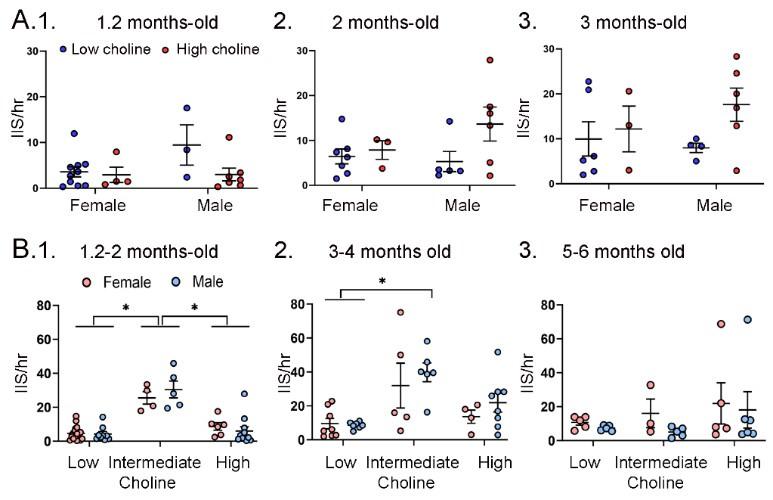
Author response image 9.
A. IIS frequency was similar for each sex. A. IIS frequency was compared for females and males at 1.2 months (1), 2 months (2), and 3 months (3). Two-way ANOVA was used to analyze the effects of sex and diet. Female and male Tg2576 mice were not significantly different. B. Mice were pooled at 1.2 and 2 months (1), 3 and 4 months (2) and 5 and 6 months (3). Two-way ANOVA analyzed the effects of sex and diet. There were significant effects of diet for (1) and (2) but not (3). There were no effects of sex at any age. (1) There were significant effects of diet (F(2,47)=46.21, p<0.0001) but not sex (F(1,47)=0.106, p=0.746). Female and male mice fed the low choline diet or high choline diet were significantly different from female and male mice fed the intermediate diet (all p<0.05, asterisk). (2) There were significant effects of diet (F(2,32)=10.82, p=0.0003) but not sex (F(1,32)=1.05, p=0.313). Both female and male mice of the low choline group were significantly different from male mice fed the intermediate diet (both p<0.05, asterisk) but no other pairwise comparisons were significant. (3) There were no significant differences (diet, F(2,23)=1.21, p=0.317); sex, F(1,23)=0.844, p=0.368).
The data are discussed the Results, Section G, tarting on Line 843:
In Supplemental Figure 6B we grouped mice at 1-2 months, 3-4 months and 5-6 months so that there were sufficient females and males to compare each diet. A two-way ANOVA with diet and sex as factors showed a significant effect of diet (F(2,47)=46.21; p<0.0001) at 1-2 months of age, but not sex (F1,47)=0.11, p=0.758). Post-hoc comparisons showed that the low choline group had fewer IIS than the intermediate group, and the same was true for the high choline-treated mice. Thus, female mice fed the low choline diet differed from the females (p<0.0001) and males (p<0.0001) fed the intermediate diet. Male mice that had received the low choline diet different from females (p<0.0001) and males (p<0.0001) fed the intermediate diet. Female mice fed the high choline diet different from females (p=0.002) and males (p<0.0001) fed the intermediate diet, and males fed the high choline diet difference from females (p<0.0001) and males (p<0.0001) fed the intermediate diet.
For the 3-4 months-old mice there was also a significant effect of diet (F(2,32)=10.82, p=0.0003) but not sex (F(1,32)=1.05, p=0.313). Post-hoc tests showed that low choline females were different from males fed the intermediate diet (p=0.007), and low choline males were also significantly different from males that had received the intermediate diet (p=0.006). There were no significant effects of diet (F(2,23)=1.21, p=0.317) or sex (F(1,23)=0.84, p=0.368) at 5-6 months of age.


