Peer review process
Revised: This Reviewed Preprint has been revised by the authors in response to the previous round of peer review; the eLife assessment and the public reviews have been updated where necessary by the editors and peer reviewers.
Read more about eLife’s peer review process.Editors
- Reviewing EditorNaoshige UchidaHarvard University, Cambridge, United States of America
- Senior EditorTirin MooreStanford University, Howard Hughes Medical Institute, Stanford, United States of America
Reviewer #1 (Public Review):
The paper submitted by Yogesh and Keller explores the role of cholinergic input from the basal forebrain (BF) in the mouse primary visual cortex (V1). The study aims to understand the signals conveyed by BF cholinergic axons in the visual cortex, their impact on neurons in different cortical layers, and their computational significance in cortical visual processing. The authors employed two-photon calcium imaging to directly monitor cholinergic input from BF axons expressing GCaMP6 in mice running through a virtual corridor, revealing a strong correlation between BF axonal activity and locomotion. This persistent activation during locomotion suggests that BF input provides a binary locomotion state signal. To elucidate the impact of cholinergic input on cortical activity, the authors conducted optogenetic and chemogenetic manipulations, with a specific focus on L2/3 and L5 neurons. They found that cholinergic input modulates the responses of L5 neurons to visual stimuli and visuomotor mismatch, while not significantly affecting L2/3 neurons. Moreover, the study demonstrates that BF cholinergic input leads to decorrelation in the activity patterns of L2/3 and L5 neurons.
This topic has garnered significant attention in the field, drawing the interest of many researchers actively investigating the role of BF cholinergic input in cortical activity and sensory processing. The experiments and analyses were thoughtfully designed and conducted with rigorous standards, providing evidence of layer-specific differences in the impact of cholinergic input on neuronal responses to bottom-up (visual stimuli) and top-down inputs (visuomotor mismatch).
Reviewer #2 (Public Review):
The manuscript investigates the function of basal forebrain cholinergic axons in mouse primary visual cortex (V1) during locomotion using two-photon calcium imaging in head-fixed mice. Cholinergic modulation has previously been proposed to mediate the effects of locomotion on V1 responses. The manuscript concludes that the activity of basal forebrain cholinergic axons in visual cortex provides a signal which is more correlated with binary locomotion state than locomotion velocity of the animal and finds no evidence for modulation of cholinergic axons by locomotion velocity. Cholinergic axons did not seem to respond to grating stimuli or visuomotor prediction error. Optogenetic stimulation of these axons increased the amplitude of responses to visual stimuli and decreased the response latency of layer 5 excitatory neurons, but not layer 2/3 neurons. Moreover, optogenetic or chemogenetic stimulation of cholinergic inputs reduced pairwise correlation of neuronal responses. These results provide insight into the role of cholinergic modulation to visual cortex and demonstrate that it affects different layers of visual cortex in a distinct manner. The experiments are well executed and the data appear to be of high quality. However, further analyses may be required to fully support some of the study's conclusions. Specifically, the analyses of the effects of locomotion and stimulation of cholinergic inputs present grand averages of responses across all neurons, and therefore may mask heterogeneity across layer 2/3 and layer 5 neurons.
Author response:
The following is the authors’ response to the previous reviews.
We thank you for the time you took to review our work and for your feedback!
The major changes to the manuscript are:
(1) We have added visual flow speed and locomotion velocity traces to Figure 5 as suggested.
(2) We have rephrased the abstract to more clearly indicate that our statement regarding acetylcholine enabling faster switching of internal representations in layer 5 is speculative.
(3) We have further clarified the positioning of our findings regarding the basal forebrain cholinergic signal in visual cortex in the introduction.
(4) We have added a video (Video S1) to illustrate different mouse running speeds covered by our data.
A detailed point-by-point response to all reviewer concerns is provided below.
Reviewer #1 (Recommendations For The Authors):
The authors have addressed most of the concerns raised in the initial review. While the paper has been improved, there are still some points of concern in the revised version.
Major comments
(1) Page 1, Line 21: The authors claim, "Our results suggest that acetylcholine augments the responsiveness of layer 5 neurons to inputs from outside of the local network, enabling faster switching between internal representations during locomotion." However, it is not clear which specific data or results support the claim of "switching between internal representations." ...
Authors' response: "... That acetylcholine enables a faster switching between internal representations in layer 5 is a speculation. We have attempted to make this clearer in the discussion. ..."
In the revised version, there is no new data added to directly support the claim - "Our results suggest acetylcholine ..., enabling faster switching between internal representations during locomotion" (in the abstract). The authors themselves acknowledge that this statement is speculative. The present data only demonstrate that ACh reduces the response latency of L5 neurons to visual stimuli, but not that ACh facilitates quicker transitions in neuronal responses from one visual stimulus to another. To maintain scientific rigor and clarity, I recommend the authors amend this sentence to more accurately reflect the findings.
This might be a semantic disagreement? We would argue both a gray screen and a grating are visual stimuli. Hence, we are not sure we understand what the reviewer means by “but not that ACh facilitates quicker transitions in neuronal responses from one visual stimulus to another”. We concur, our data only address one of many possible transitions, but it is a switch between distinct visual stimuli that is sped up by ACh. Nevertheless, we have rephrased the sentence in question by changing “our data suggest” to “based on this we speculate” - but are not sure whether this addresses the reviewer’s concern.
(2) Page 4, Line 103: "..., a direct measurement of the activity of cholinergic projection from basal forebrain to the visual cortex during locomotion has not been made." This statement is incorrect. An earlier study by Reimer et al. indeed imaged cholinergic axons in the visual cortex of mice running on a wheel.
Authors' response: "We have clarified this as suggested. However, we disagree slightly with the reviewer here. The key question is whether the cholinergic axons imaged originate in basal forebrain. While Reimer et al. 2016 did set out to do this, we believe a number of methodological considerations prevent this conclusion: ... Collins et al. 2023 inject more laterally and thus characterize cholinergic input to S1 and A1, ..."
The authors pointed out some methodological caveats in previous studies that measured the BF input in V1, and I agree with them on several points. Nonetheless, the statement that "a direct measurement of the activity of cholinergic projection from basal forebrain to visual cortex during locomotion has not been made. ... Prior measurements of the activity of cholinergic axons in visual cortex have all relied on data from a cross of ChAT-Cre mice with a reporter line ..." (Page 4, Line 103) seems to be an oversimplification. In fact, contrary to what the authors noted, Collins et al. (2023) conducted direct imaging of BF cholinergic axons in V1 (Fig. 1) - "Selected axon segments were chosen from putative retrosplenial, somatosensory, primary and secondary motor, and visual cortices". They used a viral approach to express GCaMP in BF axons to bypass the limitations associated with the use of a GCaMP reporter mouse line - "Viral injections were used for BF- ACh studies to avoid imaging axons or dendrites from cholinergic projections not arising from the BF (e.g. cortical cholinergic interneurons)." The authors should reconsider the text.
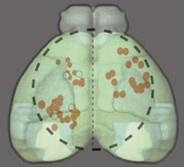
The reason we think that our statement here was – while simplified – accurate, is that Collins et al. do record from cholinergic axons in V1, but they don’t show these data (they only show pooled data across all recordings sites). By superimposing the recording locations of the Collins paper on the Allen mouse brain atlas (Figure R1), we estimate that of the approximately 50 recording sites, most are in somatosensory and somatomotor areas of cortex, and only 1 appears to be in V1, something that is often missed as it is not really highlighted in that paper. If this is indeed correct, we would argue that the data in the Collins et al. paper are not representative of cholinergic activity in visual cortex (we fear only the authors would know for sure). Nevertheless, we have rephrased again.
Author response image 1.
Overlay of the Collins et al. imaging sites (red dots, black outline and dashed circle) on the Allen mouse brain atlas (green shading). Very few (we estimate that it was only 1) of the recording sites appear to be in V1 (the lightest green area), and maybe an additional 4 appear to be in secondary visual areas.
Minor comments
(1) It is unclear which BF subregion(s) were targeted in this study.
Authors' response: Thanks for pointing this out. We targeted the entire basal forebrain (medial septum, vertical and horizontal limbs of the diagonal band, and nucleus basalis) with our viral injections. ... We have now added the labels for basal forebrain subregions targeted next to the injection coordinates in the manuscript.
The authors provided the coordinates for their virus injections targeting the BF subregions - "(AP, ML, DV (in mm): ... ; +0.6, +0.6, -4.9 (nucleus basalis) ..." Is this the right coordinates for the nucleus basalis?
Thank you for catching this - this was indeed incorrect. The coordinates were correct, but our annotation of brain region was not (as the reviewer correctly points out, these coordinates are in the horizontal limb of the diagonal band, not the nucleus basalis). We have corrected this.
Reviewer #2 (Recommendations For The Authors):
Thank you for addressing most of the points raised in my original review. I still some concerns relating to the analysis of the data.
(1) I appreciate the authors point that getting mice to reliably during head-fixed recordings can require training. Since mice in this study were not trained to run, their low speed of locomotion limits the interpretation of the results. I think this is an important potential caveat and I have retained it in the public review.
This might be a misunderstanding. The Jordan paper was a bit of an outlier in that we needed mice to run at very high rates due to fact that our recording times was only minutes. Mice were chosen such that they would more or less continuously run, to maximize the likelihood that they would run during the intracellular recordings. This was what we tried to convey in our previous response. The speed range covered by the analysis in this paper is 0 cm/s to 36 cm/s. 36 cm/s is not far away from the top speed mice can reach on this treadmill (30 cm/s is 1 revolution of the treadmill per second). In our data, the top speed we measured across all mice was 36 cm/s. In the Jordan paper, the peak running speed across the entire dataset was 44 cm/s. Based on the reviewer’s comment, we suspect that the reviewer may be under the impression that 30 cm/s is a relatively slow running speed. To illustrate what this looks like we have made added a video (Video S1) to illustrate different running speeds.
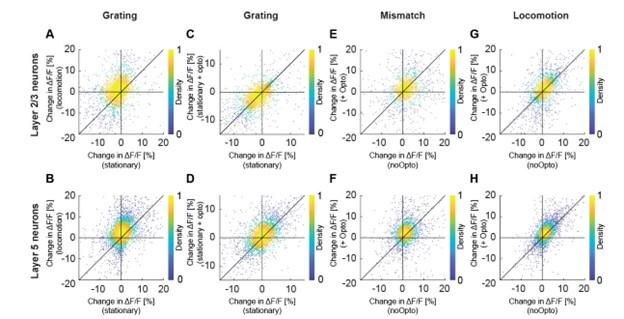
(2) The majority of the analyses in the revised manuscript focus on grand average responses, which may mask heterogeneity in the underlying neural populations. This could be addressed by analysing the magnitude and latency of responses for individual neurons. For example, if I understand correctly, the analyses include all neurons, whether or not they are activated, inhibited, or unaffected by visual stimulation and locomotion. For example, while on average layer 2/3 neurons are suppressed by the grating stimulus (Figure 4A), presumable a subset are activated. Evaluating the effects of optogenetic stimulation and locomotion without analyzing them at the level of individual neurons could result in misleading conclusions. This could be presented in the form of a scatter plot, depicting the magnitude of neuronal responses in locomotion vs stationary condition, and opto+ vs no opto conditions.
We might be misunderstanding. The first part of the comment is a bit too unspecific to address directly. In cases in which we find the variability is relevant to our conclusions, we do show this for individual cells (e.g.the latencies to running onset are shown as histograms for all cells and axons in Figure S1). It is also unclear to us what the reviewer means by “Evaluating the effects of optogenetic stimulation and locomotion without analyzing them at the level of individual neurons could result in misleading conclusions”. Our conclusions relate to the average responses in L2/3, consistent with the analysis shown. All data will be freely available for anyone to perform follow-up analysis of things we may have missed. E.g., the specific suggestion of presenting the data shown in Figure 4 as a scatter plot is shown below (Figure R2). This is something we had looked at but found not to be relevant to our conclusions. The problem with this analysis is that it is difficult to estimate how much the different sources of variability contribute to the total variability observed in the data, and no interesting pattern is clearly apparent. All relevant and clear conclusions are already captured by the mean differences shown in Figure 4.
Author response image 2.
Optogenetic activation of cholinergic axons in visual cortex primarily enhances responses of layer 5, but not layer 2/3 neurons. Related to Figure 4. (A) Average calcium response of layer 2/3 neurons in visual cortex to full field drifting grating in the absence or presence of locomotion. Each dot is the average calcium activity of an individual neuron during the two conditions. (B) As in A, but for layer 5 neurons. (C) As in A, but comparing the average response while the mice were stationary, to that while cholinergic axons were optogenetically stimulated. (D) As in C, but for layer 5 neurons. (E) Average calcium response of layer 2/3 neurons in visual cortex to visuomotor mismatch, without and with optogenetic stimulation of cholinergic axons in visual cortex. (F) As in E, but for layer 5 neurons. (G) Average calcium response of layer 2/3 neurons in visual cortex to locomotion onset in closed loop, without and with optogenetic stimulation of cholinergic axons in visual cortex. (H) As in G, but for layer 5 neurons.
(3) To help the reader understand the experimental conditions in open loop experiments, please include average visual flow speed traces for each condition in Figure 5.
We have added the locomotion velocity and visual flow speeds to the corresponding conditions in Figure


