Peer review process
Revised: This Reviewed Preprint has been revised by the authors in response to the previous round of peer review; the eLife assessment and the public reviews have been updated where necessary by the editors and peer reviewers.
Read more about eLife’s peer review process.Editors
- Reviewing EditorMarla FellerUniversity of California, Berkeley, Berkeley, United States of America
- Senior EditorPanayiota PoiraziFORTH Institute of Molecular Biology and Biotechnology, Heraklion, Greece
Reviewer #1 (Public review):
Summary
The authors previously published a study of RGC boutons in the dLGN in developing wild-type mice and developing mutant mice with disrupted spontaneous activity. In the current manuscript, they have broken down their analysis of RGC boutons according to the number of Homer/Bassoon puncta associated with each vGlut3 cluster.
The authors find that, in the first post-natal week, RGC boutons with multiple active zones (mAZs) are about a third as common as boutons with a single active zone (sAZ). The size of the vGluT2 cluster associated with each bouton was proportional to the number of active zones present in each bouton. Within the author's ability to estimate these values (n=3 per group, 95% of results expected to be within ~2.5 standard deviations), these results are consistent across groups: 1) dominant eye vs. non-dominant eye, 2) wild-type mice vs. mice with activity blocked, and at 3) ages P2, P4, and P8. The authors also found that mAZs and sAZs also have roughly the same number (about 1.5) of sAZs clustered around them (within 1.5 um).
However, the authors do not interpret this consistency between groups as evidence that active zone clustering is not a specific marker or driver of activity dependent synaptic segregation. Rather, the authors perform a large number of tests for statistical significance and cite the presence or absence of statistical significance as evidence that "Eye-specific active zone clustering underlies synaptic competition in the developing visual system (title)". I don't believe this conclusion is supported by the evidence.
Strengths
The source dataset is high resolution data showing the colocalization of multiple synaptic proteins across development. Added to this data is labeling that distinguishes axons from the right eye from axons from the left eye. The first order analysis of this data showing changes in synapse density and in the occurrence of multi-active zone synapses is useful information about the development of an important model for activity dependent synaptic remodeling.
Weaknesses
In my previous review I argued that it was not possible to determine, from their analysis, whether the differences they were reporting between groups was important to the biology of the system. The authors have made some changes to their statistics (paired t-tests) and use some less derived measures of clustering. However, they still fail to present a meaningfully quantitative argument that the observed group differences are important. The authors base most of their claims on small differences between groups. There are two big problems with this practice. First, the differences between groups appear too small to be biologically important. Second, the differences between groups that are used as evidence for how the biology works are generally smaller than the precision of the author's sampling. That is, the differences are as likely to be false positives as true positives.
(1) Effect size. The title claims: "Eye-specific active zone clustering underlies synaptic competition in the developing visual system". Such a claim might be supported if the authors found that mAZs are only found in dominant-eye RGCs and that eye-specific segregation doesn't begin until some threshold of mAZ frequency is reached. Instead, the behavior of mAZs is roughly the same across all conditions. For example, the clear trend in Figure 4C and D is that measures of clustering between mAZ and sAZ are as similar as could reasonably be expected by the experimental design. However, some of the comparisons of very similar values produced p-values < 0.05. The authors use this fact to argue that the negligible differences between mAZ and sAZs explain the development of the dramatic differences in the distribution of ipsilateral and contralateral RGCs.
(2) Sample size. Performing a large number of significance tests and comparing p-values is not hypothesis testing and is not descriptive science. At best, with large sample sizes and controls for multiple tests, this approach could be considered exploratory. With n=3 for each group, many comparisons of many derived measures, among many groups, and no control for multiple testing, this approach constitutes a random result generator.
The authors argue that n=3 is a large sample size for the type of high resolution / large volume data being used. It is true that many electron microscopy studies with n=1 are used to reveal the patterns of organization that are possible within an individual. However, such studies cannot control individual variation and are, therefore, not appropriate for identifying subtle differences between groups.
In response to previous critiques along these lines, the authors argue they have dealt with this issue by limiting their analysis to within-individual paired comparisons. There are several problems with their thinking in this approach. The main problem is that they did not change the logic of their arguments, only which direction they pointed the t-tests. Instead of claiming that two groups are different because p < 0.05, they say that two groups are different because one produced p < 0.05 and the other produced p > 0.05. These arguments are not statistically valid or biologically meaningful.
To the best of my understanding, the results are consistent with the following model:
• RGCs form mAZs at large boutons (known)
• About a quarter of week-one RGC boutons are mAZs (new observation)
• Vesicle clustering is proportional to active zone number (~new observation)
• RGC synapse density increases during the first post-week (known)
• Blocking activity reduces synapse density (known)
• Contralateral eye RGCs for more and larger synapses in the lateral dLGN (known)
• With n=3 and effect sizes smaller than 1 standard deviation, a statistically significant result is about as likely to be a false positive as a true positive.
• A true-positive statistically significant result does is not evidence of a meaningful deviation from a biological model.
Providing plots that show the number of active zones present in boutons across these various conditions is useful. However, I could find no compelling deviation from the above default predictions that would influence how I see the role of mAZs in activity dependent eye-specific segregation.
Below are critiques of most of the claims of the manuscript.
Claim (abstract): individual retinogeniculate boutons begin forming multiple nearby presynaptic active zones during the first postnatal week.
Confirmed by data.
Claim (abstract): the dominant-eye forms more numerous mAZ contacts,
Misleading: The dominant-eye (by definition) forms more contacts than the non-dominant eye. That includes mAZ.
Claim (abstract): At the height of competition, the non-dominant-eye projection adds many single active zone (sAZ) synapses
Weak: While the individual observation is strong, it is a surprising deviation based on a single n=3 experiment in a study that performed twelve such experiments (six ages, mutant/wildtype, sAZ/mAZ)
Claim (abstract): Together, these findings reveal eye-specific differences in release site addition during synaptic competition in circuits essential for visual perception and behavior.
False: This claim is unambiguously false. The above findings, even if true, do not argue for any functional significance to active zone clustering.
Claim (line 84): "At the peak of synaptic competition midway through the first postnatal week, the non-dominant-eye formed numerous sAZ inputs, equalizing the global synapse density between the two eyes"
Weak: At one of twelve measures (age, bouton type, genotype) performed with 3 mice each, one density measure was about twice as high as expected.
Claim (line 172): "In WT mice, both mAZ (Fig. 3A, left) and sAZ (Fig. 3B, left) inputs showed significant eye-specific volume differences at each age."
Questionable: There appears to be a trend, but the size and consistency is unclear.
Claim (line 175): "the median VGluT2 cluster volume in dominant-eye mAZ inputs was 3.72 fold larger than that of non-dominant-eye inputs (Fig. 3A, left)."
Cherry picking. Twelve differences were measured with an n of 3, 3 each time. The biggest difference of the group was cited. No analysis is provided for the range of uncertainty about this measure (2.5 standard deviations) as an individual sample or as one of twelve comparisons.
Claim (line 174): "In the middle of eye-specific competition at P4 in WT mice, the median VGluT2 cluster volume in dominant-eye mAZ inputs was 3.72 fold larger than that of non-dominant-eye inputs (Fig. 3A, left). In contrast, β2KO mice showed a smaller 1.1 fold difference at the same age (Fig. 3A, right panel). For sAZ synapses at P4, the magnitudes of eye-specific differences in VGluT2 volume were smaller: 1.35-fold in WT (Fig. 3B, left) and 0.41-fold in β2KO mice (Fig. 3B, right). Thus, both mAZ and sAZ input size favors the dominant eye, with larger eye-specific differences seen in WT mice (see Table S3)."
No way to judge the reliability of the analysis and trivial conclusion: To analyze effect size the authors choose the median value of three measures (whatever the middle value is). They then make four comparisons at the time point where they observed the biggest difference in favor of their hypothesis. There is no way to determine how much we should trust these numbers besides spending time with the mislabeled scatter plots. The authors then claim that this analysis provides evidence that there is a difference in vGluT2 cluster volume between dominant and non-dominant RGCs and that that difference is activity dependent. The conclusion that dominant axons have bigger boutons and that mutants that lack the property that would drive segregation would show less of a difference is very consistent with the literature. Moreover, there is no context provided about what 1.35 or 1.1 fold difference means for the biology of the system.
Claim (189): "This shows that vesicle docking at release sites favors the dominant-eye as we previously reported but is similar for like eye type inputs regardless of AZ number."
Contradicts core claim of manuscript: Consistent with previous literature, there is an activity dependent relative increase in vGlut2 clustering of dominant eye RGCs. The new information is that that activity dependence is more or less the same in sAZ and mAZ. The only plausible alternative is that vGlut2 scaling only increases in mAZ which would be consistent with the claims of their paper. That is not what they found. To the extent that the analysis presented in this manuscript tests a hypothesis, this is it. The claim of the title has been refuted by figure 3.
Claim (line 235): "For the non-dominant eye projection, however, clustered mAZ inputs outnumbered clustered sAZ inputs at P4 (Fig. 4C, bottom left panel), the age when this eye adds sAZ synapses (Fig. 2C)."
Misleading: The overwhelming trend across 24 comparisons is that the sAZ clustering looks like mAZ clustering. That is the objective and unambiguous result. Among these 24 underpowered tests (n=3), there were a few p-values < 0.05. The authors base their interpretation of cell behavior on these crossings.
Claim (line 328): "The failure to add synapses reduced synaptic clustering and more inputs formed in isolation in the mutants compared to controls."
Trivially true: Density was lower in mutant.
Claim (line 332): "While our findings support a role for spontaneous retinal activity in presynaptic release site addition and clustering..."
Not meaningfully supported by evidence: I could not find meaningful differences between WT and mutant beside the already known dramatic difference in synapse density.
Reviewer #2 (Public review):
Summary:
In this manuscript, Zhang and Speer examine changes in the spatial organization of synaptic proteins during eye specific segregation, a developmental period when axons from the two eyes initially mingle and gradually segregate into eye-specific regions of the dorsal lateral geniculate. The authors use STORM microscopy and immunostain presynaptic (VGluT2, Bassoon) and postsynaptic (Homer) proteins to identify synaptic release sites. Activity-dependent changes of this spatial organization are identified by comparing the β2KO mice to WT mice. They describe two types of synapses based on Bassoon clustering: the multiple active zone (mAZ) synapse and single active zone (sAZ) synapse. In this revision, the authors have added EM data to support the idea that mAZ synapses represent boutons with multiple release sites. They have also reanalyzed their data set with different statistical approaches.
Strengths:
The data presented is of good quality and provides an unprecedented view at high resolution of the presynaptic components of the retinogeniculate synapse during active developmental remodeling. This approach offers an advance to the previous mouse EM studies of this synapse because of the CTB label allows identification of the eye from which the presynaptic terminal arises.
Weaknesses:
While the interpretation of this data set is much more grounded in this second revised submission, some of the authors' conclusions/statements still lack convincing supporting evidence. In particular, the data does not support the title: "Eye-specific active zone clustering underlies synaptic competition in the developing visual system". The data show that there are fewer synapses made for both contra- and ipsi- inputs in the β2KO mice-- this fact alone can account for the differences in clustering. There is no evidence linking clustering to synaptic competition. Moreover, the findings of differences in AZ# or distance between AZs that the authors report are quite small and it is not clear whether they are functionally meaningful.
Reviewer #3 (Public review):
This study is a follow-up to a recent study of synaptic development based on a powerful data set that combines anterograde labeling, immunofluorescence labeling of synaptic proteins, and STORM imaging (Cell Reports, 2023). Specifically, they use anti-Vglut2 label to determine the size of the presynaptic structure (which they describe as the vesicle pool size), anti-Bassoon to label active zones with the resolution to count them, and anti-Homer to identify postsynaptic densities. Their previous study compared the detailed synaptic structure across the development of synapses made with contra-projecting vs. ipsi-projecting RGCs and compared this developmental profile with a mouse model with reduced retinal waves. In this study, they produce a new detailed analysis on the same data set in which they classify synapses into "multi-active zone" vs. "single-active zone" synapses and assess the number and spacing of these synapses. The authors use measurements to make conclusions about the role of retinal waves in the generation of same-eye synaptic clusters. The authors interpret these results as providing insight into how neural activity drives synapse maturation, the strength of their conclusions is not directly tested by their analysis.
Strengths:
This is a fantastic data set for describing the structural details of synapse development in a part of the brain undergoing activity-dependent synaptic rearrangements. The fact that they can differentiate the eye of origin is what makes this data set unique over previous structural work. The addition of example images from the EM dataset provides confidence in their categorization scheme.
Weaknesses:
Though the descriptions of single vs multi-active zone synapses are important and represent a significant advance, the authors continue to make unsupported conclusions regarding the biological processes driving these changes. Although this revision includes additional information about the populations tested and the tests conducted, the authors do not address the issue raised by previous reviews. Specifically, they provide no assessment of what effect size represents a biologically meaningful result. For example, a more appropriate title is "The distribution of eye-specific single vs multi-active zone is altered in mice with reduced spontaneous activity" rather than concluding that this difference in clustering is somehow related to synaptic competition. Of course, the authors are free to speculate, but many of the conclusions of the paper are not supported by their results.
Author response:
The following is the authors’ response to the previous reviews
Reviewer #1 (Public review)
Summary:
This manuscript addresses the question of whether spontaneous activity contributes to the clustering of retinogeniculate synapses before eye opening. The authors re-analyze a previously published dataset to answer the question. The authors conclude that synaptic clustering is eye-specific and activity dependent during the first postnatal week. While there is useful information in this manuscript, I don't see how the data meaningfully supports the claims made about clustering.
In adult retinogeniculate connections, functionally specificity is supported by select pairings of retinal ganglion cells and thalamocortical cells forming dozens of synaptic connections in subcellular microcircuits called glomeruli. In this manuscript, the authors measure whether the frequency of nearby synapses is higher in the observed data than in a model where synapses are randomly distributed throughout the volume. Any real anatomical data will deviate from such a model. The interesting biological question is not whether a developmental state deviates from random. The interesting question is how much of the adult clustering occurs before eye opening. In trying to decode the analysis in this manuscript, I can't tell if the answer is 99% or 0.001%.
We thank the reviewer for their helpful critique through both rounds of review. We have refocused the manuscript on paired eye-specific measurements of active zone addition and spatial relationships among active zones at each age. All effect sizes and power values for each comparison are now reported in Table S2. These measures allow readers to gauge biological significance more transparently.
Strengths:
The source dataset is high resolution data showing the colocalization of multiple synaptic proteins across development. Added to this data is labeling that distinguishes axons from the right eye from axons from the left eye. The first order analysis of this data showing changes in synapse density and in the occurrence of multi-active zone synapses is useful information about the development of an important model system.
Weaknesses:
I don't think the analysis of clustering within this dataset improves our understanding of how the system works. It is possible that the result is clear to the authors based on looking at the images. As a reader trying to interpret the analysis, I ran into the following problems:
• It is not possible to estimate biologically meaningful effect sizes from the data provided. Spontaneous activity in the post natal week could be responsible for 99% or 0.001% of RGC synapse clustering.
• The sample size is too small for the kinds of comparisons being made. The authors point out that many STORM studies use an n of 1 while the authors have n = 3 for each of their six experimental groups. However, the critical bit is what kinds of questions you are trying to answer with a given sample size. This study depends on determining whether the differences between groups are due to age, genotype, or individual variation. This study also makes multiple comparisons of many different noisy parameters that test the same or similar hypothesis. In this context, it is unlikely that n = 3 sufficiently controls for individual variation.
We have revised the manuscript to focus on eye-specific differences, which are paired measurements collected at each age. We have measured effect sizes and performed power tests for all comparisons presented in the manuscript. These measurements are shown for every figure in a new supplemental table S2.
• There is no clear biological interpretation of the core measure of the publication, the normalized clustering index. The normalized clustering index starts with counting the fraction of single active zone synapses within various distances to the edge of synapses. This frequency is compared to a randomization model in which the positions of synapses are randomized throughout a volume. The authors found that the biggest deviation between the observed and randomized proximity frequency using a distance threshold of 1.5 um. They consider the deviation from the random model to be a sign of clustering. However, two RGC synapses 1.5 um apart have a good chance of coming from the same RGC axon. At this scale, real observations will, therefore, always look more clustered than a model where synapses are randomly placed in a volume. If you randomly place synapses on an axon, they will be much closer together than if you randomly place synapses within a volume. The authors normalize their clustering measure by dividing by the frequency of clustering in the normalized model. That makes the measure of clustering an ambiguous mix of synapse clustering, axon morphology, and synaptic density.
We have removed the “normalized clustering index”. “Clustered” inputs are now defined strictly as those that have a neighboring single active-zone (sAZ) synapse within 1.5 mm. For each type of input (sAZ and mAZ) we show 1) the ratio of clustered to isolated inputs for both eyes, and 2) the number of neighboring sAZs (Figure 4).
We agree with the reviewer that many synapses are likely made nearby along the same axon from an individual RGC. In this scenario, sAZ synapses that are nearby a neighboring mAZ input may be part of the same nascent bouton. And, sAZ synapses nearby other sAZ neighbors may ultimately mature into a mAZ input. At the same time, inputs from one RGC may form nearby other inputs from neighboring RGCs. We discuss these motifs and potential mechanisms of cell-autonomous and non-autonomous development (Lines 300-308).
• Other measures are also very derived. For instance, one argument is based on determining that the cumulative distribution of the distance of dominant-eye multi-active zone synapses with nearby single-active zone synapses from dominant-eye multi-active zone synapses is statistically different from the cumulative distribution of the distance of dominant-eye multi-active zones without nearby single-active zone synapses from dominant-eye multi-active zones. Multiple permutations of this measure are compared.
We have simplified the presentation to show all measured path lengths for every input. This allows the reader to see each of the inputs and their relative distances. We present these data for like-eye type interactions at P4 and P8 (Figures 5 and S5).
• There are major biological differences between groups that are difficult to control for. Between P2, P4, and P8, there are changes in cell morphology and synaptic density. There are also large differences in synapse density between wild type and KO mice. It is difficult to be confident that these differences are not responsible for the relatively subtle changes in clustering indices.
• Many claims are based on complicated comparisons between groups rather than the predominating effects within the data. It is noted that: "In KO mice, dominant eye projections showed increased clustering around mAZ synapses compared to sAC synapses suggesting partial maintenance of synaptic clustering despite retinal wave defects". In contrast, I did not notice any discussion of the fact that the most striking trend in those measures is that the clustering index decreases from P2 to P8.
Related to the points above, we have revised the manuscript to focus on eye-specific release site addition and spatial relationships. For clarity, we have removed the clustering index and instead present ratios of clustered and isolated inputs, the number of sAZ synapses near each input type, and distance between like-eye mAZ inputs (Figure 4).
• Statistics are improperly applied. In my first review I tried to push the authors to calculate confidence intervals for two reasons. First, I believed the reader should be able to answer questions such as whether 99% or 0.01% of RGC synaptic clustering occurred in the first postnatal week. Second, I wanted the authors to deal with the fact that n=3 is underpowered for many of the questions they were asking. While many confidence intervals can now be found leading up to a claim, it is difficult to find claims that are directly supported by the correct confidence interval. Many claims are still incorrectly based on which combinations of comparisons produced statistically significant differences and which combinations did not.
We have substantially revised the manuscript to focus on within-group paired effects between eye-of-origin. We performed power tests for all statistical presentations and effect sizes and powers are presented for every figure in a new supplemental table S2. To simplify the manuscript and make it easier to read, we report confidence interval measurements in a separate supplemental table S3.
Reviewer #2 (Public review):
Summary:
This study provides a valuable data set showing changes in the spatial organization of synaptic proteins at the retinogeniculate connection during a developmental period of active axonal and synaptic remodeling. The data collected by STORM microscopy is state-of-the-art in terms of the high-resolution view of the presynaptic components of a plastic synapse. The revision has addressed many, but not all, of the initial concerns about the authors interpretation of their data. However, with the revisions, the manuscript has become very dense and difficult to follow.
We greatly appreciate the reviewer’s thoughtful comments through two rounds of review. To improve the clarity of the manuscript, we have substantially revised the work to streamline the narrative, clearly define terminology, and simplify data presentations, allowing readers to more directly interpret results and their implications.
Strengths:
The data presented is of good quality and provides an unprecedented view at high resolution of the presynaptic components of the retinogeniculate synapse during active developmental remodeling. This approach offers an advance to the previous mouse EM studies of this synapse because the CTB label allows identification of the eye from which the presynaptic terminal arises.
Weaknesses:
From these data the authors conclude that eye-specific increase in mAZ synapse density occur over retinogeniculate refinement, that sAZ synapses cluster close to mAZ synapses over age, and that this process depends on spontaneous activity and proximity to eye-specific mAZ synapses. While the interpretation of this data set is much more grounded in this revised submission, some of the authors' conclusions/statements still lack convincing supporting evidence.
This includes:
(1) The conclusion that multi-active zone synapses are loci for synaptic clustering. This statement, or similar ones (e.g., line 407) suggest that mAZ synapses actively or through some indirect way influence the clustering of sAZ synapses. There is no evidence for this. Clustering of retinal synapses are in part due to the fact that retinal inputs synapse on the proximal dendrites. With increased synaptogenesis, there will be increased density of retinal terminals that are closely localized. And with development, perhaps sAZ synapses mature into mAZ synapses. This scenario could also explain a large part of this data set.
We thank the reviewer for their comment. We have removed the ambiguous phrasing and clarified the manuscript to explicitly discuss alternative interpretations consistent with the results (Lines 300-308). This includes a discussion of sAZ synapse maturation into mAZ inputs (Lines 294-296).
(2) The conclusion that, "clustering depends on spontaneous retinal activity" could be misleading to the reader given that the authors acknowledge that their data is most consistent with a failure of synaptogenesis in the mutant mice (in the rebuttal). Additionally clustering does occur in CTB+ projections around mAZ synapses.
We have removed the highlighted phrase and revised the manuscript to focus on differences in release site addition between eye-of-origin. We clarified our discussion of activity-dependent changes to state that synapses fail to form in the mutant and synaptic clustering was reduced (Lines 324-330).
(3) Line 403: "Since mAZ synapses are expected to have a higher release probability, they likely play an important role in driving plasticity mechanisms reliant on neurotransmission.":What evidence do the authors have that mAZ are expected to have higher release probability?
We thank the reviewer for their careful reading. Because they have several active zones, mAZ synapses are expected to have a higher number of release sites (N), which could be independent of release probability at any individual active zone (Pr). We have removed the reference to release probability. Instead, we maintain focus on active zone number.
Reviewer #3 (Public review):
This study is a follow-up to a recent study of synaptic development based on a powerful data set that combines anterograde labeling, immunofluorescence labeling of synaptic proteins, and STORM imaging (Cell Reports, 2023). Specifically, they use anti-Vglut2 label to determine the size of the presynaptic structure (which they describe as the vesicle pool size), anti-Bassoon to label active zones with the resolution to count them, and anti-Homer to identify postsynaptic densities. Their previous study compared the detailed synaptic structure across the development of synapses made with contra-projecting vs. ipsi-projecting RGCs and compared this developmental profile with a mouse model with reduced retinal waves. In this study, they produce a new detailed analysis on the same data set in which they classify synapses into "multi-active zone" vs. "single-active zone" synapses and assess the number and spacing of these synapses. The authors use measurements to make conclusions about the role of retinal waves in the generation of same-eye synaptic clusters, providing key insight into how neural activity drives synapse maturation.
Strengths:
This is a fantastic data set for describing the structural details of synapse development in a part of the brain undergoing activity-dependent synaptic rearrangements. The fact that they can differentiate eye of origin is what makes this data set unique over previous structural work. The addition of example images from EM data set provides confidence in their categorization scheme.
Weaknesses:
Though the descriptions of synaptic clusters are important and represent a significant advance, the authors conclusions regarding the biological processes driving these clusters are not testable by such a small sample. This limitation is expected given the massive effort that goes into generating this data set. Of course the authors are free to speculate, but many of the conclusions of the paper are not statistically supported.
We thank the reviewer for their helpful comments throughout the revision process. We have substantially modified the manuscript to reframe the work around release site addition during eye-specific competition. Power tests and effect size measurements are presented for every figure in a new supplemental table S2.
Reviewer #2 (Recommendations for the authors):
(1) Authors should discuss that it is not clear what the relationship is between sAZ and mAZ, and sAZ could turn into a mAZ. This is not unreasonable that the number of AZ/bouton increases with development given that in the adult rodent retinogeniculate bouton, there is an average of 27 active zones (Budisantoso et al, 2012).
We thank the reviewer for their helpful suggestion. We have added a discussion of the relationship between sAZ and mAZ inputs and the point that sAZ synapses may mature into mAZ synapses (Lines 294-296). We now reference the work of Budisantoso et al., J. Neurosci. 2012.
(2) The authors should clarify how the statistics are calculated for the normalized clustering index (figure 3B, C). For ratios of values each with variance, the variance is summed when calculating SEM.
For clarity, we have removed the normalized clustering index analysis. We have simplified the work to present a clear definition of clustered and unclustered inputs, where clustering is defined by the presence of a nearby neighboring synapse within 1.5mm. We present the ratio of clustered and unclustered inputs for each input type and eye-of-origin. We also show the number of sAZ synapses nearby each clustered input (Figure 4).
(3) The authors have significantly clarified the terminology that they use in the text. This is much appreciated. However, it would be helpful to the naïve reader if they could define their use of the word "synapse" as referring to individual active zones/release sites or to terminals/boutons. For example:
Line 378: "Prior electron microscopy studies in the mouse found limited evidence of convergent synaptic clustering from neighboring RGCs at postnatal day 8 (10, 13), suggesting that the mAZ synapses seen in STORM images are single retinogeniculate terminals. The lack of synaptic convergence in prior EM reconstructions at P8 implies that early clustering around mAZ synapses may result from local output clustering within individual RGC arbors.":
What do the authors mean by "convergent synaptic clustering": do they mean clustering of release sites from different RGC inputs? And what does "local output clustering" mean?
We thank the reviewer for their suggestion to use clear terminology. We have revised the manuscript to define our use of the term “synapse” as a single active zone/release site (Lines 134-136). We refer to mAZ boutons in STORM data as “inputs”. We have revised the discussion of prior EM studies (Lines 130-132) and clarified all discussions of synaptic clustering throughout the work.
(4) While the authors argue that the retina-specific β2-nAChR mice exhibit disrupted retinal waves and defects in eye specific segregation, the authors are studying issues of active zone density which may depend on mechanisms depending on the postsynaptic neuron. This should be acknowledged.
We have updated the text to discuss the fact that postsynaptic mechanisms are also critical for the refinement of eye-specific synapses (Lines 332-340). We have added several additional references to the manuscript accordingly.
Reviewer #3 (Recommendations for the authors):
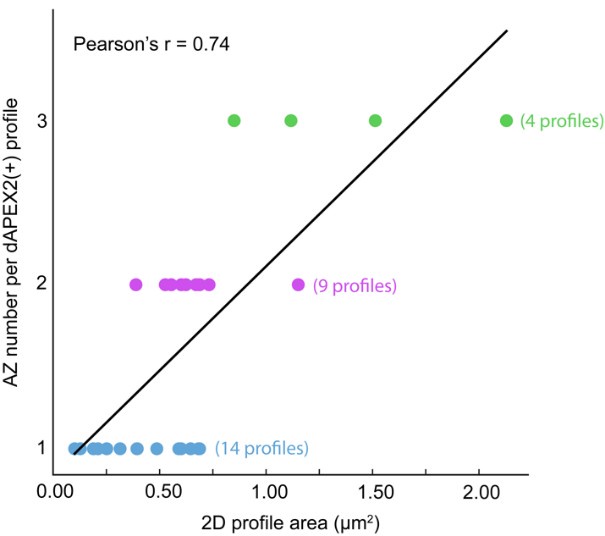
The authors have addressed many of my original concerns. The additional description of criteria for categorizing synapses, showing all the data points, gives the reader a stronger sense of where the numbers in the quantification come from. Replacing the "complex/simple" distinction with the "multi/single active zone" and the other clarifying text was effective. The addition of the EM data was also a very nice example to help interpret STORM images. It does appear there was no quantification on this EM data set and perhaps just a few example images were taken as "proof of principle". If, by chance, the authors have more EM images to make a data set of them that allows for some quantification, that would be great to add.
We thank the reviewer for their helpful comments on the manuscript through both rounds of review. The EM data we collected were 2D images of a subset of physical sections at postnatal day 8. Most dAPEX2(+) profiles had a single active zone, but a definitive identification would require 3D imaging so that each terminal can be assessed in its entirety for release sites that might be missed in a single cross section. Similarly, multi-active zone boutons are positively identified in 2D images, but definitive measurements of AZ number would require 3D information. We analyzed our 2D EM images and present a plot of dAPEX2(+) profile size versus active zone number below. These measures are positively correlated (r = 0.74), with larger profiles containing more active zones.
Author response image 1.
Unfortunately, we are not currently equipped to perform volumetric EM imaging at our home institution and are concerned that analysis of 2D data may be inconclusive. For these reasons, we are opting to maintain a qualitative presentation of our current EM results and we look forward to collaborating with other experts to achieve volumetric EM reconstructions in the future


