Peer review process
Revised: This Reviewed Preprint has been revised by the authors in response to the previous round of peer review; the eLife assessment and the public reviews have been updated where necessary by the editors and peer reviewers.
Read more about eLife’s peer review process.Editors
- Reviewing EditorJun WuThe University of Texas Southwestern Medical Center, Dallas, United States of America
- Senior EditorWei YanWashington State University, Pullman, United States of America
Reviewer #1 (Public review):
Based on the reviewers' comments, the authors conducted additional analyses to enhance their study. By utilizing publicly available datasets (Guo et al., 2017) capable of distinguishing the sex of embryos, they examined DNA methylation in male embryos and identified minor de novo DNA methylation events initiating at the 8-cell stage, predominantly on the X chromosome. However, this finding introduces confusion, as the authors had previously suggested that such minor de novo DNA methylation regulates imprinted X chromosome inactivation, a process specific to female embryos.
The key unresolved issue is whether minor de novo DNA methylation in female embryos occurs exclusively on the "inactive" X chromosome or on both the active and inactive X chromosomes. The authors did not provide direct evidence supporting de novo DNA methylation specifically at the inactive X chromosome. Furthermore, it remains unclear whether this methylation influences embryonic development independent of sex or is specific to female embryos undergoing imprinted X chromosome inactivation. While the authors present data on decreased live birth rates in Figure 2F, they did not address whether there is a sex bias among the live pups, such as male-biased survival. Clarifying this point would strengthen their conclusions.
In summary, the critical issue with the revised manuscript is that it does not adequately resolve whether minor de novo DNA methylation regulates embryonic development irrespective of sex or specifically impacts female embryos where imprinted X chromosome inactivation occurs. This distinction is essential for understanding the broader implications of their findings.
Reviewer #2 (Public review):
Summary:
Yue et al. set out to determine if the low but measurable level of DNMT3B expression that is observed prior to the major wave of de novo DNA methylation has a function (ie before the epiblast stage) . Re-analyzing existing DNA methylation data from Smith et al. (2012) they find a very modest DNA methylation gain over a subset of promoters, on the order of 1%, occurring between the 8-cell and blastocyst stages, and refer to this as "minor de novo DNA methylation". They attempt to assess the relevance/functionality of this minor DNA methylation gain, and intriguingly report reduced H3K27me3 in Dnmt3b knockdown (KD) trophoblast cells that normally undergo imprinted X-chromosome inactivation (iXCI) before the blastocyst stage. In addition, they assess proliferation, differentiation, metabolic function, implantation rate and live birth rate of Dnmt3b KD blastocysts, and assign specific phenotypes to the loss of DNA methylation at this early stage..
Strengths:
Working with early embryos is technically demanding and as such the relevance of disrupting epigenetic factors specifically at this stage in development is less well studied. The detailed analyses of published data as well as DNMT3B depletion experiments presented in this manuscript provides food for thought for the epigenetics community.
Weaknesses:
- Throughout the manuscript, please represent DNA methylation changes as delta DNA methylation instead of fold change. In many figures, it is not clear what the unit of DNA methylation presented actually is. Readers should be made aware that the changes in DNA methylation observed are very modest and the threshold applied to the delta in DNA methylation is just 1% "( Δ DNA methylation > 0.01)").
- The minimum coverage threshold and threshold applied For DNA methylation should be presented in each relevant figure. Currently for example, the latter is only mentioned not in the methods section but rather once in "Figure 2, figure supplement 1"
- Indirect effects of disrupting DNMT3B at the earlier stages in development, when de novo DNAme levels are very low in the promoter regions of interest, should be considered. For example, de novo DNA methylation in repetitive regions/pericentric heterochromatin at this stage (not studied here) could be much higher than 1%. Disruption of such methylation, could result in a "sink effect", with loss of H3K27me3 at promoter regions (including on the inactive X-chromosome), due to aberrant repositioning of Polycomb complexes/PRC2 to such ectopic sites from which they are normally excluded, rather than a direct positive effect of the very low DNA methylation gain observed on Polycomb recruitment.
The impact of depletion of DNMT3B on the major wave of de novo DNA methylation that takes place at the peri-implantion stage of embryonic development may also play a role in some of the later phenotypes observed. In other words when the failure of de novo methylation is more profound as levels of DNA methylation are much higher at these later stages as a consequence of DNMT3B activity.
Author response:
The following is the authors’ response to the original reviews.
Public Reviews:
Reviewer #1 (Public Review):
Summary:
In this study, Yue et al. re-processed publicly available DNA methylation data (published in 2012 and 2017 from the Meissner lab) from pre- and post-implantation mouse embryos. Against the global wave of genome-wide reduction of DNA methylation occurring during pre-implantation development, they detected a slight increase (~1% on average) of DNA methylation at gene promoter regions during the transition from 8-cell to blastocyst stage. They claim that many such promoters are located in the X chromosome. Subsequently, they knocked down Dnmt3b (presumably because of its upregulation during the transition from the 8-cell to blastocyst stage) and detected the aberrant patterning of H3K27me3 in the mutant female embryos. Based on this observation, they claim that imprinted X-chromosome inactivation is impaired in the Dnmt3b-Kd pre-implantation embryos. Finally, they propose a model where such an increase of DNA methylation together with H3K27me3 regulates imprinted X-chromosome inactivation in the pre-implantation embryos. While their observation is of potential interest, the current version of the work fails to provide enough evidence to support their conclusions. Below are suggestions and comments on the manuscript.
Major issues:
(1) Sex of the embryos of the genome-wide bisulfite-sequencing data
The authors re-analyzed publicly available genome-wide DNA methylation data from the Meissner lab published in 2012 and 2017. The former used reduced representation bisulfite sequencing (RRBS) and the latter used whole-genome bisulfite sequencing (WGBS). Based mainly on the RRBS data, Yue et al. detected de novo DNA methylated promoters during the transition from 8-cell to blastocyst against the global wave of genome-wide DNA demethylation. They claim that such promoter regions are enriched at the "inactive" X chromosome. However, it would be difficult to discuss DNA methylation at inactive X-chromosomes as the RRBS data were derived from a mixture of male and female embryos. It would also be notable that the increase of DNA methylation at these promoter regions is ~1% on average. Such a slight increase in DNA methylation during pre-implantation development could also be due to the developmental variations between the embryos or between the sexes of embryos.
Thanks so much for your insightful comments. Whether de novo DNA methylation occurs in a sex-dimorphic manner would be of significance for our study. Based on your comments, we have added a reanalysis based on a publicly available single cell multi-omics sequencing (COOL-seq) data of mouse early embryos (Guo et al., 2017). The results showed that both male and female embryonic cells gain DNA methylation during the transition from the 8-cell to ICM (Figure 1—figure supplement 1C-D; Lines 112-115 in the revised manuscript).
With regards to the increase in the promoter region, many previous studies have revealed that promoter and overlapping CGI regions, especially high CpG promoters, always showed low levels of DNA methylation (Auclair et al., 2014; Borgel et al., 2010; Dahlet et al., 2020). The relatively lower basal levels make the increase seem relatively slight. Thus, we added relevant statements to clarify this information and rewritten the sentences in the revised manuscript (Lines 116-118, 125-127 in the revised manuscript).
In addition, using the single cell COOL-seq data, we also specifically reanalyzed the DNA methylation changes on the X chromosome in female embryos. The X chromosome showed a more notable increase than that on autosomes, and the female X chromosome showed a higher DNA methylation level than that of the male (Figure 3—figure supplement 2A-B; Lines 203-206 in the revised manuscript).
Thanks again for your insightful and constructive comments that significantly strengthen our evidence. We have added these results in the revised manuscript.
(2) Imprinted X-chromosome inactivation and evaluation of H3K27me3 (related to Figures 2C, D; 3F; Figure2-supplement 2 F, G; Figure3-supplement 3G)
Based on the slight change in the H3K27me3 signals in the Dnmt3b-Kd blastocysts, the authors claim that imprinted X-chromosome inactivation is impaired in the mutant embryo. It would be not easy to reach this conclusion from such a rough analysis of H3K27me3 presented in Figure 2C, D. Rigorous quantification/evaluation of the H3K27me3 signals in the Dnmt3b-Kd embryos should be considered. Additional evidence for the impairment of H3K27me3 in the mutant embryos should also be provided (expression of a subset of X-linked genes by RNA-FISH or RT-PCR etc.). Though technically challenging, high-resolution genome-wide approach such as ChIP-seq of H3K27me3 in the Dnmt3b-kd female embryos (with traceable SNPs between maternal and paternal X chromosome to distinguish inactive and active X-chromosome) could more precisely evaluate regions that lose H3K27me3 in the X-chromosome (de novo DNA methylated promoters from 8-cell to blastocyst, for example).
Thanks so much for your insightful comments that make our results more convincing. The H3K27me3 domain is a classic marker for establishment of XCI by achieving X chromosome wide heterochromatinization of transcriptional depression (Chow and Heard, 2009; Heard et al., 2004; Huynh and Lee, 2005). Thus, in the present study, we have performed immunostaining for H3K27me3 domains to evaluate the iXCI status in the blastocysts, as previously reported (Fukuda et al., 2014; Gontan et al., 2018; Inoue et al., 2010; Tan et al., 2016). Base on your comments, we have added another statistical method to quantify the establishment of iXCI, i.e. the percentage of H3K27me3-positive and -negative cells to total trophoblast cells in female blastocysts subject to Dnmt3b knockdown or not. The result also indicated that Dnmt3b knockdown led to a significant loss of H3K27me3 domains from total trophoblast cells. Similarly, new data based on statistical analyses of total trophoblast cells, has also been added in the results of Dnmt3b knockout and 5-aza-dC (Figure 3F; Figure 3—figure supplement 3D, H in the revised manuscript).
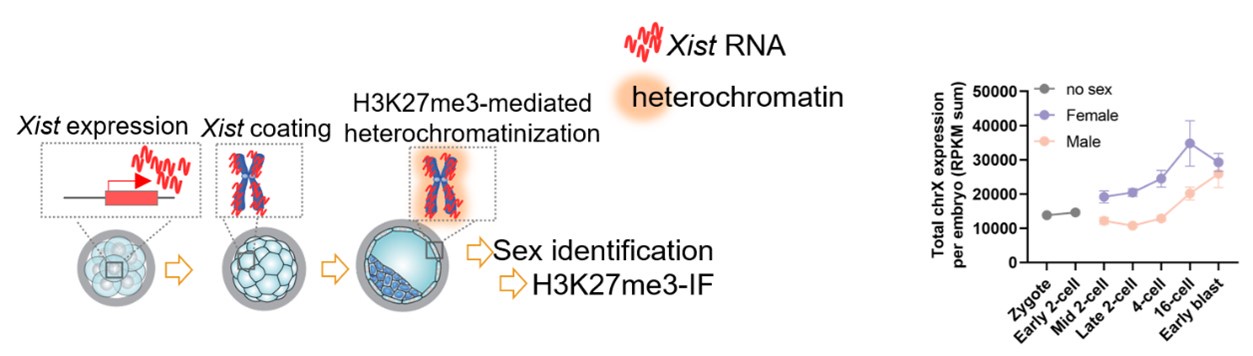
To clarify the significance and reliability of detecting H3K27me3 domains, we have added a schematic diagram depicting the process of iXCI initiation and establishment, as well as the experimental design and work flows, to make our results easier to be understood (Figure 3C in the revised manuscript).
In addition, we agree with your comments that additional evidence will benefit the conclusion. Thus, we have reanalyzed the RNA-seq and H3K27me3 CHIP-seq data in extraembryonic ectoderm (ExE) of E6.5 single embryos that underwent Dnm3a/3b knockout because preimplantation iXCI status maintains extraembryonic cells (Chen et al., 2019; Galupa and Heard, 2015; Schulz and Heard, 2013). The results showed that Dnmt knockout-induced chromosome-wide loss of DNA methylation led to a nearly complete loss of H3k27me3 on paternal X chromosome (specifically inactivated in iXCI), along with a notable transcriptional upregulation cross the chromosome. By contrast, these changes cannot be not observed on maternal X chromosome.
We have added this result in the revised manuscript (Lines 253-261; Figure 3—figure supplement 4A in the revised manuscript).
(3) Analysis of the developmental potential of Dnmt3b-kd embryos
While the authors claim that Dnmt3b-mediated de novo DNA methylation plays an important role in imprinted X-chromosome inactivation, it remains unclear whether the analysis presented in Figure 4 is derived from "female" embryos. This analysis seemed confusing as the authors claim that de novo DNA methylation in the promoter regions during the transition from 8-cell to blastocyst regulates imprinted X-chromosome inactivation, but this should not happen in the male embryos. Was the impairment of embryonic proliferation and differentiation observed in both male and female embryos? Or is this specific to the female embryos? We think that the sex of the embryos would be critical for the analysis presented in Figure 4.
Thanks so much for your constructive comments to make our results smoother and clearer. The Figure 4 mainly presents the developmental role of minor de novo methylation based on the integrated analysis of DNA methylation and gene expression dynamics from the 8-cell to ICM. Because our data indicated that both male and female embryos undergo minor de novo methylation (Figure 1—figure supplement 1C-D in the revised manuscript). This section mainly focused on genome wide and general changes, but not on sex dimorphic consequence.
To avoid the possible confusion, we have reorganized the RESULTS AND DISCUSSION section and presented this section as Figure 2 in the revised manuscript, before the chromosomal distribution analysis and subsequent detection relevant to iXCI.
Reviewer #2 (Public Review):
Summary:
Here, Yue et al. set out to determine if the low DNMT3B expression that is observed prior to de novo DNA methylation (before the blastocyst stage) has a function. Re-analyzing existing DNA methylation data from Smith et al. (2012) they find a small DNA methylation gain over a subset of promoters and gene bodies, occurring between the 8-cell and blastocyst stages, and refer to this as "minor de novo DNA methylation". They attempt to assess the relevance/functionality of this minor DNA methylation gain, and report reduced H3K27me3 in Dnmt3b knockdown (KD) trophoblast cells that normally undergo imprinted X-chromosome inactivation (iXCI) before the blastocyst stage. In addition, they assess the proliferation, differentiation, metabolic function, implantation rate, and live birth rate of Dnmt3b KD blastocysts.
Strengths:
Working with early embryos is technically demanding, making the well-designed experiments from this manuscript useful to the epigenetics community. Particularly, the DNMT3B expression and 5-mC staining at different embryonic stages.
Thanks for your positive evaluation, we have revised manuscript based on your comments, and the items need to be addressed in detail are explained in the point-by-point response to each comment.
Weaknesses:
- Throughout the manuscript, please represent DNA methylation changes as delta DNA methylation instead of fold change.
Thanks so much for your constructive comments. We have represented DNA methylation changes as “ΔDNA methylation” (Figure 2—figure supplement 1A; Figure 3—figure supplement 1A; Figure 3—figure supplement 3I in the revised manuscript).
- Detailed methods on the re-analysis of the DNA methylation data from Smith et al. 2012 are missing from the materials and methods section. Was a minimum coverage threshold used?
Thanks so much for your reminder. We have added relevant statements and provided the detail of the coverage criteria in the subsection of Bioinformatics analysis in the Materials and methods section as follows: RRBS data of mouse embryos (2-cell embryos, 4-cell embryos, 8-cell embryos, ICM, and E6.5 embryos) were downloaded from the published article by Smith et al (Smith et al., 2012) (accession number: GSE34864). The methylation level was calculated as the number of “methylated” reads (reporting as C), divided by the total number of “methylated” and “unmethylated” read, which reporting as C or T. The genomic region information was downloaded from the mm9 Repeat Masker. As described in the published article, promoters were defined as 1 kb up- and downstream of the TSS and classified into high-density CpG promoter (HCP), intermediate-density CpG promoter (ICP) and low-density CpG promoter (LCP). Only CpG sites with at least fivefold coverage were included in the methylation analysis. We have added relevant information in the revised manuscript (Lines 462-470 in the revised manuscript).
- Detailed methods on the establishment and validation of Dnmt3b KO blastocysts and 5-aza-dC treated blastocysts are missing (related to Figure 2).
Thanks so much for your detailed reminder. In the present study, we used a well-established Dnmt3b-deficient mouse model (Okano et al., 1999) to validate the role of minor de novo DNA methylation in iXCI establishment. Heterozygous Dnmt3b+/- mice that carry one mutant locus of Dnmt3b, were obtained from the Mutant Mouse Resource & Research Centers (MMRRC, NIH). Homozygous embryos were obtained by intercrossing Dnmt3b+/- male and female mice. Genotyping assays of collected embryos was performed by PCR using primers that were designed based on the gene targeting strategy following the MMRRC genotyping protocol (https://www.med.unc.edu/mmrrc/genotyping-protocols/mmrrc-center-protocol-29886/). We have provided the detailed methods in the revised manuscript (Lines 350-354; 391-393 in the revised manuscript). In addition, we added a schematic diagram depicting the processes of embryo collection and detection (Figure 3—figure supplement 3A in the revised manuscript).
Similarly, we have provided relevant details of 5-aza-dC supplementation in the revised manuscript (Lines 412-415 in the revised manuscript) and added a schematic diagram depicting the details of experimental design and processes (Figure 3—figure supplement 3E in the revised manuscript).
- Detailed methods on the re-analysis of the ChIPseq data from Liu et al. 2016 are missing from the materials and methods section.
Thank you for pointing this out. The bigwig files of H3K27me3 ChIP-seq data were downloaded from the published article by Liu et al (Liu et al., 2016)(accession number: GSE73952). These signal tracks were generated using the MACS2 (v2.0.10.20131216) pileup function and normalized to 1 million reads for visualization, as described in the original publication. We have added relevant information to the MATERIALS AND METHODS section in the revised manuscript (Lines 474-479 in the revised manuscript).
- Some of the data represented in bar graphs does not look convincing/significant. Maybe this data can be better represented differently, such as in box plots or violin plots, which would better represent the data.
Thanks so much for your comments that improve our result presentation, relevant results have been changed into box plots in the revised manuscript (Figure 3E; Figure 3—figure supplement 3C; Figure 3—figure supplement 3G in the revised manuscript). In addition, to strengthen our evidence, we have added alternative statistical method to quantify the establishment of iXCI, i.e. the percentage of H3K27me3-positive and -negative cells to total trophoblast cells in female blastocysts subject to Dnmt3b knockdown or not. (Figure 3F; Figure 3—figure supplement 3D, H in the revised manuscript).
- The relevance and rationale for experiments using 5-aza-dC treatment is unclear.
Thanks so much for reminding us to make our results more informative and convincing. 5-aza-dC is a well-established global DNA hypomethylating agent that efficiently inhibit the activity of all DNMTs, and thus has been frequently used to study the maintenance of DNA methylation and de novo DNA methylation (Maslov et al., 2012; Oka et al., 2005).
In our study, to validate the function of minor de novo DNA methylation in iXCI, we take advantage of 5-aza-dC-induced DNMT inhibition, which allows us, despite its inhibitory effect common to various DNMTs, to transiently treat embryos specifically during the window of minor de novo DNA methylation (from the 8-cell to blastocyst stage). We have added these statements, as well as a schematic diagram depicting the experimental design, in the revised manuscript to make our experiments more rational and easier to be understood (Lines 183-188; Figure 3—figure supplement 3E in the revised manuscript).
References
Auclair, G., Guibert, S., Bender, A. and Weber, M. (2014). Ontogeny of CpG island methylation and specificity of DNMT3 methyltransferases during embryonic development in the mouse. Genome Biol. 15, 545.
Borgel, J., Guibert, S., Li, Y., Chiba, H., Schubeler, D., Sasaki, H., Forne, T. and Weber, M. (2010). Targets and dynamics of promoter DNA methylation during early mouse development. Nat. Genet. 42, 1093-1100.
Chen, Z., Yin, Q., Inoue, A., Zhang, C. and Zhang, Y. (2019). Allelic H3K27me3 to allelic DNA methylation switch maintains noncanonical imprinting in extraembryonic cells. Sci Adv 5, eaay7246.
Chow, J. and Heard, E. (2009). X inactivation and the complexities of silencing a sex chromosome. Curr. Opin. Cell Biol. 21, 359-366.
Dahlet, T., Argueso Lleida, A., Al Adhami, H., Dumas, M., Bender, A., Ngondo, R. P., Tanguy, M., Vallet, J., Auclair, G., Bardet, A. F., et al. (2020). Genome-wide analysis in the mouse embryo reveals the importance of DNA methylation for transcription integrity. Nat Commun 11, 3153.
Fukuda, A., Tomikawa, J., Miura, T., Hata, K., Nakabayashi, K., Eggan, K., Akutsu, H. and Umezawa, A. (2014). The role of maternal-specific H3K9me3 modification in establishing imprinted X-chromosome inactivation and embryogenesis in mice. Nat Commun 5, 5464.
Galupa, R. and Heard, E. (2015). X-chromosome inactivation: new insights into cis and trans regulation. Curr. Opin. Genet. Dev. 31, 57-66.
Gontan, C., Mira-Bontenbal, H., Magaraki, A., Dupont, C., Barakat, T. S., Rentmeester, E., Demmers, J. and Gribnau, J. (2018). REX1 is the critical target of RNF12 in imprinted X chromosome inactivation in mice. Nat Commun 9, 4752.
Guo, F., Li, L., Li, J., Wu, X., Hu, B., Zhu, P., Wen, L. and Tang, F. (2017). Single-cell multi-omics sequencing of mouse early embryos and embryonic stem cells. Cell Res. 27, 967-988.
Heard, E., Chaumeil, J., Masui, O. and Okamoto, I. (2004). Mammalian X-chromosome inactivation: an epigenetics paradigm. Cold Spring Harb. Symp. Quant. Biol. 69, 89-102.
Huynh, K. D. and Lee, J. T. (2005). X-chromosome inactivation: a hypothesis linking ontogeny and phylogeny. Nat. Rev. Genet. 6, 410-418.
Inoue, K., Kohda, T., Sugimoto, M., Sado, T., Ogonuki, N., Matoba, S., Shiura, H., Ikeda, R., Mochida, K., Fujii, T., et al. (2010). Impeding Xist expression from the active X chromosome improves mouse somatic cell nuclear transfer. Science 330, 496-499.
Liu, X. Y., Wang, C. F., Liu, W. Q., Li, J. Y., Li, C., Kou, X. C., Chen, J. Y., Zhao, Y. H., Gao, H. B., Wang, H., et al. (2016). Distinct features of H3K4me3 and H3K27me3 chromatin domains in pre-implantation embryos. Nature 537, 558-562.
Maslov, A. Y., Lee, M., Gundry, M., Gravina, S., Strogonova, N., Tazearslan, C., Bendebury, A., Suh, Y. and Vijg, J. (2012). 5-aza-2'-deoxycytidine-induced genome rearrangements are mediated by DNMT1. Oncogene 31, 5172-5179.
Oka, M., Meacham, A. M., Hamazaki, T., Rodic, N., Chang, L. J. and Terada, N. (2005). De novo DNA methyltransferases Dnmt3a and Dnmt3b primarily mediate the cytotoxic effect of 5-aza-2'-deoxycytidine. Oncogene 24, 3091-3099.
Okano, M., Bell, D. W., Haber, D. A. and Li, E. (1999). DNA methyltransferases Dnmt3a and Dnmt3b are essential for de novo methylation and mammalian development. Cell 99, 247-257.
Schulz, E. G. and Heard, E. (2013). Role and control of X chromosome dosage in mammalian development. Curr. Opin. Genet. Dev. 23, 109-115.
Smith, Z. D., Chan, M. M., Mikkelsen, T. S., Gu, H. C., Gnirke, A., Regev, A. and Meissner, A. (2012). A unique regulatory phase of DNA methylation in the early mammalian embryo. Nature 484, 339-344.
Tan, K., An, L., Miao, K., Ren, L., Hou, Z., Tao, L., Zhang, Z., Wang, X., Xia, W., Liu, J., et al. (2016). Impaired imprinted X chromosome inactivation is responsible for the skewed sex ratio following in vitro fertilization. Proc. Natl. Acad. Sci. U. S. A. 113, 3197-3202.
Reviewer #1 (Recommendations For The Authors):
Title
It would be hard to understand what "co"-regulates means. Does this mean DNA methylation and H3K27me3 co-regulate imprinted X- X-chromosome inactivation? If so, the title can be reworded.
Thanks for your insightful comments, the title has been corrected into “A wave of minor de novo DNA methylation initiates in mouse 8-cell embryos and co-regulates imprinted X- chromosome inactivation with H3K27me3” (Line 2 in the revised manuscript).
Text
(1) As DNA methylation analysis is a primary part of this study, how they processed DNA methylation data can be added to the "Bioinformatics analysis" in the MATERIALS AND METHODS section.
Thanks for your kind reminder. We have added relevant information in the Materials and methods section in the revised manuscript (Lines 462-474 in the revised manuscript).
(2) It seems that recent literature has not been cited in the manuscript. Specifically, none of the papers after 2018 were cited. Recent relevant papers should also be cited throughout the manuscript.
Thanks so much for your reminder. We have added more recent literature to update the relevant information, such as the evidence supporting the causal role between DNA methylation and XCI (Lines 225-228, 264-265 in the revised manuscript); the concurrent enrichment of DNA methylation and H3K27me3 in genes subject to XCI (Lines 301-303 in the revised manuscript); the dominant role of de novo methylation in X chromosome (Lines 253-256 in the revised manuscript), etc.
(3) Line 56: The first report that describes the dynamics of DNMT3B expression in pre-implantation embryonic development (Hirasawa et al., 2007) is missing. This paper should be cited.
Sorry for our carelessness, we have added relevant references and rewritten the sentence in the revised manuscript (Lines 56-57 in the revised manuscript). I think you meant the report by Hirasawa et al in 2008, in which presented expression and subcellular localization of Dnmt3a and Dnmt3b in mouse oocytes and preimplantation embryos.
(4) Line 98: It would be good to mention that the data were derived from reduced representation bisulfite sequencing as the authors used whole-genome bisulfite sequencing data from the same research group as well.
Thanks for your kind reminder. As you have suggested, we have added the description in the revised manuscript to emphasize that these data were derived from reduced representation bisulfite sequencing, while another data were derived from whole-genome bisulfite sequencing, respectively. (Lines 98-99, 111 in the revised manuscript).
(5) Line 101: We first... "the preferential target of DNMT3B (Auclair et al., 2014; Borgel et al., 2010)". More recent literature (Baubec et al., 2016, Duymich et al., 2016, for example) showed that the preferential target of DNMT3B is not a promoter but a gene body. This sentence should be reworded.
Thanks so much for your detailed reminder. As you have pointed out, “preferential target” seems to be an inaccurate statement. Besides of promoters, gene bodies and other elements also undergo de novo DNA methylation (Auclair et al., 2014; Dahlet et al., 2020; Duymich et al., 2016).
We have rewritten the sentence as follows in the revised manuscript: “Promoter regions are important target sites of DNMT3B (Choi et al., 2011). The acquisition of DNA methylation in promoters, especially in intermediate and low CpG promoters, during implantation is largely dependent on DNMT3B and plays an important role in regulating developmental genes (Auclair et al., 2014; Borgel et al., 2010; Dahlet et al., 2020). Thus, among genomic regions that may undergo de novo DNA methylation, we initially focused our analysis on DNA methylation dynamics of promoters...” (Lines 100-106 in the revised manuscript)
(6) Lines 108-109: It would be good to mention that these data were derived from whole-genome bisulfite sequencing.
Thanks for your kind reminder. As aforementioned, we have added a description in the revised manuscript to distinguish between data derived from reduced representation bisulfite sequencing and whole-genome bisulfite sequencing (Lines 98-99, 111 in the revised manuscript).
(7) Line 141: rXCI should be defined.
Thanks for your kind reminder. We have added full descriptions and more necessary information about iXCI and rXCI, to make our statements clearer and easier to be understood (Lines 210-213 in the revised manuscript). In addition, we carefully checked the relevant descriptions throughout the manuscript, and each abbreviation (such as “ICM”) has been defined at its first occurrence. Additionally, we have replaced abbreviations that appears only once in the manuscript with their full terms (Lines 122, 212 in the revised manuscript).
(8) Lines 145-149: The role of DNA methylation for imprinted X-inactivation has already been reported (Chiba et al., 2008). The relevant sentences should be reworded.
Thanks so much for reminding us the important earlier literature that explores the relationship between DNA methylation and XCI. However, the primary aim and hypothesis of the study by Chiba et al. are different from those of our study. Chiba et al focused on whether DNA methylation is the imprinting mark responsible for monoallelic expression of Xist (the initiation event of iXCI), while our study focused on the role of DNA methylation in achieving X chromosomal heterochromatinization (the late event of iXCI).
In detail, the study by Chiba et al. mainly focused on exploring why Xist is specifically expressed from paternal allele and iXCI occurs specifically on the paternal X chromosome in mouse preimplantation embryos. Because Previous studies have suggested that genomic imprinting of Xist is established during oogenesis (Oikawa et al., 2014; Tada et al., 2000), Chiba et al. wanted to test whether the DNA methylation imprinting established during oogenesis is responsible for the monoallelic expression of Xist in preimpantaiton embryos. Analyses of DNA methyltransferase maternal knockout embryos revealed that oocyte DNA methylation is dispensable for Xist imprinting (Chiba et al., 2008). Follow-up study by Inoue et al. identified a broad H3K27me3 enrichment within the Xist 5’region established during oocyte growth and persists through preimplantation development, as the imprinting mark of Xist (Inoue et al., 2017). These series of studies are very important and allows us to understand the mechanism underlying paternal allele-specific iXCI in mouse preimplantation embryos and extraembryonic tissues.
However, the hypothesis is different in our study. Based on the finding of minor de novo DNA methylation and its preferential distribution on the X chromosome, we have speculated that the minor de novo methylation, which occurs from the 8-cell to blastocyst stage, may participate in achieving X chromosomal heterochromatinization. Although DNA methylation is essential for maintaining X chromosome-wide transcriptional silence of rXCI, its role in iXCI remains controversial and it is even plausibly thought that DNA methylation is not required for achieving iXCI because preimplantation embryos undergo global and massive DNA demethylation.
We have reorganized this paragraph, relevant statements have been added to make the background and discussion clearer and easier to be understood. (Lines 217-234 in the revised manuscript)
(9) Lines 164-165: Information regarding Dnmt3b KO is missing. Did the authors generate an original KO line or use an already published one? It should be explicitly stated.
Thank you so much for your kind reminder. The Dnmt3b heterozygous mice were obtained from the Mutant Mouse Resource & Research Centers (MMRRC), and Dnmt3b knockout (KO) embryos were generated by mating Dnmt3b heterozygous females with heterozygous males. The genotyping of Dnmt3b KO embryos was performed by PCR following the MMRRC genotyping protocol (https://www.med.unc.edu/mmrrc/genotyping-protocols/mmrrc-center-protocol-29886/). The relevant information has been added to the MATERIALS AND METHODS section in the revised manuscript (Lines 350-354; 391-393 in the revised manuscript).
(10) Line 165: chemical-induced inhibition of DNMT3B. As 5-aza-dC also blocks DNMT3A and DNMT1, this sentence should be reworded.
Thank you for your valuable comments. 5-aza-dC is a well-established global DNA hypomethylating agent that efficiently inhibit the activity of all DNMTs, and has been frequently used to study the maintenance of DNA methylation and de novo DNA methylation (Maslov et al., 2012; Oka et al., 2005). Thus, despite its inhibitory effect common to various DNMTs, chemical-induced inhibition of DNMTs has the advantage of allowing us to transiently treated embryos specifically during the window of minor de novo DNA methylation (the 8-cell to blastocyst stage). We have rewritten the relevant sentences in the revised manuscript (Lines 183-188 in the revised manuscript).
(11) Lines 171-174: "The role of de novo methylation in iXCI...". This possibility was already tested in the previous study from the Sasaki lab (Chiba et al., 2008).
As mentioned above, the primary aim and hypothesis of the study by Chiba et al. are different from those of our study. Chiba et al. mainly focused on exploring why Xist is specifically expressed from paternal allele and iXCI occurs specifically on the paternal X chromosome in mouse preimplantation embryos, so they tested whether the DNA methylation imprinting established during oogenesis is responsible for this monoallelic expression of Xist in preimplantation embryos (the initiation event of iXCI).
By contrast, based on the finding of minor de novo DNA methylation and its preferential distribution on X chromosome, our study has speculated that the minor de novo DNA methylation, which occurs from the 8-cell to blastocyst stage, may participate in achieving X chromosomal heterochromatinization (the late event of iXCI).
Thanks so much for reminding us this important literature, to make our discussion more informative. We have reorganized this paragraph by rewriting or adding relevant statements to make the background and discussion clearer and easier to be understood (Lines 217-231 in the revised manuscript). In addition, to avoid repeated statement and make our discussion more concise, we have removed the similar sentences at the end of this paragraph.
(12) Lines 198-200: "Given DNA methylation...". These citations mention a general relationship between DNA methylation and H3K27me3 in cells in culture. As I believe the authors focus on X-chromosome inactivation in the female embryos, more relevant papers that discuss the order of the events for the establishment of H3K27me3 and DNA methylation in the inactive X-chromosome can be cited.
Thanks so much for your comment to improve our discussion. It has been thought that during the late phase of rXCI in fully differentiated cells, gene silencing is achieved by PRC2 complex-induced H3K27me3, and then is further stably maintained by the redundant action of multiple layers of epigenetic modifications, including DNA methylation, to reach the maximum level of chromatin compaction (Chow and Heard, 2009; Heard et al., 2004; Pintacuda and Cerase, 2015). In line with this, a recent multifaceted analysis showed that DNA methylation and H3K27me3 are concurrently enriched in genes subject to XCI (Balaton and Brown, 2021). We have added these statements in the revised manuscript (Lines 295-303 in the revised manuscript).
(13) Line 241: As 5-aza-dC blocks both de novo and maintenance DNA methylation, this sentence should be reworded.
Thank you for your kind reminder. As you have mentioned above, 5-aza-dC is a well-established global DNA hypomethylating agent that efficiently inhibit the activity of all DNMTs, and has been frequently used to study the maintenance of DNA methylation and de novo DNA methylation (Maslov et al., 2012; Oka et al., 2005). Thus, despite its inhibitory effect common to various DNMTs, chemical-induced inhibition of DNMTs has the advantage of allowing us to transiently treated embryos specifically during the window of minor de novo DNA methylation (the 8-cell to blastocyst stage). We have rewritten the relevant sentences in the revised manuscript (Lines 183-188 in the revised manuscript).
Figures
(1) Figure 1C, D: Do the rows in C and D show the corresponding genes?
Figure 1C and D represent the DNA methylation changes of promoters (C) and gene bodies (D) respectively, during the transition from the 8-cell to blastocyst stage. Two data were analyzed independently, and rows did not show the corresponding genes. Since we have focused on the minor de novo methylation in promoter regions, to avoid confusion, the results of the gene body have been removed from the revised manuscript.
(2) Figure 1G: Yy2 promoter gained DNA methylation during the transition from 8-cell to the blastocyst stage. Is this a representative locus for the de novo methylated promoters that are shown in Figure 1F where an increase of DNA methylation is about ~1% on average? Another representative locus could be shown instead of this gene promoter.
Thanks so much for you detailed reminder. The inconsistency between the global methylation change and bisulfite sequencing analysis of Yy2, may be due to the details of methodologies, such C-T conversion efficiency, the number of picked colonies, etc. Since we have confirmed the presence of minor de novo DNA methylation using different publicly available data, to avoid ambiguity, we have removed this result in revised manuscript.
(3) Figures 2C and 3A: It would be helpful to mention what the arrowheads mean.
Thanks so much for you detailed reminder. In Figure 2C, the arrowhead indicates the H3k27me3 domain and the blank arrowhead indicates the blastomere without the H3k27me3 domain. In Figure 3A, the arrowhead indicates Xist RNA domain and the blank arrowhead indicates the blastomere without Xist RNA domain. We have added the information in the revised manuscript (Lines 736-738, 747-749 in the revised manuscript).
(4) Figure 3-figure supplement 2B: It would be hard to see whether H3K27me3 is enriched at the promoter regions of presented genes. It would be helpful to show the values for the Y-axis as in panel A.
Thanks for your helpful reminder. We have added the scales to the figure to improve the result presentation (Figure 4—figure supplement 2B in the revised manuscript).
(5) Figure 4-figure supplement 2: 5-aza-dC blocks not only the activity of DNMT3B but also DNMT1, and DNMT3A (all these DNMTs are expressed during pre-implantation embryos, see Hirasawa et al., 2007). This part can be omitted from the manuscript.
Thanks for your insightful comments. As you have mentioned above, the relevance and rationale for experiments using 5-aza-dC treatment should be clarified. 5-aza-dC is a well-established global DNA hypomethylating agent that efficiently inhibit the activity of all DNMTs, and thus has been frequently used to study the maintenance of DNA methylation and de novo DNA methylation (Maslov et al., 2012; Oka et al., 2005).
In our study, to validate the function of minor de novo DNA methylation in iXCI and blastocyst development, we take advantage of 5-aza-dC-induced DNMT inhibition, which allows us to transiently treated embryos specifically during the window of minor de novo DNA methylation (the 8-cell to blastocyst stage), despite its non-specificity to various DNMTs.
Based on these considerations, we hope to retain this result, and wish to get your understanding.
We have added these statements in the revised manuscript to make our experiments more rational and easier to be understood (Lines 183-188 in the revised manuscript) and added a schematic diagram depicting the experimental design (Figure 3—figure supplement 3E in the revised manuscript).
Reviewer #2 (Recommendations For The Authors):
Recommendations/concerns in the text:
- Line 106, it is unclear what is meant by "in line with this"? Gene body DNA methylation is a characteristic of active transcription, so why would a gain in DNA methylation at promoters be in line with a gain in DNA methylation over gene bodies?
Thank you so much for your comments that pointed out our ambiguous statement. We meant both the promoter and gene body regions, albeit accounting for small proportions, gain DNA methylation during the transition from the 8-cell to blastocyst stage. Based on the comment by Reviewer#1, since we have focused on the minor de novo methylation in promoter regions, to avoid confusion, the results of the gene body have been removed from the revised manuscript.
- Line 111 & 114, can 6% DNA methylation really be considered "relatively hypermethylated" compared to 3% DNA methylation that is referred to as "more hypomethylated"?
We apologize for our unclear and ambiguous statements. Here we focused on the promoter regions. Many previous studies have revealed that compared with gene bodies and other genome elements, promoter and overlapping CGI regions, especially high CpG promoters, always showed low levels of DNA methylation. We have added relevant statements to clarify this information, and rewritten the sentences in the revised manuscript (Lines 100-106, 116-118, 121, 124 in the revised manuscript).
- Line 124, there are a number of processes identified, why only mention one in the text? Suggest changing writing to be more accurate, indicating what was included for the GO analysis and using the words "enriched for ... processes". Saying it may be linked to a process is an overstatement and not supported by further experiments/data.
Thank you so much for your detailed comments that make our results more informative. We have checked the relevant description and addressed your suggestions as follows: By performing gene ontology enrichment analysis of genes that undergo minor or major de novo DNA methylation respectively, we noticed that besides of many important basic processes common to two waves of de novo DNA methylation, genes subject to minor de novo DNA methylation were enriched in processes such as organic substance transport, chromosome organization, and cell fate specification (Lines 129-134 in the revised manuscript).
- Lines 149 - 152: sentence/message unclear.
We apologize for the ambiguous description. We have corrected the relevant descriptions as follows: To identify the biological function of minor de novo DNA methylation in iXCI, we knocked down Dnmt3b in preimplantation embryos by microinjecting Dnmt3b siRNA into zygotes (Lines 234-236 in the revised manuscript).
- Lines 162-164: the data in Figure 2C/D does not support this statement, as it does not show H3K27me3 loss specifically at the inactive X-chromosome.
Thanks so much for your insightful comments. Despite the global enrichment of H3K27me3, the H3K27me3 domain detected by immunostaining is a classic marker for establishment of XCI by achieving X chromosome wide heterochromatinization of transcriptional depression (Chow and Heard, 2009; Heard et al., 2004; Huynh and Lee, 2005). Thus, we have used immunostaining for H3K27me3 domains to evaluate the iXCI establishment in the blastocysts, as previously reported (Fukuda et al., 2014; Gontan et al., 2018; Inoue et al., 2010; Tan et al., 2016). To make our results more convincing, we have added another statistical method to quantify the establishment of iXCI, i.e., the percentage of H3K27me3-positive and -negative trophoblast cells to total trophoblast cells in female blastocysts subject to Dnmt3b knockdown or not.
In addition, we have added a schematic diagram depicting the process of iXCI initiation and establishment, as well as the experimental design and work flows, to make the result easier to be understood.
In addition, we agree with your comments that additional evidence will benefit the conclusion. To strengthen the evidence, and test whether DNA methylation loss leads to a prolonged effect on iXCI, we have reanalyzed the RNA-seq and H3K27me3 CHIP-seq data in extraembryonic ectoderm (ExE) of E6.5 single embryos that underwent Dnm3a/3b knockout because preimplantation iXCI status maintains extraembryonic cells (Chen et al., 2019; Galupa and Heard, 2015; Schulz and Heard, 2013). The results showed that chromosome-wide loss of DNA methylation led to a nearly complete loss of H3k27me3 on paternal (specifically inactivated in iXCI), along with a notable transcriptional upregulation cross the chromosome. By contrast, these changes cannot be not observed on maternal X chromosome. (Lines 253-261; Figure 3—figure supplement 4A in the revised manuscript)
- Lines 169-174: sentence/message unclear.
As aforementioned, we have reorganized this paragraph by rewriting or adding relevant statements relevant to the DNA methylation and XCI, to make the background and discussion clearer and easier to be understood (Lines 217-234 in the revised manuscript). In addition, to avoid repeated statement and make our discussion more concise, we have removed the similar sentences at the end of this paragraph.
- Lines 177-179: this statement is too bold. The data does not support "direct evidence".
Thank you for your detailed reminder. We have rewritten the sentence to avoid confusion and overstatement (Lines 262-268 in the revised manuscript).
- Line 198: these are not all enzymes, but could be referred to as chromatin modifiers.
We apologize for the ambiguous description. As you suggested, we have corrected “enzymes” to “chromatin modifiers” (Lines 284, 287 in the revised manuscript).
- Line 199: this statement is not correct in all contexts. There are many studies showing antagonism between DNA methylation and H3K27me3.
Thanks so much for you careful reviewing. As you have pointed out, the relationship of DNA methylation and H3K27me3 are divergent and largely controversial among studies. Under certain circumstances, DNA methylation shows antagonistic effect to H3K27me3 at promoters, via excluding the binding of PRC2 (the main complex responsible for H3K27me3 deposition) components to their targets (Bartke et al., 2010; Jermann et al., 2014), while other studies have presented alternative evidence that PRC2 (the main complex responsible for H3K27me3 deposition) and DNA methylation cooperate to achieve silencing (Hagarman et al., 2013; Vire et al., 2006). Thus, it has been thought that the relationship between DNA and methylation and histone modifications is complex, possibly in a cell-type and/or genomic region-specific manner. Both antagonism and coordination can be observed in different regulatory elements in mouse ES cells (King et al., 2016).
We apologize our incomplete statement because we mainly focused on their synergistic relationship. We have refined this section by rewriting relevant sentences and adding necessary statements (Lines 288-303 in the revised manuscript).
- Lines 228-230: the developmental significance of DNA methylation homeostasis is already well-established. Please reference relevant papers showing this here.
Thank you for this helpful suggestion. We have reorganized this section. Relevant references that highlight the developmental significance of DNA methylation homeostasis have added. The sentence has been rewritten and moved to the end of this paragraph, in the revised manuscript (Lines 159-161 in the revised manuscript).
- Line 238: an explanation/rationale for looking at energy metabolism is lacking.
Thank you for your comments to make our results earlier to be understood. The detection of energy metabolism is mainly based on the integrated analysis of DNA methylation and gene expression from the 8-cell embryos to ICM, to test the potential short-and long-term developmental consequences of minor de novo DNA methylation. Bioinformatic analysis suggested that many basic processes, such as cell differentiation, cell cycle and metabolic regulation, may be regulated by minor de novo DNA methylation. Among the enriched genes, several are related energy metabolism. In addition, because energy metabolism is crucial for supporting embryo differentiation and development, and oxidative phosphorylation (OXPHOS) metabolism is highly activated during the blastocyst stage (Zhao et al., 2021), we next examined the energy metabolism, particularly OXPHOS activity, of Dnmt3b-KD embryos. We have refined the section by rewritten relevant sentence and added necessary statements (Lines 175-179 in the revised manuscript).
- Lines 246-248: Looking at the data in Figure 2 figure supplement 2, this statement is simply not true with regards to DNMT3B protein, and also global DNA methylation level is reduced in the Dnmt3b KD blastocyst, which could lead to defective major de novo DNA methylation.
Thanks for your careful reviewing, we have rewritten the sentence to make our statement more accurate and avoid overstatement (Lines 188-190 in the revised manuscript).
Recommendations/concerns relating to figures:
Figure 1:
- Of all genic promoters, how many were included in the analysis (contained sufficient coverage)? What cut-off/thresholds were used to consider DNA methylation gain at a promoter?
Thanks for your comments. In total, 11662 promoters were analyzed. Given that promoter methylation is generally at low level, particularly at the 8-cell stage at which minor de novo methylation is just initiated. The relatively lower basal levels make the increase before the blastocyst, seem considerably slight. To capture the slight changes, we have used the relaxed threshold based on ΔDNA methylation. Only CpG sites with at least fivefold coverage were included in the methylation analysis based on data from Smith et al. (Smith et al., 2012)., ΔDNA methylation greater or less than 0 was defined as gain or loss of DNA methylation. We have added this information in the revised manuscript (Lines 462-470 in the revised manuscript).
- Does an average methylation level of 0.02 represent 2% DNA methylation? Presuming yes, is the average 1.5% DNA methylation gain at promoters real? And meaningful? Especially compared to the gain in DNA methylation that takes place between ICM and E6.5 (Figure 1 Figure Supplement 1 D)
As you have pointed out, an average methylation level of 0.02 represent 2% DNA methylation. As aforementioned, promoters exhibited an average of 1.5% DNA methylation gain during the transition from 8-cell stage to ICM. The slight increase may be mainly due to the relatively lower basal levels. As you expected, compared with the comprehensive de novo DNA methylation during implantation, preimplantation de novo methylation occurs more slightly, at a small proportion of promoter regions, so designated it as minor de novo DNA methylation. It should be also mentioned that a proportion of these promoters continue to gain massive DNA methylation during implantation. We have refined the relevant sentences to provide more detailed information of our results (Lines 125-127 in the revised manuscript).
- Why is there a focus on promoters (which are not the preferential target of DNMT3B)?
Thanks so much for your detailed reminder. As you have pointed out, “preferential target” seems to be an inaccurate statement. besides of promoters, gene bodies and other elements also undergo de novo DNA methylation (Auclair et al., 2014; Dahlet et al., 2020; Duymich et al., 2016). We have focused on the promoter regions based on the following considerations: (1) Promoter regions are important target sites of DNMT3B (Choi et al., 2011); (2) The acquisition of DNA methylation in promoters, especially in intermediate and low CpG promoters, during implantation is largely dependent on DNMT3B and plays an important role in regulating developmental genes (Auclair et al., 2014; Borgel et al., 2010; Dahlet et al., 2020). We have rewritten the relevant sentence in the revised manuscript (Lines 100-106 in the revised manuscript).
- Figure 1H shows that promoters that gain DNA methylation during the "minor de novo DNA methylation" continue to gain DNA methylation during "de novo DNA methylation". Is the ~1.5% DNA methylation gain just the slow start of the main de novo DNA methylation wave?
Your comments is very helpful to improve the description of our results. In the present study, our analysis indicated that a small proportion of promoters initially gain methylation during the transition from the 8-cell to ICM. The finding challenges current knowledge: (1) de novo DNA methylation occurs during implantation, by which globally hypomethylated blastocysts acquire genome-wide DNA methylation (Borgel et al., 2010; Dahlet et al., 2020; Smith et al., 2012); (2) during preimplantation development, embryos undergo massive and global DNA demethylation.
To distinguish the current knowledge of the timing and dynamics of DNA methylation during the early development, we have designated our finding during the transition from the 8-cell to blastocyst stage, as minor de novo DNA methylation.
We agree with your notion that among the promoters undergoing minor de novo methylation, most of them continue to gain DNA methylation during implantation, as revealed in Fig. 1F. We have added refine the relevant statement in revised manuscript (Lines 125-127 in the revised manuscript).
- The GO analysis performed for Figure 1H, what was used as input? Promoters of genes that gain DNA methylation as identified in 1C?
Thank you for your comments. For the GO analysis shown in Figure 1H, we used genes with promoter regions that gained or lost DNA methylation during the transition from the 8-cell to ICM respectively (identified in Figure 1C, as input), respectively. This information has been clarified in the revised manuscript to ensure accuracy (Lines 129-134 in the revised manuscript).
- Figure 1 figure supplement 1, is there only a fold change as threshold or also a calculated significance (eg. p-value/FDR)?
Thanks for your valuable comments. Considering the relatively low DNA methylation levels at promoter regions, and the slightly changes occurring during the preimplantation embryo development, we used the relaxed threshold based on ΔDNA methylation. Only CpG sites with at least fivefold coverage were included in the methylation analysis based on data from Smith et al. (Smith et al., 2012), ΔDNA methylation greater or less than 0 was defined as gain or loss of DNA methylation. We have replaced relevant figures and added this information in the revised manuscript (Figure 1—figure supplement 1D-E; Lines 125-127 in the revised manuscript).
- To confirm DNMT3B is responsible for the DNA methylation gain: DNMT3B KD/KO followed by promoter DNA methylation analysis to confirm the promoters that gain DNA methylation between 8 cell and ICM don't gain DNA methylation in the absence of DNMT3B.
We agree with your comments that additional evidence will benefit the conclusion. To strengthen the evidence, we have reanalyzed the RNA-seq and H3K27me3 CHIP-seq data in extraembryonic ectoderm (ExE) of E6.5 single embryos that underwent Dnm3a/3b knockout because preimplantation iXCI status maintains extraembryonic cells (Chen et al., 2019; Galupa and Heard, 2015; Schulz and Heard, 2013). The results showed that chromosome-wide loss of DNA methylation led to a nearly complete loss of H3k27me3 on paternal (specifically inactivated in iXCI), which showed a notable transcriptional upregulation cross the chromosome. By contrast, these changes cannot be not observed on maternal X chromosome. We have added this result in the revised manuscript (Lines 253-261; Figure 3—figure supplement 4A in the revised manuscript).
Figure 2:
- Figure 2A: label missing for what the numbers on the y-axis represent.
Thank you for pointing this out. We apologize for the oversight. We have added the label of y-axis in Figure 2A to clarify what the numbers represent, making it easier to be understood (Figure 3A in the revised manuscript).
- Figure 2B: y-axis is % of methylated promoters compared to all promoters?
Thank you for your suggestion. The y-axis in Figure 2B indeed represents the percentage of de novo methylated promoters relative to all promoters. As you have suggested, we have clarified this labeling in the revised manuscript (Figure 3B in the revised manuscript).
- What is the delta DNA methylation gain specifically for X-linked promoters?
Thanks so much for your reminder. To provide more convincing evidence. We have reanalyzed a single cell COOL-seq data, we also specifically reanalyzed the DNA methylation changes on the X chromosomal promoter in female embryos. The X chromosome showed a more notable increase in the de novo methylated promoters than that on autosomes, and the female X chromosome showed higher DNA methylation levels than that of the male (Figure 3—figure supplement 2A-B; Lines 203-206 in the revised manuscript).
- Figure 2C: include representative images of separate channels to better see the signal of CDX2 and H3K27me3. Quantification would be better represented with box plots.
Thank you for your helpful suggestions. We have added separate channel images in the revised manuscript. Additionally, we have adjusted the quantification to be represented as box plots, as you have suggested, to improve the accuracy and interpretability of the data presentation (Figure 3D-F in the revised manuscript).
- Figure 2C: Does the H3K27me3 signal overlap with the location of the inactive X-chromosome (is there maybe denser DAPI or do IF combined with Xist RNA-FISH)?
Thanks so much for your insightful comments. Despite the global enrichment of H3K27me3, the H3K27me3 domain detected by immunostaining is a classic marker for establishment of XCI by achieving X chromosome wide heterochromatinization of transcriptional depression (Chow and Heard, 2009; Heard et al., 2004; Huynh and Lee, 2005). Thus, we have used immunostaining for H3K27me3 domains to evaluate the iXCI establishment in the blastocysts, as previously reported (Fukuda et al., 2014; Gontan et al., 2018; Inoue et al., 2010; Tan et al., 2016). We have taken effort to perform co-staining of H3K27me3 IF and Xist FISH, but was hindered by the technical challenge, we wish to get your understanding. However, as we aforementioned, H3K27me3 is a well-accepted maker to clarify the XCI status.
In addition, to make our results more convincing, we have added an alternative statistical method to quantify the establishment of iXCI, i.e., the percentage of H3K27me3-positive and -negative trophoblast cells to total trophoblast cells in female blastocysts subject to Dnmt3b knockdown or not (Figure 3F; Lines 243-244 in the revised manuscript)
- Figure 2 figure supplement 2A: relative expression of Dnmt3b?
Thanks for your detailed reminder. The data represent the relative expression level of Dnmt3b, as noted in the original figure legend. Based on your comments, we have added the gene name in the label of the Y-axis. Similarly, the protein name has been also added to make the results more informative (Figure 2 figure supplement 2A, C, E in the revised manuscript).
- Figure 2 figure supplement 2B/C: in the text, line 153, it is stated that "Dnmt3b mRNA and protein levels were significantly reduced in morulae, but not in blastocysts compared to those of negative control (NC) group". These figures do not support that statement. The IF images show a loss of DNMT3B in the Dnmt3b KD blastocysts. The IF quantification seems to have fewer datapoints for the blastocyst, and looking at the bar graphs, there seems to be a trend towards reduced DNMT3B in both the morula and blastocyst, which would also explain the reduction in DNA methylation in both stages as shown in Figure 2 figure supplement 2D/E.
Thanks so much for your careful reviewing that makes our statements more accurate. We have rewritten the sentence in the revised manuscript as follows: Dnmt3b mRNA and protein levels were significantly reduced in morulae, and tended to be lower in blastocysts compared to those of the negative control (NC) group. In addition, we have removed “transient” from the original statement “The transient inhibition of Dnmt3b” (Lines 168-170 in the revised manuscript).
- Figure 2 figure supplement 2F/G: include representative IF images with separation of all channels and the merged image.
Thank you for your suggestion. We have added the representative immunofluorescence (IF) images with separate channels and merged image in the revised manuscript (Figure 3—figure supplement 3B, F in the revised manuscript).
- Figure 2 figure supplement 2H: Instead of showing log2FC in methylation levels, delta methylation would be more informative. Are these genes already inactivated at the 8-cell stage? Or are they active and become inactivated by the gain in DNA methylation? Doing qPCR for these genes, or looking at published RNAseq data would be informative. What happens to the expression of these genes in the Dnmt3b KD?
Thanks for your suggestions. We have represented DNA methylation changes as “ΔDNA methylation”. During mouse preimplantation development, iXCI is initiated in earlier cleavage female embryos dependent on Xist upregulation around 4-8-cell stage, and then Xist specifically coats paternal X chromosome and finally leads to chromosome-wide silencing via heterochromatinization in early blastocysts. Thus, these non-escaping genes, which are subject to XCI, would not be inactivated at 8-cell stage
Author response image 1.
The processes of iXCI initiation and establishment (left panel), and dynamics of total expression levels of X chromosome in male and female preimplantation embryos (right panel, note that X-dosage is balanced between sexes until the early blastocyst stage).
As you expected, most of these representative non-escaping is downregulated upon the transition of 8-cell to blastocyst stage, consistent with their gain of DNA methylation. Additionally, since preimplantation iXCI status maintains extraembryonic cells (Galupa and Heard, 2015; Schulz and Heard, 2013), we further reanalyzed the published RNA-seq data in extraembryonic ectoderm (ExE) of E6.5 single embryos that underwent DNA methyltransferase knockout (Chen et al., 2019). The results showed that chromosome-wide loss of DNA methylation led to a chromosome-wide transcriptional upregulation, including the locus of these non-escaping genes, on paternal X chromosome. We have added this result in the revised manuscript (Figure 3—figure supplement 3J; Figure 3—figure supplement 4A-B; Lines 253-261 in the revised manuscript).
Figure 3:
- Figure 3 figure supplement 1: representative IF image missing.
Thanks for your kind reminder. We have added the representative IF images in the revised manuscript to provide a clearer illustration of the data (Figure 4—figure supplement 1A in the revised manuscript).
- Figure 3 figure supplement 2B: scales are missing for the H3K27me3 ChIP-seq data (are the 8-cell and ICM tracks set to the same scale?). It looks like the ICM track is cut off at the top (peaks not fully displayed) and the data looks very sparse. A more informative analysis would be to do peak calling over promoters and compare 8-cell with ICM.
Thanks for your detailed reminder. We apologize for the missing of scale bars in the H3K27me3 ChIP-seq data. The 8-cell and ICM tracks were set to the same scale, and we have now added scales to the figure in the revised manuscript to improve the result presentation. As you have speculated, the visual effect of the flatted peak is not caused by track cutting off, but rather by zooming into a specific region in the extended IGV files.
These results are based on the reanalysis of publicly available data of pooled embryos, which just provided suggestive but not direct evidence to support the role of DNA methylation in promoting X-linked H3K27me3 enrichment in iXCI.
To provide more convincing evidence. we have reanalyzed the RNA-seq and H3K27me3 CHIP-seq data in extraembryonic ectoderm (ExE) of E6.5 female embryos that underwent Dnmt3a/3b knockout because preimplantation iXCI status maintains extraembryonic cells (Chen et al., 2019; Galupa and Heard, 2015; Schulz and Heard, 2013). The results showed that Dnmt knockout led to a nearly complete loss of H3k27me3 on paternal (specifically inactivated in iXCI), which showed a notable transcriptional upregulation cross the chromosome. By contrast, these changes cannot be not observed on maternal X chromosome (Figure 3—figure supplement 4 in the revised manuscript). We have added these results in the revised manuscript.
- Figure 3E: Given all tested proteins give a positive signal, it would have been good to include a negative control chromatin protein that is known to not interact with DNMT3B. Given both PRC2 and DNMT3B are chromatin-binding proteins, can the signal be a result of close proximity instead of a direct interaction?
In the present study, to test the interaction between DNMT3B and PRC2 core components, we have used in situ proximity ligation assay (PLA), an increasingly popular technique for detecting the close proximity of two proteins in fixed samples using two primary antibodies (Alsemarz et al., 2018).
Author response image 2.
Schematic diagram of the principle of the in situ PLA.
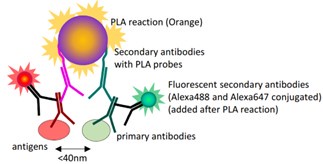
Compared with classical co-Immunoprecipitation (Co-IP) method, in situ PLA has advantages in (1) detecting low input samples or proteins expressed at low levels, which is extremely difficult using Co-IP; (2) providing in situ or subcellular information of protein-protein interaction. However, it should be noted that the maximal distance allowing this reaction is 40 nm, which is not quite small enough to demonstrate a physical interaction between the two antigens, but sufficient to support a very close “proximity”.
In our study, in situ PLA, including the experimental design of negative control, was performed in the accordance with the manufacturer’s instruction of Duolink® In Situ Red Starter Kit (MilliporeSigma): “Technical negative controls included incubation with each primary antibody separately and no primary antibody”. We have refined the relevant sentence in the revised manuscript (Lines 308-310 in the revised manuscript)
- Figure 3G: It would have been good to include a negative control, and DNase/benzonase to exclude DNA/RNA-mediated protein interaction.
- (Of note, there have been previous studies reporting an interaction between PRC2 and DNMT3B in other cell types, such as in Weigert et al. 2023, but unfortunately, they don't seem to use DNase/benzonase either).
The Co-IP analysis of DNMT3B and PRC2 core components in differentiated female ES cells was presented as additional supportive evidence. Because the Co-IP analysis is extremely difficult for preimplantation embryos, we have used in situ PLA to detect their interaction. However, the maximal distance allowing in situ PLA reaction is 40 nm, which is not quite small enough to demonstrate a physical interaction (Alsemarz et al., 2018). Thus, we have added a Co-IP analysis using differentiated female ES cells, in which rXCI occurs upon the differentiation.
Based on this consideration of the importance and contribution of this result, we have moved this result from the main figure, to the supplemental figure (Figure 4—figure supplement 3H in the revised manuscript).
- Figure 3 figure supplement 3G: what were the ESCs differentiated into? Did the Dnmt3b KO or Dnmt3a/b DKO show any differentiation defect?
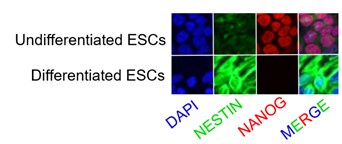
The mouse ESC line PGK12.1 was a well-established ex vivo model of rXCI. Under the standard culture condition, PGK12.1 is normally fated to neuroectodermal commitment.
Author response image 3.
Immunostaining of NESTIN, a neuroectodermal stem cell marker molecule, and NANOG in undifferentiated and differentiated PGK12.1 ESCs respectively.
No differentiation defects have been observed in either Dnmt3b KO or Dnmt3a/3b DKO ESCs in our study. Dnmt KO/DKO/TKO ES cell lines have been successfully used as the model of interaction of DNA methylation and H3K27me3 deposition (King et al., 2016).
Figure 4:
- Figure 4B: Is there an explanation for seeing similar total cell numbers in Figure 4B, but showing decreased proliferation in Figure 4A?
Thank you for your insightful comments. The EdU cell proliferation assays labels cells during the S phase of cell cycle, as the 5-ethynyl 2´-deoxyuridine (EdU) is incorporated into newly synthesized DNA. This labeling identifies cells undergoing DNA synthesis, but these cells may not have completed mitosis at the time of detection. As a result, the total cell number may not immediately reflect the decrease in proliferation observed in the treated group. To address this point, we have rewritten the sentences in the revised manuscript (Lines 174-175 in the revised manuscript).
References
Alsemarz, A., Lasko, P. and Fagotto, F. J. B. (2018). Limited significance of the in situ proximity ligation assay. bioRxiv, 411355.
Auclair, G., Guibert, S., Bender, A. and Weber, M. (2014). Ontogeny of CpG island methylation and specificity of DNMT3 methyltransferases during embryonic development in the mouse. Genome Biol. 15, 545.
Balaton, B. P. and Brown, C. J. (2021). Contribution of genetic and epigenetic changes to escape from X-chromosome inactivation. Epigenetics Chromatin 14, 30.
Bartke, T., Vermeulen, M., Xhemalce, B., Robson, S. C., Mann, M. and Kouzarides, T. (2010). Nucleosome-interacting proteins regulated by DNA and histone methylation. Cell 143, 470-484.
Borgel, J., Guibert, S., Li, Y., Chiba, H., Schubeler, D., Sasaki, H., Forne, T. and Weber, M. (2010). Targets and dynamics of promoter DNA methylation during early mouse development. Nat. Genet. 42, 1093-1100.
Chen, Z., Yin, Q., Inoue, A., Zhang, C. and Zhang, Y. (2019). Allelic H3K27me3 to allelic DNA methylation switch maintains noncanonical imprinting in extraembryonic cells. Sci Adv 5, eaay7246.
Chiba, H., Hirasawa, R., Kaneda, M., Amakawa, Y., Li, E., Sado, T. and Sasaki, H. (2008). De novo DNA methylation independent establishment of maternal imprint on X chromosome in mouse oocytes. Genesis 46, 768-774.
Choi, S. H., Heo, K., Byun, H. M., An, W., Lu, W. and Yang, A. S. (2011). Identification of preferential target sites for human DNA methyltransferases. Nucleic Acids Res. 39, 104-118.
Chow, J. and Heard, E. (2009). X inactivation and the complexities of silencing a sex chromosome. Curr. Opin. Cell Biol. 21, 359-366.
Dahlet, T., Argueso Lleida, A., Al Adhami, H., Dumas, M., Bender, A., Ngondo, R. P., Tanguy, M., Vallet, J., Auclair, G., Bardet, A. F., et al. (2020). Genome-wide analysis in the mouse embryo reveals the importance of DNA methylation for transcription integrity. Nat Commun 11, 3153.
Duymich, C. E., Charlet, J., Yang, X. J., Jones, P. A. and Liang, G. N. (2016). DNMT3B isoforms without catalytic activity stimulate gene body methylation as accessory proteins in somatic cells. Nat Commun 7, 11453.
Fukuda, A., Tomikawa, J., Miura, T., Hata, K., Nakabayashi, K., Eggan, K., Akutsu, H. and Umezawa, A. (2014). The role of maternal-specific H3K9me3 modification in establishing imprinted X-chromosome inactivation and embryogenesis in mice. Nat Commun 5, 5464.
Galupa, R. and Heard, E. (2015). X-chromosome inactivation: new insights into cis and trans regulation. Curr. Opin. Genet. Dev. 31, 57-66.
Gontan, C., Mira-Bontenbal, H., Magaraki, A., Dupont, C., Barakat, T. S., Rentmeester, E., Demmers, J. and Gribnau, J. (2018). REX1 is the critical target of RNF12 in imprinted X chromosome inactivation in mice. Nat Commun 9, 4752.
Hagarman, J. A., Motley, M. P., Kristjansdottir, K. and Soloway, P. D. (2013). Coordinate regulation of DNA methylation and H3K27me3 in mouse embryonic stem cells. PLoS One 8, e53880.
Heard, E., Chaumeil, J., Masui, O. and Okamoto, I. (2004). Mammalian X-chromosome inactivation: an epigenetics paradigm. Cold Spring Harb. Symp. Quant. Biol. 69, 89-102.
Huynh, K. D. and Lee, J. T. (2005). X-chromosome inactivation: a hypothesis linking ontogeny and phylogeny. Nat. Rev. Genet. 6, 410-418.
Inoue, A., Jiang, L., Lu, F. and Zhang, Y. (2017). Genomic imprinting of Xist by maternal H3K27me3. Genes Dev. 31, 1927-1932.
Inoue, K., Kohda, T., Sugimoto, M., Sado, T., Ogonuki, N., Matoba, S., Shiura, H., Ikeda, R., Mochida, K., Fujii, T., et al. (2010). Impeding Xist expression from the active X chromosome improves mouse somatic cell nuclear transfer. Science 330, 496-499.
Jermann, P., Hoerner, L., Burger, L. and Schubeler, D. (2014). Short sequences can efficiently recruit histone H3 lysine 27 trimethylation in the absence of enhancer activity and DNA methylation. Proc. Natl. Acad. Sci. U. S. A. 111, E3415-3421.
King, A. D., Huang, K., Rubbi, L., Liu, S., Wang, C. Y., Wang, Y., Pellegrini, M. and Fan, G. (2016). Reversible Regulation of Promoter and Enhancer Histone Landscape by DNA Methylation in Mouse Embryonic Stem Cells. Cell Rep. 17, 289-302.
Maslov, A. Y., Lee, M., Gundry, M., Gravina, S., Strogonova, N., Tazearslan, C., Bendebury, A., Suh, Y. and Vijg, J. (2012). 5-aza-2'-deoxycytidine-induced genome rearrangements are mediated by DNMT1. Oncogene 31, 5172-5179.
Oikawa, M., Inoue, K., Shiura, H., Matoba, S., Kamimura, S., Hirose, M., Mekada, K., Yoshiki, A., Tanaka, S., Abe, K., et al. (2014). Understanding the X chromosome inactivation cycle in mice: a comprehensive view provided by nuclear transfer. Epigenetics-Us 9, 204-211.
Oka, M., Meacham, A. M., Hamazaki, T., Rodic, N., Chang, L. J. and Terada, N. (2005). De novo DNA methyltransferases Dnmt3a and Dnmt3b primarily mediate the cytotoxic effect of 5-aza-2'-deoxycytidine. Oncogene 24, 3091-3099.
Pintacuda, G. and Cerase, A. (2015). X Inactivation Lessons from Differentiating Mouse Embryonic Stem Cells. Stem Cell Rev Rep 11, 699-705.
Schulz, E. G. and Heard, E. (2013). Role and control of X chromosome dosage in mammalian development. Curr. Opin. Genet. Dev. 23, 109-115.
Smith, Z. D., Chan, M. M., Mikkelsen, T. S., Gu, H. C., Gnirke, A., Regev, A. and Meissner, A. (2012). A unique regulatory phase of DNA methylation in the early mammalian embryo. Nature 484, 339-344.
Tada, T., Obata, Y., Tada, M., Goto, Y., Nakatsuji, N., Tan, S., Kono, T. and Takagi, N. (2000). Imprint switching for non-random X-chromosome inactivation during mouse oocyte growth. Development 127, 3101-3105.
Tan, K., An, L., Miao, K., Ren, L., Hou, Z., Tao, L., Zhang, Z., Wang, X., Xia, W., Liu, J., et al. (2016). Impaired imprinted X chromosome inactivation is responsible for the skewed sex ratio following in vitro fertilization. Proc. Natl. Acad. Sci. U. S. A. 113, 3197-3202.
Vire, E., Brenner, C., Deplus, R., Blanchon, L., Fraga, M., Didelot, C., Morey, L., Van Eynde, A., Bernard, D., Vanderwinden, J. M., et al. (2006). The Polycomb group protein EZH2 directly controls DNA methylation. Nature 439, 871-874.
Zhao, J., Yao, K., Yu, H., Zhang, L., Xu, Y., Chen, L., Sun, Z., Zhu, Y., Zhang, C., Qian, Y., et al. (2021). Metabolic remodelling during early mouse embryo development. Nat Metab 3, 1372-1384.


