Peer review process
Revised: This Reviewed Preprint has been revised by the authors in response to the previous round of peer review; the eLife assessment and the public reviews have been updated where necessary by the editors and peer reviewers.
Read more about eLife’s peer review process.Editors
- Reviewing EditorAdrien PeyracheMcGill University, Montreal, Canada
- Senior EditorJohn HuguenardStanford University School of Medicine, Stanford, United States of America
Reviewer #1 (Public review):
This study presents evidence that a special group of place cells, those tuned to fast-gamma oscillations, play a key role in theta sequence development. How theta sequences are formed and developed during experience is an important question, because these sequences have been implicated in several cognitive functions of place cells, including memory-guided spatial navigation. The revised version of this paper has been significantly improved. Major concerns in the previous round of review on technical and conceptual aspects of the relationship between gamma oscillations and theta sequences are addressed. The main conclusion is supported by the data presented.
Reviewer #2 (Public review):
This manuscript addresses an important question which has not yet been solved in the field, what is the contribution of different gamma oscillatory inputs to the development of "theta sequences" in the hippocampal CA1 region. Theta sequences have received much attention due to their proposed roles in encoding short-term behavioral predictions, mediating synaptic plasticity, and guiding flexible decision making. Gamma oscillations in CA1 offer a readout of different inputs to this region and have been proposed to synchronize neuronal assemblies and modulate spike timing and temporal coding. However, the interactions between these two important phenomena have not been sufficiently investigated. The authors conducted place cell and local field potential (LFP) recordings in the CA1 region of rats running on a circular track. They then analyzed the phase locking of place cell spikes to slow and fast gamma rhythms, the evolution of theta sequences during behavior and the interaction between these two phenomena. They found that place cell with the strongest modulation by fast gamma oscillations were the most important contributors to the early development of theta sequences and that they also displayed a faster form of phase precession within slow gamma cycles nested with theta. The results reported are interesting and support the main conclusions of the authors. However, the manuscript needs significant improvement in several aspects regarding data analysis, description of both experimental and analytical methods and alternative interpretations, as I detail below.
• The experimental paradigm and recordings should be explained at the beginning of the Results section. Right now, there is no description whatsoever which makes it harder to understand the design of the study.
• An important issue that needs to be addressed is the very small fraction of CA1 cells phased-locked to slow gamma rhythms (3.7%). This fraction is much lower than in many previous studies, that typically report it in the range of 20-50 %. However, this discrepancy is not discussed by the authors. This needs to be explained and additional analysis considered. One analysis that I would suggest, although there are also other valid approaches, is to, instead of just analyze the phase locking in two discrete frequency bands, to compute the phase locking will all LFP frequencies from 25-100 Hz. This will offer a more comprehensive and unbiased view of the gamma modulation of place cell firing. Alternative metrics to mean vector length that are less sensitive to firing rates, such as pairwise phase consistency index (Vinck et a., Neuroimage, 2010), could be implemented. This may reveal whether the low fraction of phase locked cells could be due to a low number of spikes entering the analysis.
• From the methods, it is not clear to me whether the reference LFP channel was consistently selected to be a different one that where the spikes analyzed were taken. This is the better practice to reduce the contribution of spike leakage that could substantially inflate the coupling with faster gamma frequencies. These analyses need to be described in more detail.
• The initial framework of the authors of classifying cells into fast gamma and not fast gamma modulated implies a bimodality that may be artificial. The authors should discuss the nuances and limitations of this framework. For example, several previous work has shown that the same place cell can couple to different gamma oscillations (e.g., Lastoczni et al., Neuron, 2016; Fernandez-Ruiz et al., Neuron, 2017; Sharif et al., Neuron,2021).
• It would be useful to provide a more through characterization of the physiological properties of FG and NFG cells, as this distinction is the basis of the paper. Only very little characterization of some place cell properties is provided in Figure 5. Important characteristics that should be very feasible to compare include average firing rate, burstiness, estimated location within the layer (i.e., deep vs superficial sublayers) and along the transverse axis (i.e., proximal vs distal), theta oscillation frequency, phase precession metrics (given their fundamental relationship with theta sequences), etc.
• It is not clear to me how the analysis in Figure 6 was performed. In Fig. 6B I would think that the grey line should connect with the bottom white dot in the third panel, which would the interpretation of the results.
Comments on revisions:
The authors have conducted new analysis to address the issues I and the other reviewers raised in our original revision. As a result, the revised manuscript has been substantially improved.
Author response:
The following is the authors’ response to the original reviews.
Public Reviews:
Reviewer #1 (Public Review):
Hippocampal place cells display a sequence of firing activities when the animal travels through a spatial trajectory at a behavioral time scale of seconds to tens of seconds. Interestingly, parts of the firing sequence also occur at a much shorter time scale: ~120 ms within individual cycles of theta oscillation. These so-called theta sequences are originally thought to naturally result from the phenomenon of theta phase precession. However, there is evidence that theta sequences do not always occur even when theta phase precession is present, for example, during the early experience of a novel maze. The question is then how they emerge with experience (theta sequence development). This study presents evidence that a special group of place cells, those tuned to fast-gamma oscillations, may play a key role in theta sequence development.
The authors analyzed place cells, LFPs, and theta sequences as rats traveled a circular maze in repeated laps. They found that a group of place cells were significantly tuned to a particular phase of fast-gamma (FG-cells), in contrast to others that did not show such tunning (NFG-cells). The authors then omitted FG-cells or the same number of NFG-cells, in their algorithm of theta sequence detection and found that the quality of theta sequences, quantified by a weighted correlation, was worse with the FG-cell omission, compared to that with the NFG-cell omission, during later laps, but not during early laps. What made the FG-cells special for theta sequences? The authors found that FG-cells, but not NFG-cells, displayed phase recession to slow-gamma (25 - 45 Hz) oscillations (within theta cycles) during early laps (both FG- and NFG-cells showed slow-gamma phase precession during later laps). Overall, the authors conclude that FG-cells contribute to theta sequence development through slow-gamma phase precession during early laps.
How theta sequences are formed and developed during experience is an important question, because these sequences have been implicated in several cognitive functions of place cells, including memory-guided spatial navigation. The identification of FG-cells in this study is straightforward. Evidence is also presented for the role of these cells in theta sequence development. However, given several concerns elaborated below, whether the evidence is sufficiently strong for the conclusion needs further clarification, perhaps, in future studies.
We thank the reviewer for these positive comments.
(1) The results in Figure 3 and Figure 8 seems contradictory. In Figure 8, all theta sequences displayed a seemingly significant weighted correlation (above 0) even in early laps, which was mostly due to FG-cell sequences but not NFG-cell sequences (correlation for NFG-sequences appeared below 0). However, in Figure 3H, omitting FG-cells and omitting NFG-cells did not produce significant differences in the correlation. Conversely, FG-cell and NFG-cell sequences were similar in later laps in Figure 8 (NFG-cell sequences appeared even better than FG-cell sequences), yet omitting NFG-cells produced a better correlation than omitting FG-cells. This confusion may be related to how "FG-cell-dominant sequences" were defined, which is unclear in the manuscript. Nevertheless, the different results are not easy to understand.
We thank the reviewer for pointing out this important problem. The potential contradictory can be interpreted by different sequence dataset included in Fig3 and Fig8, described as follows.
(1) In Fig 3, all sequences decoded without either FG or NFG cells were included, defined as exFG-sequences and exNFG sequences, so that we couldn’t observe sequence development at early phase and thus the weighted correlation was low. (2) In Fig8, however, the sequences with either FG or NFG cells firing across at least 3 slow gamma cycles were included, defined as FG-cell sequences and NFG-cell sequences. This criterion ensures to investigate the relationship between sequence development and slow gamma phase precession, so that these sequences were contributed by cells likely to show slow gamma phase precession. These definitions have been updated to the “Theta sequences detection” section of the Methods (Line 606-619).
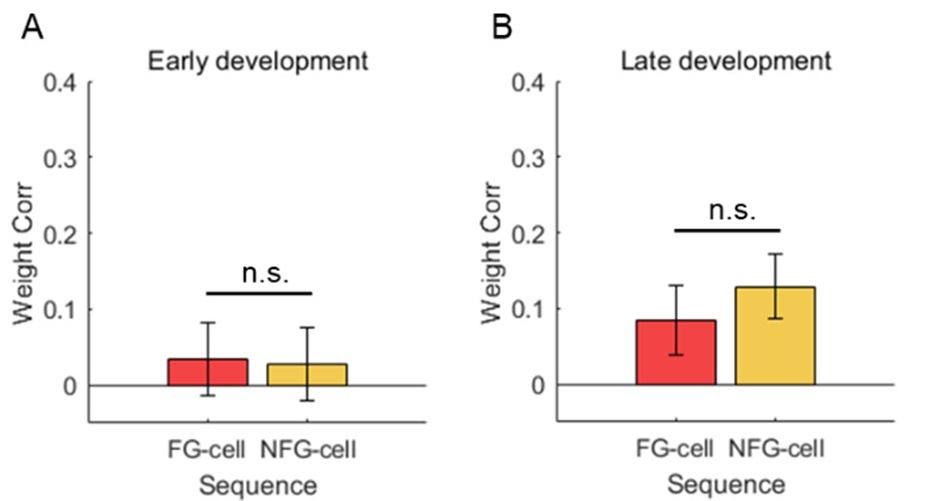
At early phase, there’s still no difference of weighted correlation between FG-cell sequences and NFG-cell sequences (Author response image 1A, Student’s t test, t(65)=0.2, p=0.8, Cohen's D=0.1), but the FG-cell sequences contained high proportion of slow gamma phase precession (Fig8F). At late phase, both FG-cell sequences and NFG-cell sequences exhibited slow gamma phase precession, so that their weighted correlation were high with no difference (Author response image 1B, Student’s t test, t(62)=-1.1, p=0.3, Cohen's D=0.3). This result further indicates that the theta sequence development requires slow gamma phase precession, especially for FG cells during early phase.
Author response image 1.
(2) The different contributions between FG-cells and NFG-cells to theta sequences are supposed not to be caused by their different firing properties (Figure 5). However, Figure 5D and E showed a large effect size (Cohen's D = 07, 0.8), although not significant (P = 0.09, 0.06). But the seemingly non-significant P values could be simply due to smaller N's (~20). In other parts of the manuscript, the effect sizes were comparable or even smaller (e.g. D = 0.5 in Figure 7B), but interpreted as positive results: P values were significant with large N's (~480 in Fig. 7B). Drawing a conclusion purely based on a P value while N is large often renders the conclusion only statistical, with unclear physical meaning. Although this is common in neuroscience publications, it makes more sense to at least make multiple inferences using similar sample sizes in the same study.
We thank the reviewer for this kind suggestion. We made multiple inferences using similar sample sizes as much as possible. In Fig7B, we did the statistical analysis with sessions as samples, and we found the significant conclusion was maintained. These results have been updated to the revised manuscript (Lines 269-270).and the Fig7B has been replaced correspondingly.
(3) In supplementary Figure 2 - S2, FG-cells displayed stronger theta phase precession than NFG-cells, which could be a major reason why FG-cells impacted theta sequences more than NFG cells. Although factors other than theta phase precession may contribute to or interfere with theta sequences, stronger theta phase precession itself (without the interference of other factors), by definition, can lead to stronger theta sequences.
This is a very good point. The finding that FG-cells displayed stronger theta phase precession than NFG-cells was consistent with the finding of Guardamagna et al., 2023 Cell Rep, that the theta phase precession pattern emerged with strong fast gamma. Since slow gamma phase precession occurred within theta cycles, it is hard to consider the contribution of these factors to theta sequences development, without taking theta phase precession into account. But one should be noted that the theta sequences could not be developed even if theta phase precession existed from the very beginning of the exploration (Feng et al., 2025 J Neurosci). These findings suggest that theta phase precession, together with other factors, impact theta sequence development. However, the weight of each factor and their interaction still need to be further investigated. We have discussed this possibility in the Discussion section (Lines 361- 373).
(4) The slow-gamma phase precession of FG-cells during early laps is supposed to mediate or contribute to the emergence of theta sequences during late laps (Figure 1). The logic of this model is unclear. The slow-gamma phase precession was present in both early and late laps for FG-cells, but only present in late laps for NFG-cells. It seems more straightforward to hypothesize that the difference in theta sequences between early and later laps is due to the difference in slow-gamma phase precession of NFG cells between early and late laps. Although this is not necessarily the case, the argument presented in the manuscript is not easy to follow.
We thank the reviewer for pointing this out. The slow gamma phase precession was first found in my previous publication (Zheng et al., 2016 Neuron), which indicates a temporally compressed manner for coding spatial information related to memory retrieval. In this case, we would expect that slow gamma phase precession occurred in all cells during late laps, because spatial information was retrieved when rats have been familiar with the environment. However, during early laps when novel information was just encoded, there would be balance between fast gamma and slow gamma modulation of cells for upcoming encoding-retrieval transition. A possibility is that FG-cells support this balance by receiving modulation of both fast gamma and slow gamma, but with distinct phase-coding modes (fast gamma phase locking and slow gamma phase precession) in a temporally coordinated manner. We have discussed this possibility in the Discussion section (Lines 415- 428).
(5) There are several questions on the description of methods, which could be addressed to clarify or strengthen the conclusions.
(i) Were the identified fast- and slow-gamma episodes mutually exclusive?
Yes, the fast- and slow-gamma episodes are mutually exclusive. We have added descriptions in the “Detection of gamma episodes” section in the Methods part (Lines 538-550).
(ii) Was the task novel when the data were acquired? How many days (from the 1st day of the task) were included in the analysis? When the development of the theta sequence was mentioned, did it mean the development in a novel environment, in a novel task, or purely in a sense of early laps (Lap 1, 2) on each day?
We thank the reviewer for pointing this out. The task was not novel to rats in this dataset, because only days with good enough recording quality for sequence decoding were included in this paper, which were about day2-day10 for each rat. However, we still observed the process of sequence formation because of the rat’s exploration interest during early laps. Thus, when the development of the theta sequence was mentioned, it meant a sense of early laps on each day.
(iii) How were the animals' behavioral parameters equalized between early and later laps? For example, speed or head direction could potentially produce the differences in theta sequences.
This is a very good point. In terms of the effect of running speed on theta sequences, we quantified the running speeds during theta sequences across trials 1-5. We found that the rats were running at stable running speed, which has been reported in Fig.3F. In terms of the effect of head direction on theta sequences, we measured the angle difference between head direction and running direction. We found that the angle difference for each lap was distributed around 0, with no significant difference across laps (Fig.S3, Watson-Williams multi-sample test, F(4,55)=0.2, p=0.9, partial η2= 0.01). These results indicate that the differences in theta sequences across trials cannot be interpreted by the variability of behavioral parameters. We have updated these results and corresponding methods in the revised manuscript (Lines 172-175, Lines 507-511, with a new Fig.S3).
Reviewer #2 (Public Review):
This manuscript addresses an important question that has not yet been solved in the field, what is the contribution of different gamma oscillatory inputs to the development of "theta sequences" in the hippocampal CA1 region? Theta sequences have received much attention due to their proposed roles in encoding short-term behavioral predictions, mediating synaptic plasticity, and guiding flexible decision-making. Gamma oscillations in CA1 offer a readout of different inputs to this region and have been proposed to synchronize neuronal assemblies and modulate spike timing and temporal coding. However, the interactions between these two important phenomena have not been sufficiently investigated. The authors conducted place cell and local field potential (LFP) recordings in the CA1 region of rats running on a circular track. They then analyzed the phase locking of place cell spikes to slow and fast gamma rhythms, the evolution of theta sequences during behavior, and the interaction between these two phenomena. They found that place cells with the strongest modulation by fast gamma oscillations were the most important contributors to the early development of theta sequences and that they also displayed a faster form of phase precession within slow gamma cycles nested with theta. The results reported are interesting and support the main conclusions of the authors. However, the manuscript needs significant improvement in several aspects regarding data analysis, description of both experimental and analytical methods, and alternative interpretations, as I detail below.
• The experimental paradigm and recordings should be explained at the beginning of the Results section. Right now, there is no description whatsoever which makes it harder to understand the design of the study.
We thank the reviewer for this kind suggestion. The description of experimental paradigm and recordings has been added to the beginning of the results section (Lines 114-119).
• An important issue that needs to be addressed is the very small fraction of CA1 cells phased-locked to slow gamma rhythms (3.7%). This fraction is much lower than in many previous studies, that typically report it in the range of 20-50%. However, this discrepancy is not discussed by the authors. This needs to be explained and additional analysis considered. One analysis that I would suggest, although there are also other valid approaches, is to, instead of just analyzing the phase locking in two discrete frequency bands, compute the phase locking will all LFP frequencies from 25-100 Hz. This will offer a more comprehensive and unbiased view of the gamma modulation of place cell firing. Alternative metrics to mean vector length that is less sensitive to firing rates, such as pairwise phase consistency index (Vinck et a., Neuroimage, 2010), could be implemented. This may reveal whether the low fraction of phase-locked cells could be due to a low number of spikes entering the analysis.
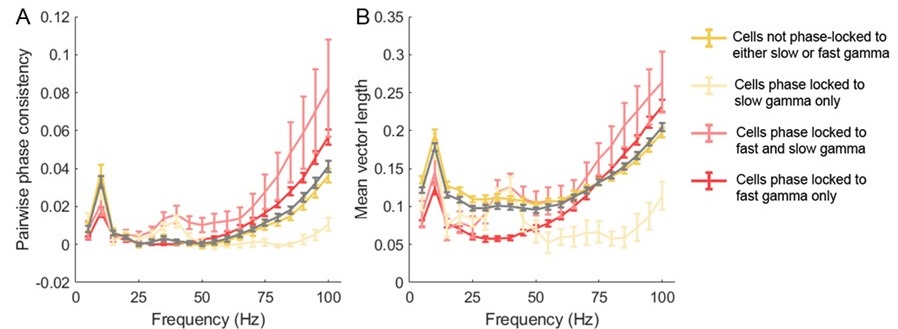
We thank the reviewer for this constructive suggestion. A previous work also on Long-Evans rats showed that the proportion of slow gamma phase-locked cells during novelty exploration was ~20%, however it dropped to ~10% during familiar exploration (Fig.4E, Kitanishi et al., 2015 Neuron). This suggests that the proportion of slow gamma phase-locked cells may decreased with familiarity of the environment, which supports our data. In addition, we also calculated the pairwise phase consistency index in terms of the effect of spike counts on MVL. We could observe that the tendency of PPC (Author response image 2A) and MVL (Author response image 2B) along frequency bands were consistent across different subsets of cells, suggesting that the determination of cell subsets by MVL metric was not biased by the low number of spikes. These results further shed light to the contribution of slow gamma phase precession of place cells to theta sequence development.
Author response image 2.
• From the methods, it is not clear to me whether the reference LFP channel was consistently selected to be a different one that where the spikes analyzed were taken. This is the better practice to reduce the contribution of spike leakage that could substantially inflate the coupling with faster gamma frequencies. These analyses need to be described in more detail.
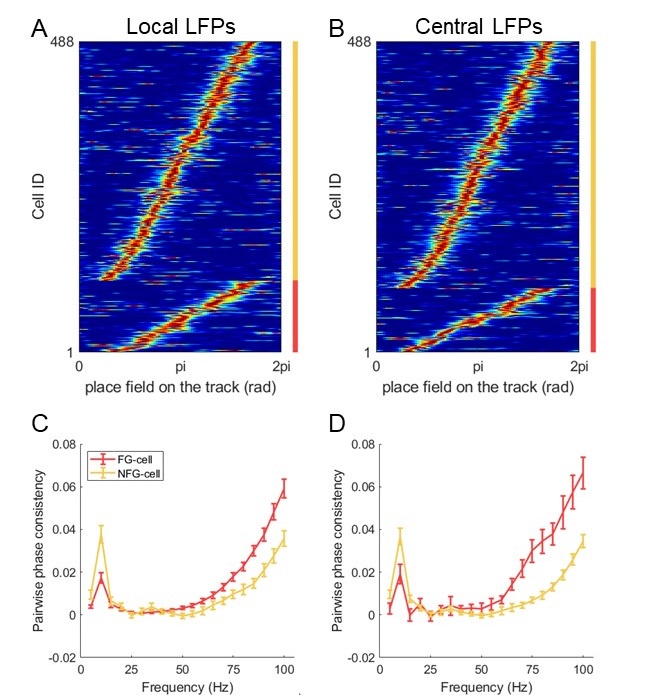
We thank the reviewer for pointing this out. In the main manuscript, we used local LFPs as the cells were recorded from the same tetrode. In addition, we selected an individual tetrode which located at stratum pyramidale and at the center of the drive bundle for each rat. We detected a similar proportion of FG-cells by using LFPs on this tetrode, compared with that using local LFPs (Author response image 3A-B, Chi-squared test, χ2= 0.9, p=0.4, Cramer V=0.03). We further found that the PPC measurement of FG- and NFG-cells were different at fast gamma band by using central LFPs (Author response image 3D), consistent with that by using local LFPs (Author response image 3C). Therefore, these results suggest that the findings related to fast gamma was not due to the contribution of spike leakage in the local LFPs. We have updated the description in the manuscript (Lines 553-557, 566-568).
Author response image 3.
• The initial framework of the authors of classifying cells into fast gamma and not fast gamma modulated implies a bimodality that may be artificial. The authors should discuss the nuances and limitations of this framework. For example, several previous work has shown that the same place cell can couple to different gamma oscillations (e.g., Lastoczni et al., Neuron, 2016; Fernandez-Ruiz et al., Neuron, 2017; Sharif et al., Neuron,2021).
We thank the reviewer for this kind suggestion. We have cited these references and discussed the possibility of bimodal phase-locking in the manuscript (Lines 430-433).
• It would be useful to provide a more thorough characterization of the physiological properties of FG and NFG cells, as this distinction is the basis of the paper. Only very little characterization of some place cell properties is provided in Figure 5. Important characteristics that should be very feasible to compare include average firing rate, burstiness, estimated location within the layer (i.e., deep vs superficial sublayers) and along the transverse axis (i.e., proximal vs distal), theta oscillation frequency, phase precession metrics (given their fundamental relationship with theta sequences), etc.
We thank the reviewer for this constructive suggestion. In addition to the characterizations shown in Fig5, we also analyzed firing rate, anatomical location and theta modulation to compare the physiological properties of FG- and NFG-cells.
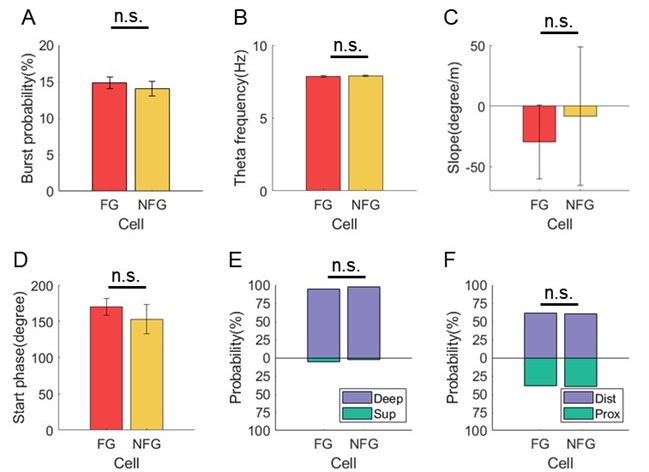
In terms of the firing properties of both types of cells, we found that the mean firing rate of FG-cell was higher than NFG-cell (Fig. 5A, Student's t-test, t(22) = 2.1, p = 0.04, Cohen's D = 0.9), which was consistent with the previous study that the firing rate was higher during fast gamma than during slow gamma (Zheng et al., 2015 Hippocampus). However, the spike counts of excluded FG- and NFG-cells for decoding were similar (Fig. 5B, Student's t-test, t(22) = 1.2, p = 0.3, Cohen's D = 0.5), suggesting that the differences found in theta sequences cannot be accounted for by different decoding quality related to spike counts. In addition, we measured the burstiness based on the distribution of inter-spike-intervals, and we found that the bursting probability of spikes was not significantly different between FG and NFG cells (Author response image 4A, Student's t-test, t(22) = 0.6, p=0.5, Cohen's d=0.3).
In terms of theta modulation of cells, we first compared the theta frequency related to the firing of FG and NFG cells. We detected the instantaneous theta frequency at each spike timing of FG and NFG cells, and found that it was not significantly different between cell types (Author response image 4B, Student's t-test, t(22) = -0.5, p=0.6, Cohen's d=0.2). In addition, we found the proportion of cells with significant theta phase precession was greater in FG-cells than in NFG-cells (Fig. S2E). However, the slope and starting phase of theta phase precession was not significantly different between FG and NFG cells (Author response image 4C, Student's t-test, t(21) = 0.3, p=0.8, Cohen's d=0.1; Author response image 4D, Watson-Williams test, F(1,21)=0.5, p=0.5, partial η2=0.02).
In terms of the anatomical location of FG and NFG cells, we identified tetrode traces in slices for each cell. We found that both FG and NFG cells were recorded from the deep layer of dorsal CA1, with no difference of proportions between cell types (Author response image 4E, Chi-squared test, χ2=0.5, p=0.5, Cramer V=0.05). The distribution of FG-cells he NFG-cells along the transverse axis was also similar between cell types (Author response image 4F, χ2=0.08, p=0.8, Cramer V=0.02).
Author response image 4.
• It is not clear to me how the analysis in Figure 6 was performed. In Figure 6B I would think that the grey line should connect with the bottom white dot in the third panel, which would be the interpretation of the results.
We thank the reviewer for raising this good point. The grey line was just for intuitional observation, not a quantitative analysis. We have removed the grey lines from all heat maps in Fig.6.
Reviewer #3 (Public Review):
[Editors' note: This review contains many criticisms that apply to the whole sub-field of slow/fast gamma oscillations in the hippocampus, as opposed to this particular paper. In the editors' view, these comments are beyond the scope of any single paper. However, they represent a view that, if true, should contextualise the interpretation of this paper and all papers in the sub-field. In doing so, they highlight an ongoing debate within the broader field.]
Summary:
The authors aimed to elucidate the role of dynamic gamma modulation in the development of hippocampal theta sequences, utilizing the traditional framework of "two gammas," a slow and a fast rhythm. This framework is currently being challenged, necessitating further analyses to establish and secure the assumed premises before substantiating the claims made in the present article.
The results are too preliminary and need to integrate contemporary literature. New analyses are required to address these concerns. However, by addressing these issues, it may be possible to produce an impactful manuscript.
We thank the reviewer for raising these important questions in the hippocampal gamma field. We have done a lot of new analyses according to the comments to strengthen our manuscript.
I. Introduction
Within the introduction, multiple broad assertions are conveyed that serve as the premise for the research. However, equally important citations that are not mentioned potentially contradict the ideas that serve as the foundation. Instances of these are described below:
(1) Are there multiple gammas? The authors launched the study on the premise that two different gamma bands are communicated from CA3 and the entorhinal cortex. However, recent literature suggests otherwise, offering that the slow gamma component may be related to theta harmonics:
From a review by Etter, Carmichael and Williams (2023)
"Gamma-based coherence has been a prominent model for communication across the hippocampal-entorhinal circuit and has classically focused on slow and fast gamma oscillations originating in CA3 and medial entorhinal cortex, respectively. These two distinct gammas are then hypothesized to be integrated into hippocampal CA1 with theta oscillations on a cycle-to-cycle basis (Colgin et al., 2009; Schomburg et al., 2014). This would suggest that theta oscillations in CA1 could serve to partition temporal windows that enable the integration of inputs from these upstream regions using alternating gamma waves (Vinck et al., 2023). However, these models have largely been based on correlations between shifting CA3 and medial entorhinal cortex to CA1 coherence in theta and gamma bands. In vivo, excitatory inputs from the entorhinal cortex to the dentate gyrus are most coherent in the theta band, while gamma oscillations would be generated locally from presumed local inhibitory inputs (Pernía-Andrade and Jonas, 2014). This predominance of theta over gamma coherence has also been reported between hippocampal CA1 and the medial entorhinal cortex (Zhou et al., 2022). Another potential pitfall in the communication-through-coherence hypothesis is that theta oscillations harmonics could overlap with higher frequency bands (Czurkó et al., 1999; Terrazas et al., 2005), including slow gamma (Petersen and Buzsáki, 2020). The asymmetry of theta oscillations (Belluscio et al., 2012) can lead to harmonics that extend into the slow gamma range (Scheffer-Teixeira and Tort, 2016), which may lead to a misattribution as to the origin of slow-gamma coherence and the degree of spike modulation in the gamma range during movement (Zhou et al., 2019)."
And from Benjamin Griffiths and Ole Jensen (2023)
"That said, in both rodent and human studies, measurements of 'slow' gamma oscillations may be susceptible to distortion by theta harmonics [53], meaning open questions remain about what can be attributed to 'slow' gamma oscillations and what is attributable to theta."
This second statement should be heavily considered as it is from one of the original authors who reported the existence of slow gamma.
Yet another instance from Schomburg, Fernández-Ruiz, Mizuseki, Berényi, Anastassiou, Christof Koch, and Buzsáki (2014):
"Note that modulation from 20-30 Hz may not be related to gamma activity but, instead, reflect timing relationships with non-sinusoidal features of theta waves (Belluscio et al., 2012) and/or the 3rd theta harmonic."
One of this manuscript's authors is Fernández-Ruiz, a contemporary proponent of the multiple gamma theory. Thus, the modulation to slow gamma offered in the present manuscript may actually be related to theta harmonics.
With the above emphasis from proponents of the slow/fast gamma theory on disambiguating harmonics from slow gamma, our first suggestion to the authors is that they A) address these statements (citing the work of these authors in their manuscript) and B) demonstrably quantify theta harmonics in relation to slow gamma prior to making assertions of phase relationships (methodological suggestions below). As the frequency of theta harmonics can extend as high as 56 Hz (PMID: 32297752), overlapping with the slow gamma range defined here (25-45 Hz), it will be important to establish an approach that decouples the two phenomena using an approach other than an arbitrary frequency boundary.
We agree with the reviewer that the theta oscillations harmonics could overlap with higher frequency bands including slow gamma, as the above reviews discussed. In order to rule out the possibility of theta harmonics effects in this study, we added new analyses in this letter (see below).
(2) Can gammas be segregated into different lamina of the hippocampus? This idea appears to be foundational in the premise of the research but is also undergoing revision.
As discussed by Etter et al. above, the initial theory of gamma routing was launched on coherence values. However, the values reported by Colgin et al. (2009) lean more towards incoherence (a value of 0) rather than coherence (1), suggesting a weak to negligible interaction. Nevertheless, this theory is coupled with the idea that the different gamma frequencies are exclusive to the specific lamina of the hippocampus.
Recently, Deschamps et al. (2024) suggested a broader, more nuanced understanding of gamma oscillations than previously thought, emphasizing their wide range and variability across hippocampal layers. This perspective challenges the traditional dichotomy of gamma sub-bands (e.g., slow vs. medium gamma) and their associated cognitive functions based on a more rigid classification according to frequency and phase relative to the theta rhythm. Moreover, they observed all frequencies across all layers.
Similarly, the current source density plots from Belluscio et al. (2012) suggest that SG and FG can be observed in both the radiatum and lacunosum-moleculare.
Therefore, if the initial coherence values are weak to negligible and both slow and fast gamma are observed in all layers of the hippocampus, can the different gammas be exclusively related to either anatomical inputs or psychological functions (as done in the present manuscript)? Do these observations challenge the authors' premise of their research? At the least, please discuss.
We thank the reviewer for raising this point, which I believe still remains controversial in this field. We also thank the reviewer for providing detailed proofs of existence forms of gamma rhythms. The reviewer was considering 2 aspects of gamma: 1) the reasonability of dividing slow and fast gamma by specific frequency bands; 2) the existence of gamma across all hippocampal layers, which challenged the functional significance of different types of gamma rhythms. Although the results in Douchamps et al., 2024 challenged the idea of rigid gamma sub-bands, we still could see separate slow and fast gamma components exclusively occurred along time course, with central frequency of slow gamma lower than ~60Hz and central frequency of fast gamma higher than ~60Hz (Fig.1b of Douchamps et al., 2024). This was also seen in the rat dataset of this reference (Fig. S3). Since their behavioral test required both memory encoding and retrieval processes, it was hard to distinguish the role of different gamma components as they may dynamically coordinate during complex memory process. Thus, although the behavioral performance can be decoded from broad range of gamma, we still cannot deny the existence of difference gamma rhythms and their functional significance during difference memory phases.
(3) Do place cells, phase precession, and theta sequences require input from afferent regions? It is offered in the introduction that "Fast gamma (~65-100Hz), associated with the input from the medial entorhinal cortex, is thought to rapidly encode ongoing novel information in the context (Fernandez-Ruiz et al., 2021; Kemere, Carr, Karlsson, & Frank, 2013; Zheng et al., 2016)".
CA1 place fields remain fairly intact following MEC inactivation include Ipshita Zutshi, Manuel Valero, Antonio Fernández-Ruiz , and György Buzsáki (2022)- "CA1 place cells and assemblies persist despite combined mEC and CA3 silencing" and from Hadas E Sloin, Lidor Spivak, Amir Levi, Roni Gattegno, Shirly Someck, Eran Stark (2024) - "These findings are incompatible with precession models based on inheritance, dual-input, spreading activation, inhibition-excitation summation, or somato-dendritic competition. Thus, a precession generator resides locally within CA1."
These publications, at the least, challenge the inheritance model by which the afferent input controls CA1 place field spike timing. The research premise offered by the authors is couched in the logic of inheritance, when the effect that the authors are observing could be governed by local intrinsic activity (e.g., phase precession and gamma are locally generated, and the attribution to routed input is perhaps erroneous). Certainly, it is worth discussing these manuscripts in the context of the present manuscript.
We thank the review for this discussion. The main purpose of our current study is to investigate the mechanism of theta sequence development along with learning, which may or may not dependent on theta phase precession of single place cells as it remains controversial in this field. Also, there is a limitation in this study that all gamma components were recorded from stratum pyramidale, thus we cannot make any conclusion on the originate of gamma in modulating sequence development.
II. Results
(1) Figure 2-
a. There is a bit of a puzzle here that should be discussed. If slow and fast frequencies modulate 25% of neurons, how can these rhythms serve as mechanisms of communication/support psychological functions? For instance, if fast gamma is engaged in rapid encoding (line 72) and slow gamma is related to the integration processing of learned information (line 84), and these are functions of the hippocampus, then why do these rhythms modulate so few cells? Is this to say 75% of CA1 neurons do not listen to CA3 or MEC input?
The proportion ~25% was the part of place cells phase-locked to either slow or fast gamma. However, one of the main findings in this study was that most cells were modulated by slow gamma as they fired at precessed slow gamma phase within a theta cycle (Figs 6-8), which would promote information compression for theta sequence development. Therefore, we didn’t mean that only a small proportion of cells were modulated by gamma rhythms and contributed to this process.
b. Figure 2. It is hard to know if the mean vector lengths presented are large or small. Moreover, one can expect to find significance due to chance. For instance, it is challenging to find a frequency in which modulation strength is zero (please see Figure 4 of PMID: 30428340 or Figure 7 of PMID: 31324673).
i. Please construct the histograms of Mean Vector Length as in the above papers, using 1 Hz filter steps from 1-120Hz and include it as part of Figure 2 (i.e., calculate the mean vector length for the filtered LFP in steps of 1-2 Hz, 2-3 Hz, 3-4 Hz,... etc). This should help the authors portray the amount of modulation these neurons have relative to the theta rhythm and other frequencies. If the theta mean vector length is higher, should it be considered the primary modulatory influence of these neurons (with slow and fast gammas as a minor influence)?
We thank the review for this suggestion. We measured the mean vector length at 5Hz step (equivalent to 1Hz step), and we found that the FG-cells were phase-locked to fast gamma rhythms even stronger than that to theta (Author response image 2B, mean MVL of theta=0.126±0.007, mean MVL of theta=0.175±0.006, paired t-test, t(112)=-5.9, p=0.01, Cohen's d=0.7). In addition, in some previous studies with significant fast gamma phase locking, the MVL values were around 0.15 by using broad gamma band (Kitanishi et al., 2015 Neuron, Lasztóczi et al., 2016 Neuron, Tomar et al., 2021 Front Behav Neurosci, and Asiminas et al., 2022 Molecular Autism), which was consistent with the value in this study. Therefore, we don’t believe that fast gamma was only a minor influence of these neurons.
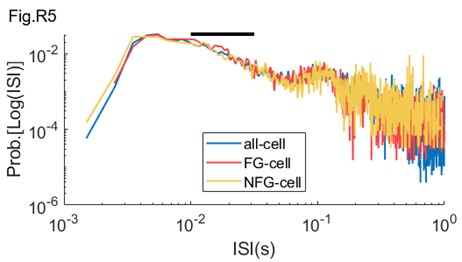
ii. It is possible to infer a neuron's degree of oscillatory modulation without using the LFP. For instance, one can create an ISI histogram as done in Figure 1 here (https://www.biorxiv.org/content/10.1101/2021.09.20.461152v3.full.pdf+html; "Distinct ground state and activated state modes of firing in forebrain neurons"). The reciprocal of the ISI values would be "instantaneous spike frequency". In favor of the Douchamps et al. (2024) results, the figure of the BioRXiV paper implies that there is a single gamma frequency modulate as there is only a single bump in the ISIs in the 10^-1.5 to 10^-2 range. Therefore, to vet the slow gamma results and the premise of two gammas offered in the introduction, it would be worth including this analysis as part of Figure 2.
By using suggested method, we calculated the ISI distribution on log scale for FG-cells and NFG-cells during behavior (Author response image 5). We could observe that the ISI distribution of FG-cells had a bump in the 10-1.5= to 10-2= range (black bar), in particular in the fast gamma range (10-2= to 10-1.8=).
Author response image 5.
c. There are some things generally concerning about Figure 2.
i. First, the raw trace does not seem to have clear theta epochs (it is challenging to ascertain the start and end of a theta cycle). Certainly, it would be worth highlighting the relationship between theta and the gammas and picking a nice theta epoch.
We thank the review for this suggestion. We've updated this figure with a nice theta epoch in the revised manuscript.
ii. Also, in panel A, there looks to be a declining amplitude relationship between the raw, fast, and slow gamma traces, assuming that the scale bars represent 100uV in all three traces. The raw trace is significantly larger than the fast gamma. However, this relationship does not seem to be the case in panel B (in which both the raw and unfiltered examples of slow and fast gamma appear to be equal; the right panels of B suggest that fast gamma is larger than slow, appearing to contradict the A= 1/f organization of the power spectral density). Please explain as to why this occurs. Including the power spectral density (see below) should resolve some of this.
We thank the review for pointing this out. The scales of y-axis of LFPs tracs in Fig.2B was not consistent, which mislead the comparison of amplitude between slow and fast gamma. We have unified y axis scales across different gamma types in the revised manuscript. Moreover, we also have replaced these examples with more typical ones (also see the response below).
iii. Within the example of spiking to phase in the left side of Panel B (fast gamma example)- the neuron appears to fire near the trough twice, near the peak twice, and somewhere in between once. A similar relationship is observed for the slow gamma epoch. One would conclude from these plots that the interaction of the neuron with the two rhythms is the same. However, the mean vector lengths and histograms below these plots suggest a different story in which the neuron is modulated by FG but not SG. Please reconcile this.
We thank the review for pointing this out. We found that the fast gamma phase locking was robust across FG-cells with fast gamma peak as the preferred phase. Therefore, we have replaced these examples with more typical ones, so that the examples were consistent with the group effect.
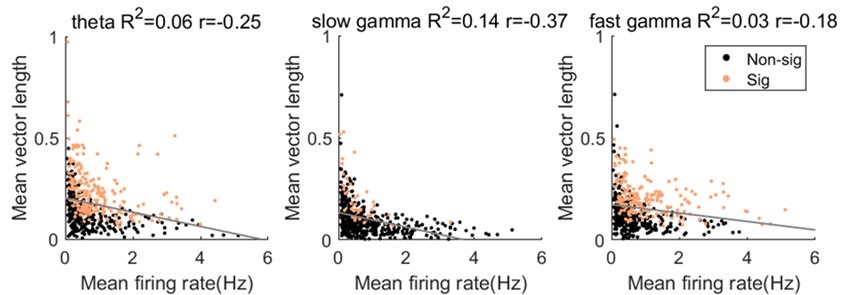
iv. For calculating the MVL, it seems that the number of spikes that the neuron fires would play a significant role. Working towards our next point, there may be a bias of finding a relationship if there are too few spikes (spurious clustering due to sparse data) and/or higher coupling values for higher firing rate cells (cells with higher firing rates will clearly show a relationship), forming a sort of inverse Yerkes-Dodson curve. Also, without understanding the magnitude of the MVL relative to other frequencies, it may be that these values are indeed larger than zero, but not biologically significant.
- Please provide a scatter plot of Neuron MVL versus the Neuron's Firing Rate for 1) theta (7-9 Hz), 2) slow gamma, and 3) fast gamma, along with their line of best fit.
- Please run a shuffle control where the LFP trace is shifted by random values between 125-1000ms and recalculate the MVL for theta, slow, and fast gamma. Often, these shuffle controls are done between 100-1000 times (see cross-correlation analyses of Fujisawa, Buzsaki et al.).
- To establish that firing rate does not play a role in uncovering modulation, it would be worth conducting a spike number control, reducing the number of spikes per cell so that they are all equal before calculating the phase plots/MVL.
We thank the review for raising this point. Beside of the MVL value, we also calculated the pairwise phase consistency (PPC) as suggested by Reviewer2, which is not sensitive to the spike counts. We found that the phase locking strength to either rhythm (theta or gamma) was comparable between MVL and PPC measurements (Author response image 2). Moreover, we quantified the relationship between MVL and mean firing rate, as suggested. We found that the MVL value for theta, slow gamma and fast gamma was negatively correlated with mean firing rate (Author response image 6, Pearson correlation, theta: R2= 0.06, Pearson’s r=-0.3, p=1.3×10-8=; slow gamma: R2= 0.1, Pearson’s r=-0.4, p=2.4×10-17=; fast gamma: R2= 0.03, Pearson’s r=-0.2, p=4.3×10-5=). These results help us rule out the concerns of the effect of spikes counts on the phase modulation measurement.
Author response image 6.
(2) Something that I anticipated to see addressed in the manuscript was the study from Grosmark and Buzsaki (2016): "Cell assembly sequences during learning are "replayed" during hippocampal ripples and contribute to the consolidation of episodic memories. However, neuronal sequences may also reflect preexisting dynamics. We report that sequences of place-cell firing in a novel environment are formed from a combination of the contributions of a rigid, predominantly fast-firing subset of pyramidal neurons with low spatial specificity and limited change across sleep-experience-sleep and a slow-firing plastic subset. Slow-firing cells, rather than fast-firing cells, gained high place specificity during exploration, elevated their association with ripples, and showed increased bursting and temporal coactivation during postexperience sleep. Thus, slow- and fast-firing neurons, although forming a continuous distribution, have different coding and plastic properties."
My concern is that much of the reported results in the present manuscript appear to recapitulate the observations of Grosmark and Buzsaki, but without accounting for differences in firing rate. A parsimonious alternative explanation for what is observed in the present manuscript is that high firing rate neurons, more integrated into the local network and orchestrating local gamma activity (PING), exhibit more coupling to theta and gamma. In this alternative perspective, it's not something special about how the neurons are entrained to the routed fast gamma, but that the higher firing rate neurons are better able to engage and entrain their local interneurons and, thus modulate local gamma. However, this interpretation challenges the discussion around the importance of fast gamma routed from the MEC.
a. Please integrate the Grosmark & Buzsaki paper into the discussion.
b. Also, please provide data that refutes or supports the alternative hypothesis in which the high firing rate cells are just more gamma modulated as they orchestrate local gamma activity through monosynaptic connections with local interneurons (e.g., Marshall et al., 2002, Hippocampal pyramidal cell-interneuron spike transmission is frequency dependent and responsible for place modulation of interneuron discharge). Otherwise, the attribution to a MEC routed fast gamma routing seems tenuous.
c. It is mentioned that fast-spiking interneurons were removed from the analysis. It would be worth including these cells, calculating the MVL in 1 Hz increments as well as the reciprocal of their ISIs (described above).
We thank the review for this suggestion. Because we found the mean firing rate of FG-cells was higher than that of NFG-cells, it would be possible that the FG-cells are mainly overlapped with fast-firing cells (rigid cells) in Grosmark et al., 2016 Science. Actually, in this study, we aimed to investigate how fast and slow gamma rhythms modulated neurons dynamically during learning, rather than defining new cell types. Thus, we don’t think this work was just a replication of the previous publication. We have added this description in the Discussion part (Lines 439-441). In addition, we don’t have enough number of interneurons to support the analysis between interneurons and place cells. Therefore, we couldn’t make any statement about where was the fast gamma originated (CA1 locally or routed from MEC) in this study.
(3) Methods - Spectral decomposition and Theta Harmonics.
a. It is challenging to interpret the exact parameters that the authors used for their multi-taper analysis in the methods (lines 516-526). Tallon-Baudry et al., (1997; Oscillatory γ-Band (30-70 Hz) Activity Induced by a Visual Search Task in Humans) discuss a time-frequency trade-off where frequency resolution changes with different temporal windows of analysis. This trade-off between time and frequency resolution is well known as the uncertainty principle of signal analysis, transcending all decomposition methods. It is not only a function of wavelet or FFT, and multi-tapers do not directly address this. (The multitaper method, by using multiple specially designed tapers -like the Slepian sequences- smooths the spectrum. This smoothing doesn't eliminate leakage but distributes its impact across multiple estimates). Given the brevity of methods and the issues of theta harmonics as offered above, it is worth including some benchmark trace testing for the multi-taper as part of the supplemental figures.
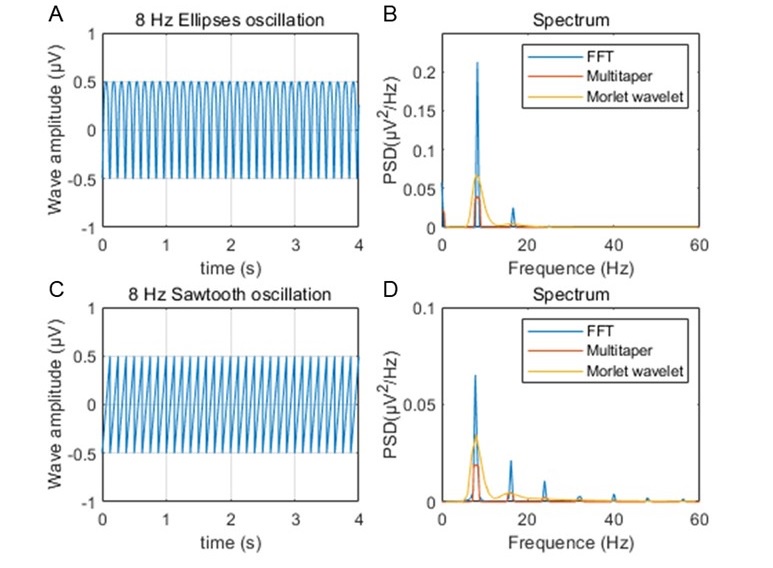
i. Please spectrally decompose an asymmetric 8 Hz sawtooth wave showing the trace and the related power spectral density using the multiple taper method discussed in the methods.
ii. Please also do the same for an elliptical oscillation (perfectly symmetrical waves, but also capable of casting harmonics). Matlab code on how to generate this time series is provided below:
A = 1; % Amplitude
T = 1/8; % Period corresponding to 8 Hz frequency
omega = 2*pi/T; % Angular frequency
C = 1; % Wave speed
m = 0.9; % Modulus for the elliptic function (0<m<1 for cnoidal waves)
x = linspace(0, 2*pi, 1000); % temporal domain
t = 0; % Time instant
% Calculate B based on frequency and speed
B = sqrt(omega/C);
% Cnoidal wave equation using the Jacobi elliptic function
u = A .* ellipj(B.*(x - C*t), m).^2;
% Plotting the cnoidal wave
figure;
plot(x./max(x), u);
title('8 Hz Cnoidal Wave');
xlabel('time (x)');
ylabel('Wave amplitude (u)');
grid on;
The Symbolic Math Toolbox needs to be installed and accessible in your MATLAB environment to use ellipj. Otherwise, I trust that, rather than plotting a periodic orbit around a circle (sin wave) the authors can trace the movement around an ellipse with significant eccentricity (the distance between the two foci should be twice the distance between the co-vertices).
We thank the review for this suggestion. In the main text of manuscript, we only applied Morlet's wavelet method to calculate the time varying power of rhythms. Multitaper method was used for the estimation of power spectra across running speeds, which was shown in the manuscript. Therefore, we removed the description of Multitaper method and updated the Morlet's wavelet power spectral analysis in the Methods (Lines 541-544).
As suggested, we estimated the power spectral densities of 8 Hz sawtooth and elliptical oscillation by using these methods, and compared them with the results from FFT. We found that both the Multitaper's and Morlet's wavelet methods could well capture the 8Hz oscillatory components (Author response image 7). However, we could observe harmonic components from FFT spectrum.
Author response image 7.
iii. Line 522: "The power spectra across running speeds and absolute power spectrum (both results were not shown).". Given the potential complications of multi-taper discussed above, and as each convolution further removes one from the raw data, it would be the most transparent, simple, and straightforward to provide power spectra using the simple fft.m code in Matlab (We imagine that the authors will agree that the results should be robust against different spectral decomposition methods. Otherwise, it is concerning that the results depend on the algorithm implemented and should be discussed. If gamma transience is a concern, the authors should trigger to 2-second epochs in which slow/fast gamma exceeds 3-7 std. dev. above the mean, comparing those resulting power spectra to 2-second epochs with ripples - also a transient event). The time series should be at least 2 seconds in length (to avoid spectral leakage issues and the issues discussed in Talon-Baudry et al., 1997 above).
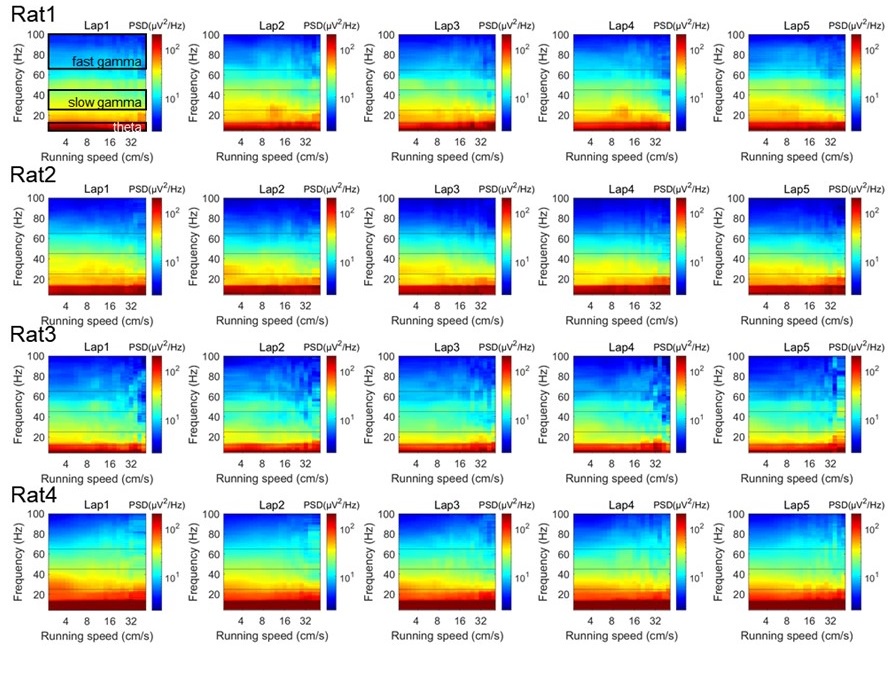
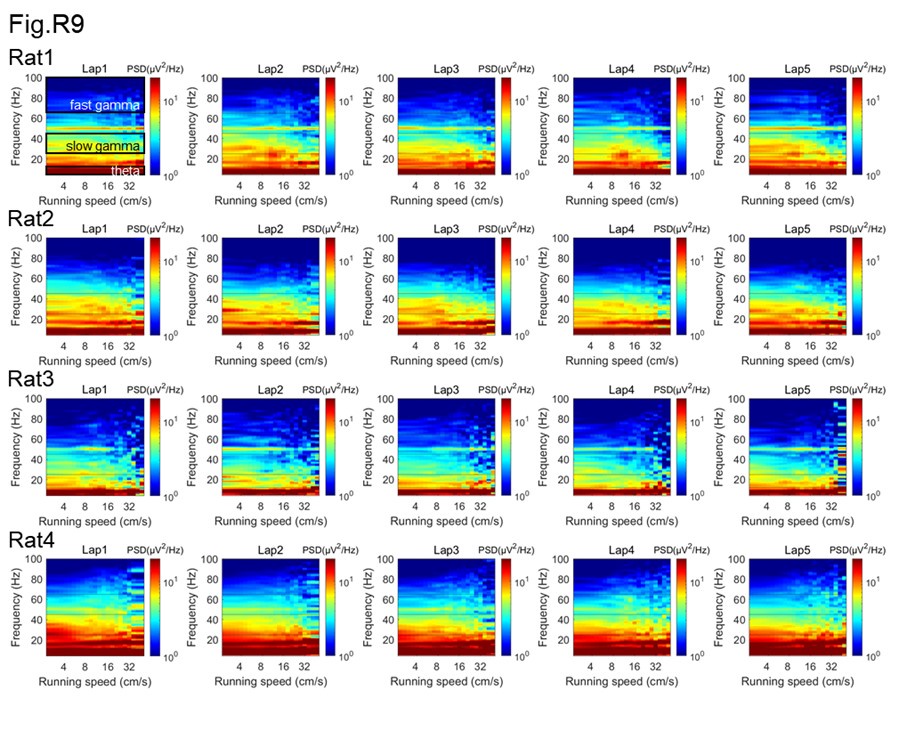
Please show the unmolested power spectra (Y-axis units in mV2/Hz, X-axis units as Hz) as a function of running speed (increments of 5 cm/s) for each animal. I imagine three of these PSDs for 3 of the animals will appear in supplemental methods while one will serve as a nice manuscript figure. With this plot, please highlight the regions that the authors are describing as theta, slow, and fast gamma. Also, any issues should be addressed should there be notable differences in power across animals or tetrodes (issues with locations along proximal-distal CA1 in terms of MEC/LEC input and using a local reference electrode are discussed below).
As suggested, we firstly estimated the power spectra as a function of running speeds in each running lap, and showed them separately for each rat, by using the multitaper spectral analysis (Author response image 8). In addition, to achieve unmolested power spectra, the short-time Fourier transform (STFT) was used for this analysis at the same frequency resolution (Author response image 9). We could see that the power spectra were consistent between these two methods. Notably, there seems no significant theta harmonic component in the slow gamma band range.
The multitaper spectral analysis was performed as follows. The power spectra were measured across different running speeds as described previously (Ahmed et al., 2012 J Neurosci; Zheng et al., 2015 Hippocampus; Zheng et al., 2016 eNeuro). Briefly, the absolute power spectrum was calculated for 0.5s moving window and 0.2s step size of the LFPs recordings each lap, using the multitaper spectral analysis in the Chronux toolbox (Mitra and Bokil, 2008, http://chronux.org/) and STFT spectral analysis in Matlab script stft.m. In the multitaper method, the time-bandwidth product parameter (TW) was set at 3, and the number of tapers (K) was set at 5. In the STFT method, the FFT length was set at 2048, which was equivalent with the parameters used in multitaper method. Running speed was calculated (see “Estimation of running speed and head direction” section in the manuscript) and averaged within each 0.5s time window corresponding to the LFP segments. Then, the absolute power at each frequency was smoothed with a Gaussian kernel centered on given speed bin. The power spectral as a function of running speed and frequency were plotted in log scale. Also, the colormap was in log scale, allowing for comparisons across different frequencies that would otherwise be difficult due to the 1/f decay of power in physiological signals.
Author response image 8.
Author response image 9.
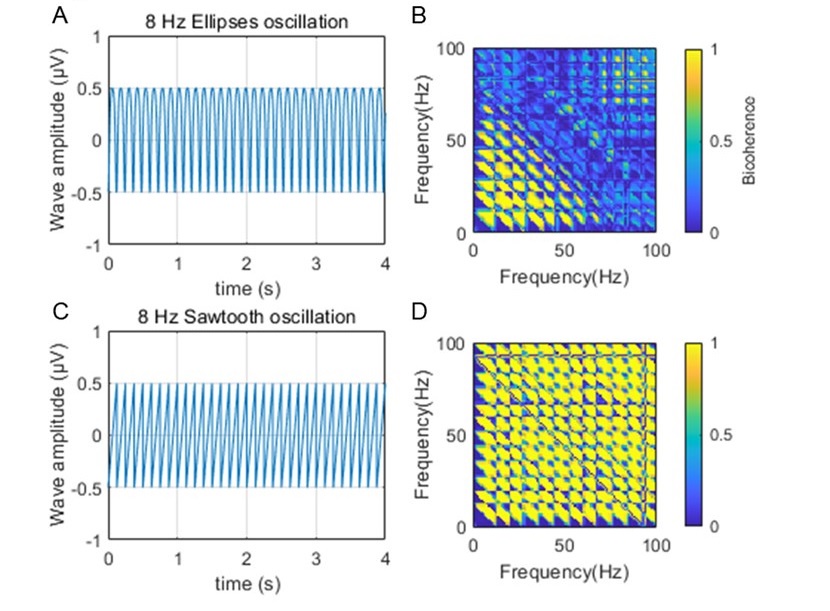
iv. Schomberg and colleagues (2014) suggested that the modulation of neurons in the slow gamma range could be related to theta harmonics (see above). Harmonics can often extend in a near infinite as they regress into the 1/f background (contributing to power, but without a peak above the power spectral density slope), making arbitrary frequency limits inappropriate. Therefore, in order to support the analyses and assertions regarding slow gamma, it seems necessary to calculate a "theta harmonic/slow gamma ratio". Aru et al. (2015; Untangling cross-frequency coupling in neuroscience) offer that: " The presence of harmonics in the signal should be tested by a bicoherence analysis and its contribution to CFC should be discussed." Please test both the synthetic signals above and the raw LFP, using temporal windows of greater than 4 seconds (again, the large window optimizes for frequency resolution in the time-frequency trade-off) to calculate the bicoherence. As harmonics are integers of theta coupled to itself and slow gamma is also coupled to theta, a nice illustration and contribution to the field would be a method that uses the bispectrum to isolate and create a "slow gamma/harmonic" ratio.
We thank the reviewer for providing the method regarding on the theta harmonics. We firstly measured the theta harmonics on the synthesized signal by using the biphasic coherence method, and we could clearly observe the nonlinear coupling between theta rhythm and its harmonics (Author response image 10).
Author response image 10.
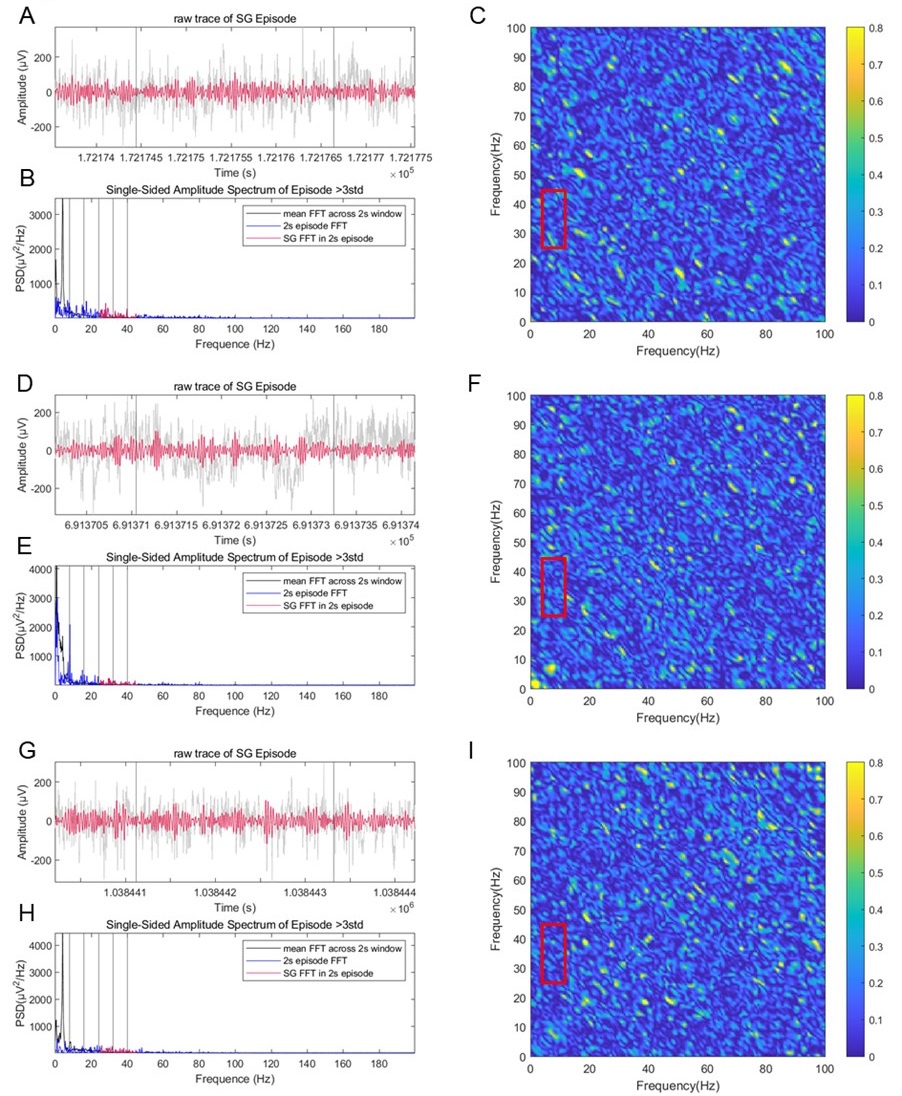
In addition, we also measured the bicoherence on raw traces during slow gamma episodes. We did not see nonlinear coupling between slow gamma and theta bands in this real data (mean bicoherence=0.1±0.0002) compared with that in the synthesized signal (mean bicoherence=0.7 for elliptical waves and 0.5 for sawtooth waves), suggesting that the slow gamma detected in this study was not pure theta harmonic (Author response image 11C, F, I, in red boxes). Therefore, we believe that the contribution of theta harmonic in slow gamma is not significant.
Author response image 11.
(4) I appreciate the inclusion of the histology for the 4 animals. Knerim and colleagues describe a difference in MEC projection along the proximal-distal axis of the CA1 region (https://www.ncbi.nlm.nih.gov/pmc/articles/PMC3866456/)- "There are also differences in their direct projections along the transverse axis of CA1, as the LEC innervates the region of CA1 closer to the subiculum (distal CA1), whereas the MEC innervates the region of CA1 closer to CA2 and CA3 (proximal CA1)" From the histology, it looks like some of the electrodes are in the part of CA1 that would be dominated by LEC input while a few are closer to where the MEC would project.
a. How do the authors control for these differences in projections? Wouldn't this change whether or not fast gamma is observed in CA1?
b. I am only aware of one manuscript that describes slow gamma in the LEC which appeared in contrast to fast gamma from the MEC (https://www.science.org/doi/10.1126/science.abf3119). One would surmise that the authors in the present manuscript would have varying levels of fast gamma in their CA1 recordings depending on the location of the electrodes in the Proximal-distal axis, to the extent that some of the more medial tetrodes may need to be excluded (as they should not have fast gamma, rather they should be exclusively dominated by slow gamma). Alternatively, the authors may find that there is equal fast gamma power across the entire proximal-distal axis. However, this would pose a significant challenge to the LEC/slow gamma and MEC/fast gamma routing story of Fernandez-Ruiz et al. and require reconciliation/discussion.
c. Is there a difference in neuron modulation to these frequencies based on electrode location in CA1?
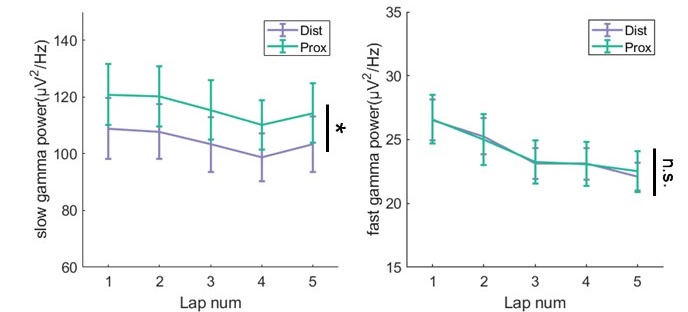
We thank the reviewer for this concern, which was also raised by Reviewer2. We aligned the physical location of LFP channels in the proximal-distal axis based on histology. In our dataset, only 2 rats were recorded from both distal and proximal hippocampus, so we calculated the gamma power from both sites in these rats. We found that slow power was higher from proximal tetrodes than that from distal tetrodes (Author response image 12, repeated measure ANOVA, F(1,7)=10.2, p=0.02, partial η 2=0.8). However, fast gamma power were similar between different recording sites (F(1,7)=0.008, p=0.9, partial η 2=0.001). These results are partially consistent with the LEC/slow gamma and MEC/fast gamma routing story of Fernandez-Ruiz’s work. The main reason would be that all LFPs were recorded from tetrodes in stratum pyramidale, deep layer in particular (Author response image 4E), so that it was hard to precisely identify their distance to distal/proximal apical dendrites.
Author response image 12.
In terms of the anatomical location of FG and NFG cells, we identified tetrode traces in slices for each cell. We found that both FG and NFG cells were recorded from the deep layer of dorsal CA1, with no difference of proportions between cell types (Author response image 4E, Chi-squared test, χ2=0.5, p=0.5, Cramer V=0.05). The distribution of FG-cells he NFG-cells along the transverse axis was also similar between cell types (Author response image 4F, χ2=0.08, p=0.8, Cramer V=0.02).
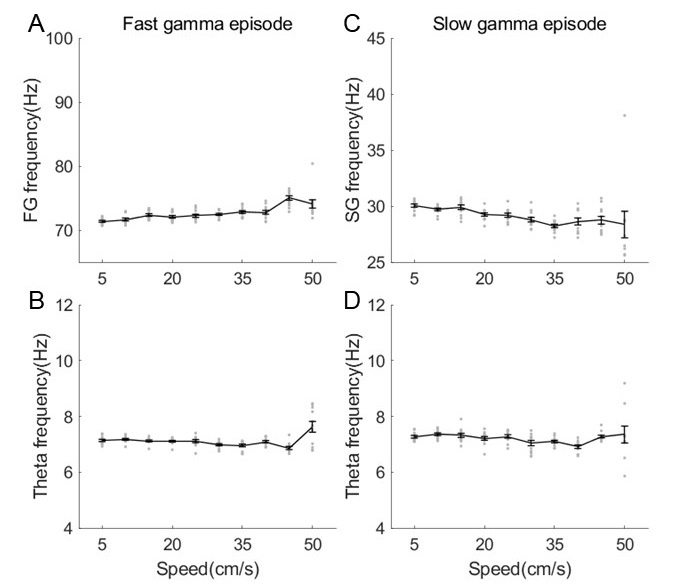
(5) Given a comment in the discussion (see below), it will be worth exploring changes in theta, theta harmonic, slow gamma, and fast gamma power with running speed as no changes were observed with theta sequences or lap number versus. Notably, Czurko et al., report an increase in theta and harmonic power with running speed (1999) while Ahmed and Mehta (2012) report a similar effect for gamma.
a. Please determine if the oscillations change in power and frequency of the rhythms discussed above change with running speed using the same parameters applied in the present manuscript. The specific concern is that how the authors calculate running speed is not sensitive enough to evaluate changes.
We thank the reviewer for this suggestion. The description of running speed quantification has been updated in the Method (see “Estimation of running speed and head direction” section, Lines 501-511). Overall, the sample frequency of running speed was25Hz which would be sensitive enough to evaluate the behavioral changes.
By measuring the rhythmic power changing as a function of running speed (Author response image 8 and Author response image 9), we could observe that theta power was increased as running speed getting higher. Consistent with the results in (Ahmed and Mehta, 2012) and our previous study (Zheng et al., 2015), the fast gamma power was increasing and slow gamma power was decreasing when running speed was getting high.
In addition, we also estimated the rhythmic frequency as a function of running speed in the slow and fast episodes respectively. We found that fast gamma frequency was increased with running speed (Author response image 13, linear regression, R2=0.4, corr=0.6, p=9.9×10⁻¹⁵), whereas slow gamma frequency was decreased with running speed (R2=0.2, corr=-0.4, p=8.8×10⁻⁶). Although significant correlation was found between gamma frequency and running speed, consistent with the previous studies, the frequency change (~70-75Hz for fast gamma and ~30-28Hz for slow gamma) was not big enough to affect the sequence findings in this study. In additiontheta frequency was maintained in either slow episodes (R2=0.02, corr=-0.1, p=0.1) or fast episodes (R2=0.004, corr=0.06, p=0.5), consistent with results in Fig.1G of Kropff et al., 2021 Neuron.
Author response image 13.
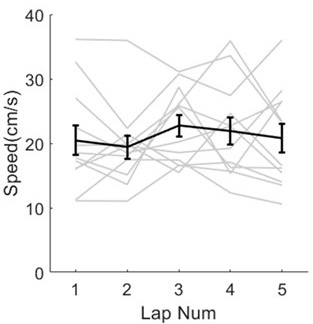
b. It is astounding that animals ran as fast as they did in what appears to be the first lap (Figure 3F), especially as rats' natural proclivity is thigmotaxis and inquisitive exploration in novel environments. Can the authors expand on why they believe their rats ran so quickly on the first lap in a novel environment and how to replicate this? Also, please include the individual values for each animal on the same plot.
We thank the reviewer for pointing this out. The task was not brand new to rats in this dataset, because only days with good enough recording quality for sequence decoding were included in this paper, which were about day2-day10 for each rat. However, we still observed the process of sequence formation because of the rat’s exploration interest during early laps. Thus, in terms exploration behaviors, the rats ran at relative high speeds across laps (Author response image 14, each gray line represents the running speed within an individual session).
Author response image 14.
c. Can the authors explain how the statistics on line 169 (F(4,44)) work? Specifically, it is challenging to determine how the degrees of freedom were calculated in this case and throughout if there were only 4 animals (reported in methods) over 5 laps (depicted in Figure 3F. Given line 439, it looks like trials and laps are used synonymously). Four animals over 5 laps should have a DOF of 16.
This statistic result was performed with each session/day as a sample (n=12 sessions/days). The statistics were generated by repeated measures ANOVA on 5 trials in 12 sessions, with a DOF of 44.
(6) Throughout the manuscript, I am concerned about an inflation of statistical power. For example on line 162, F(2,4844). The large degrees of freedom indicate that the sample size was theta sequences or a number of cells. Since multiple observations were obtained from the same animal, the statistical assumption of independence is violated. Therefore, the stats need to be conducted using a nested model as described in Aarts et al. (2014; https://pubmed.ncbi.nlm.nih.gov/24671065/). A statistical consult may be warranted.
We thank the reviewer for this suggestion. We have replaced this statistic result by using generalized linear mixed model with ratID being a covariate. These results have been updated in the revised manuscript (Lines 164-167).
(7) It is stated that one tetrode served as a quiet recording reference. The "quiet" part is an assumption when often, theta and gamma can be volume conducted to the cortex (e.g., Sirota et al., 2008; This is often why laboratories that study hippocampal rhythms use the cerebellum for the differential recording electrode and not an electrode in the corpus callosum). Generally, high frequencies propagate as well as low frequencies in the extracellular milieu (https://www.eneuro.org/content/4/1/ENEURO.0291-16.2016). For transparency, the authors should include a limitation paragraph in their discussion that describes how their local tetrode reference may be inadvertently diminishing and/or distorting the signal that they are trying to isolate. Otherwise, it would be worth hearing an explanation as to how the author's approach avoids this issue.
In terms of the locations of references, we had 2 screws above the cerebellum in the skull connected to the recording drive ground, and 1 tetrode in a quiet area of the cortex serving as the recording reference. We agree that the theta and gamma can be volume conducted to the cortex which may affect the power of these rhythms in the stratum pyramidale. However, we didn’t mean to measure or compare the absolute theta or gamma power in this study, as we only cared about the phase modulation of gamma to place cells. Therefore, we believe the location of recording reference would not make significant effect on our conclusion.
Apologetically, this review is already getting long. Moreover, I have substantial concerns that should be resolved prior to delving into the remainder of the analyses. e.g., the analyses related to Figure 3-5 assert that FG cells are important for sequences. However, the relationship to gamma may be secondary to either their relationship to theta or, based on the Grosmark and Buzsaki paper, it may just be a phenomenon coupled to the fast-firing cells (fast-firing cells showing higher gamma modulation due to a local PING dynamic). Moreover, the observation of slow gamma is being challenged as theta harmonics, even by the major proponents of the slow/fast gamma theory. Therefore, the report of slow gamma precession would come as an unsurprising extension should they be revealed to be theta harmonics (however, no control for harmonics was implemented; suggestions were made above). Following these amendments, I would be grateful for the opportunity to provide further feedback.
III. Discussion.
a. Line 330- it was offered that fast gamma encodes information while slow gamma integrates in the introduction. However, in a task such as circular track running (from the methods, it appears that there is no new information to be acquired within a trial), one would guess that after the first few laps, slow gamma would be the dominant rhythm. Therefore, one must wonder why there are so few neurons modulated by slow gamma (~3.7%).
The proportion of ~3.7% was the part of place cells phase-locked to slow gamma. However, we aimed to find that the slow gamma phase precession of place cells promoted the theta sequence development. We would not expect the cells phase-locked to slow gamma if phase precession occurred.
b. Line 375: The authors contend that: "...slow gamma, related to information compression, was also required to modulate fast gamma phase-locked cells during sequence development. We replicated the results of slow gamma phase precession at the ensemble level (Zheng et al., 2016), and furthermore observed it at late development, but not early development, of theta sequences." In relation to the idea that slow gamma may be coupled to - if not a distorted representation of - theta harmonics, it has been observed that there are changes in theta relative to novelty.
i. A. Jeewajee, C. Lever, S. Burton, J. O'Keefe, and N. Burgess (2008) report a decrease in theta frequency in novel circumstances that disappears with increasing familiarity.
ii. One could surmise that this change in frequency is associated with alterations in theta harmonics (observed here as slow gamma), challenging the author's interpretation.
iii. Therefore, the authors have a compelling opportunity to replicate the results of Jeewajee et al., characterizing changes of theta along with the development of slow gamma precession, as the environment becomes familiar. It will become important to demonstrate, using bicoherence as offered by Aru et al., how slow gamma can be disambiguated from theta harmonics. Specifically, we anticipate that the authors will be able to quantify A) theta harmonics (the number, and their respective frequencies and amplitudes), B) the frequency and amplitude of slow gamma, and C) how they can be quantitatively decoupled. Through this, their discussion of oscillatory changes with novelty-familiarity will garner a significant impact.
We think we have demonstrated that the slow gamma observed in this study was not purely theta harmonics. We didn’t focus on the frequency change of slow gamma or theta rhythms in this study. Further investigation will be carried out on this topic in the future.
c. Broadly, it is interesting that the authors emphasize the gamma frequency throughout the discussion. Given that the power spectral density of the Local Field Potential (LFP) exhibits a log-log relationship between amplitude and frequency, as described by Buzsáki (2005) in "Rhythms of the Brain," and considering that the LFP is primarily generated through synaptic transmembrane currents (Buzsáki et al., 2012), it seems parsimonious to consider that the bulk of synaptic activity occurs at lower frequencies (e.g., theta). Since synaptic transmission represents the most direct form of inter-regional communication, one might wonder why gamma (characterized by lower amplitude rhythms) is esteemed so highly compared to the higher amplitude theta rhythm. Why isn't the theta rhythm, instead, regarded as the primary mode of communication across brain regions? A discussion exploring this question would be beneficial.
We thank the reviewer for this deep thinking. When stating the conclusion on gamma rhythms, we didn’t mean to weaken the role of theta rhythm. Conversely, the fast or slow gamma episodes were detected riding on theta rhythms, and we believe that the information compression should occur at a finer scale within a theta cycle scale. More investigation will be carried out on this topic in the future.
Recommendations for the authors:
Reviewer #1 (Recommendations For The Authors):
(1) It is helpful to clearly define "FG-cell sequences" before the relevant results are described in the Results section. More importantly, the seemingly conflicting results between Figure 3 and Figure 8 may need to be clarified.
The “exFG-sequences and exNFG sequences”, “FG-cell sequences and NFG-cell sequences” have been defined clearly in the revised manuscript. Moreover, the seemingly conflicting results between Figure 3 and Figure 8 have been interpreted properly.
(2) It is helpful to clearly state the N and what defines a sample whenever a result is described.
In each statistical results, the N and what defines a sample have been clarified in the revised manuscript.
(3) Addressing the questions regarding the methods (#5) would clarify some of the results.
The questions regarding the Methods part has addressed in the revised manuscript.
(4) Line #244: "successful" should be "successive"?
Fixed.
Reviewer #2 (Recommendations For The Authors):
- The writing of the manuscript can be substantially improved.
The manuscript can be substantially revised and updated.
- I noticed that the last author of the manuscript is not the lead or corresponding and has only provided a limited contribution to this work (according to the detailed author contributions). The second to last author seems to be the main senior intellectual contributor and supervisor, together with the third to last author. This speaks of potential bad academic practices where a senior person whose intellectual contribution to the study is relatively minor takes the last author position, against the standard conventions on authorship worldwide. I strongly suggest that this is corrected.
We thank the reviewer for raising this problem. The last author Dr. Ming was also a senior author and supervised this project with large contribution. We have fixed his role as a co-corresponding author in the revised manuscript.


