Peer review process
Revised: This Reviewed Preprint has been revised by the authors in response to the previous round of peer review; the eLife assessment and the public reviews have been updated where necessary by the editors and peer reviewers.
Read more about eLife’s peer review process.Editors
- Reviewing EditorBavesh KanaUniversity of the Witwatersrand, Johannesburg, South Africa
- Senior EditorBavesh KanaUniversity of the Witwatersrand, Johannesburg, South Africa
Reviewer #1 (Public review):
Summary:
The authors aimed to confirm the association between the human leukocyte antigen (HLA)-II region and tuberculosis (TB) susceptibility within admixed African populations. Building upon previous findings from the International Tuberculosis Host Genetics Consortium (ITHGC), this study sought to address the limitations of small sample size and the inclusion of admixed samples by employing the Local Ancestry Allelic Adjusted (LAAA) model, as well as identify TB susceptibility loci in an admixed South African cohort.
Strengths:
The major strengths of this study include the use of multiple TB case-control datasets from diverse South African populations and ADMIXTURE for global ancestry inference.
Weaknesses:
The major weakness of this study include insufficient significant novel discoveries and reliance on cross-validation. The use of existing models did not add value to this study.
Appraisal:
The authors achieved their aims. However, the results still needed to be further validated in the future.
Impact:
The innovative use of the LAAA model and the comprehensive dataset in this study may make contributions to the field of genetic epidemiology.
Reviewer #2 (Public review):
Summary:
This manuscript is about using different analytical approaches to allow ancestry adjustments to GWAS analyses amongst admixed populations. This work is a follow-on from the recently published ITHGC multi-population GWAS (https://doi.org/10.7554/eLife.84394), with the focus on the admixed South African populations. Ancestry adjustment models detected a peak of SNPs in the class II HLA DPB1, distinct from the class II HLA DQA1 loci signficant in the ITHGC analysis.
Strengths:
Excellent demonstration of GWAS analytical pipelines in highly admixed populations. Particularly the utility of ancestry adjustment to improve study power to detect novel associations. Further confirmation of the importance of the HLA class II locus in genetic susceptibility to TB.
Weaknesses:
Limited novelty compared to the group's previous existing publications and the body of work linking HLA class II alleles with TB susceptibility in South Africa or other African populations. This work includes only ~100 new cases and controls from what has already been published. High resolution HLA typing has detected significant signals in both the DQA1 and DPB1 regions identified by the larger ITHGC and in this GWAS analysis respectively (Chihab L et al. HLA. 2023 Feb; 101(2): 124-137).
Despite the availability of strong methods for imputing HLA from GWAS data (Karnes J et Plos One 2017), the authors did not confirm with HLA typing the importance of their SNP peak in the class II region. This would have supported the importance of this ancestry adjustment versus prior ITHGC analysis.
The populations consider active TB and healthy controls (from high-burden presumed exposed communities) and do not provide QFT or other data to identify latent TB infection.
Important methodological points for clarification and for readers to be aware of when reading this paper:
(1) One of the reasons cited for the lack of African ancestry-specific associations or suggestive peaks in the ITHGC study was the small African sample size. The current association test includes a larger African cohort and yields a near-genome-wide significant threshold in the HLA-DPB1 gene originating from the KhoeSan ancestry. Investigation is needed as to whether the increase in power is due to increased African samples and not necessarily the use of the LAAA model as stated on lines 295 and 296?
Authors response - The Manhattan plot in Figure 3 includes the results for all four models: the traditional GWAS model (GAO), the admixture mapping model (LAO), the ancestry plus allelic (APA) model and the LAAA model. In this figure, it is evident that only the LAAA model identified the association peak on chromosome 6, which lends support the argument that the increase in power is due to the use of the LAAA model and not solely due to the increase in sample size.
Reviewer comment - This data supports the authors conclusions that increase power is related to the LAAA model application rather than simply increase sample size.
(2) In line 256, the number of SNPs included in the LAAA analysis was 784,557 autosomal markers; the number of SNPs after quality control of the imputed dataset was 7,510,051 SNPs (line 142). It is not clear how or why ~90% of the SNPs were removed. This needs clarification.
Authors response:
In our manuscript (line 194), we mention that "...variants with minor allele frequency (MAF) < 1% were removed to improve the stability of the association tests." A large proportion of imputed variants fell below this MAF threshold and were subsequently excluded from this analysis.
Reviewers additional comment: The authors should specify the number of SNPs in the dataset before imputation and indicate what proportion of the 784,557 remaining SNPs were imputed. Providing this information might help the reader better understand the rationale behind the imputation process.
(3) The authors have used the significance threshold estimated by the STEAM p-value < 2.5x10⁻⁶ in the LAAA analysis. Grinde et al. (2019 implemented their significance threshold estimation approach tailored to admixture mapping (local ancestry (LA) model), where there is a reduction in testing burden. The authors should justify why this threshold would apply to the LAAA model (a joint genotype and ancestry approach).
Authors response: We describe in the methods (line 189 onwards) that the LAAA model is an extension of the APA model. Since the APA model itself simultaneously performs the null global ancestry only model and the local ancestry model (utilised in admixture mapping), we thus considered the use of a threshold tailored to admixture mapping appropriate for the LAAA model.
Reviewers additional comment: While the LAAA model is an extension of the APA model, the authors describe the LAAA test as 'models the combination of the minor allele and the ancestry of the minor allele at a specific locus, along with the effect of this interaction,' thus a joint allele and ancestry effects model. Grinde et al. (2019) proposed the significance threshold estimation approach, STEAM, specifically for the LA approach, which tests for ancestry effects alone and benefits from the reduced testing burden. However, it remains unclear why the authors found it appropriate to apply STEAM to the LAAA model, a joint test for both allele and ancestry effects, which does not benefit from the same reduction in testing burden.
(4) Batch effect screening and correction (line 174) is a quality control check. This section is discussed after global and local ancestry inferences in the methods. Was this QC step conducted after the inferencing? If so, the authors should justify how the removed SNPs due to the batch effect did not affect the global and local ancestry inferences or should order the methods section correctly to avoid confusion.
Authors response: The batch effect correction method utilised a pseudo-case-control comparison which included global ancestry proportions. Thus, batch effect correction was conducted after ancestry inference. We excluded 36 627 SNPs that were believed to have been affected by the batch effect. We have amended line 186 to include the exact number of SNPs excluded due to batch effect.
The ancestry inference by RFMix utilised the entire merged dataset of 7 510 051 SNPs. Thus, the SNPs removed due to the batch effect make up a very small proportion of the SNPs used to conduct global and local ancestry inferences (less than 0.5%). As a result, we do not believe that the removed SNPs would have significantly affected the global and local ancestry inferences. However, we did conduct global ancestry inference with RFMix on each separate dataset as a sanity check. In the Author response tables 1 and 2, we show the average global ancestry proportions inferred for each separate dataset, the average global ancestry proportions across all datasets and the average global ancestry proportions inferred using the merged dataset. The SAC and Xhosa cohorts are shown in two separate tables due to the different number of contributing ancestral populations to each cohort. The differences between the combined average global ancestry proportions across the separate cohorts does not differ significantly to the global ancestry proportions inferred using the merged dataset.
This is an excellent response and should remain accessible to readers to clarify this issue.
Author response:
The following is the authors’ response to the original reviews.
Reviewer #1 (Public review):
Summary:
The authors aimed to confirm the association between the human leukocyte antigen (HLA)-II region and tuberculosis (TB) susceptibility within admixed African populations. Building upon previous findings from the International Tuberculosis Host Genetics Consortium (ITHGC), this study sought to address the limitations of small sample size and the inclusion of admixed samples by employing the Local Ancestry Allelic Adjusted (LAAA) model, as well as identify TB susceptibility loci in an admixed South African cohort.
Strengths:
The major strengths of this study include the use of six TB case-control datasets collected over 30 years from diverse South African populations and ADMIXTURE for global ancestry inference. The former represents comprehensive dataset used in this study and the later ensures accurate determination of ancestral contributions. In addition, the identified association in the HLA-DPB1 gene shows near-genomewide significance, enhancing the credibility of the findings.
Weaknesses:
The major weakness of this study includes insufficient significant discoveries and reliance on crossvalidation. This study only identified one variant significantly associated with TB status, located in an intergenic region with an unclear link to TB susceptibility. Despite identifying multiple lead SNPs, no other variants reached the genome-wide significance threshold, limiting the overall impact of the findings. The absence of an independent validation cohort, with the study relying solely on crossvalidation, is also a major limitation. This approach restricts the ability to independently confirm the findings and evaluate their robustness across different population samples.
Appraisal:
The authors successfully achieved their aims of confirming the association between the HLA-II region and TB susceptibility in admixed African populations. However, the limited number of significant discoveries, reliance on cross-validation, and insufficient discussion of model performance and SNP significance weaken the overall strength of the findings. Despite these limitations, the results support the conclusion that considering local ancestry is crucial in genetic studies of admixed populations.
Impact:
The innovative use of the LAAA model and the comprehensive dataset in this study make substantial contributions to the field of genetic epidemiology.
Reviewer #2 (Public review):
Summary:
This manuscript is about using different analytical approaches to allow ancestry adjustments to GWAS analyses amongst admixed populations. This work is a follow-on from the recently published ITHGC multi-population GWAS (https://doi.org/10.7554/eLife.84394), with a focus on the admixed South African populations. Ancestry adjustment models detected a peak of SNPs in the class II HLA DPB1, distinct from the class II HLA DQA1 loci significant in the ITHGC analysis.
Strengths:
Excellent demonstration of GWAS analytical pipelines in highly admixed populations. Further confirmation of the importance of the HLA class II locus in genetic susceptibility to TB.
Weaknesses:
Limited novelty compared to the group's previous existing publications and the body of work linking HLA class II alleles with TB susceptibility in South Africa or other African populations. This work includes only ~100 new cases and controls from what has already been published. High-resolution HLA typing has detected significant signals in both the DQA1 and DPB1 regions identified by the larger ITHGC and in this GWAS analysis respectively (Chihab L et al. HLA. 2023 Feb; 101(2): 124-137). Despite the availability of strong methods for imputing HLA from GWAS data (Karnes J et Plos One 2017), the authors did not confirm with HLA typing the importance of their SNP peak in the class II region. This would have supported the importance of this ancestry adjustment versus prior ITHGC analysis.
The populations consider active TB and healthy controls (from high-burden presumed exposed communities) and do not provide QFT or other data to identify latent TB infection.
Important methodological points for clarification and for readers to be aware of when reading this paper:
(1) One of the reasons cited for the lack of African ancestry-specific associations or suggestive peaks in the ITHGC study was the small African sample size. The current association test includes a larger African cohort and yields a near-genome-wide significant threshold in the HLA-DPB1 gene originating from the KhoeSan ancestry. The investigation is needed as to whether the increase in power is due to increased African samples and not necessarily the use of the LAAA model as stated on lines 295 and 296?
Thank you for your comment. The Manhattan plot in Figure 3 includes the results for all four models: the traditional GWAS model (GAO), the admixture mapping model (LAO), the ancestry plus allelic (APA) model and the LAAA model. In this figure, it is evident that only the LAAA model identified the association peak on chromosome 6, which lends support the argument that the increase in power is due to the use of the LAAA model and not solely due to the increase in sample size.
(2) In line 256, the number of SNPs included in the LAAA analysis was 784,557 autosomal markers; the number of SNPs after quality control of the imputed dataset was 7,510,051 SNPs (line 142). It is not clear how or why ~90% of the SNPs were removed. This needs clarification.
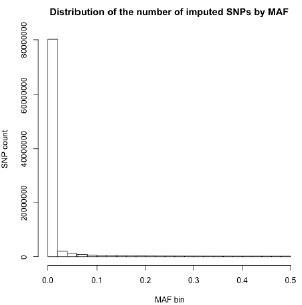
Thank you for your recommendation. In our manuscript (line 194), we mention that “…variants with minor allele frequency (MAF) < 1% were removed to improve the stability of the association tests.” A large proportion of imputed variants fell below this MAF threshold, and were subsequently excluded from this analysis. Below, we show the number of imputed variants across MAF bins for one of our datasets [RSA(A)] to substantiate this claim:
Author response image 1.
(3) The authors have used the significance threshold estimated by the STEAM p-value < 2.5x10⁻⁶ in the LAAA analysis. Grinde et al. (2019 implemented their significance threshold estimation approach tailored to admixture mapping (local ancestry (LA) model), where there is a reduction in testing burden. The authors should justify why this threshold would apply to the LAAA model (a joint genotype and ancestry approach).
Thank you for your recommendation. We describe in the methods (line 189 onwards) that the LAAA model is an extension of the APA model. Since the APA model itself simultaneously performs the null global ancestry only model and the local ancestry model (utilised in admixture mapping), we thus considered the use of a threshold tailored to admixture mapping appropriate for the LAAA model.
(4) Batch effect screening and correction (line 174) is a quality control check. This section is discussed after global and local ancestry inferences in the methods. Was this QC step conducted after the inferencing? If so, the authors should justify how the removed SNPs due to the batch effect did not affect the global and local ancestry inferences or should order the methods section correctly to avoid confusion.
Thank you for your comments. The batch effect correction method utilised a pseudo-case-control comparison which included global ancestry proportions. Thus, batch effect correction was conducted after ancestry inference. We excluded 36 627 SNPs that were believed to have been affected by the batch effect. We have amended line 186 to include the exact number of SNPs excluded due to batch effect.
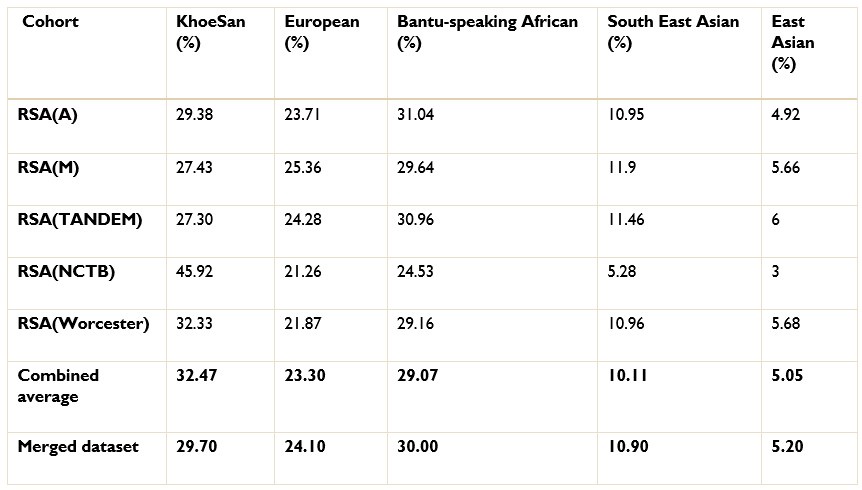
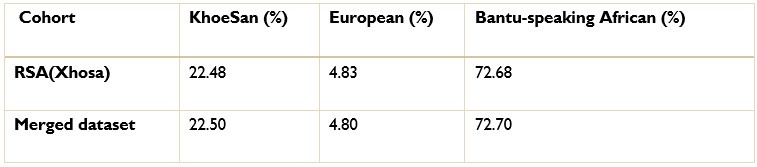
The ancestry inference by RFMix utilised the entire merged dataset of 7 510 051 SNPs. Thus, the SNPs removed due to the batch effect make up a very small proportion of the SNPs used to conduct global and local ancestry inferences (less than 0.5%). As a result, we do not believe that the removed SNPs would have significantly affected the global and local ancestry inferences. However, we did conduct global ancestry inference with RFMix on each separate dataset as a sanity check. In the tables below, we show the average global ancestry proportions inferred for each separate dataset, the average global ancestry proportions across all datasets and the average global ancestry proportions inferred using the merged dataset. The SAC and Xhosa cohorts are shown in two separate tables due to the different number of contributing ancestral populations to each cohort. The differences between the combined average global ancestry proportions across the separate cohorts does not differ significantly to the global ancestry proportions inferred using the merged dataset.
Author response table 1.
Comparison of global ancestry proportions across the separate SAC datasets and the merged cohort.
Author response table 2.
Comparison of global ancestry proportions in the Xhosa dataset and the merged cohort.
Reviewer #1 (Recommendations for the authors):
Suggestions for Improved or Additional Experiments, Data, or Analyses:
(1) It might be beneficial to consider splitting the data into separate discovery and validation cohorts rather than relying solely on cross-validation. This approach could provide a stronger basis for independently confirming the findings.
Thank you for your suggestion. However, we are hesitant to divide our already modest dataset (n=1544) into separate discovery and validation cohorts, as this would reduce the statistical power to detect significant associations.
(2) Clearly stating the process of cross-validation in the methods section and reporting relevant validation statistics, such as accuracy, sensitivity, specificity, and area under the curve (AUC), would provide a more comprehensive assessment of the model's performance.
Thank you for your recommendation. We would like to highlight this article, “GWAS in the southern African context” (1), which evaluated the performance of the LAAA model compared to other models in three- and five-way admixed populations. Given the thorough evaluation of the model’s performance in that study, we did not find it necessary to reassess its performance in this manuscript.
(3) Analysing racial cohorts separately to see if you can replicate previous results and find significant markers in combined non-African populations that are not evident in African-only samples might be useful.
Thank you for your suggestion. We would like to respectfully note that race is a social construct, and its use as a proxy for genetic ancestry can be problematic (2). In our study, we rather rely on genetic ancestry inferred using ancestry inference software to provide a more accurate representation of our cohort's genetic diversity. Additionally, our cohort consists mostly of a highly admixed population group, with some individuals exhibiting ancestral contributions from up to five different global populations. Therefore, it is not possible to categorize our samples into distinct “Africanonly” or “non-African” groups.
(4) It might be worthwhile to consider using polygenic risk scores (PRS) to combine multiple genetic influences. This approach could help in identifying cumulative genetic effects that are not apparent when examining individual SNPs.
Thank you for your recommendation. While constructing a polygenic risk score (PRS) is beyond the scope of the current study, but an ongoing interest in our group, we recognize its potential value and will consider incorporating this approach in future research endeavours or a separate publication. A recent publication by Majara et al showed that that PRS accuracy is low for all traits and varies across ancestrally and ethnically diverse South African groups (3).
Recommendations for Improving the Writing and Presentation:
Including a more thorough discussion of the methodological limitations, such as the challenges of studying admixed populations and the potential limitations of the LAAA model, would provide a more balanced perspective.
Thank you for your suggestion. To provide a more balanced perspective, we included the limitations of our study in the discussion, from line 429 to like 451.
Minor Corrections to the Text and Figures:
Including all relevant statistics would improve clarity. For example, providing confidence intervals for the odds ratios and discussing any observed trends or outliers would be beneficial.
Thank you for your recommendation. We have added 95% confidence intervals to all odds ratios reported in Table 3. However, beyond the association peak identified in the HL-II region associated with the phenotype, we do not observe any other trends or outliers in or LAAA analysis.
Reviewer #2 (Recommendations for the authors):
Points for improvement:
(1) Related to the different datasets and inclusions in previous publications, it would also be good to better understand the different numbers of cases and controls included across the previous and current analyses, or discussion thereof. For instance, the RSA(M) dataset includes 555/440 cases/controls for this analysis and only 410/405 cases/controls in the ITHGC analysis. Other discrepancies are noted across the other published datasets compared to those included in this analysis, and these always need to be detailed in a supplement or similar to better understand if this could have introduced bias or was in fact correct based on the additional ancestry-related restriction applied.
Thank you for your comments. Table 1 of our manuscript lists number of individuals in the RSA(M) dataset, including related individuals. As described in line 131, related individuals were subsequently excluded during quality control: “Individual datasets were screened for relatedness using KING software (Manichaikul et al., 2010) and individuals up to second degree relatedness were removed.” The ITHGC only reported the number of unrelated individuals included their analyses, which would account for the discrepancies in the reported number of cases and controls.
(2) The imbalance between cases and controls in this analysis is quite striking, and it is unusual to have the imbalance favour cases over controls. This contrasts with the ITHGC, where there are substantially more controls. There is no comment on how this could potentially impact this analysis.
Thank you for your comment. We have included a note on our case-control imbalance in the discussion:
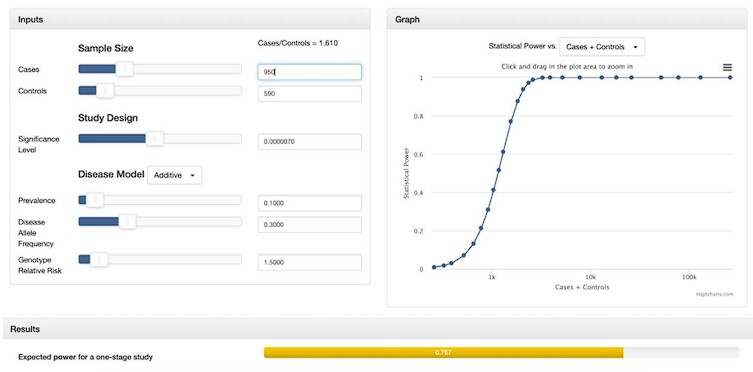
“While many studies discuss methods for addressing case-control imbalances with more controls than cases (which can inflate type 1 error rates (Zhou et al. 2018; Dai et al. 2021; Öztornaci et al. 2023), few address the implications of a large case-to-control ratio like ours (952 cases to 592 controls). To assess the impact of this imbalance, we used the Michigan genetic association study (GAS) power calculator (Skol et al. 2006). Under an additive disease model with an estimated prevalence of 0.15, a disease allele frequency of 0.3, a genotype relative risk of 1.5, and a default significance level of 7 × 10⁻⁶, we achieved an expected power of approximately 75%. With a balanced sample size of 950 cases and 950 controls, power would exceed 90%, but it would drop significantly with a smaller balanced cohort of 590 cases and 590 controls. Given these results, we proceeded with our analysis to maximize statistical power despite the case-control imbalance.”
Author response image 2.
Minor comments
(1) Referencing around key points of TB epidemiology and disease states seems out of date, given recent epidemiology reviews and seminal nature or lancet review articles. Please update.
Thank you for your suggestion. We have included the following recent publications in the introductory paragraph:
Zaidi, S. M. A., Coussens, A. K., Seddon, J. A., Kredo, T., Warner, D., Houben, R. M. G. J., & Esmail, H. (2023). Beyond latent and active tuberculosis: a scoping review of conceptual frameworks. EClinicalMedicine, 66, 102332. https://doi.org/10.1016/j.eclinm.2023.102332
Menzies, N. A., Swartwood, N., Testa, C., Malyuta, Y., Hill, A. N., Marks, S. M., Cohen, T., & Salomon, J. A. (2021). Time Since Infection and Risks of Future Disease for Individuals with Mycobacterium tuberculosis Infection in the United States. Epidemiology, 32(1), 70–78. https://doi.org/10.1097/EDE.0000000000001271
Cudahy, P. G. T., Wilson, D., & Cohen, T. (2020). Risk factors for recurrent tuberculosis after successful treatment in a high burden setting: a cohort study. BMC Infectious Diseases, 20(1), 789. https://doi.org/10.1186/s12879-020-05515-4
Escombe, A. R., Ticona, E., Chávez-Pérez, V., Espinoza, M., & Moore, D. A. J. (2019). Improving natural ventilation in hospital waiting and consulting rooms to reduce nosocomial tuberculosis transmission risk in a low resource setting. BMC Infectious Diseases, 19(1), 88. https://doi.org/10.1186/s12879-019-3717-9
Laghari, M., Sulaiman, S. A. S., Khan, A. H., Talpur, B. A., Bhatti, Z., & Memon, N. (2019). Contact screening and risk factors for TB among the household contact of children with active TB: a way to find source case and new TB cases. BMC Public Health, 19(1), 1274. https://doi.org/10.1186/s12889-0197597-0
Matose, M., Poluta, M., & Douglas, T. S. (2019). Natural ventilation as a means of airborne tuberculosis infection control in minibus taxis. South African Journal of Science, 115(9/10). https://doi.org/10.17159/sajs.2019/5737
Smith, M. H., Myrick, J. W., Oyageshio, O., Uren, C., Saayman, J., Boolay, S., van der Westhuizen, L., Werely, C., Möller, M., Henn, B. M., & Reynolds, A. W. (2023). Epidemiological correlates of overweight and obesity in the Northern Cape Province, South Africa. PeerJ, 11, e14723. https://doi.org/10.7717/peerj.14723
(2) Lines 46 to 48 appear to have two contradictory statements next to each other. The first says there are numerous GWAS investigating TB susceptibility; the second says there are sparse. Please clarify.
Thank you for bringing this to our attention. We have amended the lines as follows:
“Numerous genome-wide association studies (GWASs) investigating TB susceptibility have been conducted across different population groups. However, findings from these studies often do not replicate across population groups (Möller & Kinnear, 2020; Möller et al., 2018; Uren et al., 2017).”
(3) Add ref in line 69 for two SAC populations.
Thank you for your recommendation. We have included the citation for the ITHGC meta-analysis paper here:
“The authors described possible reasons for the lack of associations, including the smaller sample size compared to the other ancestry-specific meta-analyses, increased genetic diversity within African individuals and population stratification produced by two admixed cohorts from the South African Coloured (SAC) population (Schurz et al. 2024).”
(4) Write out abbreviations the first time they appear (Line 121).
Thank you for your recommendation. We have corrected the sentence as follows:
“Monomorphic sites were removed. Individuals were screened for deviations in Hardy-Weinberg Equilibrium (HWE) for each SNP and sites deviating from the HWE threshold of 10-5 were removed.”
(5) It would be good in the supplement to see if there is a SNP peak in chromosome 20 with a hit that reached significance in the Bantu-speaking African ancestry.
Thank you for your recommendation. We have included a regional plot for the lead variant identified on chromosome 20 originating from Bantu-speaking African ancestry in the supplementary material (Supplementary Figure 3).
(6) It would be good to mention the p-values of rs28383206 from the ITHGC paper in this cohort for KhoeSan and Bantu-speaking African ancestries.
Thank you for your suggestion. We have included the following paragraph from line 352:
“The lead variant identified in the ITHGC meta-analysis, rs28383206, was not present in our genotype or imputed datasets. The ITHGC imputed genotypes using the 1000 Genomes (1000G) reference panel (4). Variant rs28383206 has an alternate allele frequency of 11.26% in the African population subgroup within the 1000G dataset (https://www.ncbi.nlm.nih.gov/snp/rs28383206). However, rs28383206 is absent from our in-house whole-genome sequencing (WGS) datasets, which include Bantu-speaking African and KhoeSan individuals. This absence suggests that rs28383206 might not have been imputed in our datasets using the AGR reference panel, potentially due to its low alternate allele frequency in southern African populations. Our merged dataset contained two variants located within 800 base pairs of r_s28383206: rs482205_ (6:32576009) and rs482162 (6:32576019). However, these variants were not significantly associated with TB status in our cohort (Supplementary Table 1).” Supplementary Table 1 can be found in the supplementary material:
(7) It would improve the readability of the ancestry proportions listed on lines 236 and 237 if these population groups were linked with the corresponding specific population used in Figure 1, as has been done in Table 2.
Thank you for your suggestion. We have amended Figure 1 to include the corresponding population labels mentioned in Table 2.
(8) In line 209, it is not clear why the number of alleles of a specific ancestry at a locus is referred to as a covariate in admixture mapping when the corresponding marginal effect is the parameter of interest.
Thank you for bringing this to our attention. We have amended the description as follows:
“(2) Local ancestry (LA) model:
This model is used in admixture mapping to identify ancestry-specific variants associated with a specific phenotype. The LA model evaluates the number of alleles of a specific ancestry at a locus and includes the corresponding marginal effect as a covariate in association analyses.”
(9) Table 3 would benefit from a column on whether the SNP was genotyped or imputed.
Thank you for your suggestion. We have included a column indicating whether the SNP was genotyped or imputed, as well as an additional column with the INFO score for imputed genotypes.
(10) The authors should remove the print and download icons in Figure 1 on lines 240 and 241.
Thank you for your suggestion. We have amended the figure as requested.
(11) In the quality control, the authors use a more relaxed threshold for missingness in individuals (90%) and genotypes (5%) and have strayed away from the conventional 97%-98%. An explanation of the choice of these thresholds will be helpful to the reader.
Thank you for your suggestion. We aimed to use similar genotype and individual missingness thresholds outline by the ITHGC meta-analysis (which utilised a threshold of 10% for both genotype and individual missingness) and the previous LAAA analysis paper performed by Swart et al. in 2021. We have amended line 116 for more clarity:
“Individuals with genotype call rates less than 90% and SNPs with more than 5% missingness were removed as described previously (5).”
References
(1) Swart Y, van Eeden G, Uren C, van der Spuy G, Tromp G, Moller M. GWAS in the southern African context. Cold Spring Harbor Laboratory. 2022;
(2) Byeon YJJ, Islamaj R, Yeganova L, Wilbur WJ, Lu Z, Brody LC, et al. Evolving use of ancestry, ethnicity, and race in genetics research-A survey spanning seven decades. Am J Hum Genet. 2021 Dec 2;108(12):2215–23.
(3) Majara L, Kalungi A, Koen N, Tsuo K, Wang Y, Gupta R, et al. Low and differential polygenic score generalizability among African populations due largely to genetic diversity. HGG Adv. 2023 Apr 13;4(2):100184.
(4) Schurz H, Naranbhai V, Yates TA, Gilchrist JJ, Parks T, Dodd PJ, et al. Multi-ancestry metaanalysis of host genetic susceptibility to tuberculosis identifies shared genetic architecture. eLife. 2024 Jan 15;13.
(5) Swart Y, Uren C, van Helden PD, Hoal EG, Möller M. Local ancestry adjusted allelic association analysis robustly captures tuberculosis susceptibility loci. Front Genet. 2021 Oct 15;12:716558.


