Global divergence in critical income for adult and childhood survival: analyses of mortality using Michaelis–Menten
- University of Toronto, Canada
- St Michael's Hospital, Canada
Figures
Figure 1
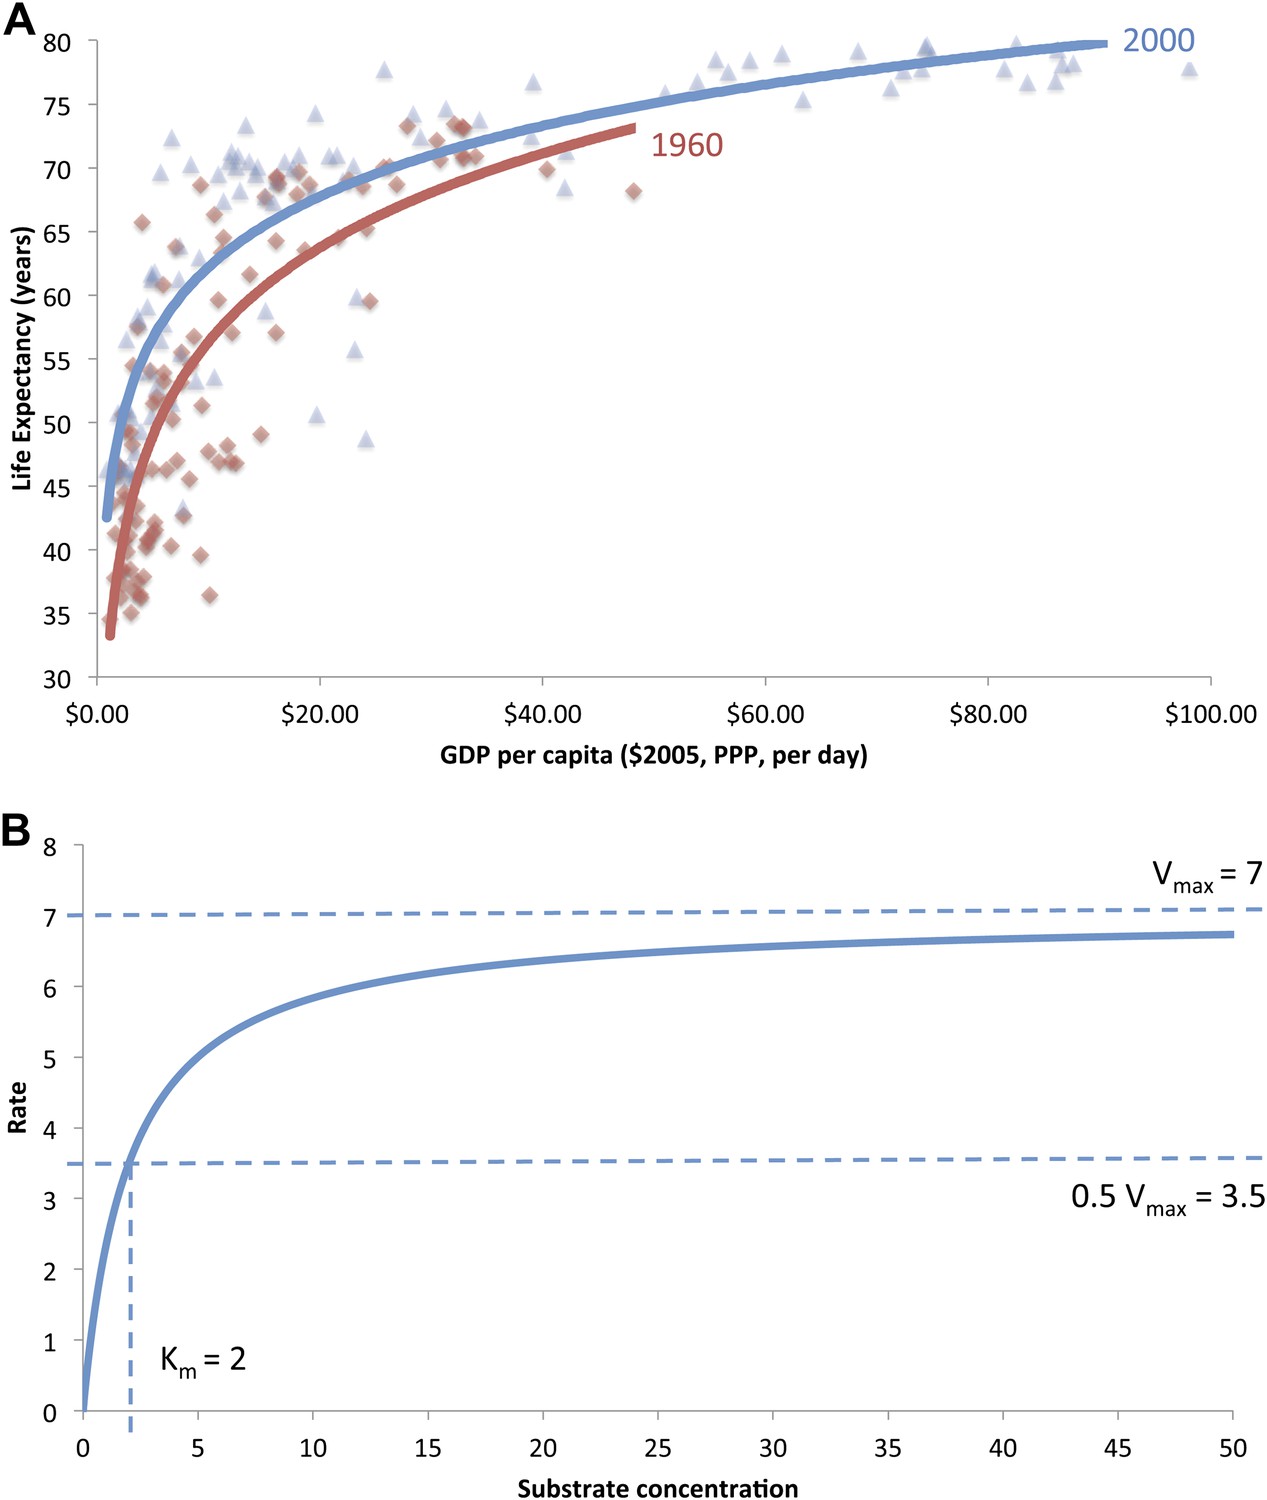
(A) The original ‘Preston curve’ (plotted as a logistic function) demonstrating an upward shift from 1930 to 1960. Source: Preston (1975). (B) A hypothetical Michaelis–Menten plot with kinetic parameters vmax and Km.
Figure 2
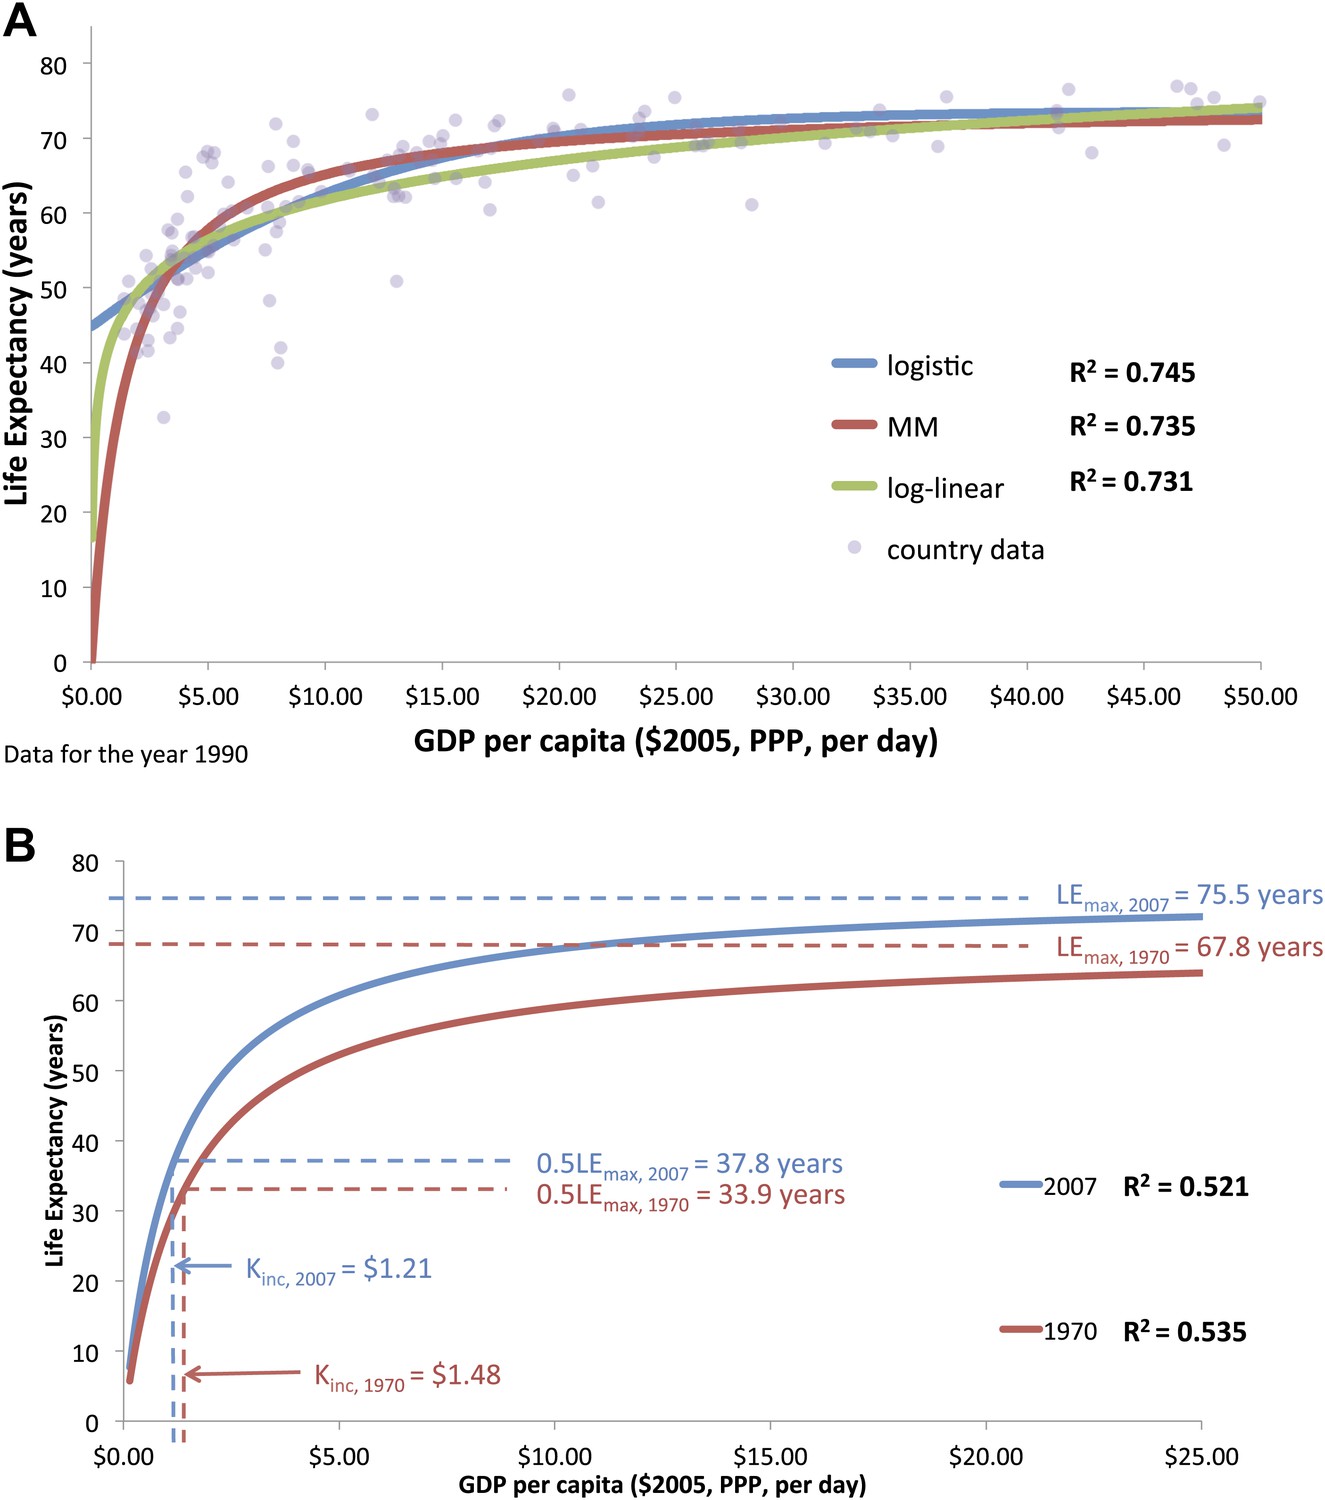
(A) The graphical similarity between the logistic, log-linear, and Michaelis–Menten model fits of life expectancy for the year 1990. (B) Preston curve plotted as an enzyme kinetics reaction with coefficients critical income and maximum life expectancy for the years 1970 and 2007.
Figure 3
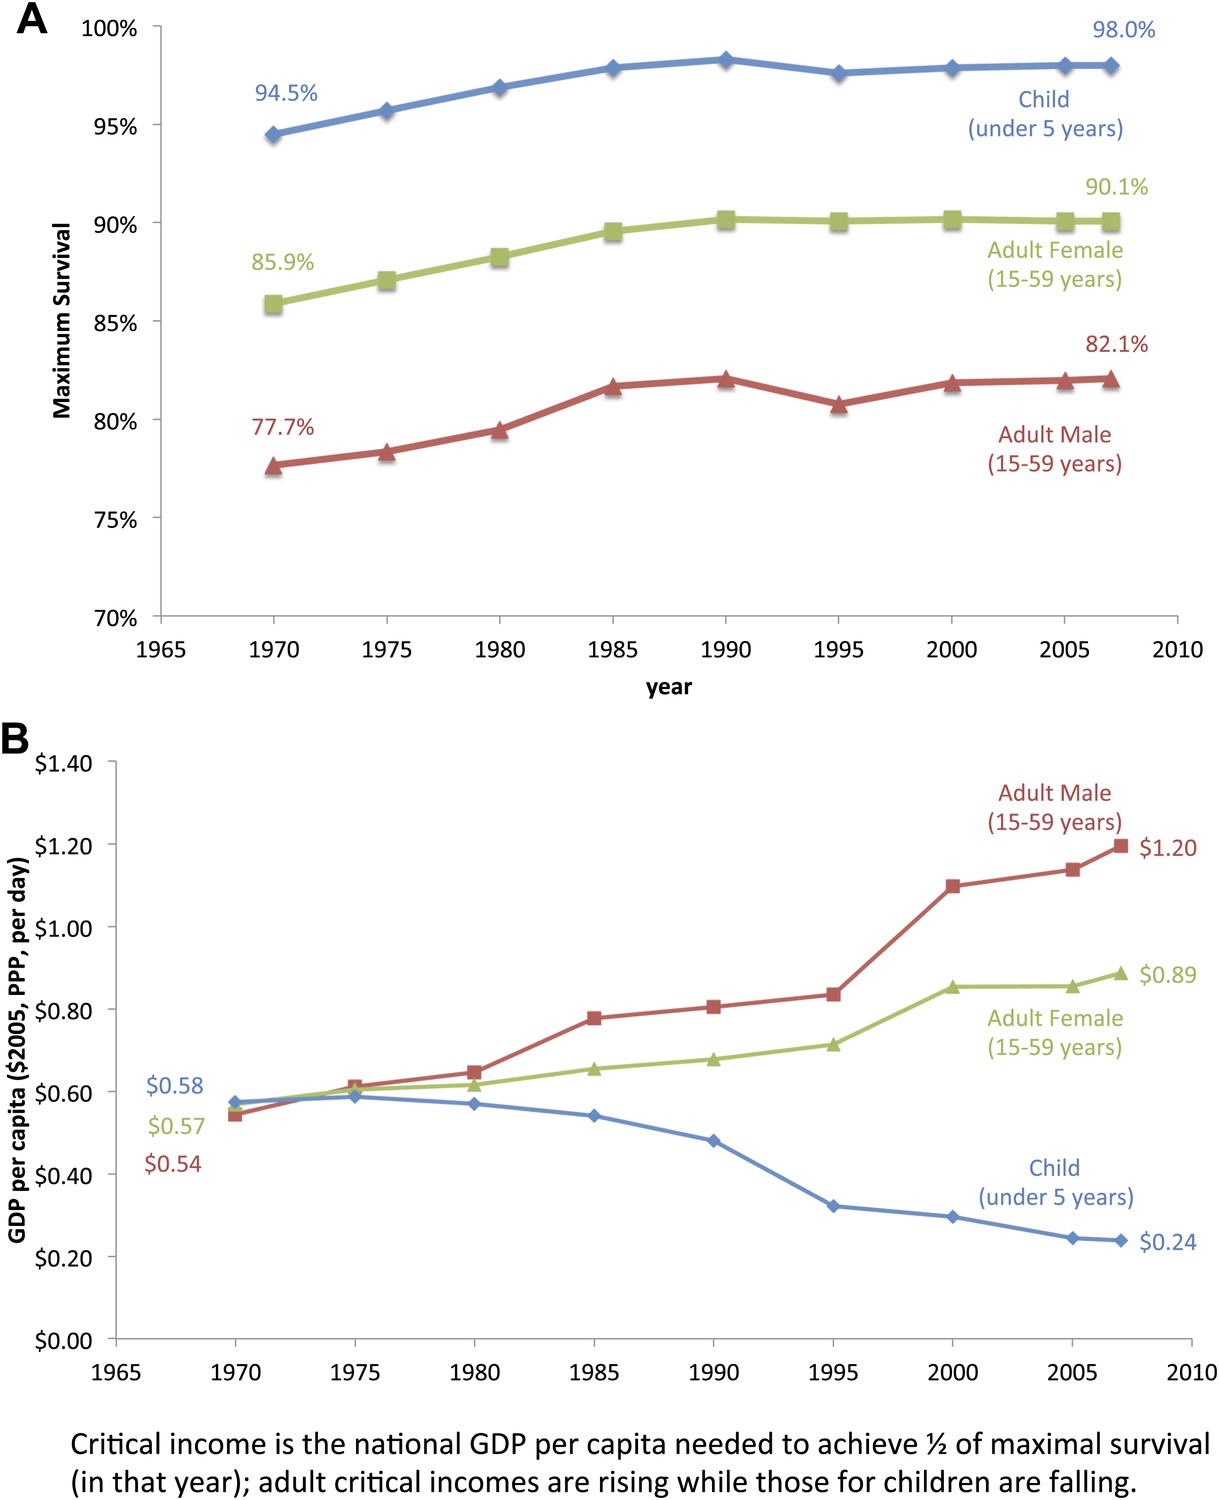
Trends for maximum survival (A) and critical income (B) for children and adults from 1970 to 2007.
Figure 4

Adult male (A) and female (B) survival regression curves for the years 1970 and 2007. Adult survival in 2007 is lower than in 1970 for countries under the income threshold of $10.95 (for men) and $5.93 (for women).
Figure 5
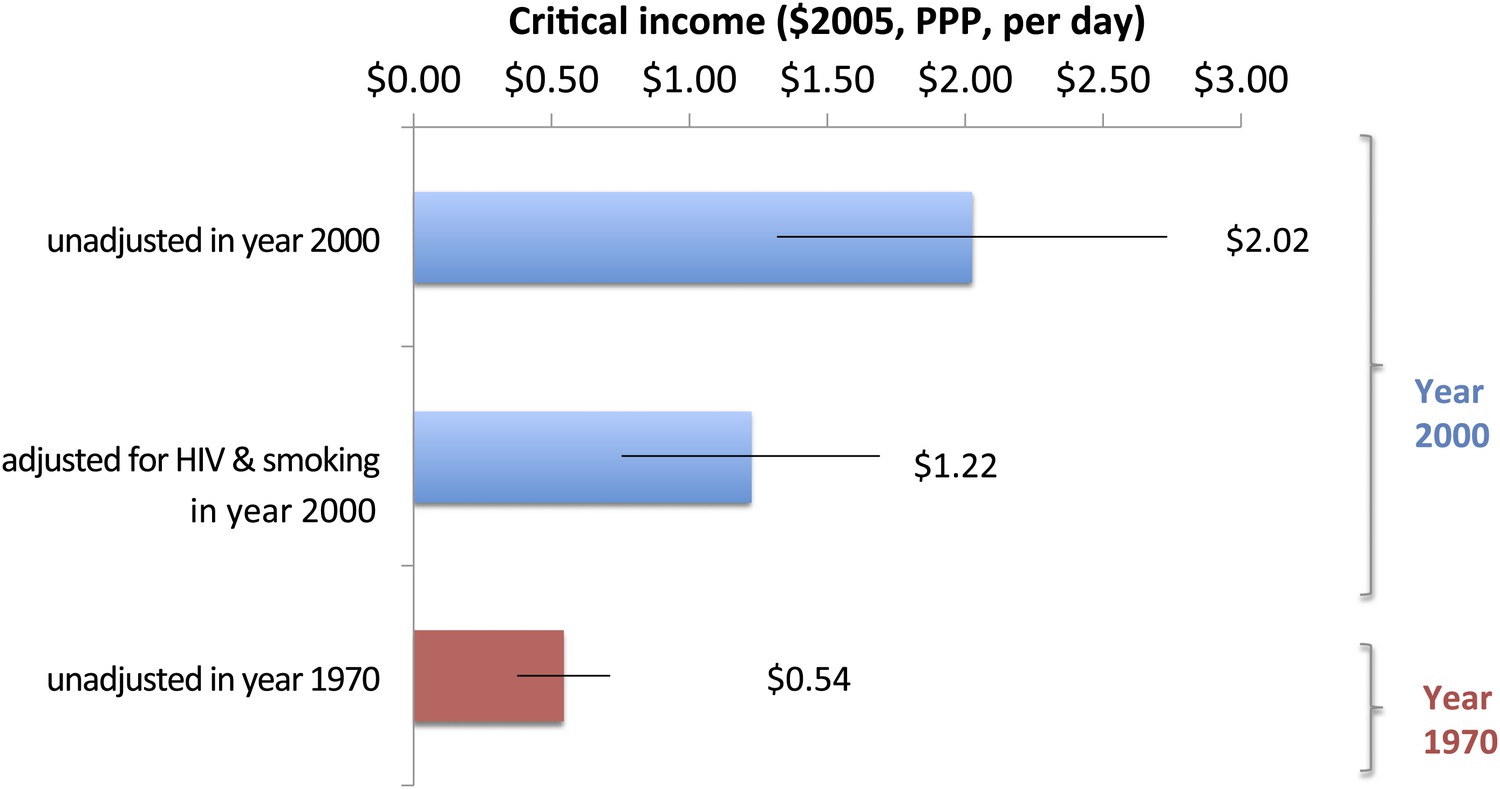
Impact of smoking and HIV on critical income for adult males in 2000.
Figure 6
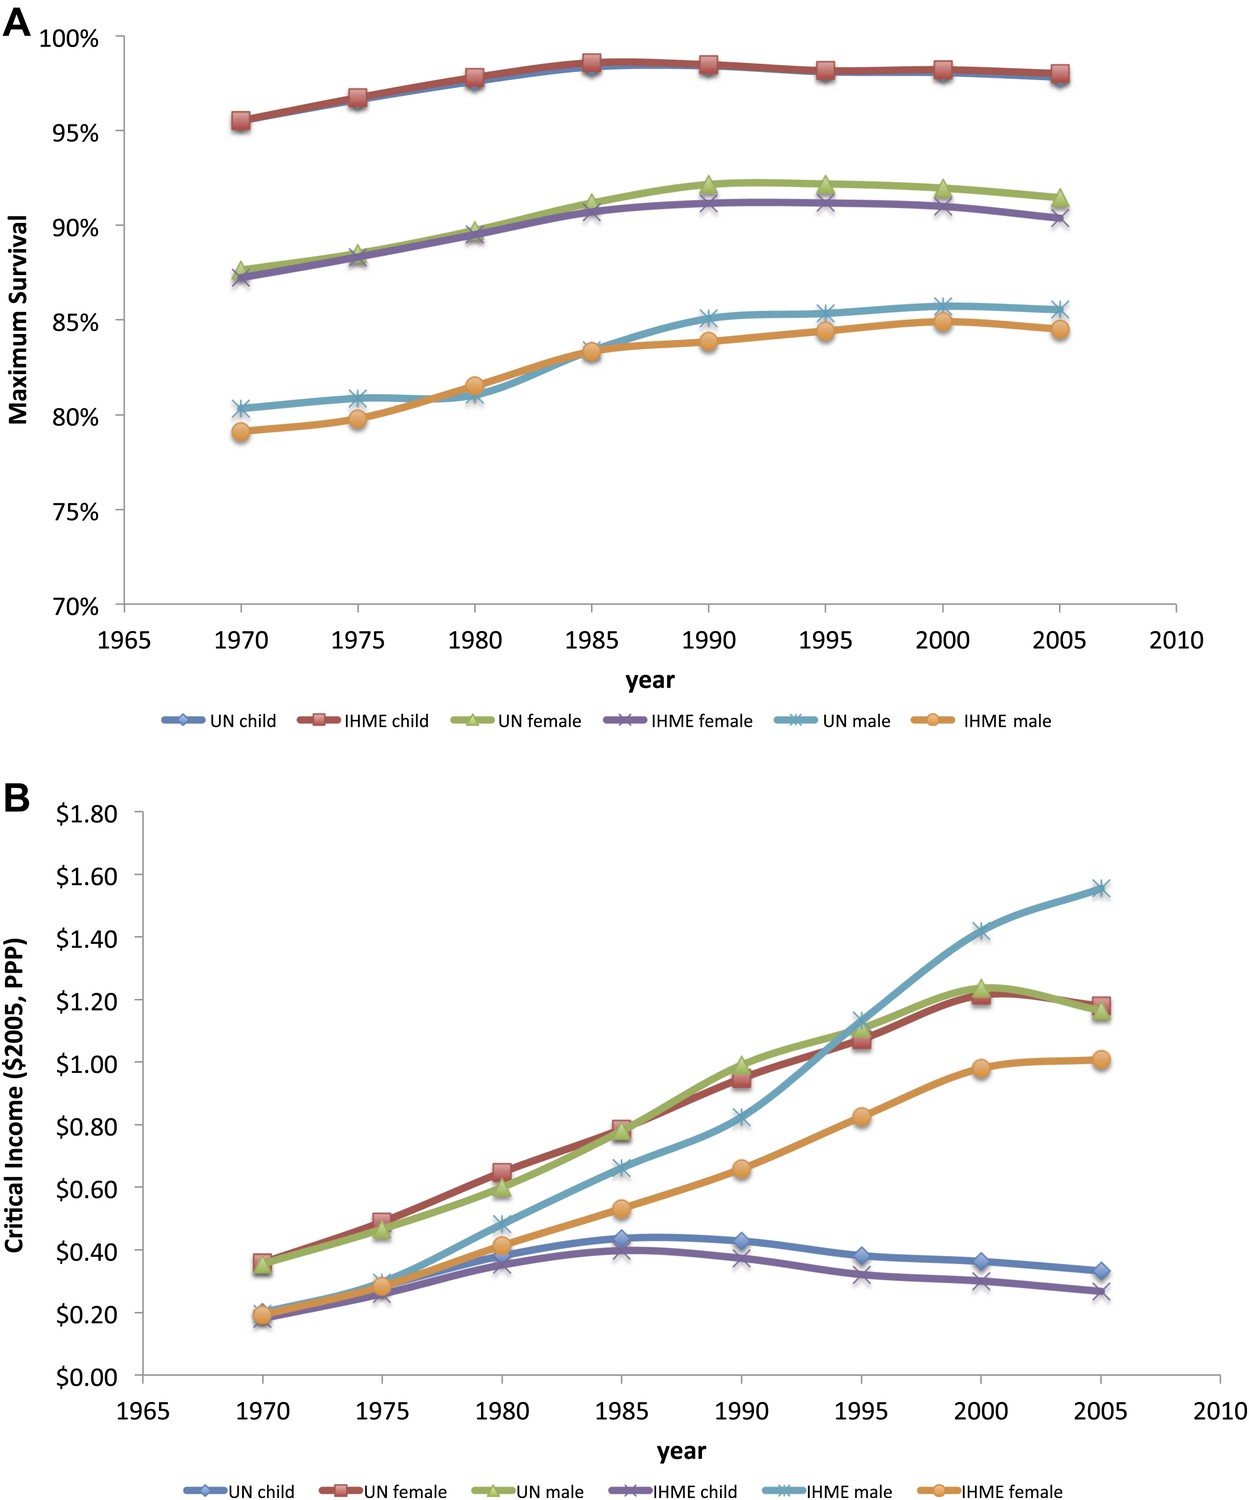
Child, adult male and adult female maximum survival (A) and critical income (B) curves from 1970 to 2005 using two different data sources (IHME and UN Population Division). Maximum survival and critical income values were calculated using 5-year averages where the national income per capita and country survival rates for year i was an average for the years i to i + 4.
Tables
Table 1
Maximum life expectancy, critical income, and regression coefficients (95% confidence intervals) for all countries at 5-year intervals from 1970 to 2007
| Year | n | R2 | MaxLife expectancy (LEmax, years) | 5% trimmed mean LE for high-income countries | Income require for varying levels of LEmax | |||||
| Full sample | 95% random sample | Critical income (Kinc, 50%) | 66.70% | 80% | 90% | |||||
| Full sample | 95% random sample | |||||||||
| 1970 | 148 | 0.535 | 67.8 (65.4–70.1) | 67.6 | 66.7 | 1.48 (1.18–1.78) | 1.43 | 2.96 | 5.92 | 13.32 |
| 1975 | 148 | 0.574 | 69.3 (67.2–71.4) | 69.2 | 70.3 | 1.50 (1.22–1.77) | 1.53 | 3.00 | 6.00 | 13.50 |
| 1980 | 149 | 0.668 | 71.3 (69.6–73.0) | 71.1 | 71.8 | 1.51 (1.28–1.74) | 1.46 | 3.02 | 6.04 | 13.59 |
| 1985 | 152 | 0.716 | 73.2 (71.8–74.8) | 73.1 | 73.2 | 1.50 (1.29–1.70) | 1.46 | 3.00 | 6.00 | 13.50 |
| 1990 | 164 | 0.735 | 74.6 (73.2–75.9) | 73.5 | 74.3 | 1.45 (1.27–1.63) | 1.34 | 2.90 | 5.80 | 13.05 |
| 1995 | 177 | 0.677 | 75.0 (73.6–76.4) | 74.8 | 75.4 | 1.31 (1.13–1.49) | 1.27 | 2.62 | 5.24 | 11.79 |
| 2000 | 178 | 0.64 | 75.2 (73.8–76.7) | 75.3 | 76.2 | 1.27 (1.08–1.46) | 1.27 | 2.54 | 5.08 | 11.43 |
| 2005 | 177 | 0.532 | 75.3 (73.6–76.9) | 75.6 | 76.5 | 1.19 (0.97–1.41) | 1.23 | 2.38 | 4.76 | 10.71 |
| 2007 | 172 | 0.521 | 75.5 (73.9–77.1) | 75.7 | 76.4 | 1.21 (0.98–1.44) | 1.22 | 2.42 | 4.84 | 10.89 |
-
Note: All model parameters were found to be significant, p<0.0001.
Table 2
Comparison of the logistic adapted Michaelis–Menten and log-linear models for the year 1990
| Model | Form | R2 | Parameters | |||
| Logistic | 0.745 | LEmax = 73.6 (72.1–75.1) | a = 0.642 (0.546–0.739) | b = 0.129 (0.159–0.100) | Inflection point = −3.43 | |
| Adapted Michaelis–Menten | 0.735 | LEmax = 74.6 (73.2–75.9) | kinc = 1.50 (1.29–1.70) | |||
| Log-linear | LE = a + b × ln(GDP) | 0.731 | a = 44.1 (42.0–46.2) | b = 7.65 (6.93–8.37) | ||
Table 3
Maximum survival, critical income, and regression coefficients (95% confidence intervals) from 1970 to 2005
| Year | Child | Female | Female (with HIV covariate) | Male | Male (with HIV covariate) | ||||||||||||
| R2 | Max% | Kinc, $ | R2 | Max% | Kinc, $ | R2 | Max% | Kinc, $ | HIV | R2 | Max% | Kinc, $ | R2 | Max% | Kinc, $ | HIV | |
| 1970 | 0.444 | 94.5 (92.7–96.2) | 0.58 (0.46–0.70) | 0.376 | 85.9 (84.1–87.7) | 0.57 (0.43–0.70) | 0.253 | 77.7 (75.6–79.7) | 0.54 (0.38–0.71) | ||||||||
| 1980 | 0.569 | 96.9 (95.7–98.2) | 0.57 (0.48–0.66) | 0.448 | 88.3 (86.7–89.9) | 0.62 (0.49–0.74) | 0.286 | 79.5 (77.5–81.6) | 0.65 (0.46–0.83) | ||||||||
| 1990 | 0.629 | 98.3 (97.4–99.2) | 0.48 (0.42–0.55) | 0.482 | 90.2 (88.7–91.8) | 0.68 (0.55–0.81) | 0.595 | 90.4 (88.8–91.4) | 0.54 (0.41–0.67) | −1.8 (−1.2 to −2.4) | 0.380 | 82.1 (80.2–84.1) | 0.81 (0.62–0.99) | 0.498 | 81.8 (79.8–83.8) | 0.60 (0.42–0.79) | −2.2 (−1.3 to −2.8) |
| 2000 | 0.530 | 97.9 (97.2–98.7) | 0.30 (0.25–0.34) | 0.377 | 90.2 (88.0–92.4) | 0.86 (0.65–1.06) | 0.787 | 92.1 (90.5–93.6) | 0.69 (0.55–0.82) | −1.8(−1.6 to −2.0) | 0.284 | 81.9 (79.0–84.8) | 1.10 (0.77–1.43) | 0.720 | 83.5 (81.4–85.6) | 0.79 (0.57–1.00) | −2.2 (−1.9 to −2.5) |
| 2005 | 0.466 | 98.0 (97.3–98.6) | 0.25 (0.20–0.29) | 0.323 | 90.1 (87.8–92.3) | 0.86 (0.63–1.12) | 0.803 | 92.4 (90.9–93.8) | 0.68 (0.54–0.81) | −2.2(−1.8 to −2.5) | 0.254 | 82.0 (79.0–85.0) | 1.14 (0.81–1.58) | 0.739 | 84.2 (82.1–86.3) | 0.82 (0.59–1.04) | −2.6 (−3.0 to −2.2) |
-
Note: All model parameters were found to be significant, p<0.0001.
Table 4
First differences analysis for HIV prevalence and cigarette consumption on country-specific critical income from 1990 to 2000
| N | R2 | HIV α ($ per HIV %) | Standardized α | Smoking β ($ per cigarette per person per day) | Standardized β | |
| Adult male | 92 | 0.240 | 0.70 (0.27–1.13) | 0.302 | 1.70 (0.96–2.43) | 0.425 |
| Adult female | 92 | 0.504 | 0.40 (0.31–0.49) | 0.655 | 0.38 (0.23–0.54) | 0.366 |
-
Note: All model parameters were found to be significant, p<0.0001.
Additional files
-
Supplementary file 1
Country specific critical incomes for adult male, adult female and children (in constant $2005 with purchasing price parity) for the years 1970, 1990 and 2007.
- https://doi.org/10.7554/eLife.00051.013
Download links
A two-part list of links to download the article, or parts of the article, in various formats.
Downloads (link to download the article as PDF)
Open citations (links to open the citations from this article in various online reference manager services)
Cite this article (links to download the citations from this article in formats compatible with various reference manager tools)
Global divergence in critical income for adult and childhood survival: analyses of mortality using Michaelis–Menten
eLife 1:e00051.
https://doi.org/10.7554/eLife.00051


