Morphologic diversity of cutaneous sensory afferents revealed by genetically directed sparse labeling
- Johns Hopkins University School of Medicine, United States
- Howard Hughes Medical Institute, Johns Hopkins University School of Medicine, United States
Figures
Figure 1 with 2 supplements
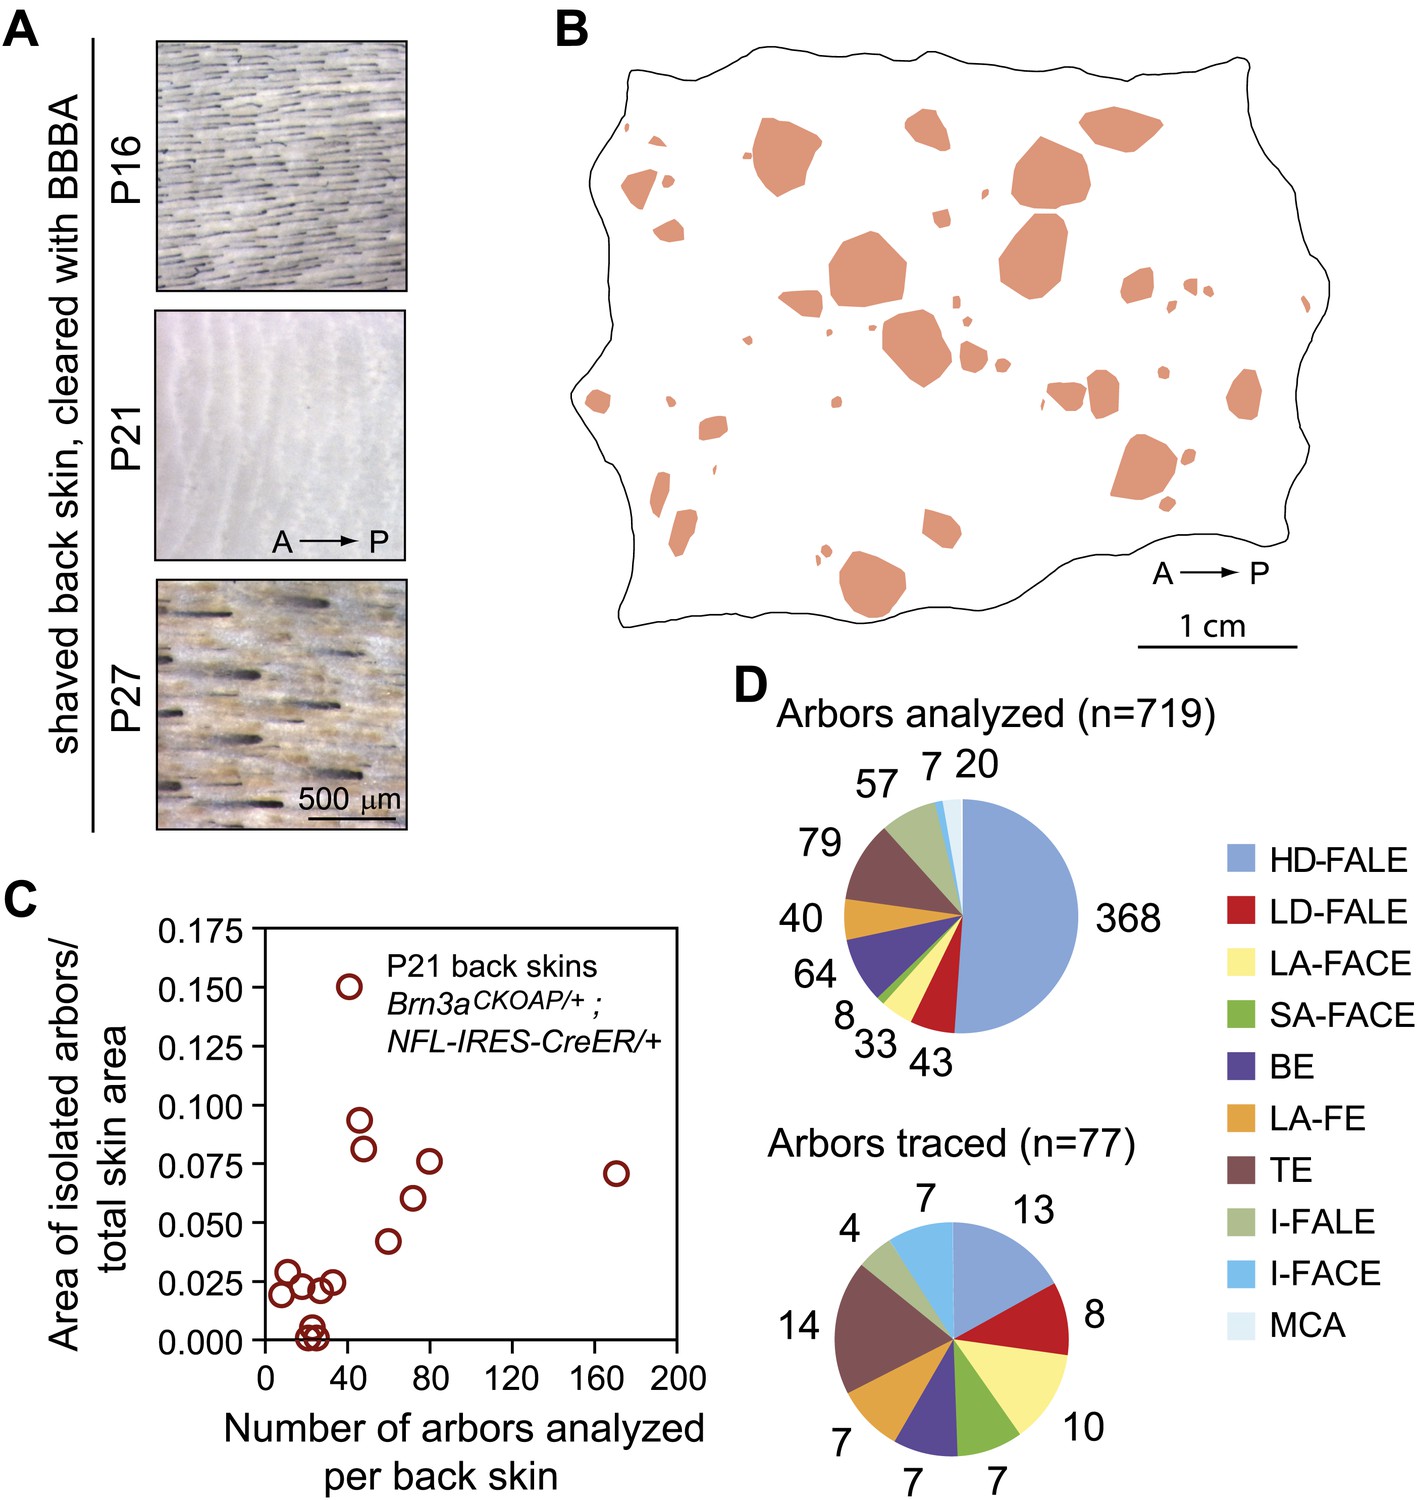
Genetically-directed sparse labeling of cutaneous sensory afferents.
(A) Shaved back skin at P16, P21, and P27 shows the nadir of pigmentation at P21. (B) Isolated AP+ arbors that were included in the arbor area survey are represented by convex pink polygons on a P21 Brn3aCKOAP/+; NFL-IRES-CreER/+ back skin. A, anterior; P, posterior. (C) Plot showing the fraction of total skin area occupied by isolated AP+ arbors vs the number of AP+ arbors included in the arbor area survey. (D) Number of cutaneous arbors of each type analyzed for arbor area (upper pie chart) and traced (lower pie chart). No MCA arbors were traced.
Figure 1—figure supplement 1
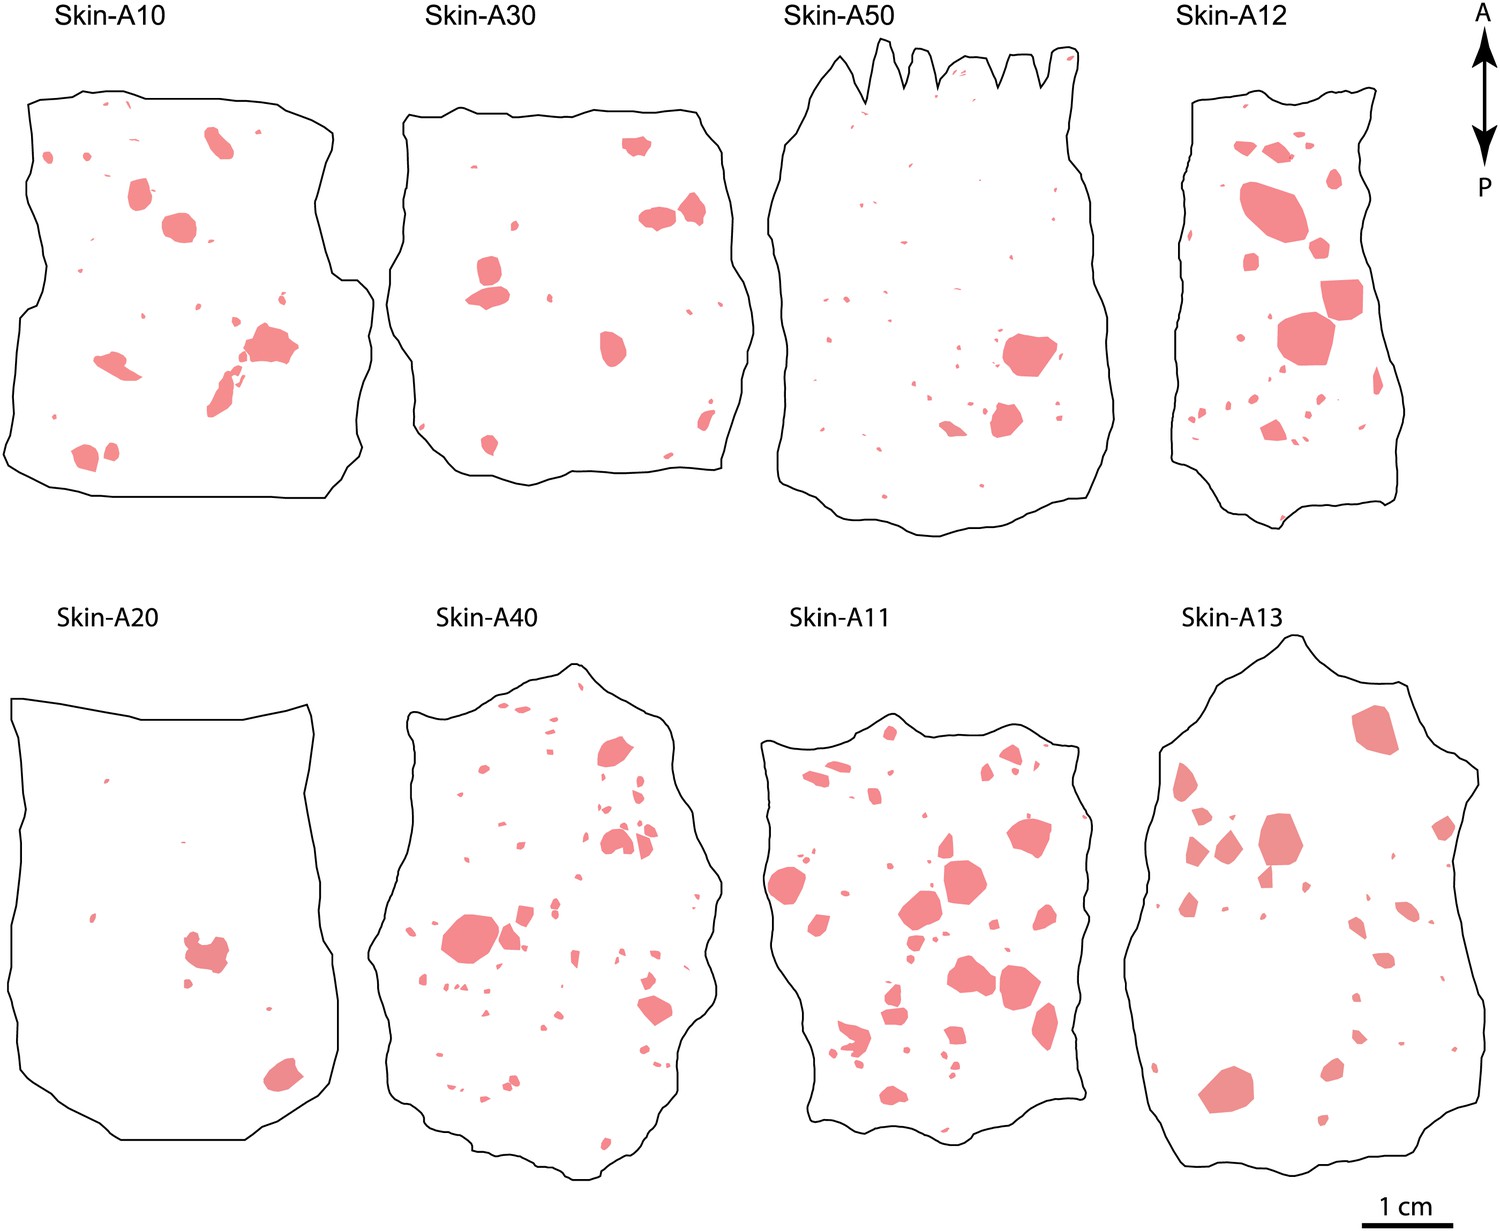
Eight skins showing well-separated cutaneous sensory afferent territories at P21.
Isolated AP+ arbors that were included in the arbor area survey are represented by convex pink polygons on a P21 Brn3aCKOAP/+; NFL-IRES-CreER/+ back skin. A, anterior; P, posterior.
Figure 1—figure supplement 2

P21 skin with a high density of AP+ cutaneous sensory arbors.
Back skin from a mouse that was exposed to Tamoxifen in utero following injection of the mother with 1 mg at GD17.
Figure 2
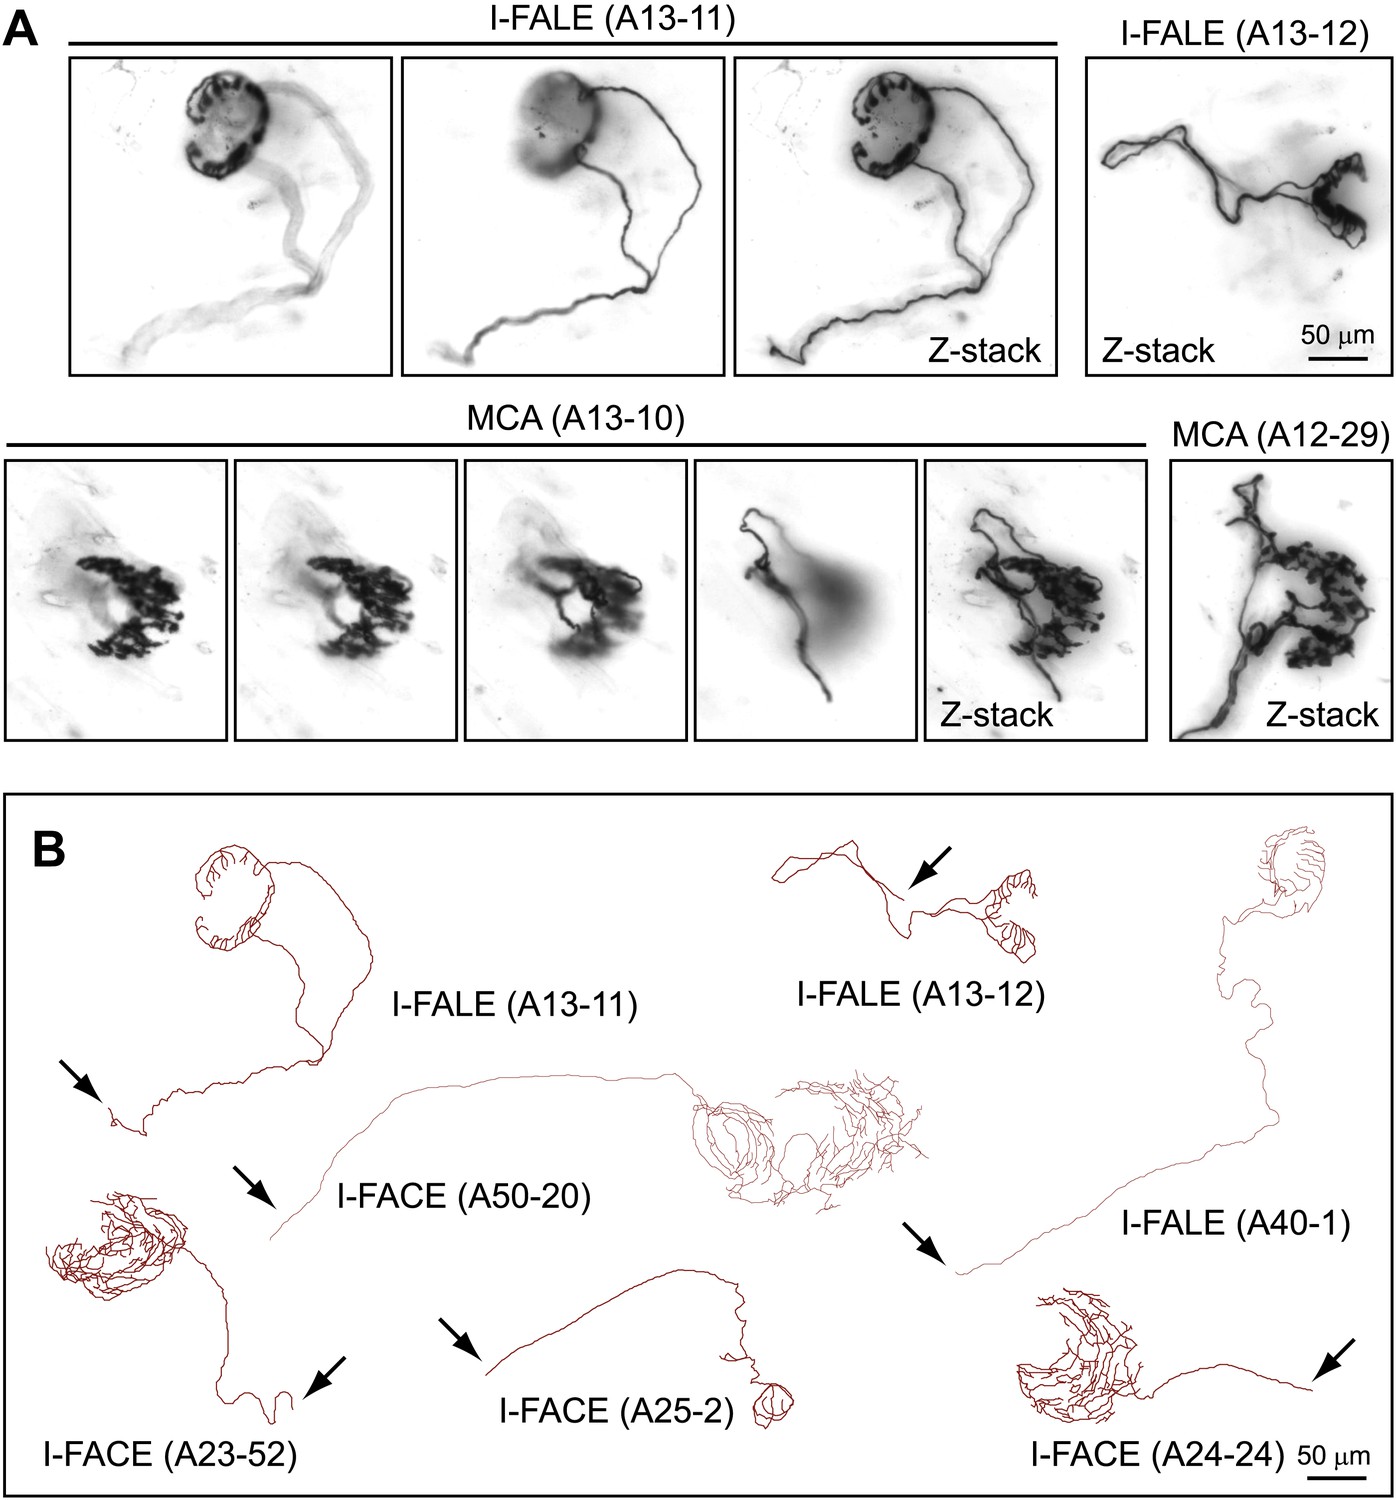
Arbors that innervate Merkel cell clusters (MCA) and isolated follicles (I-FACE and I-FALE).
(A) Upper panels, two arbors that consist of lanceolate endings surrounding an isolated follicle (I-FALE). Shown for I-FALE (A13-11) are two Z-planes with superficial (left) and deep (right) layers, with a Z-stacked image. Lower panels, two arbors that innervate an isolated Merkel cell cluster (MCA). Shown for MCA (A13-10) are four Z-planes from superficial (left) to deep (right) layers, with a Z-stacked image. (B) Tracings of three I-FALE arbors and four I-FACE arbors. Arrows indicate the afferent axon.
Figure 3 with 3 supplements
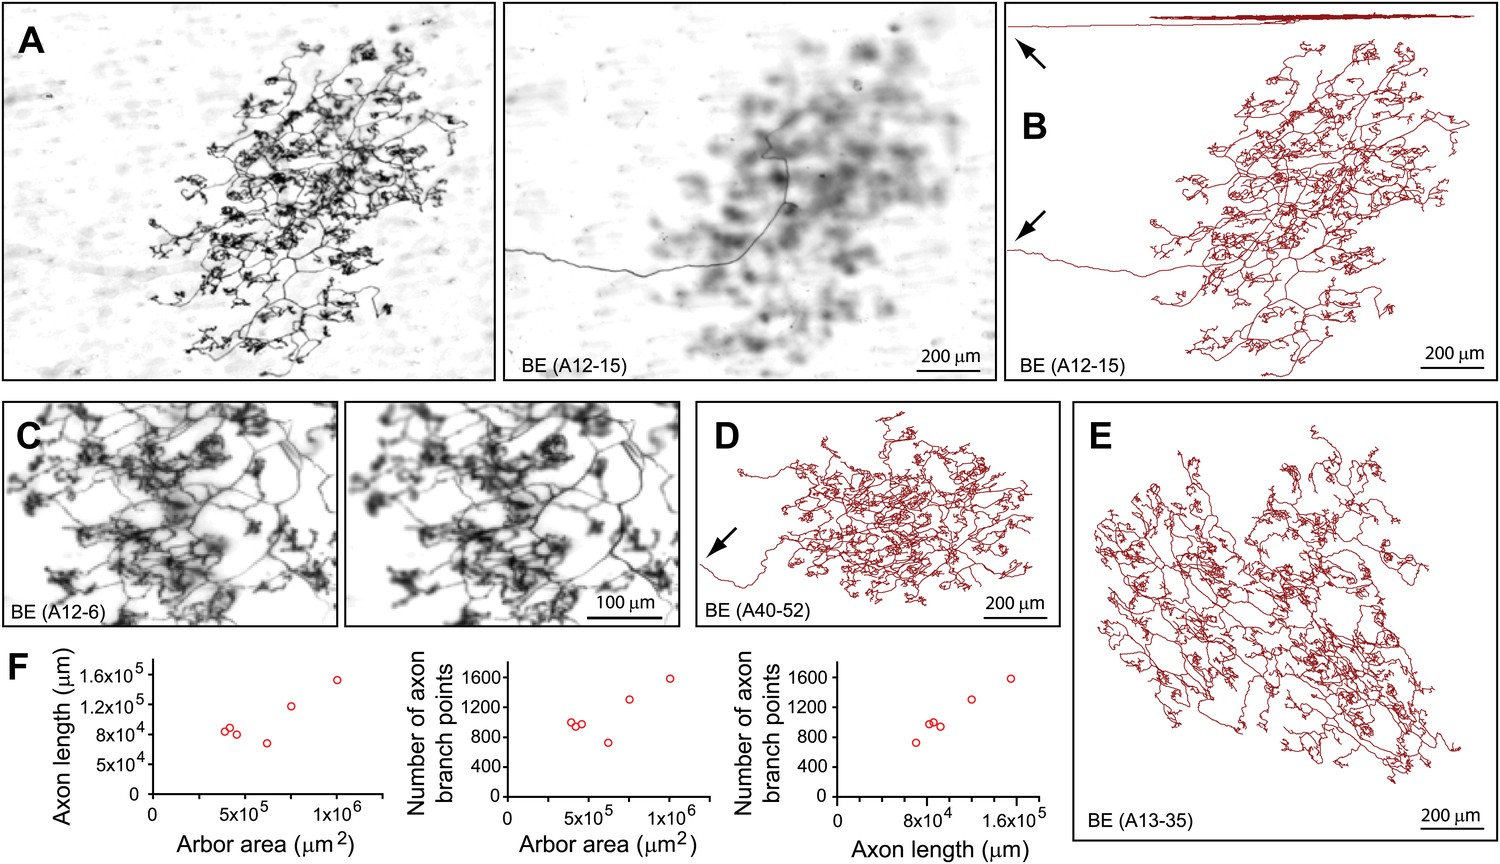
Arbors with bushy endings (BE).
(A) Arbor BE (A12-15), showing Z-planes with superficial (left) and deep (right) layers. The single axon that gives rise to this arbor is seen at the left in the deep layer image. (B) Tracing of BE (A12-15) in side view (top) and en face (bottom). Arrows in (B) and (D) indicate the afferent axon. (C) Higher magnification images of a portion of BE (A12-6) at two Z-planes. (D),(E) Tracings of BE (A13-35) and BE (A40-52). (F) Relationships between arbor area, number of axon branch points, and axon length for six traced BE arbors.
Figure 3—figure supplement 1
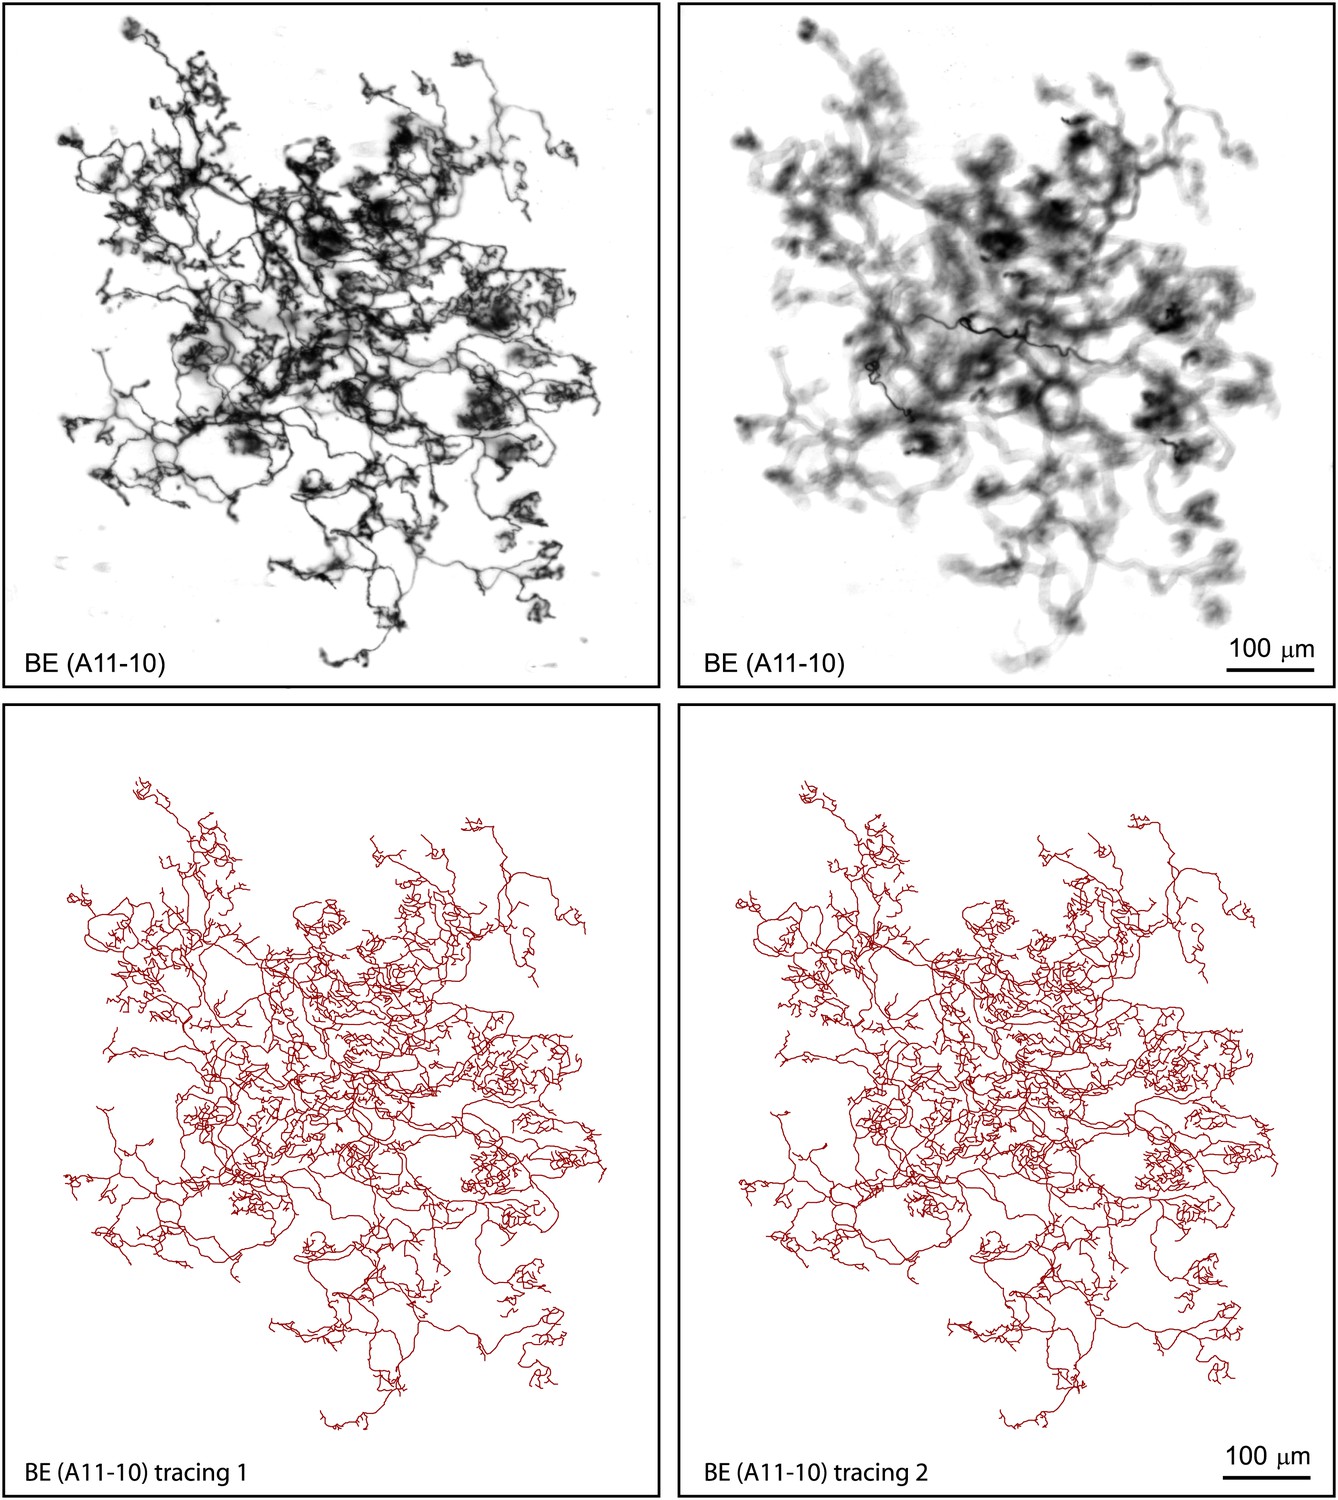
Additional BE arbor tracing.
Top: Arbor BE (A11-10) showing superficial (left), and deep (right) layers. Bottom: two independent tracings of BE (A11-10).
Figure 3—figure supplement 2

Additional BE arbor tracing.
Tracing of arbor BE (A10-8).
Figure 3—figure supplement 3
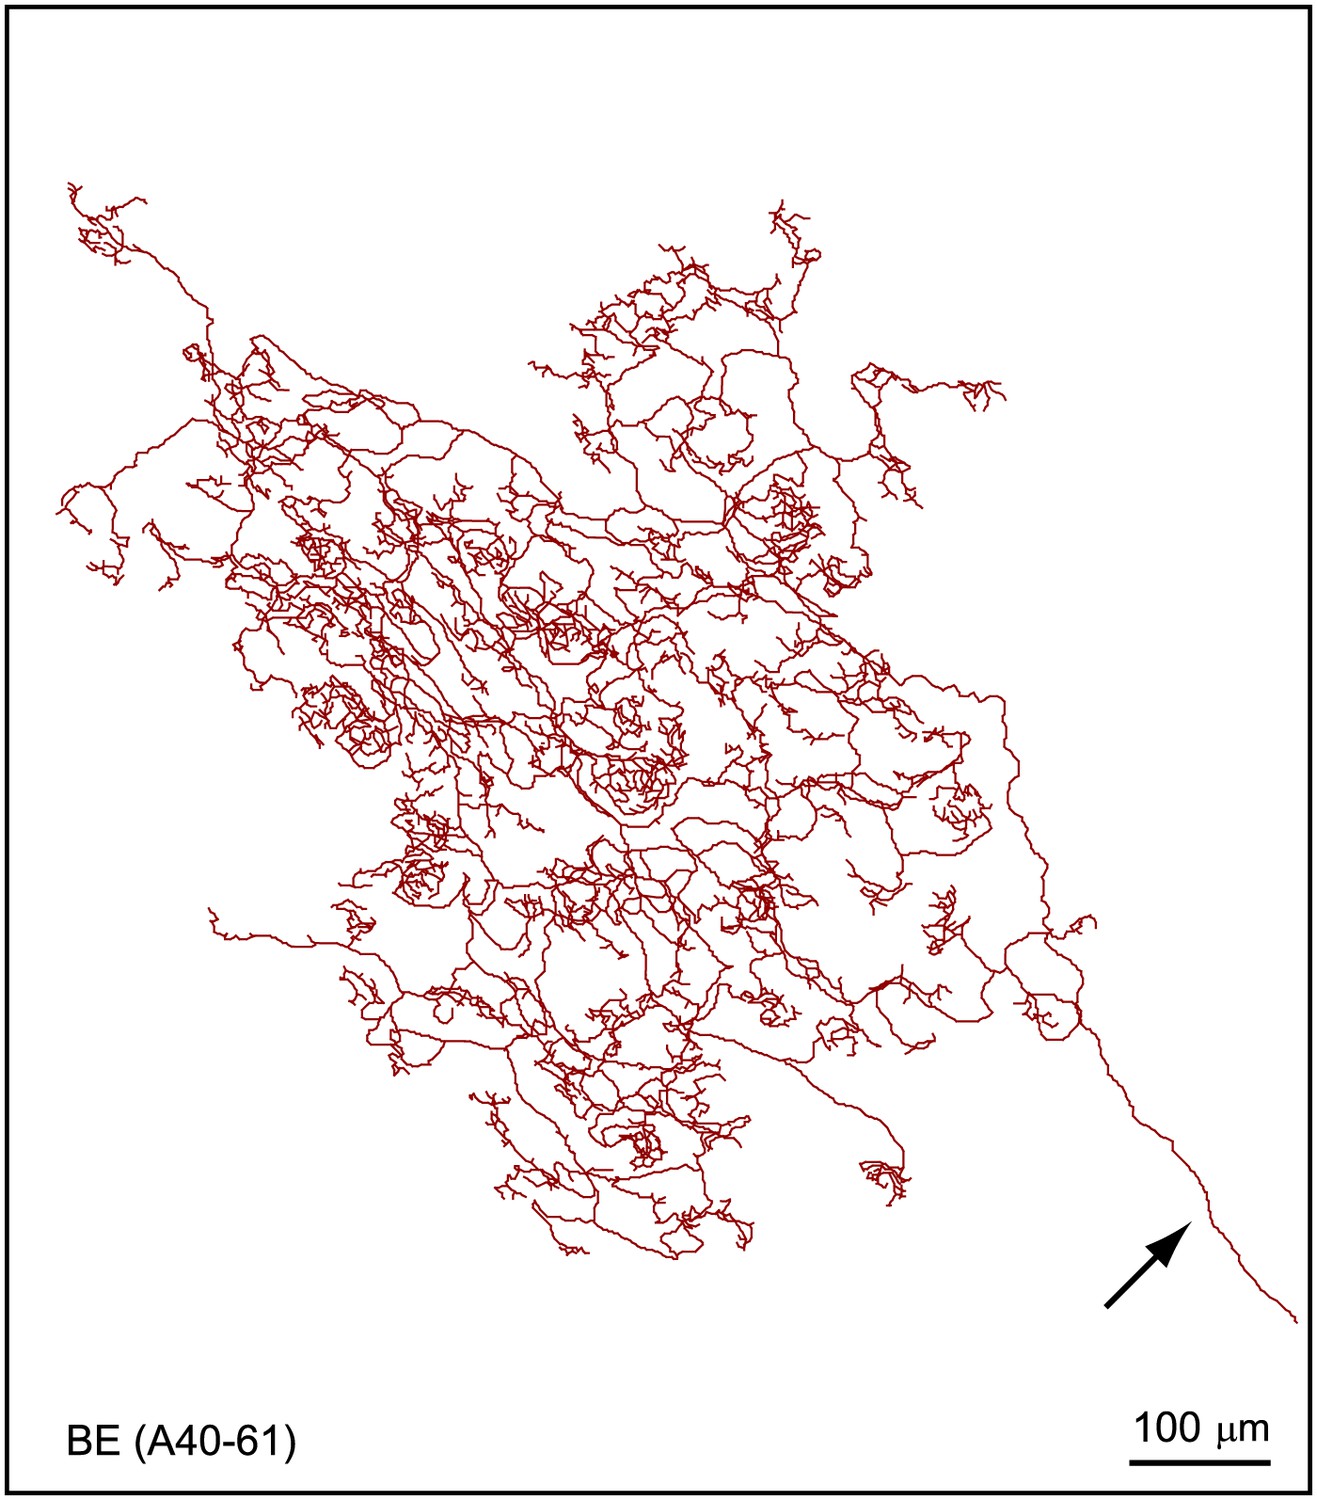
Additional BE arbor tracing.
Tracing of arbor BE (A40-61).
Figure 4
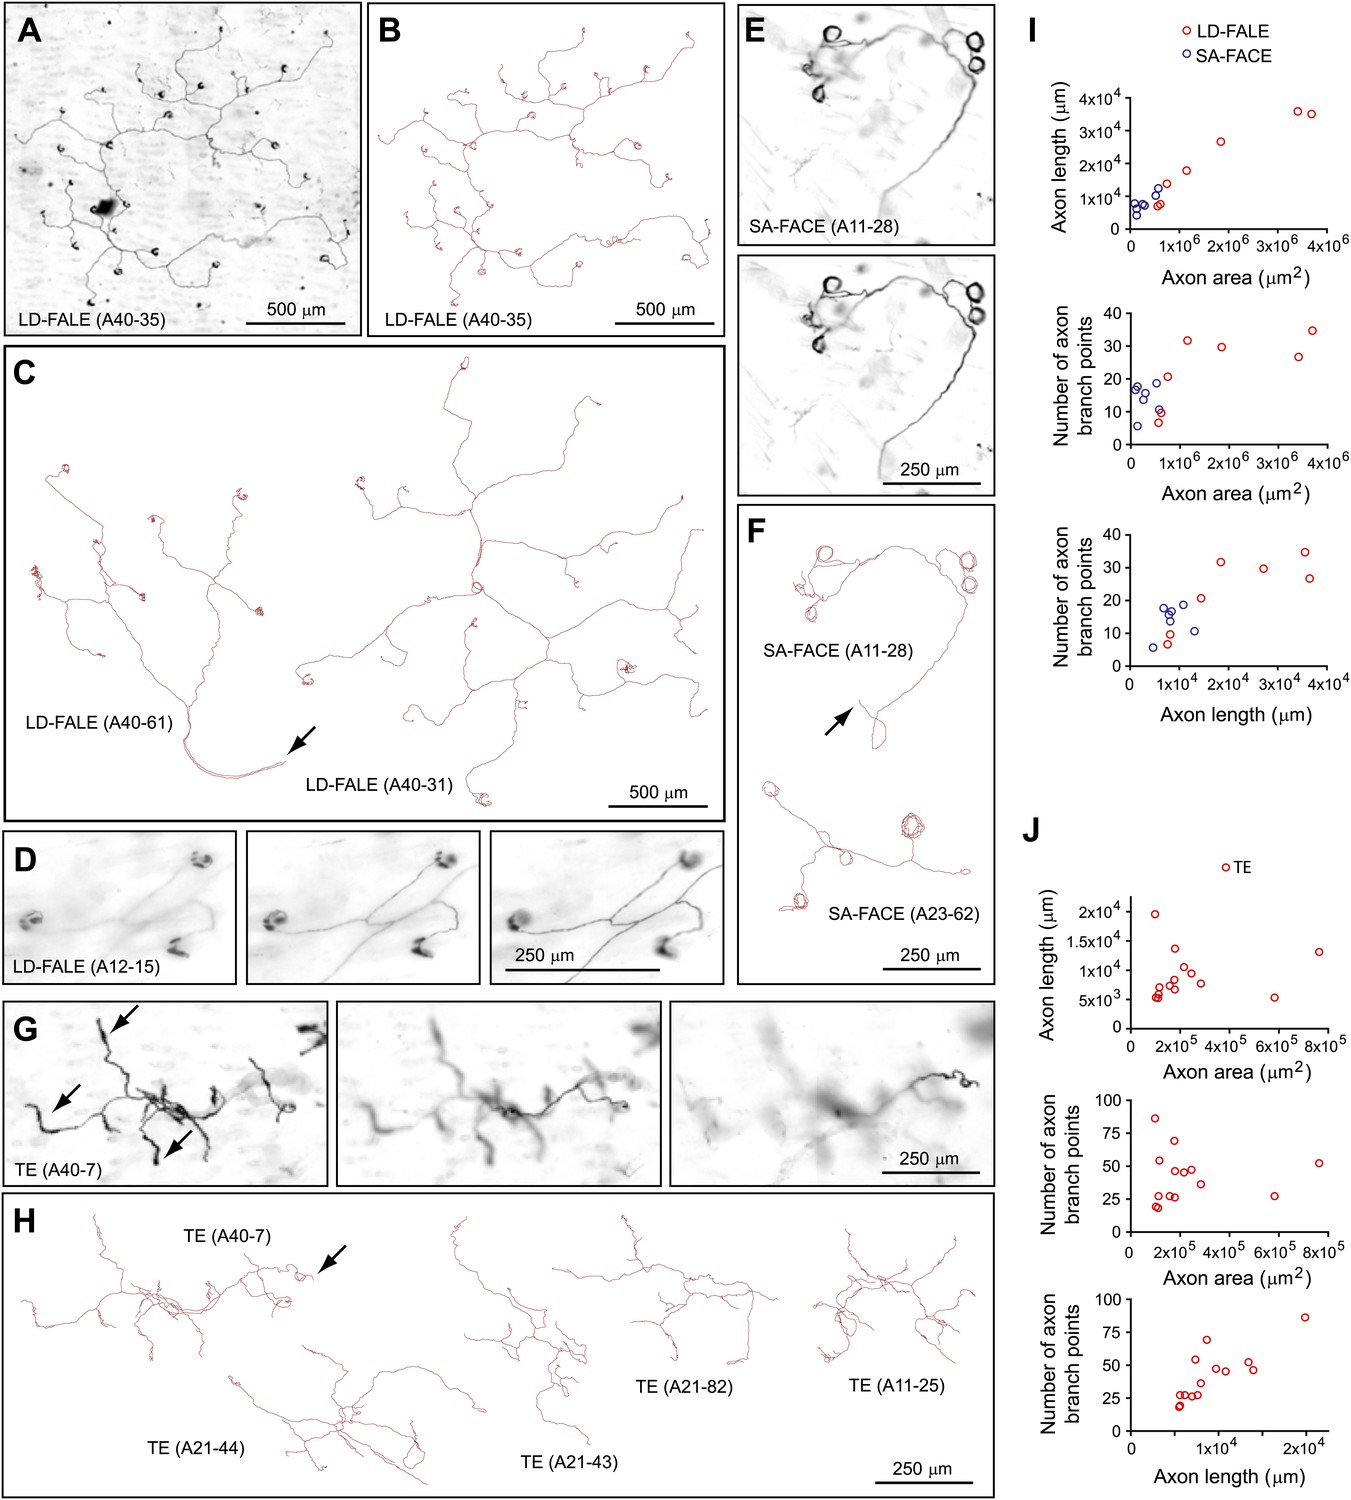
Arbors with low density follicle-associated lanceolate endings (LD-FALE), small area follicle-associated circumferential endings (SA-FACE), and thick endings (TE).
(A),(B) LD-FALE (A40-35) image (A) and trace (B). (C) Tracings of LD-FALE (A40-31) and (A40-61). Arrows in (C), (F), and (H) indicate the afferent axon. (D) Higher magnification images at three Z-planes (left to right, superficial to deep) of LD-FALE (A12-15) showing three lanceoalate endings. (E) SA-FACE (A11-28), showing Z-planes with superficial (top) and deep (bottom) layers. (F) Tracings of SA-FACE (A11-28) and SA-FACE (A23-62). (G) TE (A40-7), showing three Z-planes from superficial (left) to deep (right) layers. Arrows indicate the thickened nerve terminals of the TE arbors. (H) Five TE tracings. TE (A40-7), shown in panel G, is at the upper left. (I),(J) Relationships between arbor area, number of axon branch points, and axon length for 7 SA-FACE, 7 LD-FALE, and 14 TE traced arbors.
Figure 5
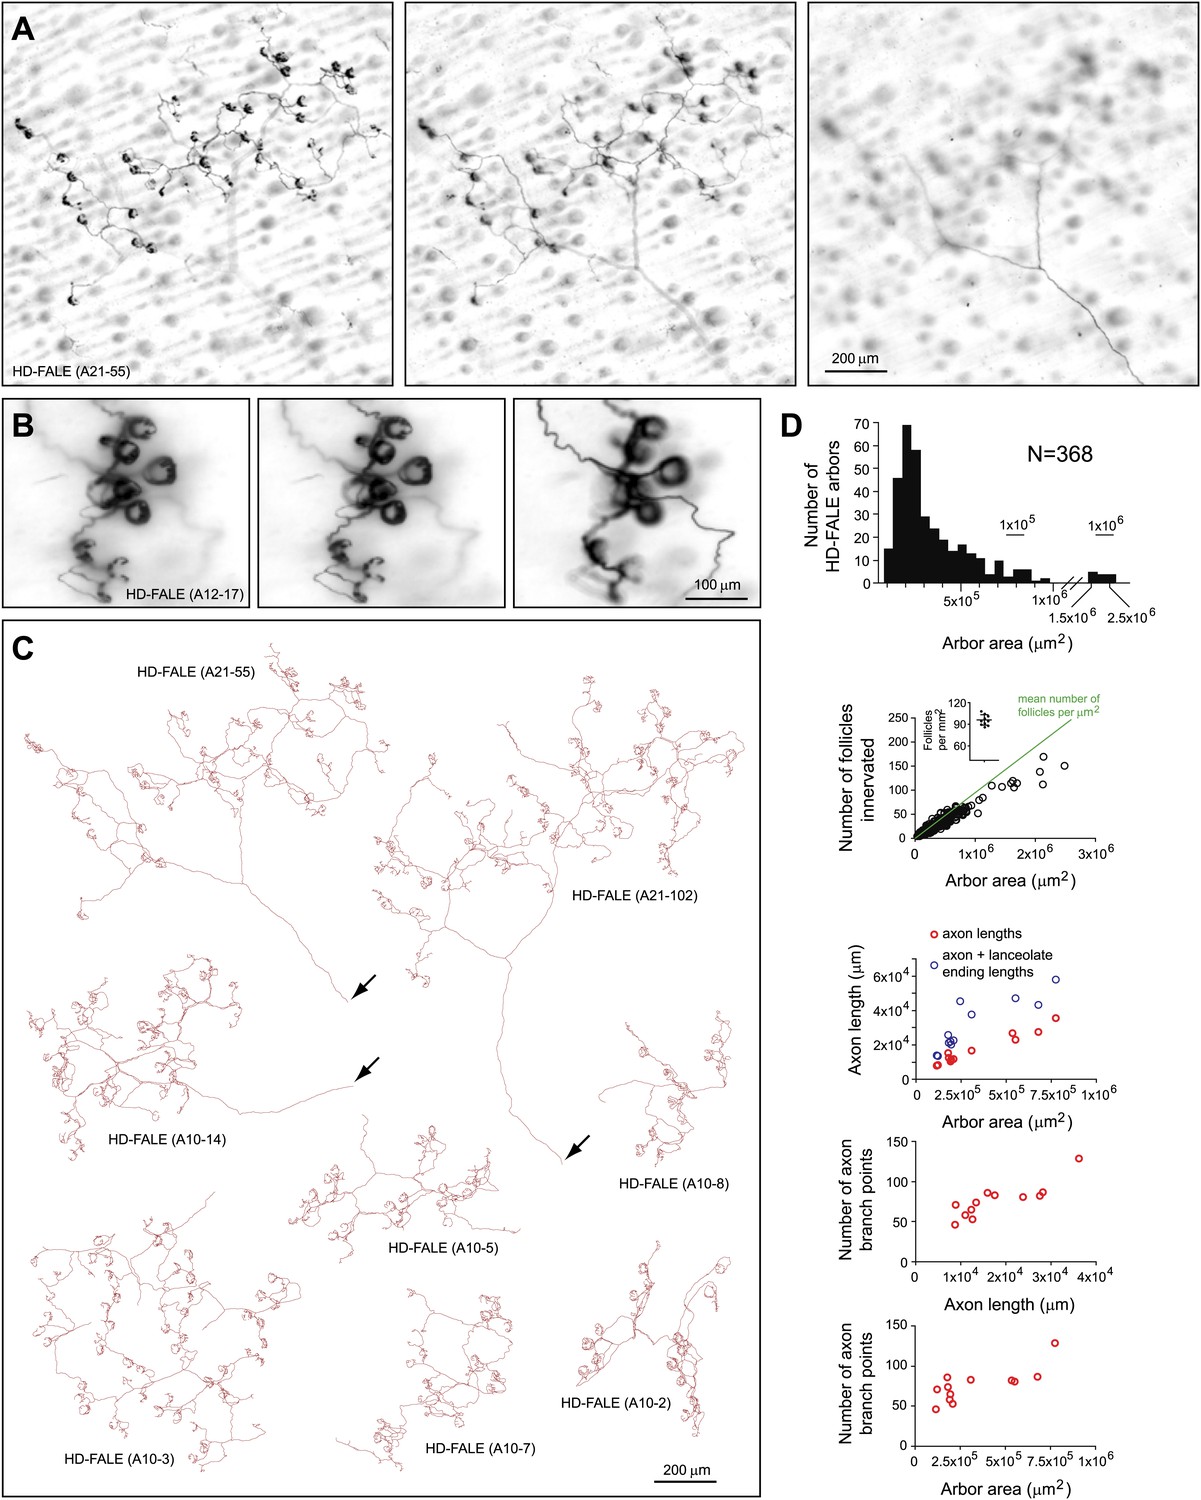
Arbors with high density follicle-associated lanceolate endings (HD-FALE).
(A) Arbor HD-FALE (A21-55) showing superficial (left), intermediate (center), and deep (right) layers. The single axon that gives rise to this arbor is seen at the lower right of the deep arbor image. (B) Higher magnification images at three Z-planes (left to right, superficial to deep) of HD-FALE (A12-17) showing multiple lanceolate endings. (C) Tracings of eight HD-FALE arbors. HD-FALE (A21-55), shown in panel A, is in the upper left. Arrows indicate the afferent axon. (D) For all HD-FALE arbor areas analyzed, arbor area and number of follicles innervated per arbor are shown in the top two plots. In the second plot, the inset shows the determination of the number of follicles per μm2; this value is shown in the plot as a green line. The bottom three plots show the relationships between arbor area, number of axon branch points, and axon length for the 12 traced HD-FALE arbors.
Figure 6
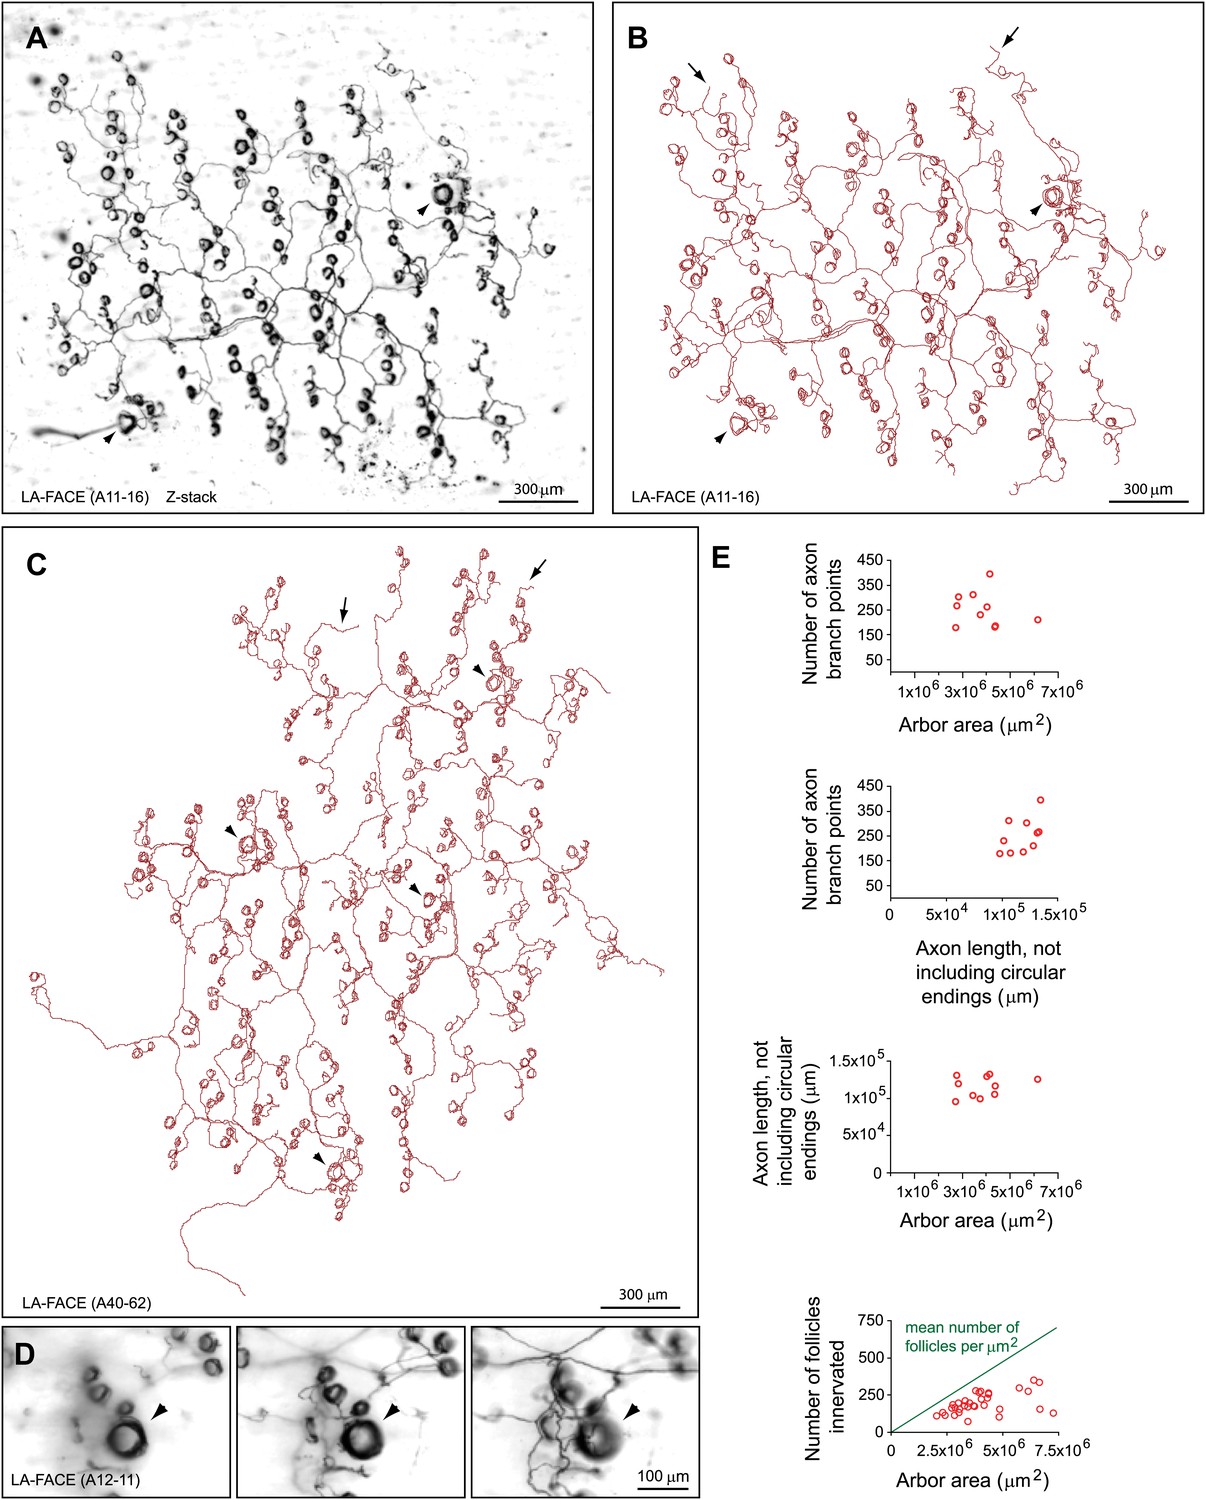
Arbors with large area follicle-associated circumferential endings (LA-FACE).
(A),(B) LA-FACE (A11-16) image (A) and trace (B). Arrowheads in panels B–D indicate guard hair follicles. Arrows in panels B and C indicate occasional nerve endings not associated with follicles. (C) Tracing of LA-FACE (A40-62). (D) High magnification images at three Z-planes (left to right, superficial to deep) of LA-FACE (A12-11). (E) Top, relationships between arbor area, number of axon branch points, and axon length for 10 traced LA-FACE arbors. Bottom, number of follicles innervated per arbor vs. arbor area for 34 LA-FACE arbors. The mean number of follicles per unit area of back skin is shown by the green line (see Figure 5D inset).
Figure 7 with 2 supplements
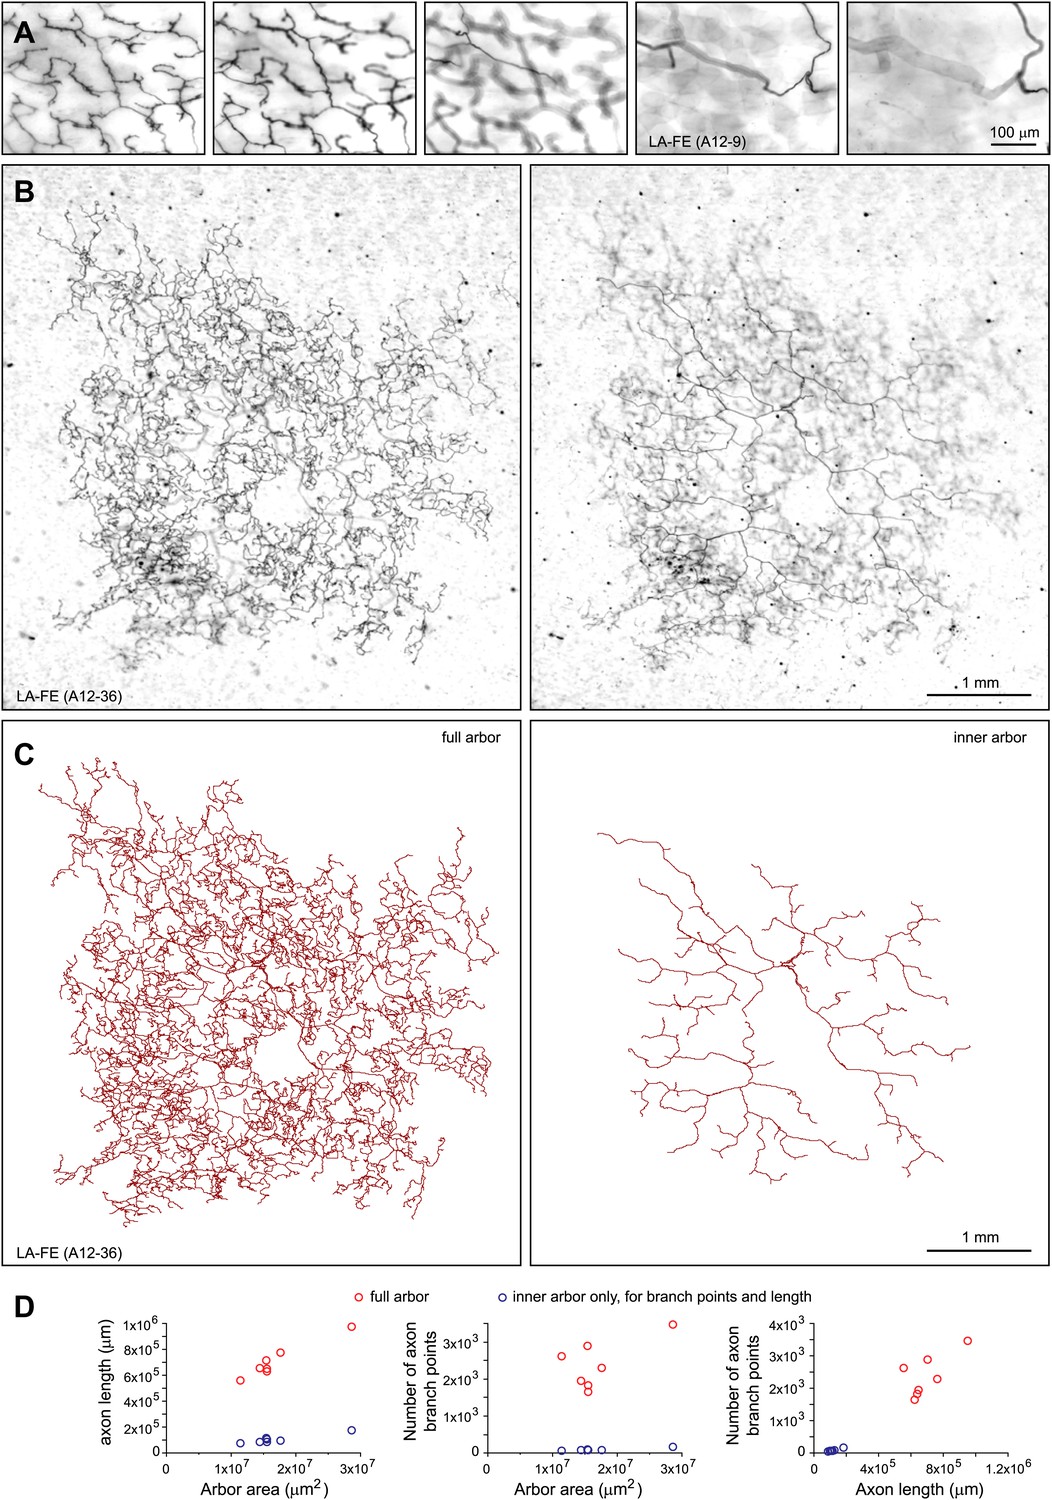
Arbors with large areas and free endings (LA-FE).
(A) High magnification images at five Z-planes (left to right, superficial to deep) of LA-FE (A12-9). (B) Arbor LA-FE (A12-36), showing Z-planes with superficial (left) and inner (right) layers. A distinct inner arbor is in focus in the right panel. (C) Tracings of the full arbor of LA-FE (A12-36) (left), and its inner arbor alone (right). (D) Relationships between arbor area, number of axon branch points, and axon length for seven traced LA-FACE arbors, with separate analyses for the inner arbor and full arbor. Note that the axon length scale extends to 1 m.
Figure 7—figure supplement 1
Additional LA-FE arbor tracing.
Tracing of the full arbor of LA-FE (A12-21) (left), and its inner arbor alone (right).
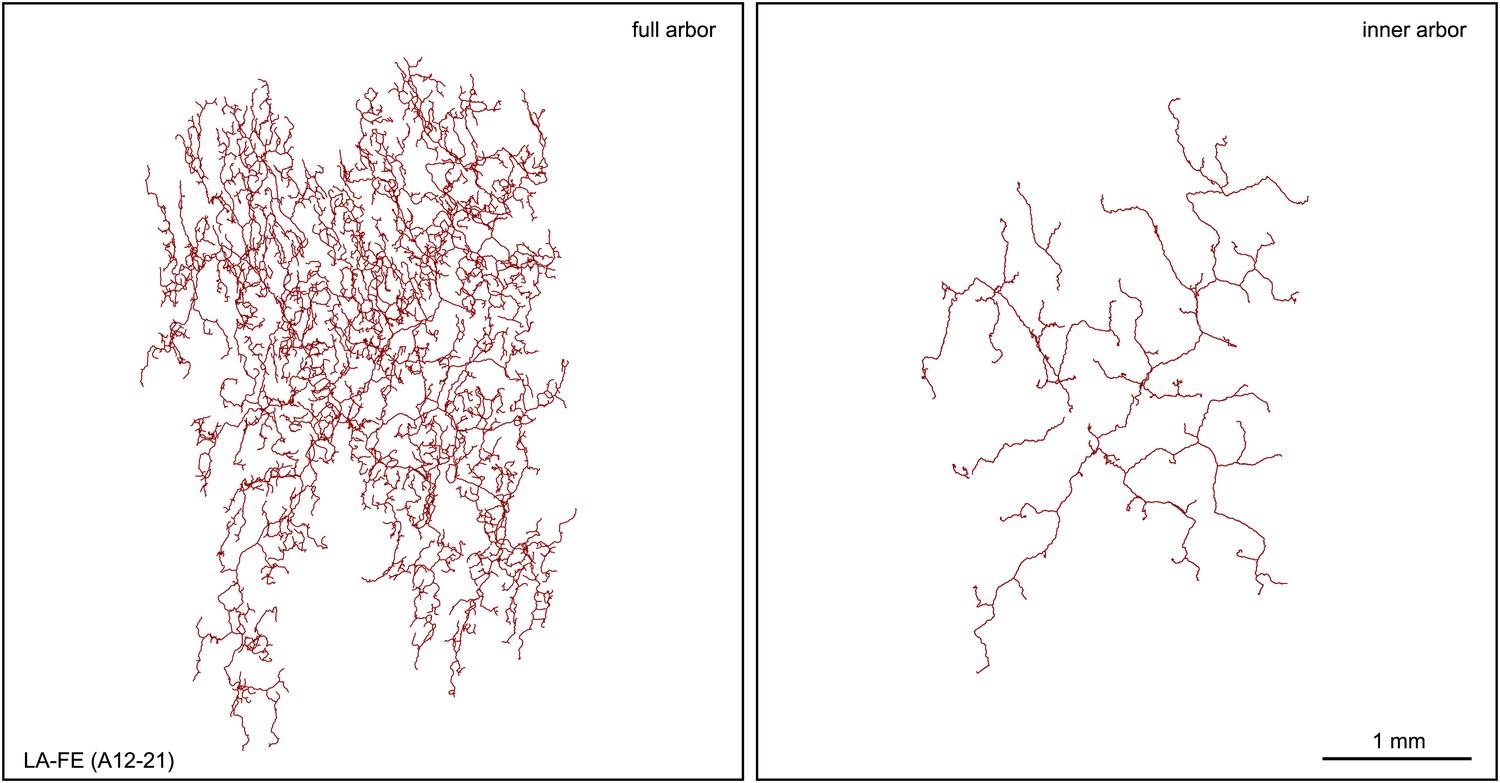
Figure 7—figure supplement 2
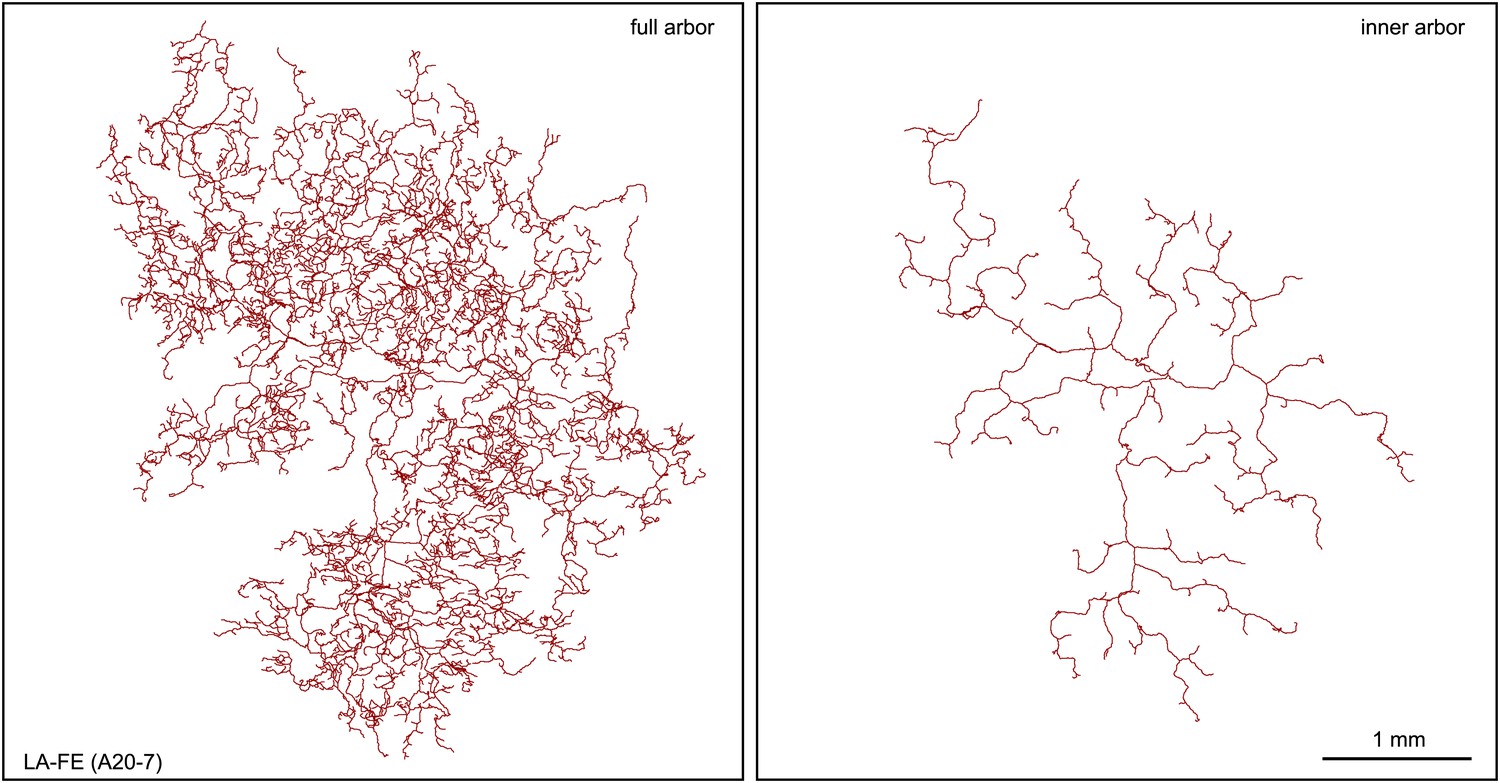
Additional LA-FE arbor tracing.
Tracing of the full arbor of LA-FE (A20-7) (left), and its inner arbor alone (right).
Figure 8 with 1 supplement

Parametric analysis of arbor area, arbor depth, axon length, and number of follicles innervated across arbor classes.
(A) Arbor areas plotted on linear (top) and log10 (bottom) scales for the seven arbor types with arbor areas larger than the surround of a single follicle (i.e. arbor types other than I-FALE, I-FACE, and MCA). (B) Axon length vs arbor area. Note the break in the horizontal and vertical axes and the compressions in scale beyond the break. (C) Comparisons among the four arbor classes that innervate multiple follicles (HD-FALE, LD-FALE, LA-FACE, SA-FACE): number of follicles innervated vs arbor area, and innervation index (defined as number of innervated follicles per arbor area) vs arbor area. (D) Arbor depth within the skin. The skin surface corresponds to 0 μm. On the back skin at P21, the mean depth of a follicle bulb is ∼100 μm. (E) Orientations of follicle-associated C-shaped lanceolate endings from 34 LD-FALE arbors relative to the orientation of their associated follicle. In wild type mice at P21, hair follicles on the back are oriented from anterior to posterior, with mean deviations from that axis of less than 10 degrees (Wang et al., 2010). Red bars show mean and standard deviation. VNE, vector orientation for the nerve ending; VHF, vector orientation for the hair follicle.
Figure 8—figure supplement 1
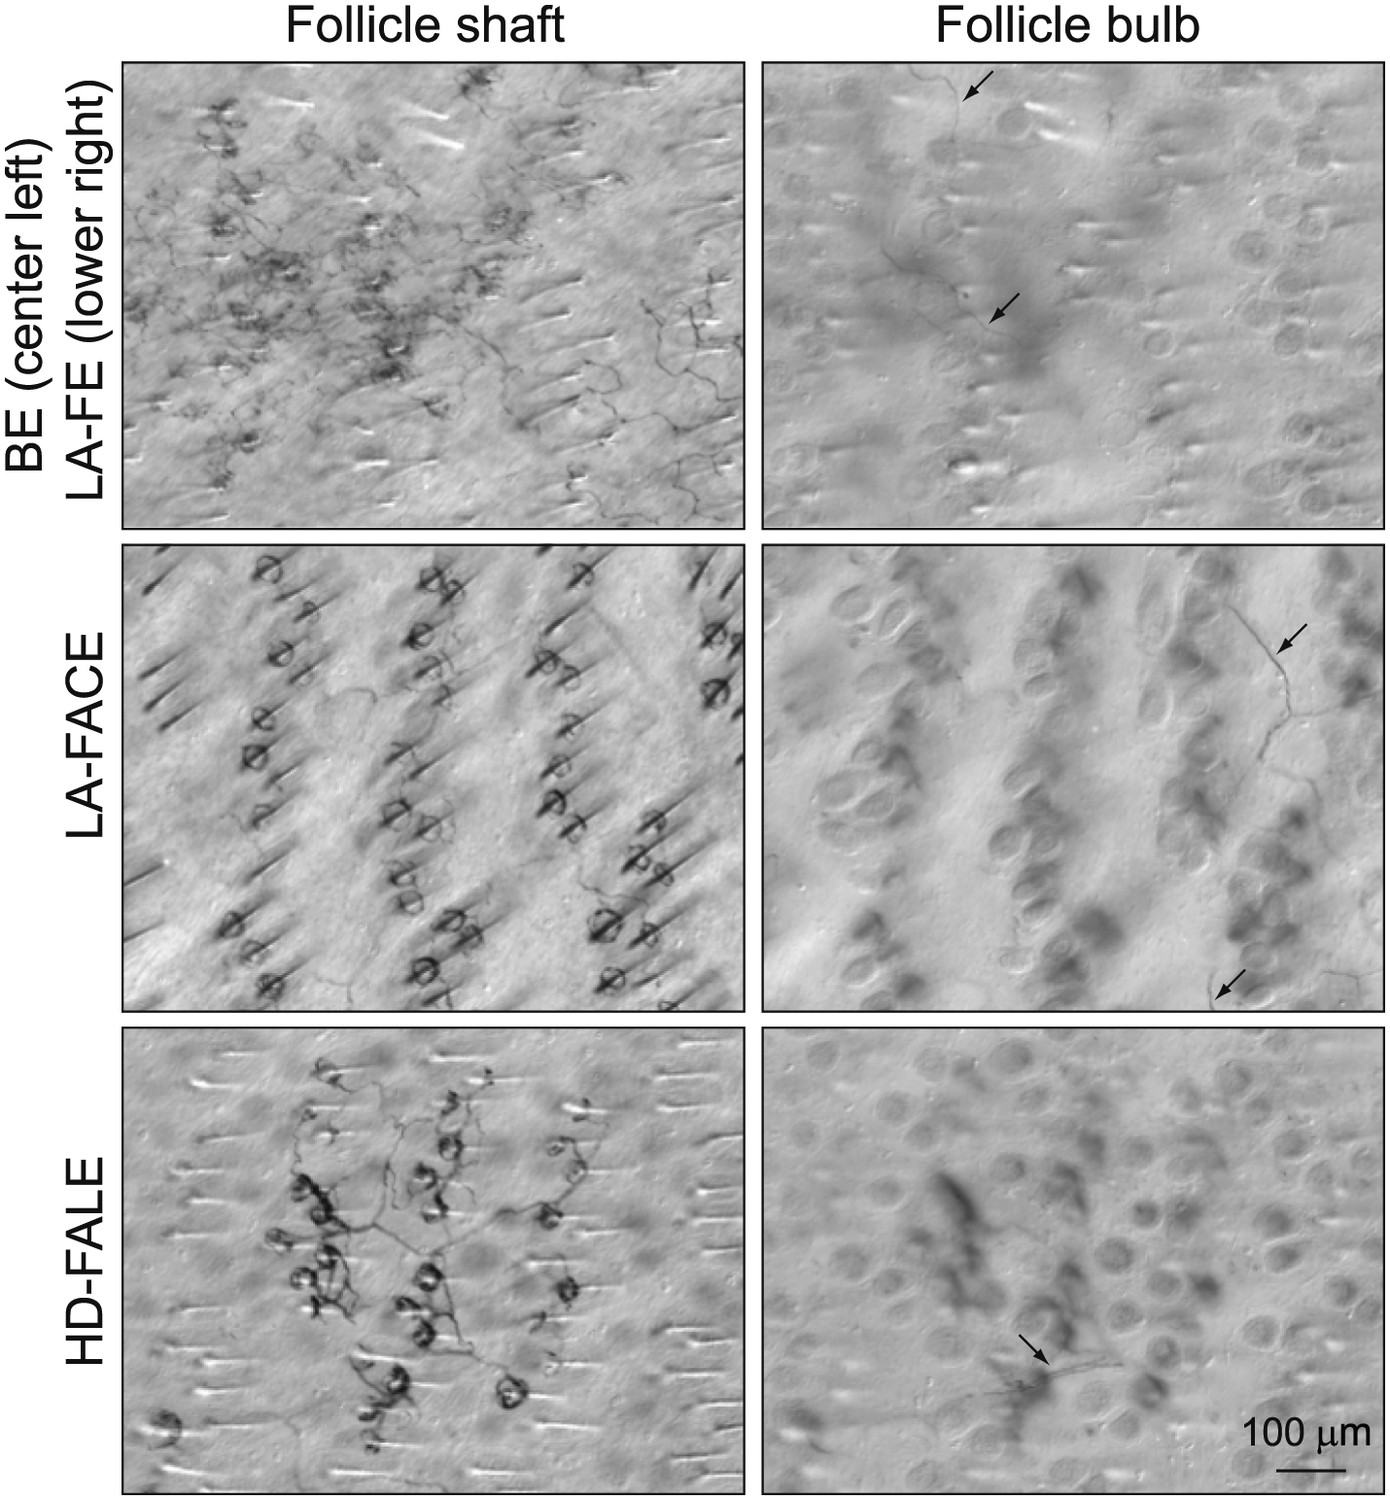
Differential interference contrast images of parts of BE, LA-FE, LA-FACE, and HD-FALE arbors at different Z-planes.
The focal plane of the upper left panel is at the level of the dermis–epidermis junction. The focal plane of the two lower left panels is at the midpoint of the hair follicle. The focal plane of the three right panels is at the follicle bulb. Arrows in right panels point to proximal axon segments deep within the dermis.
Download links
A two-part list of links to download the article, or parts of the article, in various formats.
Downloads (link to download the article as PDF)
Open citations (links to open the citations from this article in various online reference manager services)
Cite this article (links to download the citations from this article in formats compatible with various reference manager tools)
Morphologic diversity of cutaneous sensory afferents revealed by genetically directed sparse labeling
eLife 1:e00181.
https://doi.org/10.7554/eLife.00181


