AP2 hemicomplexes contribute independently to synaptic vesicle endocytosis
- Howard Hughes Medical Institute, University of Utah, United States
- Rutgers University, United States
- University of Utah, United States
Figures
Figure 1 with 1 supplement
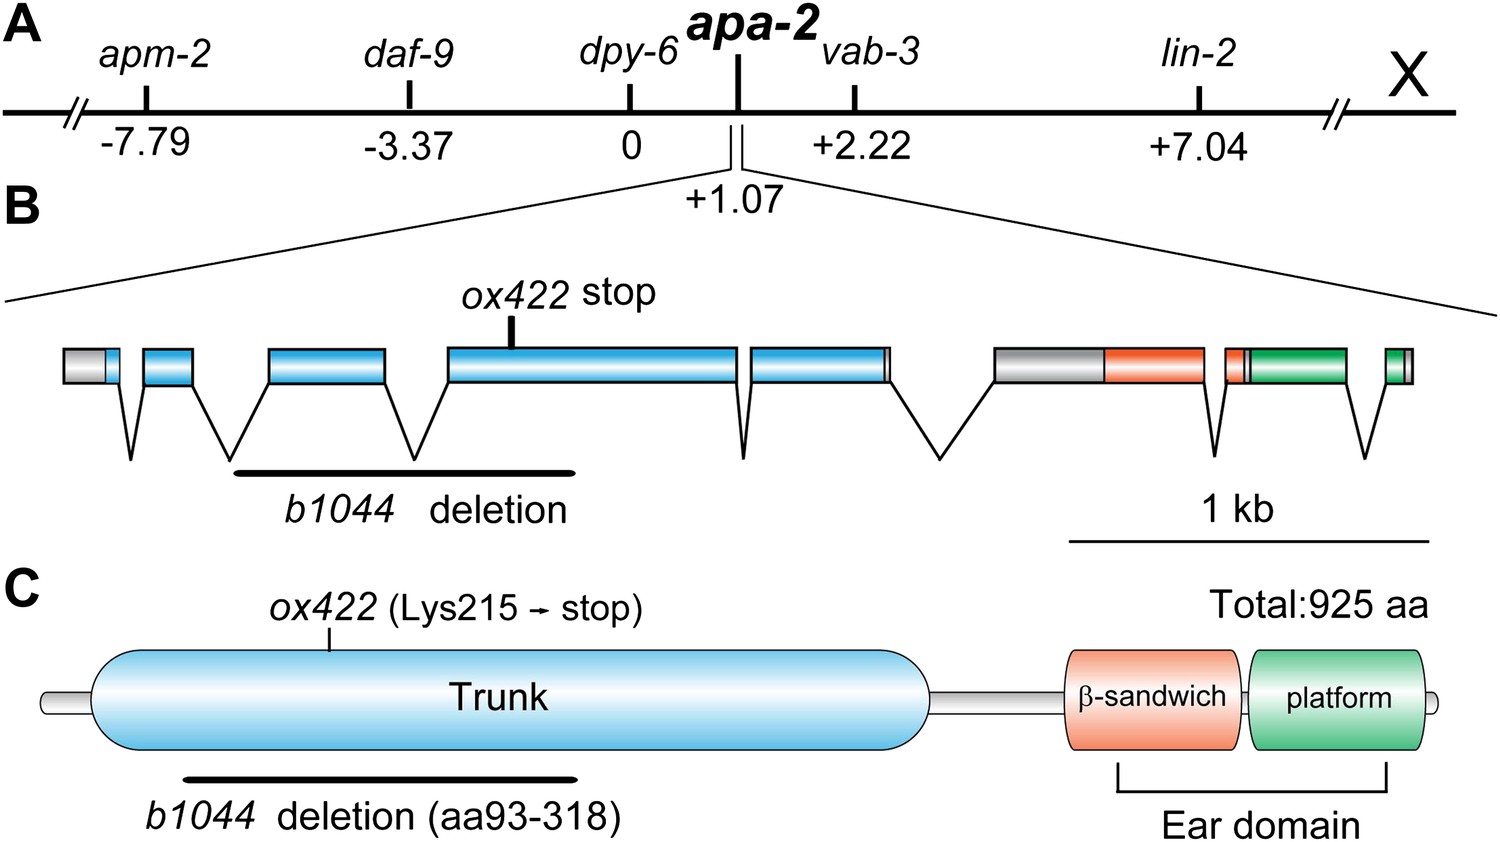
apa-2 cloning.
(A) Genetic map position of apa-2 on chromosome X. (B) Genomic structure of the apa-2 gene and the nature of mutant alleles. b1044 is a 925 bp deletion from the second intron to the fourth exon. ox422 is an A to T transversion. (C) Protein domain structure of alpha adaptin. b1044 causes a deletion of aa93-318 in the trunk domain. ox422 changes Lys215 to a premature stop.
Figure 1—figure supplement 1
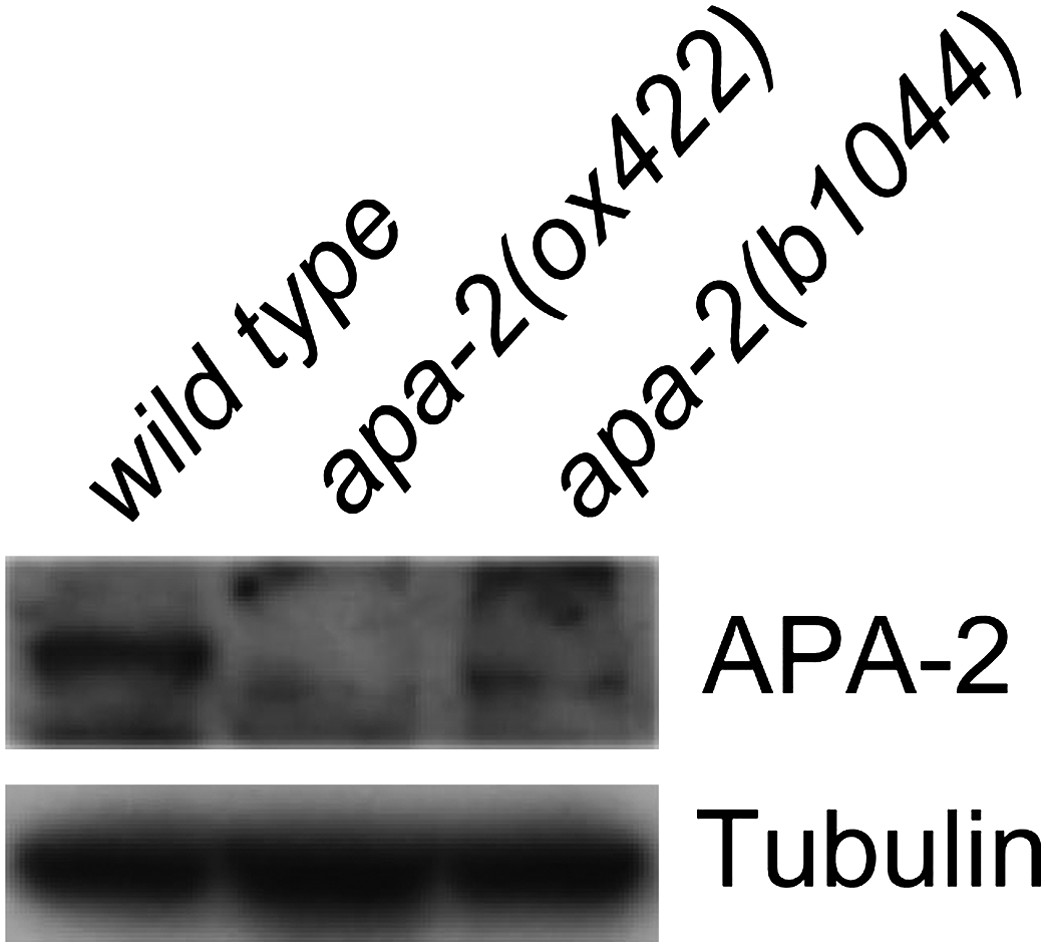
Western blot of α adaptin mutants apa-2(ox422) and apa-2(b1044).
Antibodies are rabbit polyclonal anti-α adaptin and mouse monoclonal anti-tubulin.
Figure 2

α-adaptin is expressed ubiquitously.
(A) Schematic of apa-2::GFP translational reporter construct. The APA-2::GFP fusion construct is expressed under the control of the apa-2 promoter (1.9 kb upstream of ATG) from an extrachromosomal array in a lin-15 rescued background. (B) The expression pattern of the translational fusion protein APA-2::GFP in young adult hermaphrodite. The worm is oriented anterior left and dorsal up. GFP fluorescence is observed ubiquitously in transgenic worms. (C) Detailed images of APA-2::GFP expression in three tissues: nervous system, intestine and hypodermis. The scale bar represents 50 μm.
Figure 3 with 1 supplement

Tissue-specific rescue of α-adaptin mutant.
(A) Bright field images apm-2(e840) and tissue-specific rescue of apa-2(ox422) mutants. Worms are rescued by strains carrying single-copy transgenes. The jowls are indicated by the black arrowheads; most apm-2 animals lack jowls. The scale bar represents 100 μm. (B) The dumpy phenotype of apa-2 mutants is rescued by neuronal expression. Body length of apm-2(e840) (deletion allele of μ2 adaptin), apa-2 mutants and apa-2 tissue-specific rescued animals. Average body length at the L4 stage in μm ± SEM: wild type 763 ± 10, apm-2(e840) 609 ± 12 (p<0.0001), apa-2(ox422) 711 ± 12 (p=0.0037), apa-2(b1044) 684 ± 15 (p<0.0001), skin-rescued apa-2(ox422) 727 ± 10 (p=0.0203), neuron-rescued apa-2(ox422) 820 ± 17 (p=0.0098), ubiquitous rescued apa-2(ox422) 773 ± 12 (p=0.5301). n = 10 L4 worms. (C) Locomotion assay. Average body bends per minute ± SEM: wild type 94.4 ± 6.0, apm-2(e840) 46.0 ± 17.4 (p=0.0478), apa-2(ox422) 82.4 ± 4.0 (p=0.1347), apa-2(b1044) 74.6 ± 2.7 (p=0.0168), ubiquitously-rescued apa-2(ox422) 93.4 ± 6.2 (p=0.9106), neuron-rescued apa-2(ox422) 98.2 ± 6.3 (p=0.6738), skin-rescued apa-2(ox422) 106.8 ± 5.2 (p=0.1570), skin-rescued apa-2(ox422) apm-2(e840) 83.2 ± 3.2 (p=0.1382). n = 5 adult hermaphrodites. n of apm-2 = 7. * p<0.05, ** p<0.01, *** p<0.001.
Figure 3—figure supplement 1
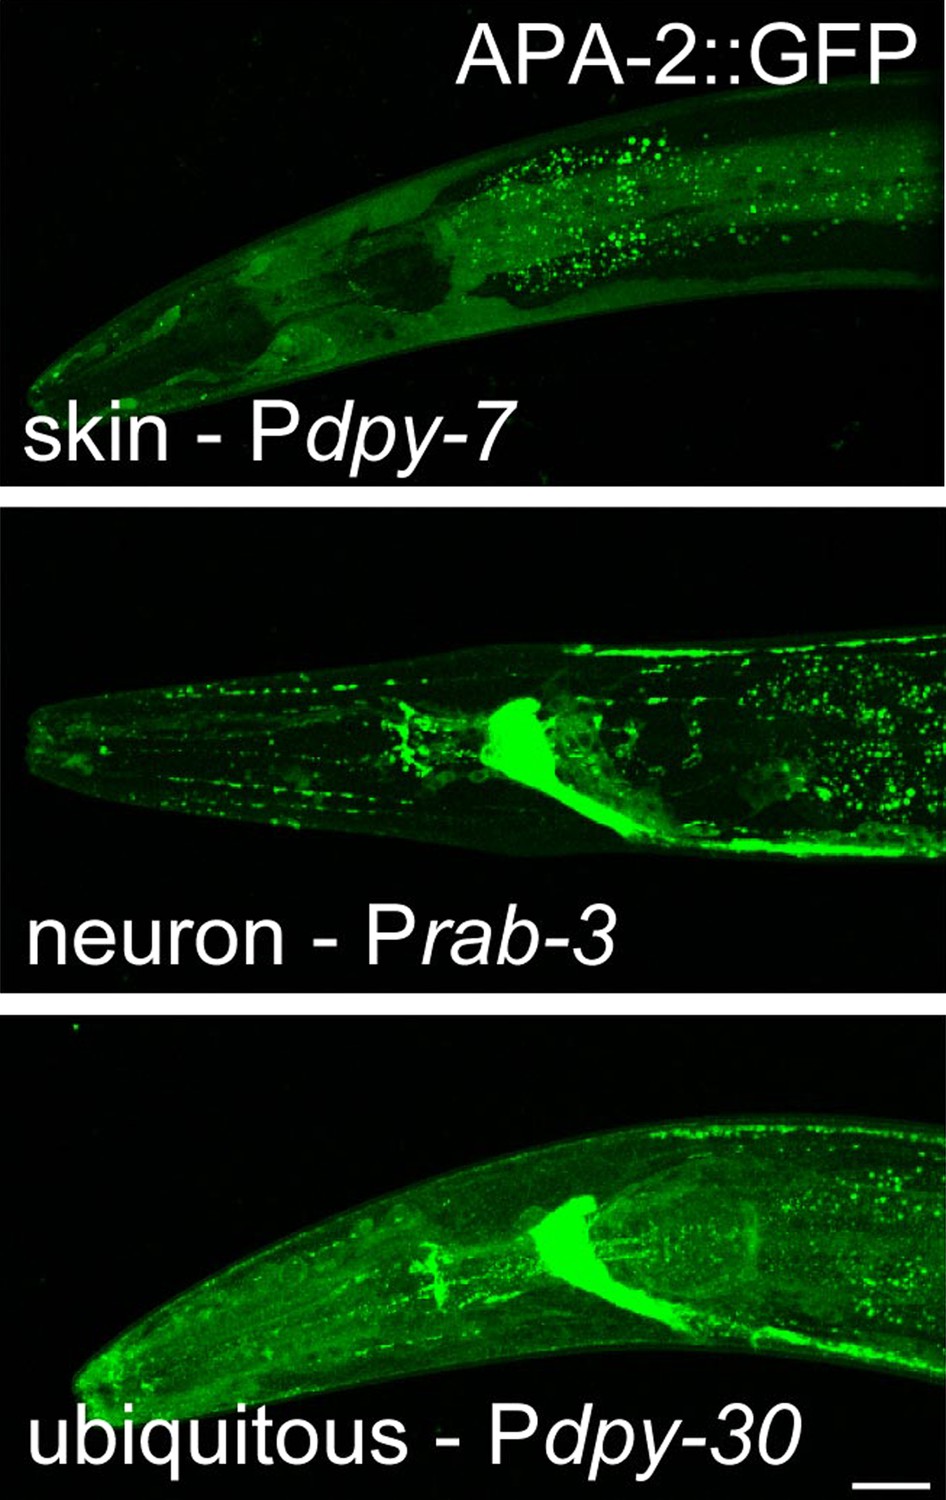
Tissue-specific expression of APA-2::GFP.
The dpy-7 promoter drives expression (skin). The rab-3 promoter drives neuronal expression in the neurons. The dpy-30 promoter drives ubiquitous expression. Worms are oriented anterior left and dorsal up. Images are confocal Z-stack projections of the head of the worm. All worms were imaged under identical conditions. The scale bar represents 20 μm.
Figure 4 with 1 supplement
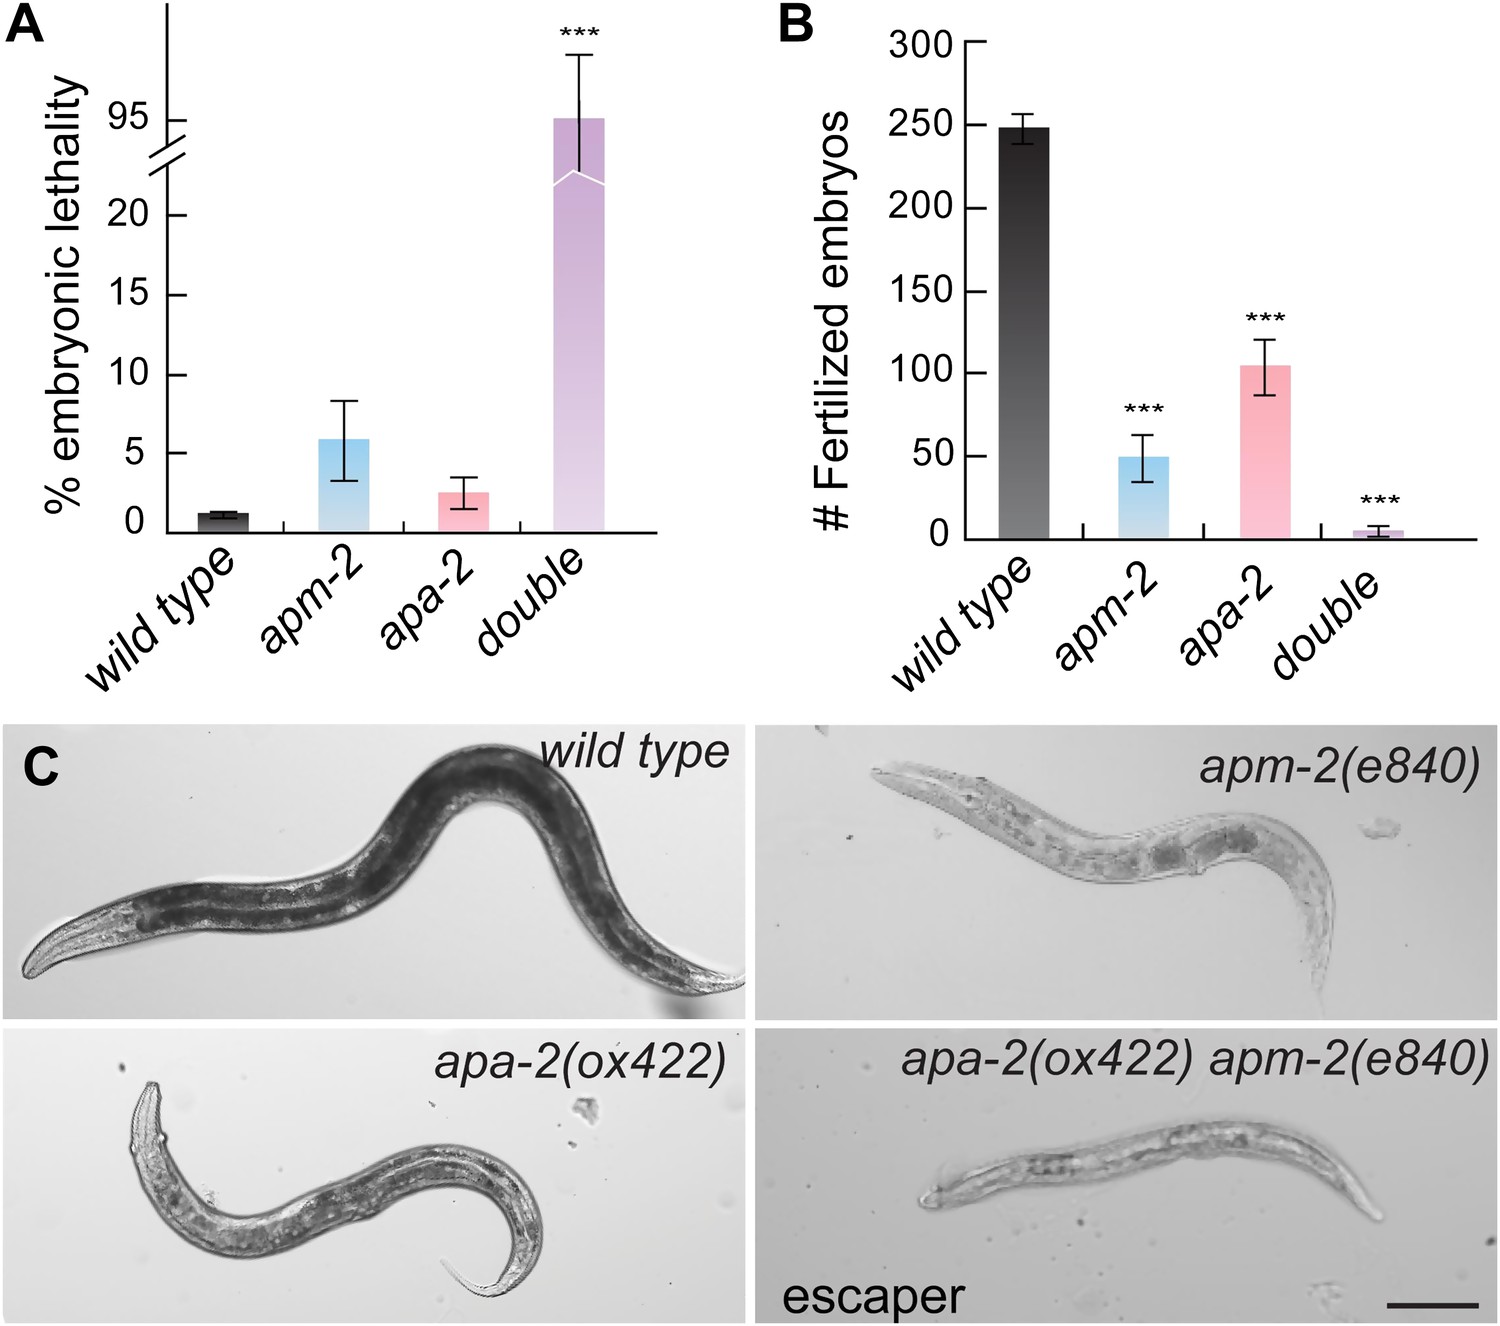
α- and μ2-adaptin double mutant is synthetic.
(A) Embryonic lethality (% total embryos) of AP2 mutants ± SEM: wild type 1.13 ± 0.25 n = 10, apa-2(ox422) 2.42 ± 0.96 n = 9 (p=0.1902), apm-2(e840) 5.85 ± 2.56 n = 10 (p=0.0831), apa-2(ox422) apm-2(e840) 95.70 ± 4.30 n = 11 (p<0.0001). *** p<0.001. (B) The brood size of AP2 mutants±SEM: wild type 247.3 ± 8.8 n = 10, apa-2(ox422) 104.8 ± 16.9 n = 9 (p<0.0001), apm-2(e840) 49.0 ± 14.2 n = 10 (p<0.0001), apa-2(ox422) apm-2(e840) 3.4 + 3.1 n = 11 (p<0.0001). (C) Bright-field images of the wild type, apm-2(e840), apa-2(ox422) and a surviving apa-2(ox422) apm-2(e840) adult. The scale bar represents 100 μm.
Figure 4—figure supplement 1
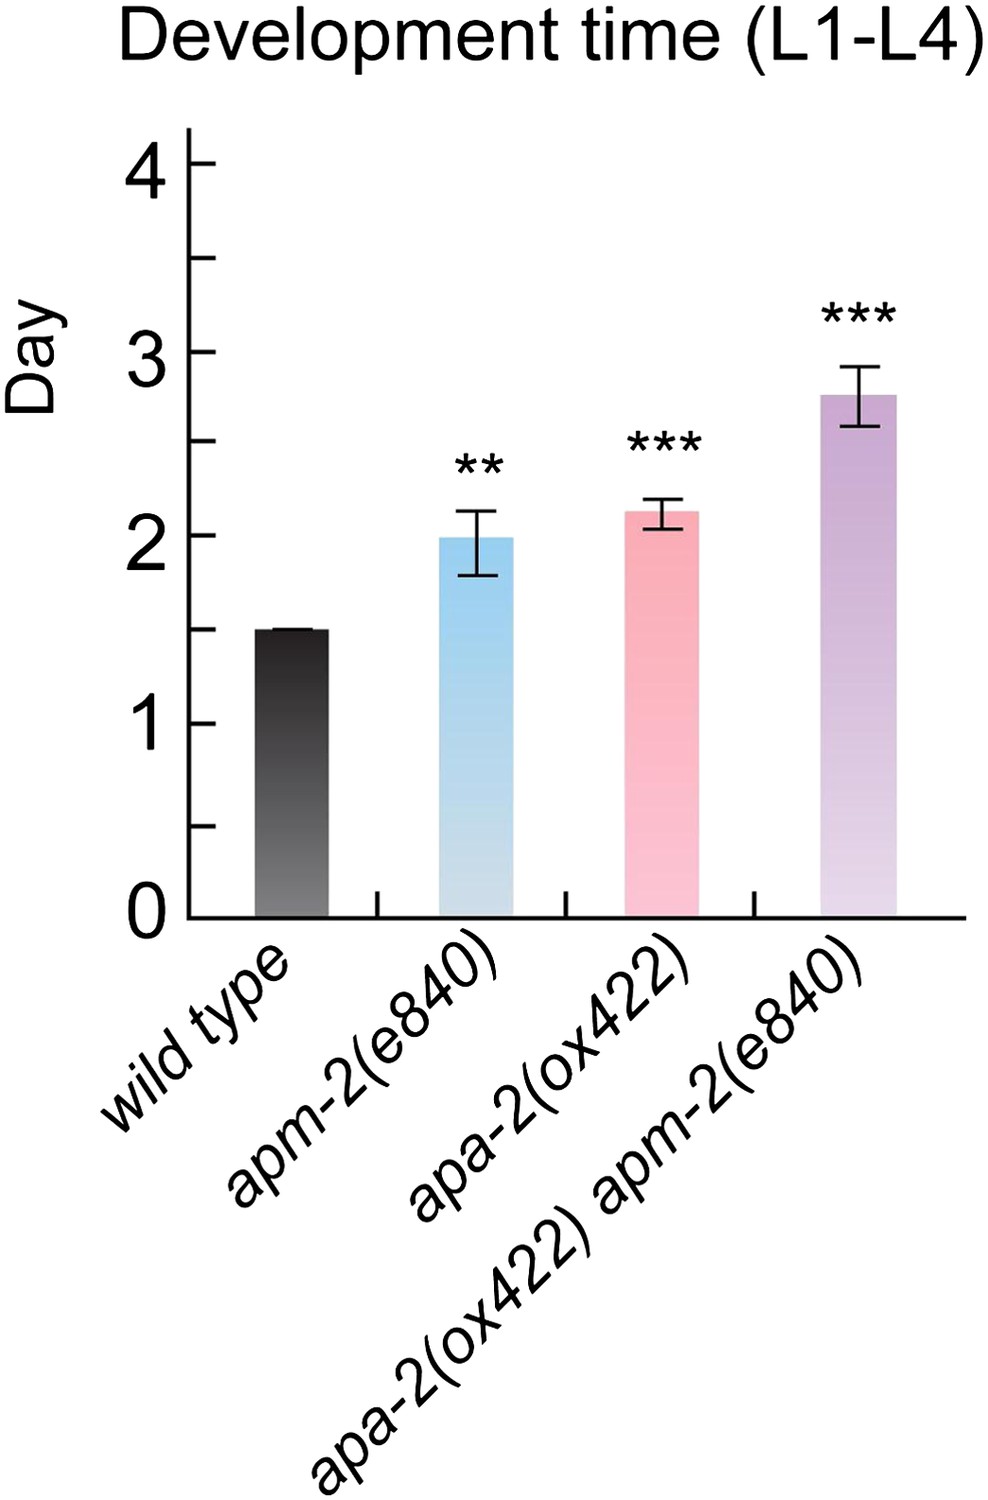
AP2 mutants exhibit slowed postembryonic development.
Mean days from L1 to L4 stage ± SEM: wild type 1.5 ± 0 n = 29, apm-2(e840) 1.97 ± 0.17 n = 28 (p=0.0068), apa-2(ox422) 2.11 ± 0.09 n = 28 (p<0.0001), apm-2(e840) apa-2(ox422) 2.75 ± 0.17 n = 29 (p<0.0001). ** p<0.01, *** p<0.001.
Figure 5 with 2 supplements
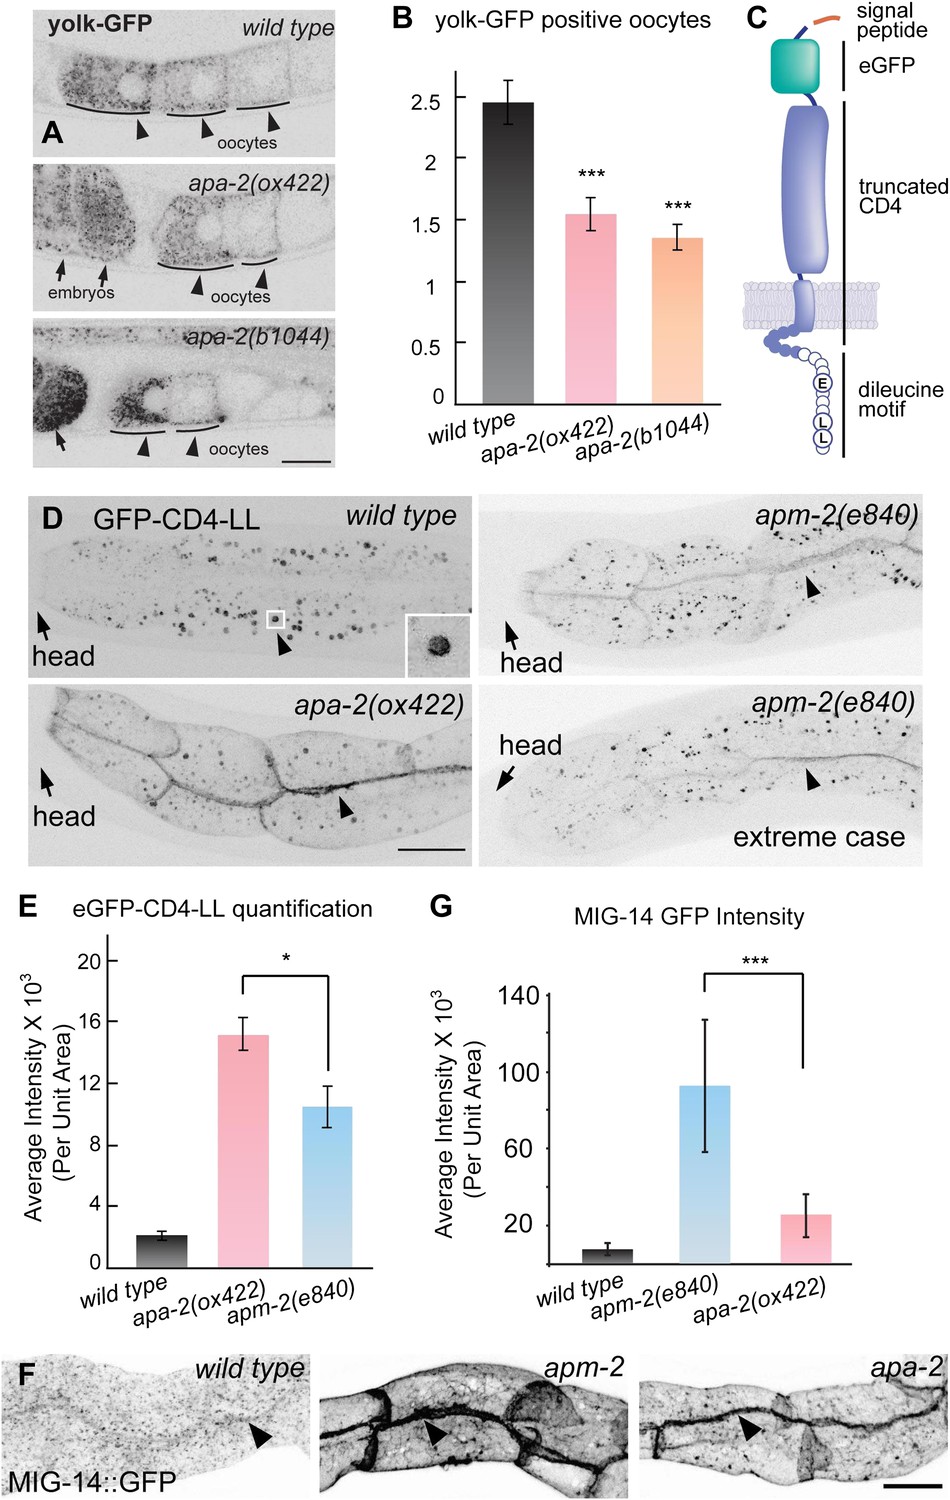
Endocytosis of α- and μ2-adaptin-dependent cargo.
Fluorescence images have been inverted to aid visualization of signals. (A) Yolk protein, YP170::GFP is endocytosed by maturing oocytes in the wild type and both apa-2 mutants. Black arrowheads point to maturing oocytes and black arrows point to fertilized embryos. (B) The number of YP170::GFP positive oocytes ± SEM: wild type 2.5 ± 0.2, apa-2(ox422) 1.6 ± 0.1 (p=0.0003), apa-2(b1044) 1.4 ± 0.1 (p<0.0001). n = 20 adult hermaphrodites, *** p<0.001. Two-tailed Student's t-test. (C) A diagram of eGFP-CD4 artificial cargo. eGFP was flanked by two 12 aa flexible linkers and inserted after the secretion signal peptide, the extracellular domain of CD4 was truncated to include one immunoglobulin domain, the cytoplasmic domain of CD4 was removed leaving a seven aa tail (Feinberg et al., 2008), and the 11 aa Nef di-leucine motif was fused after CD4 (Doray et al., 2007). Circles represent amino acids on the cytoplasmic face. (D) eGFP-CD4-LL localization in intestine in the wild type and α adaptin mutant (apa-2(ox422) X) and μ2 adaptin mutant (apm-2(e840) X) mutants. Black arrowheads point to the intracellular organelle in the wild type (see inset) and to the lateral surface of the plasma membrane in the mutants. (E) Quantification of fluorescence intensity of eGFP-CD4-LL in wild type and AP2 mutants. Total fluorescence was measured from regions of interest defined on the basolateral membrane and averaged. Fluorescence intensity arbitrary units mean ± SEM: wild type 1998 ± 275 n = 5, apa-2(ox422) 14,907 ± 990 n = 6 (p<0.0001), apm-2(e840) 10,310 ± 1342 n = 6 (p=0.0004). The p value between apa-2 and apm-2 is <0.0203. * p<0.05. (F) Endocytosis of MIG-14/wntless in the intestine in the wild type, μ2 adaptin mutant (apm-2(e840) X) and an α adaptin mutant (apa-2(ox422) X). Fluorescence images are inverted to better view dim GFP fluorescence. (G) Quantification of fluorescence intensity of MIG-14 in wild type and AP2 mutants. Total fluorescence was measured from regions of interest defined on the basolateral membrane and averaged. The data were captured on a Zeiss LSM 510 and the spectral fingerprinting feature was used to remove intestinal autofluorescence. Fluorescence intensity arbitrary units mean ± SD: wild type 7363 ± 3498 n = 18, apm-2(e840) 92,648 ± 34,237 n = 18 (p<0.0001), apa-2(ox422) 25,110 ± 11,570 n = 18 (p<0.0001). The p value between apa-2 and apm-2 is <0.0001. *** p<0.001.
Figure 5—figure supplement 1
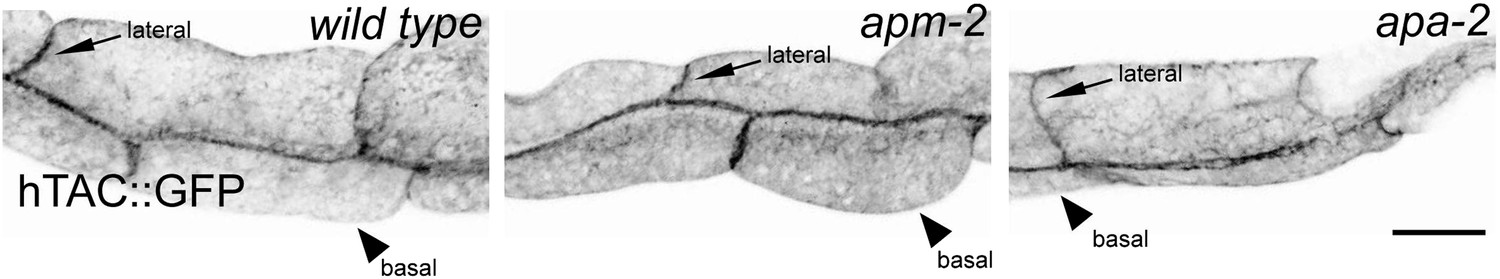
An AP2-independent cargo is not affected by AP2 subunits mutants.
Human IL2 receptor α subunit Tac (hTAC) in the nematode intestine in the wild type, μ2 adaptin mutant (apm-2(e840) X) and an α adaptin mutant (apa-2(ox422) X). Fluorescence images are inverted to better view GFP fluorescence.
Figure 5—figure supplement 2

Quantification of total fluorescence intensity of hTAC in the wild type and AP2 mutants.
Total fluorescence was measured along the basolateral membrane and averaged. Fluorescence intensity mean ± SD: wild type 16,080 ± 7875 n = 18, apm-2(e840) 22,948 ± 9488 n = 18 (p=0.0240), apa-2(ox422) 21,950 ± 12,953 n = 18 (p=0.1096).
Figure 6 with 2 supplements
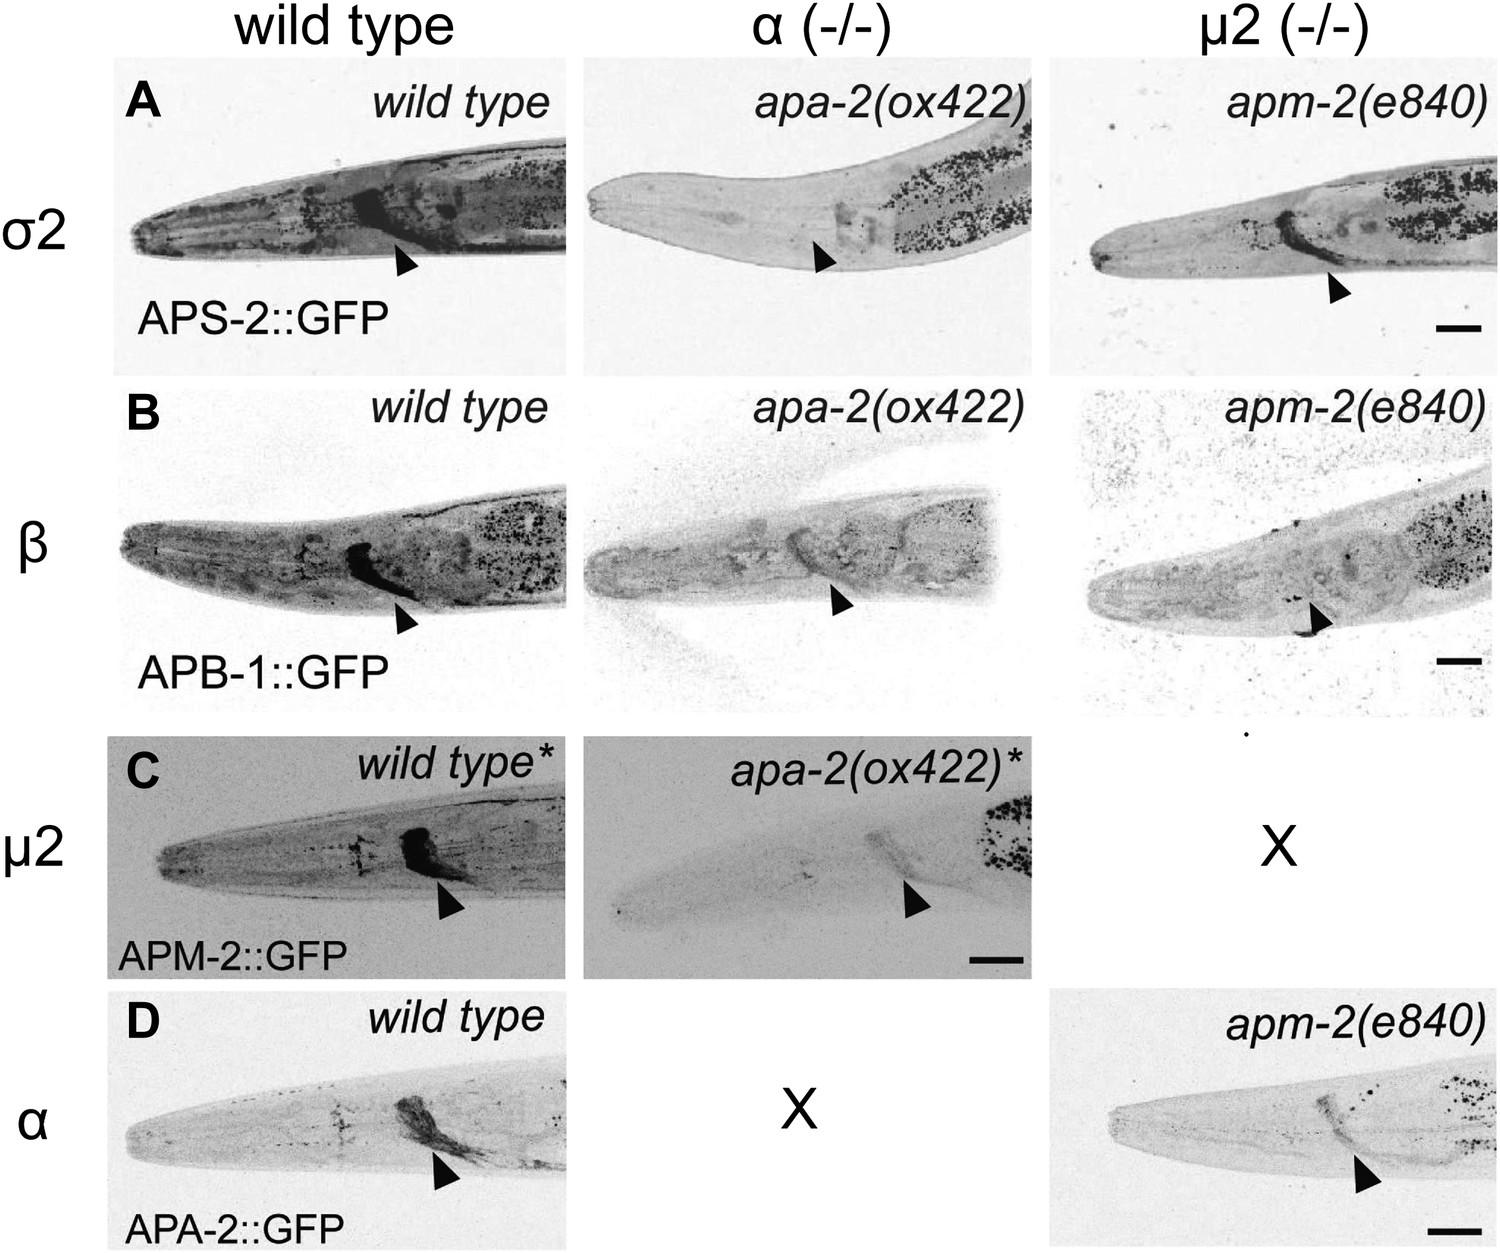
AP2 hemicomplexes are partially stable in vivo.
All images are inverted to better visualize GFP fluorescence. (A) Synaptic localization of σ2 adaptin (APS-2::GFP) in α and μ mutants. The nerve ring is indicated by the black arrowhead. (B) Synaptic localization of β adaptin (APB-1::GFP) in α and μ2 mutants. (C) Synaptic localization of μ2 adaptin (APM-2::GFP) rescuing construct in μ2 mutants (labeled as wild type*) and an α μ2 double mutant (apm-2(e840) apa-2(ox422) X, labeled as apa-2(ox422) *). The single copy APM-2::GFP transgene oxSi54 fully rescues the apm-2(e840) mutation. (D) Synaptic localization of α adaptin (APA-2::GFP) in wild type and an μ2 mutant apm-2(e840). The scale bar represents 20 μm. Please refer to Table 1 for detailed quantification.
Figure 6—figure supplement 1
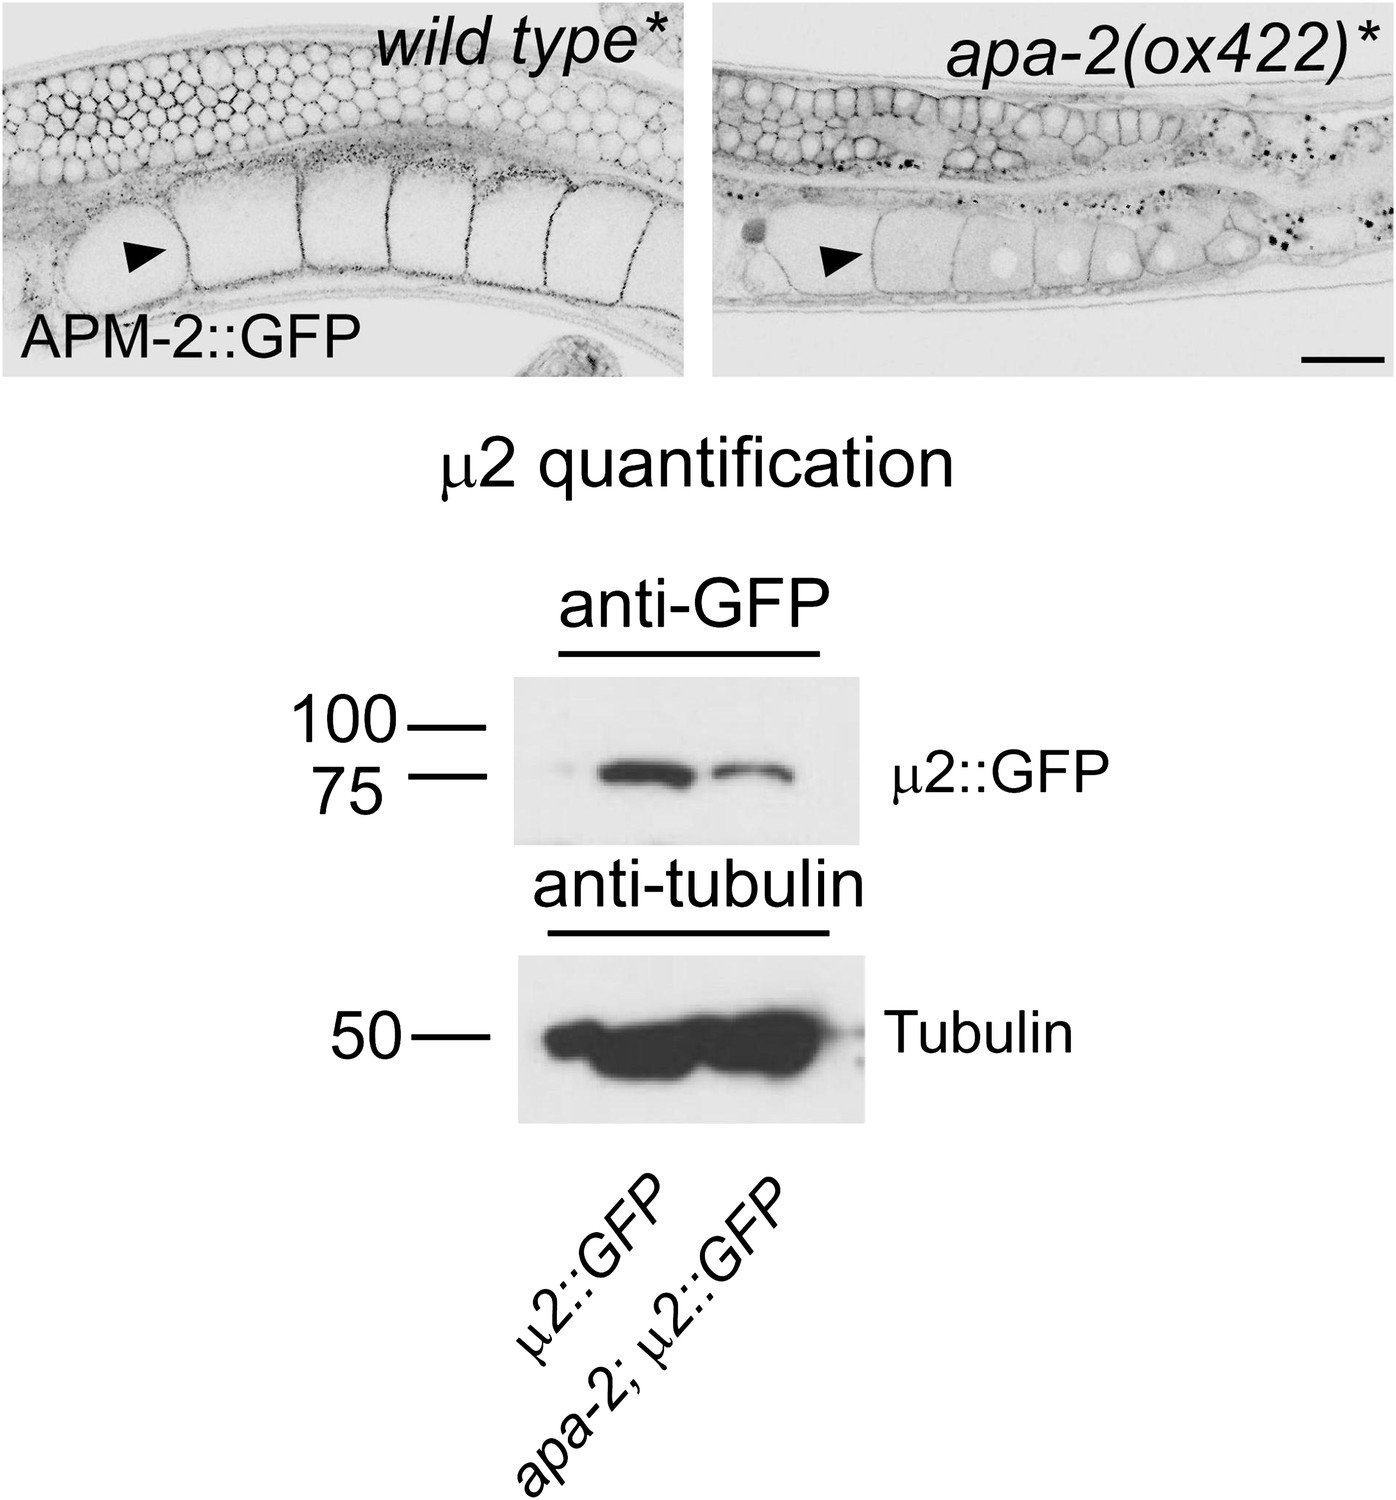
μ2-adaptin is present in α-adaptin mutants.
A rescuing construct of tagged μ2-adaptin was inserted into a μ2-adaptin null strain for all genotypes. Top: μ2-adaptin (APM-2::GFP) expression in the gonad of a μ2 mutant (apm-2(e840) X, labeled as wild type*) and an α μ2 double mutant (apm-2(e840) apa-2(ox422) X, labeled as apa-2*). μ2-adaptin is enriched at the plasma membrane of oocytes (black arrow heads). The contrast was increased to visualize the GFP signal at the plasma membrane. The scale bar represents 20 μm. Bottom: western blot for the expression level of μ2 adaptin-GFP in apa-2(ox422). Antibodies are mouse monoclonal anti-GFP and anti-tubulin. μ2 adaptin is reduced to 42% but still present in an α adaptin mutant.
Figure 6—figure supplement 2
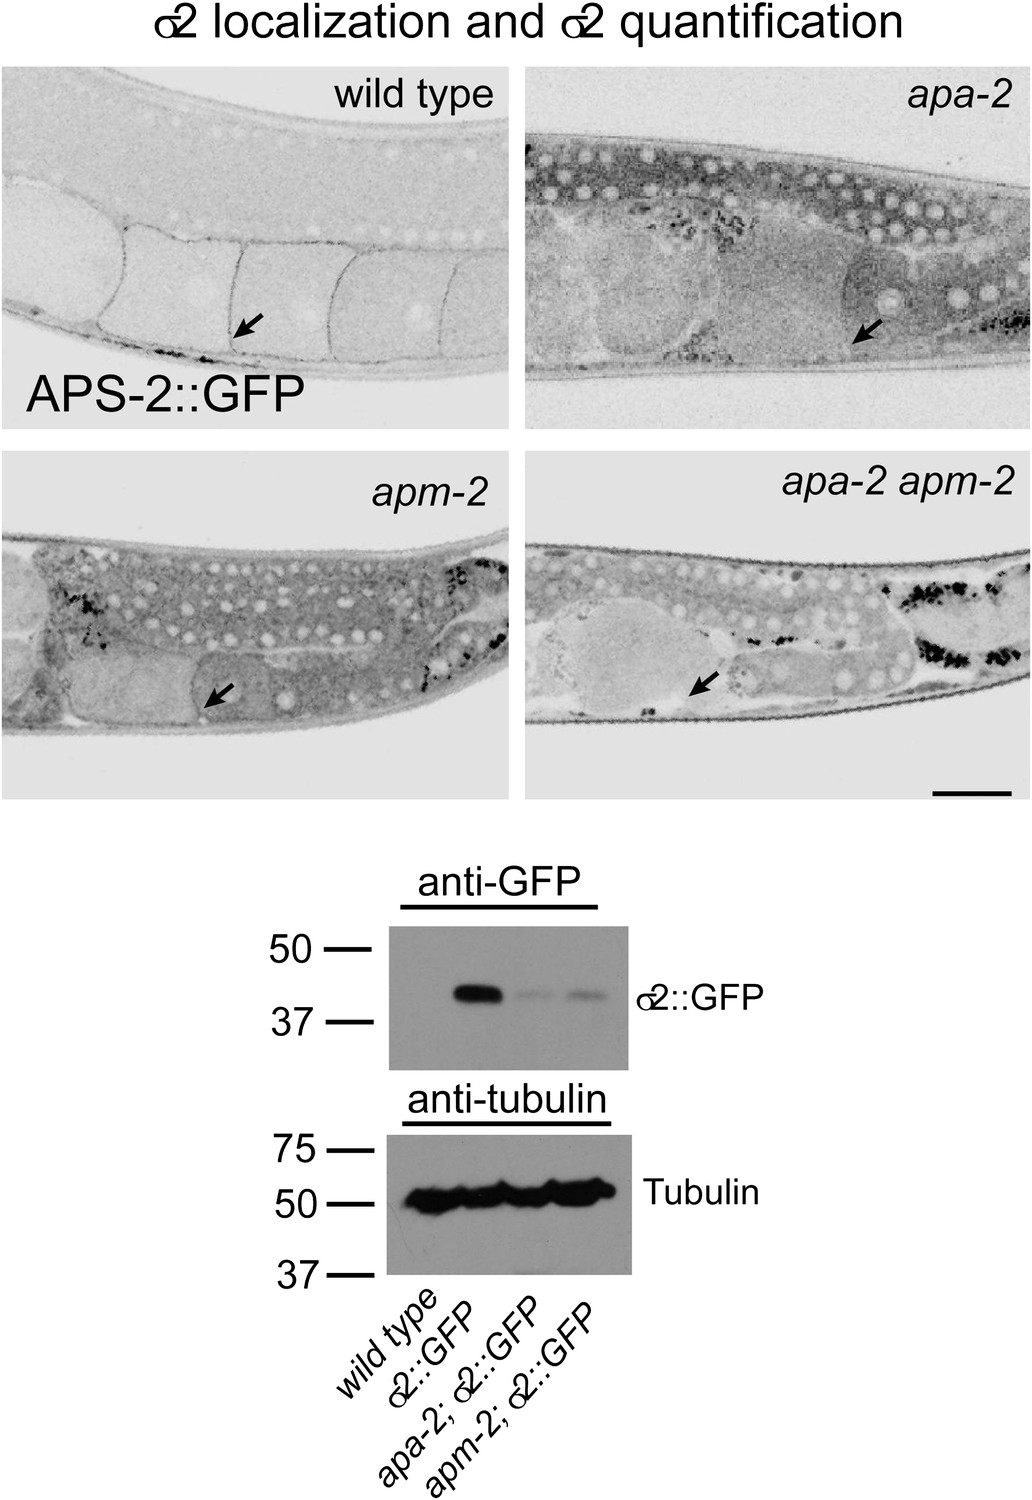
σ2-adaptin is more unstable in α-adaptin than in μ2-adaptin mutants.
Top: σ2::GFP is localized to the plasma membrane in the wild type and μ2-adaptin mutant but not in α-adaptin mutants or α-μ2 adaptin double mutants. The oocyte cell surface is indicated by black arrows. The scale bar represents 20 μm. Bottom: Western blot for the expression level of σ2 adaptin-GFP in apa-2(ox422) and apm-2(e840). The protein level is reduced more in apa-2 (91%) than in apm-2 mutants (86%). Antibodies are mouse monoclonal anti-GFP and anti-tubulin. Endogenous σ2 adaptin is present in this experiment. Please refer to supplementary file 1 for detailed genotypes.
Figure 7 with 1 supplement
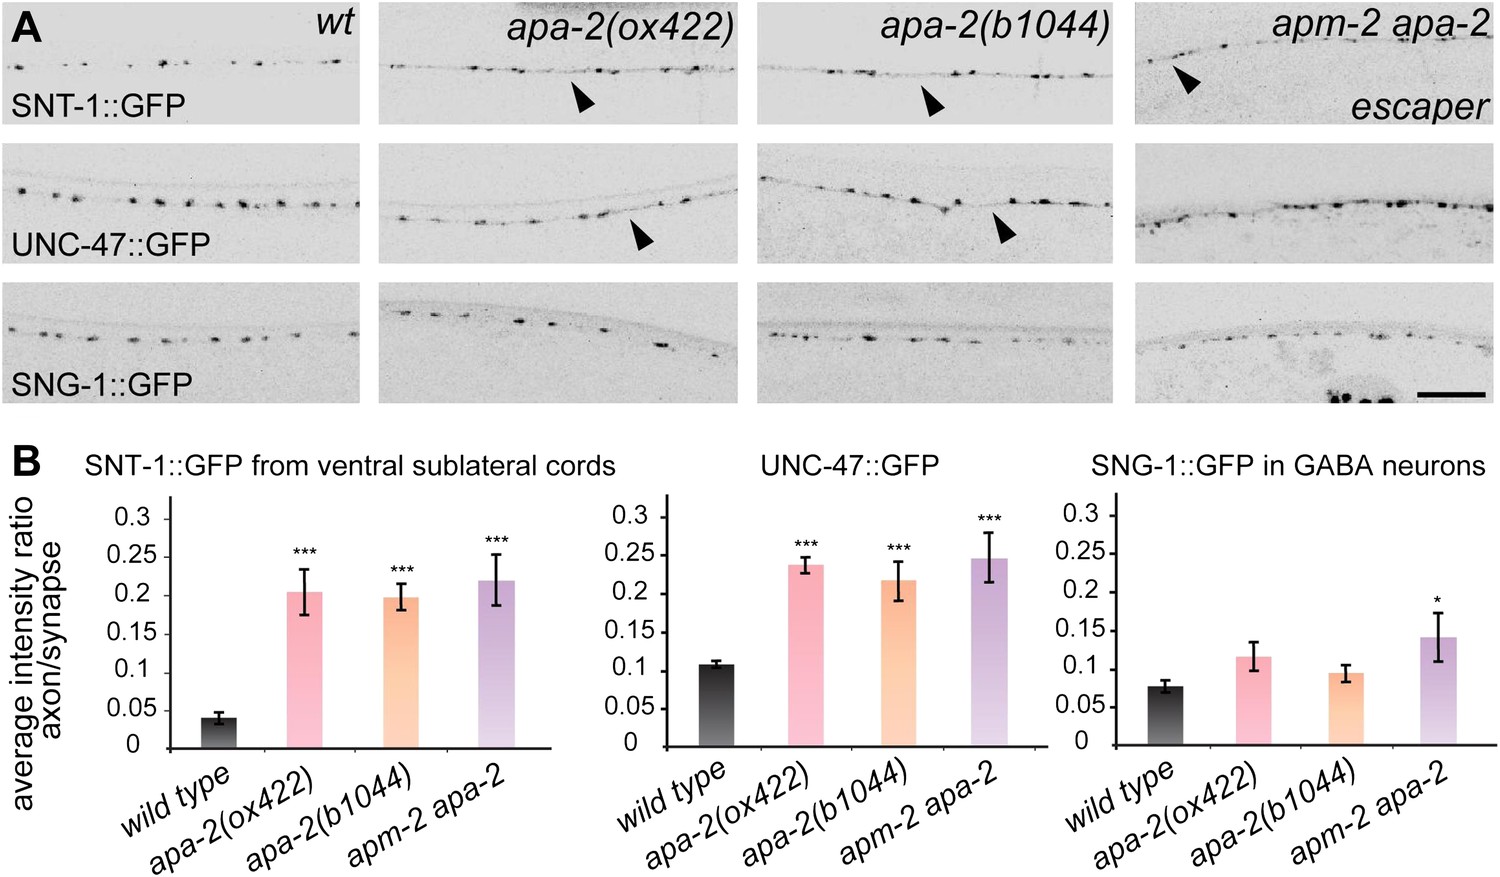
α-adaptin mutants exhibit weak defects in synaptic vesicle protein localization.
(A) All images are inverted to better visualize GFP fluorescence. Synaptic localization of synaptic vesicle proteins in apa-2 and apm-2(e840) apa-2(ox422) double mutants (an escaper with no skin rescue). Synaptotagmin (SNT-1::GFP) is expressed in all neurons under its own promoter and imaged in ventral sublateral cords. VGAT (UNC-47::GFP) and synaptogyrin (SNG-1::GFP) are expressed in GABA neurons and imaged in the dorsal nerve cord. Presynaptic varicosities of neuromuscular junctions along the nerve cords of an adult hermaphrodite are visible as fluorescent puncta. The axon regions with increased fluorescence are indicated by black arrowheads. Images are confocal Z-stack projections through the worm nerve cord. The scale bar represents 10 μm. (B) Quantification of the average fluorescence intensity ratio between axon region and synaptic region. Ratio of SNT-1::GFP mean ± SEM: wild type 0.041 ± 0.007 n = 10, apa-2(ox422) 0.204 ± 0.029 n = 10 (p<0.0001), apa-2(b1044) 0.196 ± 0.017 n = 10 (p<0.0001), apa-2(ox422) apm-2(e840) 0.219 ± 0.032 n = 6 (p<0.0001). Ratio of UNC-47::GFP mean ± SEM: wild type 0.108 ± 0.004 n = 8, apa-2(ox422) 0.239 ± 0.009 n = 8 (p<0.0001), apa-2(b1044) 0.220 ± 0.024 n = 7 (p=0.0003), apa-2(ox422) apm-2(e840) 0.247 ± 0.032 n = 6 (p=0.0003). Ratio of SNG-1::GFP mean ± SEM: wild type 0.077 ± 0.008 n = 8, apa-2(ox422) 0.116 ± 0.019 n = 10 (p=0.1026), apa-2(b1044) 0.095 ± 0.011 n = 10 (p=0.2252), apa-2(ox422) apm-2(e840) 0.143 ± 0.032 n = 5 (p=0.0308). * p<0.05, ** p<0.01, *** p<0.001.
Figure 7—figure supplement 1
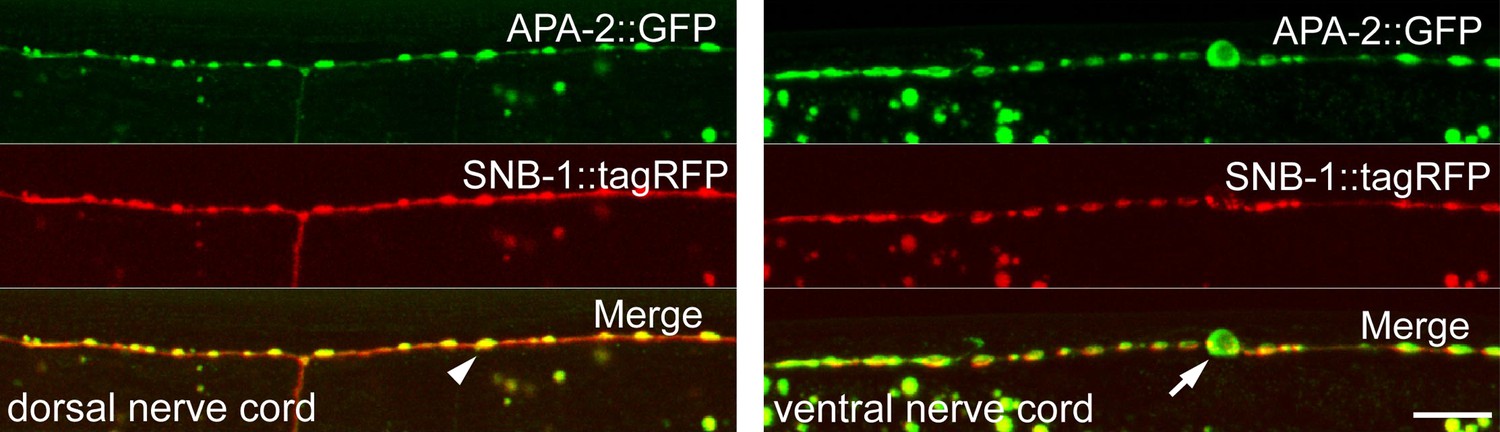
α-adaptin colocalizes with synaptobrevin at synapses.
Young adult hermaphrodites were used for imaging. Left: α-adaptin (APA-2::GFP) and synaptobrevin (SNB-1::tagRFP) colocalize at synapses in the dorsal nerve cord of GABA motor neurons. The fluorescent puncta correspond to synaptic varicosities along the dorsal muscles (white arrow head). Right: α-adaptin and synaptobrevin localization in the ventral nerve cord of GABA motor neurons. A GABA neuron cell body is indicated by the white arrow. Images are confocal Z-stack projections through the worm nerve cord. The scale bar represents 10 μm.
Figure 8 with 4 supplements
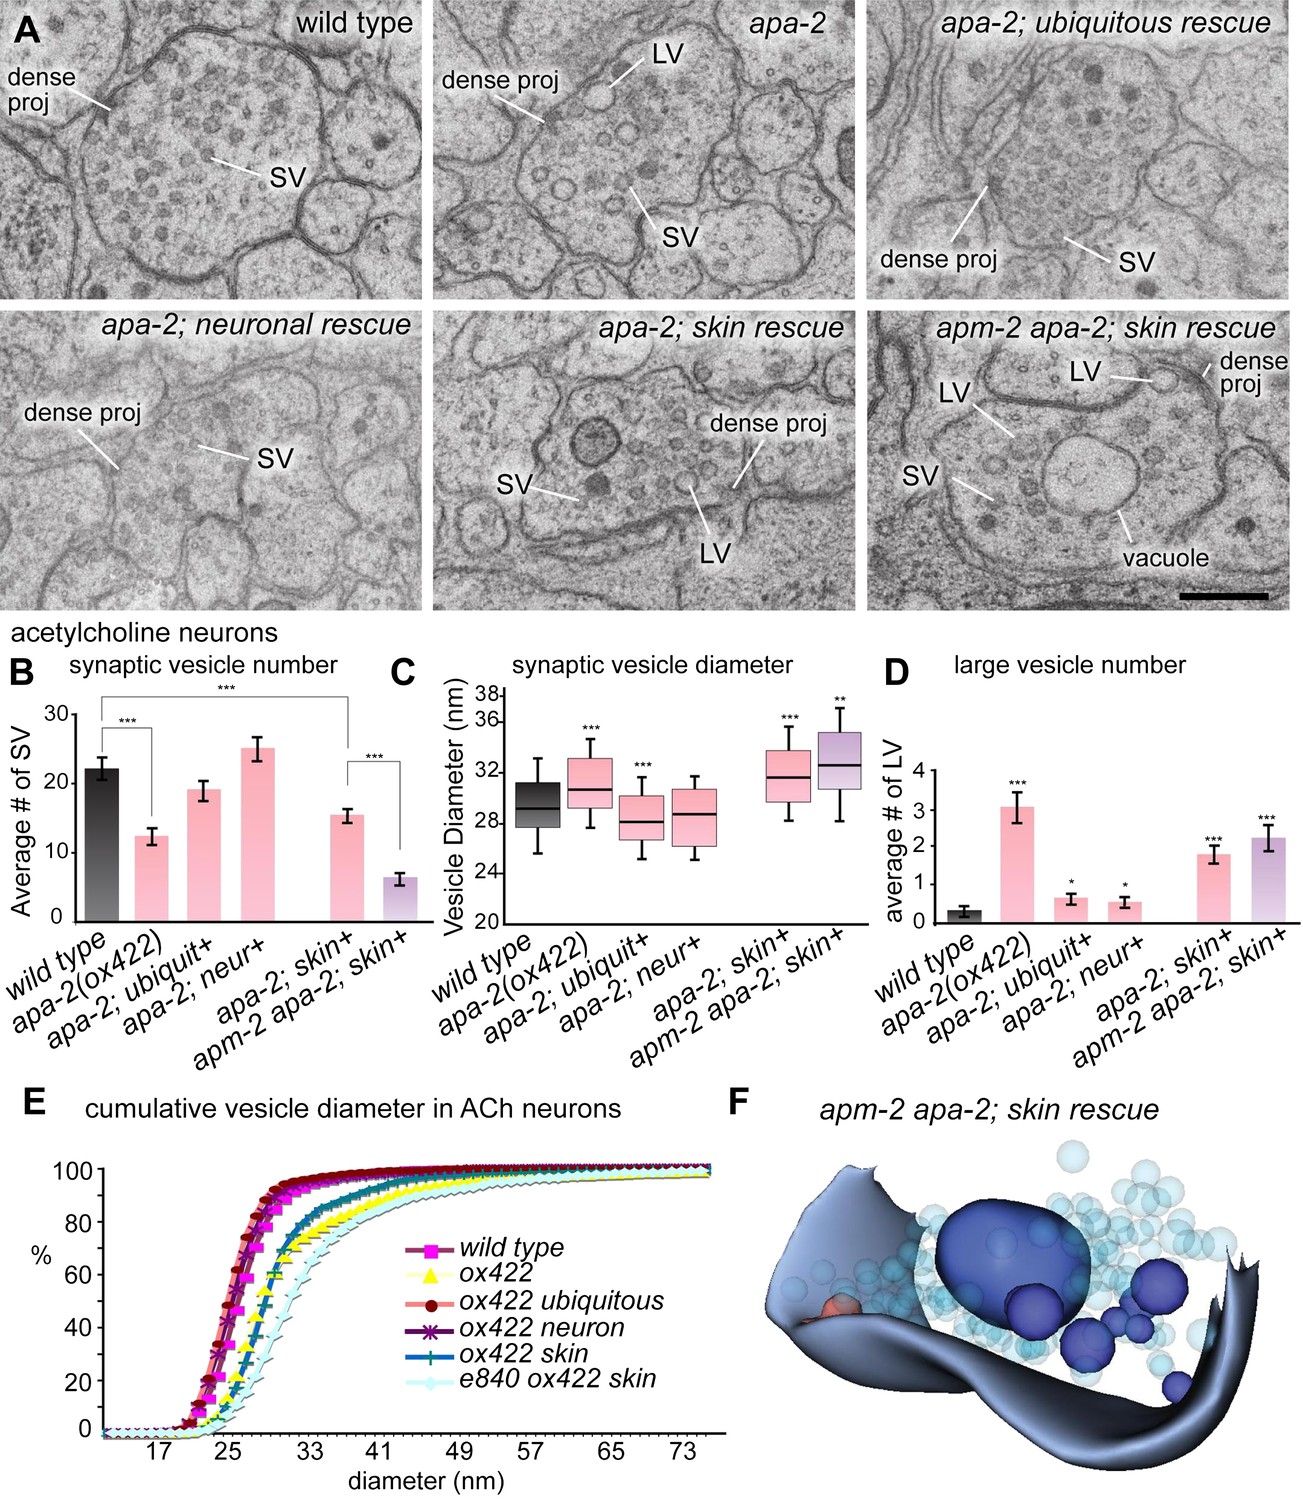
Large vesicles accumulate at synapses in AP2 mutants.
(A) Representative images of acetylcholine neuromuscular junctions in the ventral nerve cord from the wild type, apa-2(ox422), ubiquitously-rescued apa-2(ox422), neuronally-rescued apa-2(ox422), skin-rescued apa-2(ox422), skin-rescued apa-2(ox422) apm-2(e840) in adult hermaphrodites. At apa-2 apm-2 synapses, at least one large vesicle was usually observed adjacent to the dense projection (13/21 synapses), and a large vacuole in the center of the varicosity (17/21 synapses). The scale bar represents 200 nm. Abbreviations: SV: synaptic vesicle; LV: large vesicle; dense proj: dense projection. (B) Morphometry of acetylcholine neuromuscular junctions in adaptin mutants. The number of synaptic vesicles is reduced in neurons lacking α adaptin or both α and μ2-adaptins. Average number of synaptic vesicles per profile containing a dense projection ± SEM n = synapses: wild type 22.0 ± 1.4 n = 35, apa-2(ox422) 12.3 ± 1.1 n = 66 (p<0.0001), ubiquitous rescued apa-2(ox422) 19.1 ± 1.1 n = 54 (p=0.1052), neuron-rescued apa-2(ox422) 25.1 ± 1.5 n = 49 (p=0.1501), skin-rescued apa-2(ox422) 15.6 ± 0.8 n = 97 (p<0.0001), skin-rescued apa-2(ox422) apm-2(e840) 6.2 ± 0.8 n = 47(p<0.0001; compared with skin rescued apa-2(ox422) p<0.0001). (C) Median size of synaptic vesicles per profile containing a dense projection n = synapses: wild type 28.4 nm n = 9, apa-2(ox422) 29.9 nm n = 12 (p=0.0007), ubiquitous rescued apa-2(ox422) 27.4 nm n = 12 (p=0.0001), neuron- rescued apa-2(ox422) 27.9 nm n = 12 (p=0.5538), skin-rescued apa-2(ox422) 30.9 nm n = 23 (p<0.0001), skin-rescued apa-2(ox422) apm-2(e840) 31.9 nm n = 11 (0.0057). Median is the middle line and box defines the 25th and 75th percentiles. The length of the whiskers indicates the span between the 10th and 90th percentiles. (D) Average number of large vesicles (clear core and the diameter > 35 nm) per profile containing a dense projection ± SEM n = synapses: wild type 0.30 ± 0.11 n = 30, apa-2(ox422) 3.1 ± 0.34 n = 72 (p<0.0001), ubiquitous rescued apa-2(ox422) 0.7 ± 0.13 n = 43 (p=0.0302), neuron-rescued apa-2(ox422) 0.6 ± 0.08 n = 62 (p=0.0325), skin-rescued apa-2(ox422) 1.8 ± 0.2 n = 97 (p<0.0001), skin-rescued apa-2(ox422) apm-2(e840) 2.2 ± 0.29 n = 53 (p<0.0001). (E) Cumulative vesicle diameter in acetylcholine neurons. For all panels, the imaged synapses are from two young adult hermaphrodites for each genotype. Statistics are comparison with wild type, except where marked. * p<0.05, ** p<0.01, *** p<0.001. (F) 3D modeling of an acetylcholine synapse from a skin-rescued apa-2(ox422) apm-2(e840) animal. Structures were hand-traced from ten consecutive sections using an imageJ plugin, TrakEM2 (Cardona et al., 2012). The transparent light-blue structures are synaptic vesicles, and the red structure is a dense projection. Large vesicles (dark blue) that accumulate in the terminal are typically severed from the surface.
Figure 8—figure supplement 1
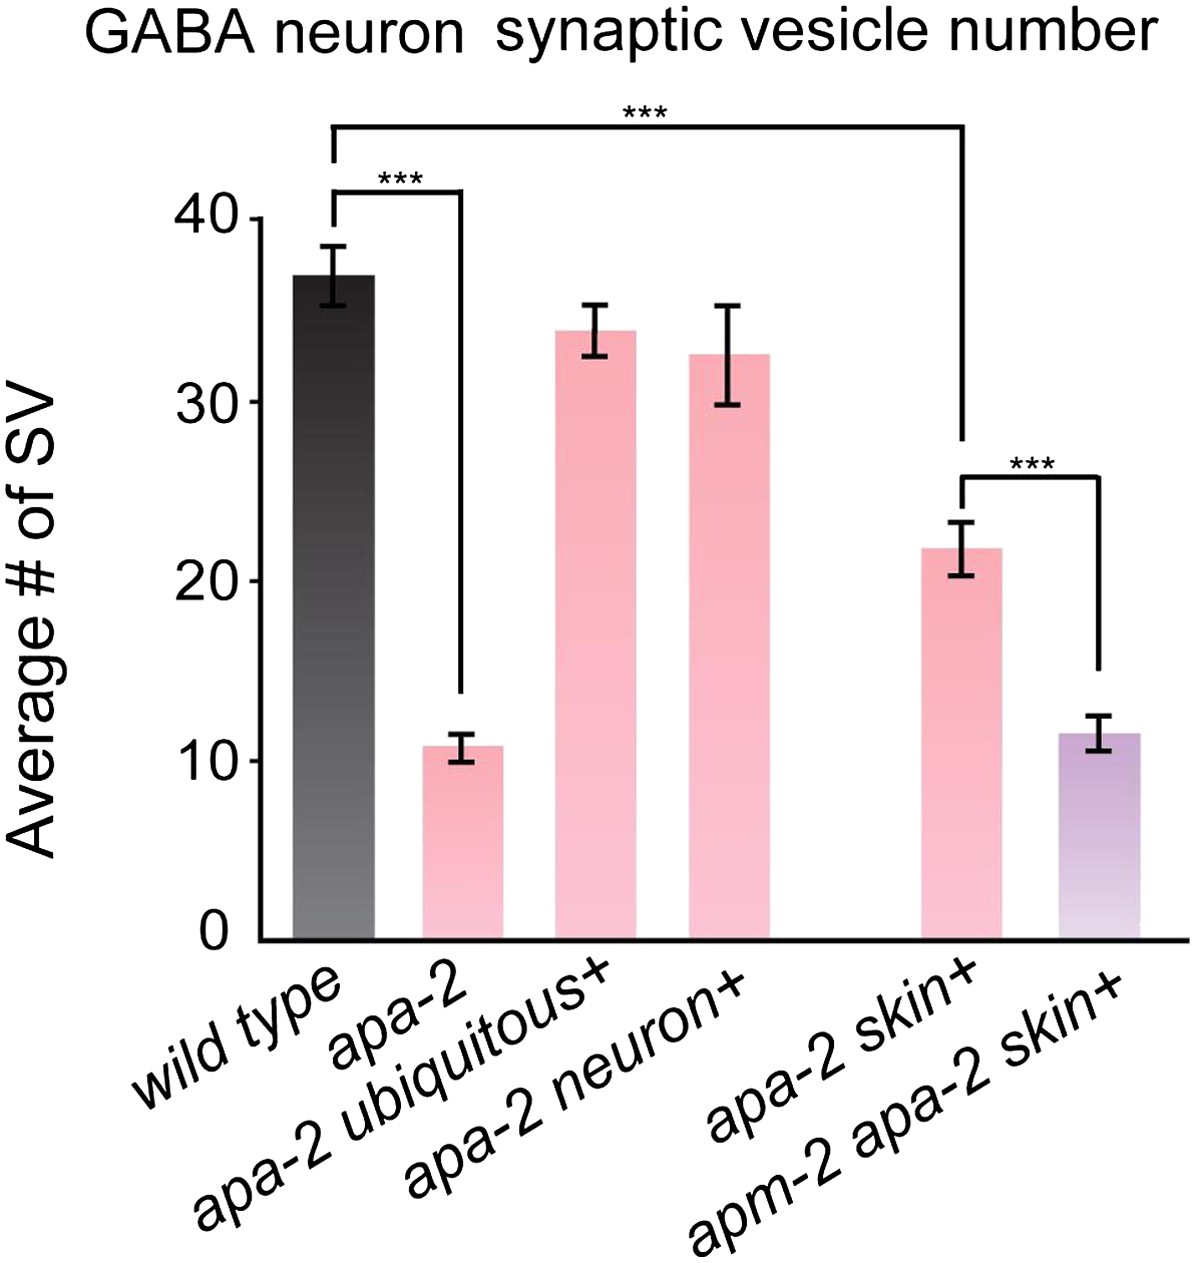
Synaptic vesicles are reduced at GABA synapses in α-adaptin mutants and α-adaptin μ2-adaptin double mutants.
The number of synaptic vesicles in GABA neurons n = synapses: wild type 36.9 ± 1.5 n = 36, apa-2(ox422) 10.7 ± 0.7 n = 46 (p<0.0001), ubiquitously-rescued apa-2(ox422) 33.9 ± 1.4 n = 33 (p=0.1504), neuron-rescued apa-2(ox422) 32.5 ± 2.7 n = 40 (p=0.1711), skin-rescued apa-2(ox422) 21.7 ± 1.3 n = 45 (p<0.0001), skin-rescued apa-2(ox422) apm-2(e840) 11.5 ± 0.9 n = 52 (p<0.0001; compared with skin-rescued apa-2(ox422) p<0.0001).
Figure 8—figure supplement 2
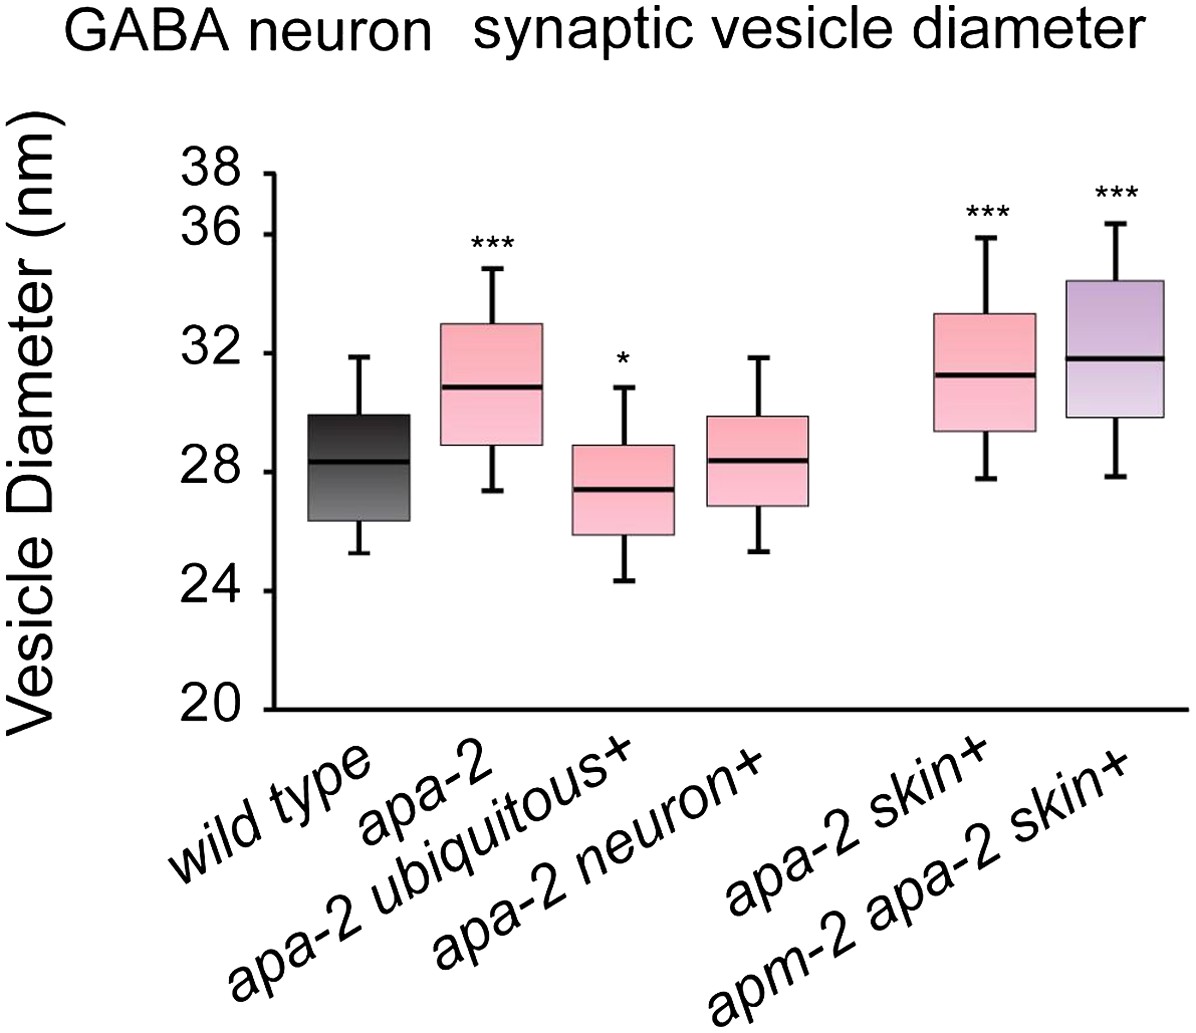
Synaptic vesicle diameters are larger in α-adaptin mutants.
Median size of synaptic vesicles per GABA synapse profile containing a dense projection n = synapses: wild type 28.4 nm n = 8, apa-2(ox422) 30.9 nm n = 9 (p<0.0001), ubiquitously-rescued apa-2(ox422) 27.4 nm n = 7 (p=0.0140), neuron-rescued apa-2(ox422) 28.4 nm n = 9 (p=0.2359), skin-rescued apa-2(ox422) 31.4 nm n = 11 (p<0.0001), skin-rescued apa-2(ox422) apm-2(e840) 31.9 nm n = 12 (p<0.0001). The center line indicates the median and the box defines the 25th and 75th percentiles. The upper and lower ends of the whiskers are the 90th and 10th percentiles respectively. Mann-Whitney U test was used for statistics. Statistical comparisons are to the wild type.
Figure 8—figure supplement 3
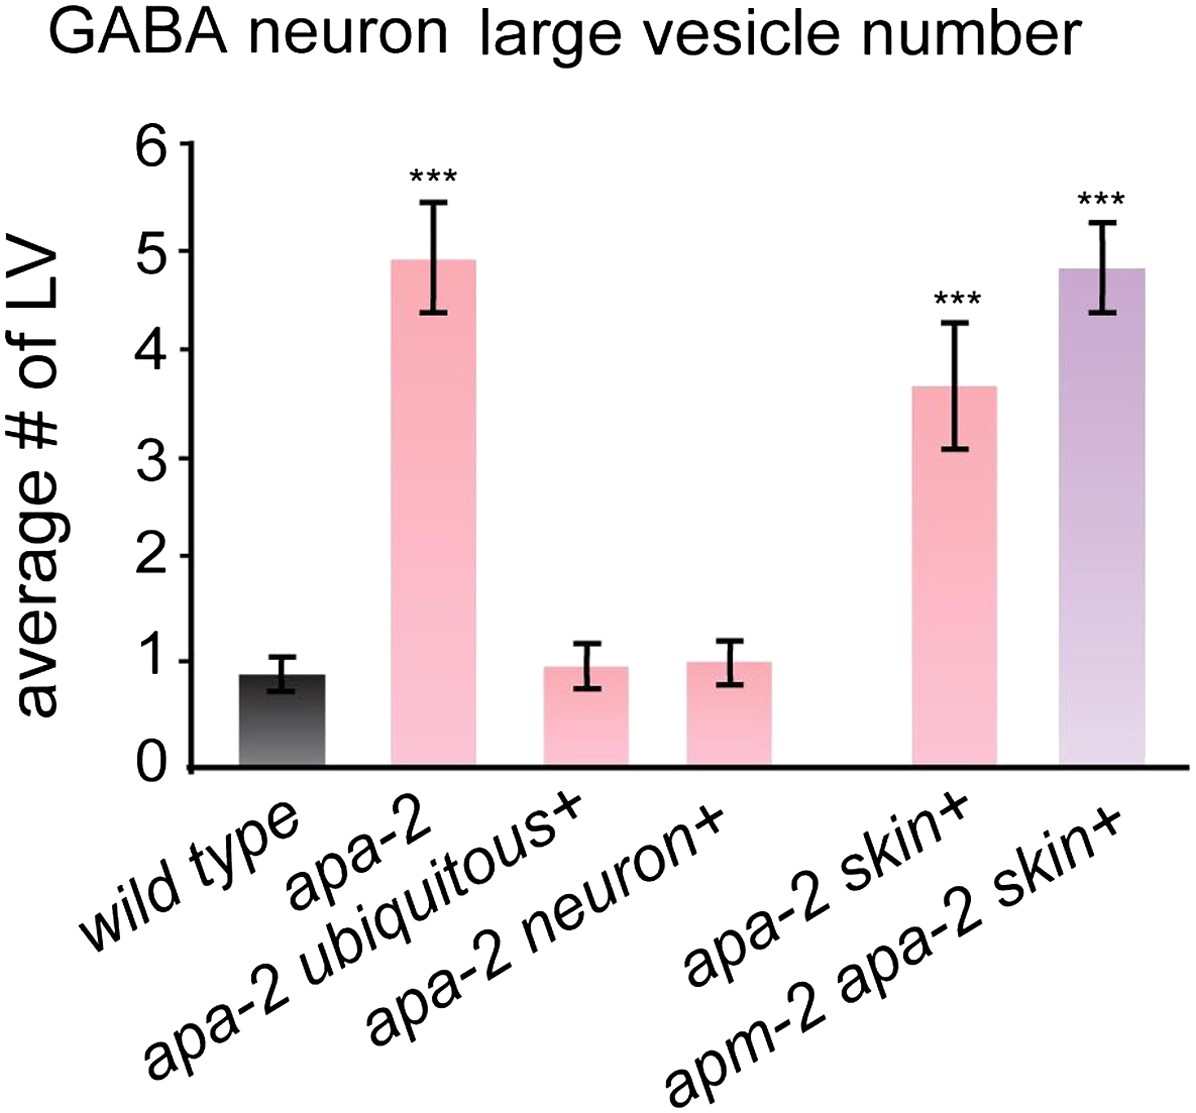
Large vesicles accumulate in α-adaptin mutants and α-adaptin μ2-adaptin double mutants.
The number of large vesicles in GABA neurons n = synapses: Wild type GABA 0.9 ± 0.1 n = 41, apa-2(ox422) GABA 4.9 ± 0.5 n = 43 (p<0.0001), ubiquitously-rescued apa-2(ox422) GABA 0.9 ± 0.2 n = 32 (p=1.0000), neuron-rescued apa-2(ox422) GABA 1.0 ± 0.2 n = 37 (p=0.6464), skin-rescued apa-2(ox422) GABA 3.6 ± 0.5 n = 45 (p<0.0001), skin-rescued apa-2(ox422) apm-2(e840) GABA 4.8 ± 0.4 n = 50 (p<0.0001). Statistics are in comparison with the wild type, except where indicated. *** p<0.001.
Figure 8—figure supplement 4
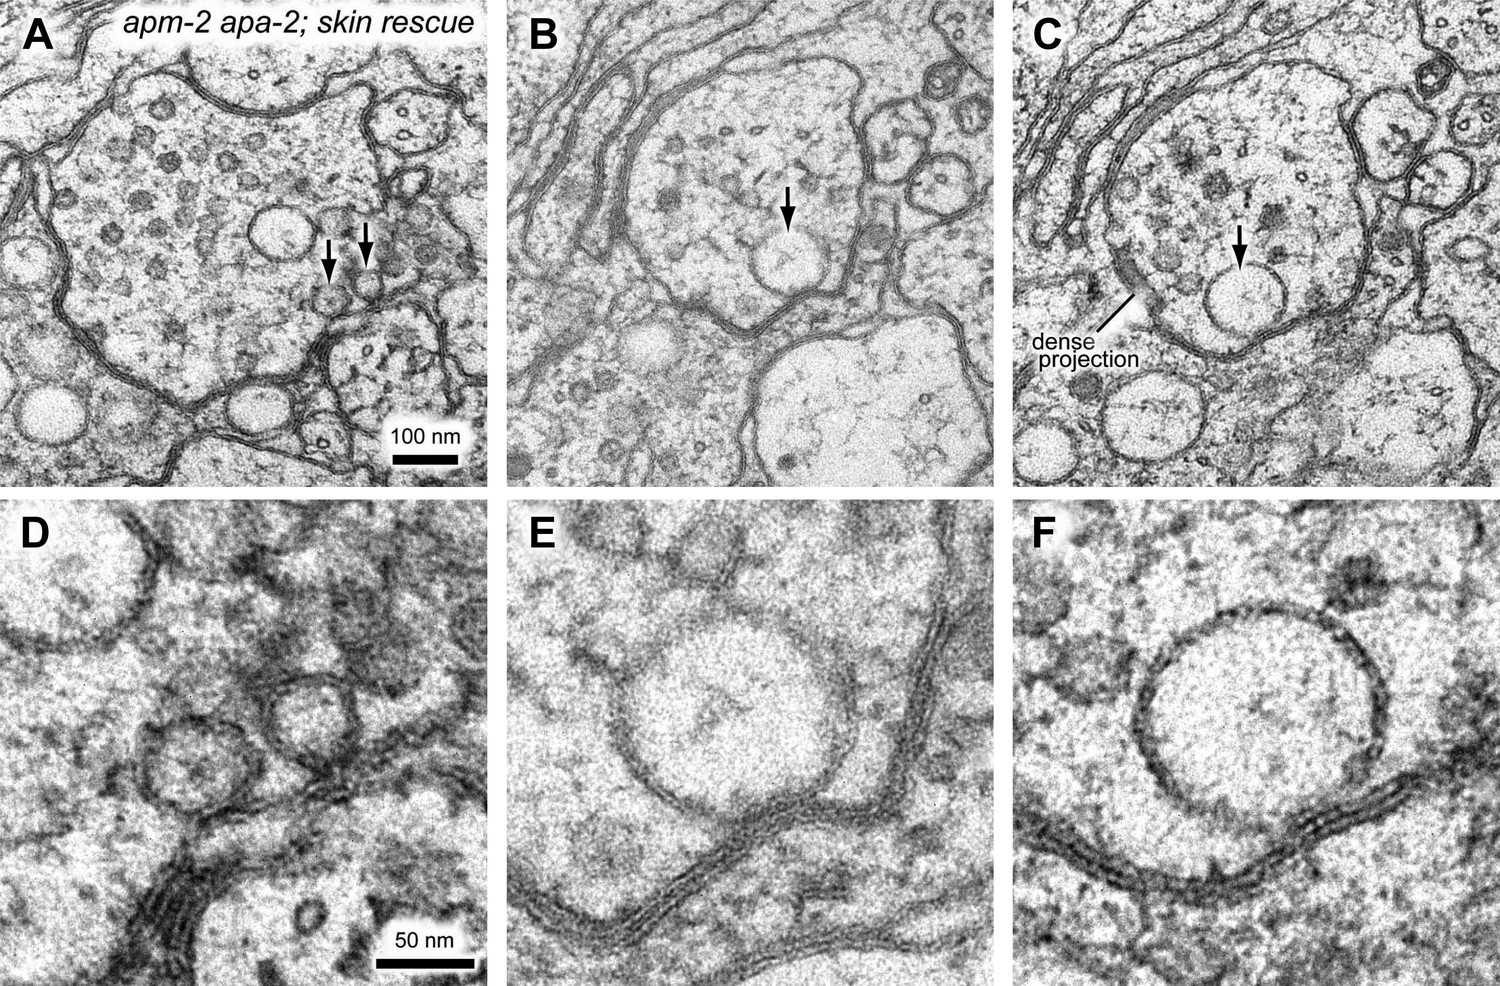
In some cases, the large vacuole remains associated with the plasma membrane in α-adaptin μ2-adaptin double mutants.
(A–C) additional images of acetylcholine neuromuscular junctions in the ventral nerve cord from the skin-rescued apa-2(ox422) apm-2(e840) in adult hermaphrodites. (D–F) Zoomed-in images of large vacuoles indicated by black arrows in (A–C). The scale bar represents 100 nm in (A–C) and 50 nm in (D–F).
Figure 9
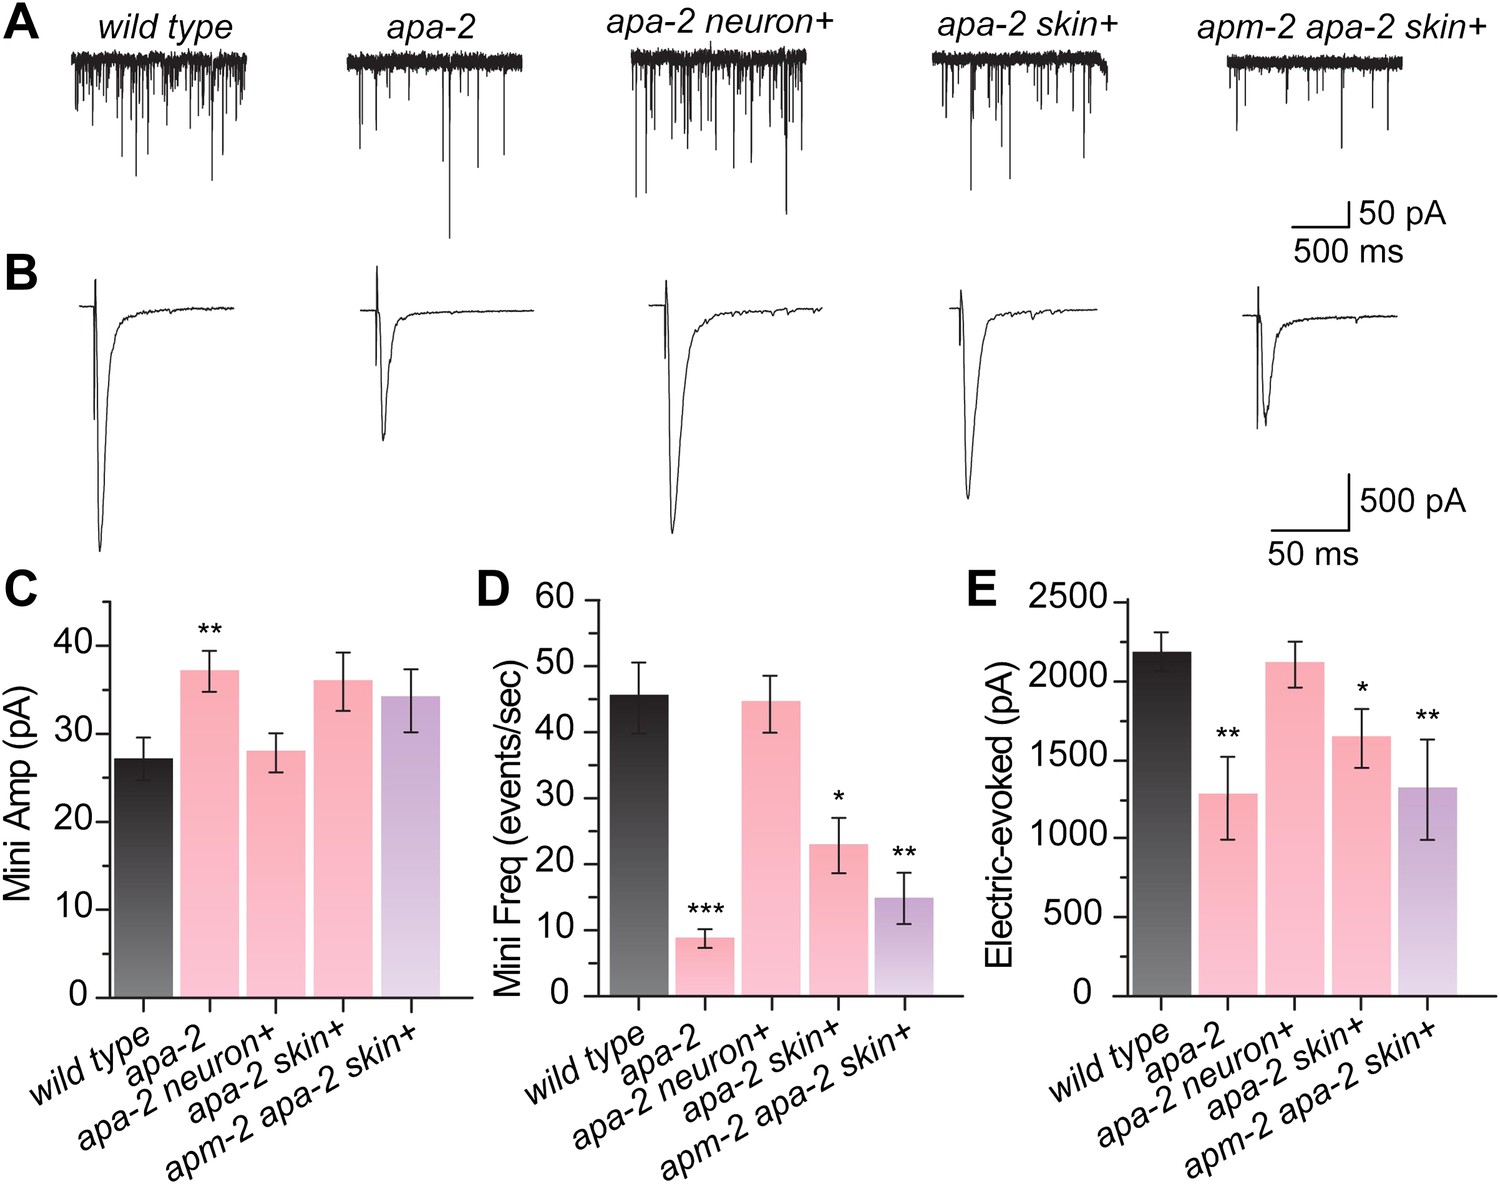
Synaptic vesicle fusion is reduced in α adaptin mutants.
(A) Sample traces of miniature postsynaptic current (minis) recorded from the wild type, apa- 2(ox422), apa-2(ox422) neuronal-rescued, apa-2(ox422) skin-rescued and apa-2(ox422) apm-2(e840) skin-rescued worms. (B) Sample traces of evoked postsynaptic current (electrically evoked) recorded from same genotypes. (C) Summary of mini amplitudes (pA ± SEM n = animals): wild type 26.4 ± 2.5 n = 16, apa-2(ox422) 36.9 ± 2.5 n = 19 (p=0.0058), apa-2(ox422) skin-res. 35.2 ± 3.6 n = 9 (p=0.0516), apa-2(ox422) neur-res. 28.1 ± 2.4 n = 21 (p=0.6313), apa-2(ox422) apm-2(e840) skin-res. 33.3 ± 3.8 n = 9 (p=0.1287). (D) Summary of mini frequency (minis/sec ± SEM n = animals): wild type 43.9 ± 5.9 n = 16, apa-2(ox422) 7.8 ± 1.5 n = 19 (p<0.0001), apa-2(ox422) skin-res. 22.5 ± 4.5 n = 9 (p=0.0206), apa-2(ox422) neur-res. 44.9 ± 4.8 n = 21(p=0.8951), apa-2(ox422) apm-2(e840) skin-res. 14.2 ± 4.0 n = 9 (p=0.0019). (E) Summary of evoked amplitude (pA ± SEM n = animals): wild type 2159.6 ± 131.1 n = 11, apa-2(ox422) 1259.1 ± 274.9 n = 5 (p=0.0044), apa-2(ox422) skin-res. 1627.3 ± 182.0. n = 6 (p=0.0303), apa-2(ox422) neur-res. 2090.7 ± 149.0 n = 6 (p=0.7468), apa-2(ox422) apm-2(e840) skin-res. 1264.3 ± 323.7 n = 6 (p=0.0082). * p<0.05, ** p<0.01, *** p<0.001.
Tables
Table 1
GFP fluorescence of tagged AP2 subunits in the nerve ring (quantification for Figure 6). Average GFP intensity in the nerve ring (percentage of the wild type)
| wild type | apa-2 | apm-2 | |
| σ2::GFP | 3543 ± 169 (100%) | 389 ± 28 (11%) | 1391 ± 51 (39%) |
| β1::GFP | 3881 ± 31 (100%) | 2329 ± 123 (60%) | 1360 ± 62 (35%) |
| μ2::GFP | 2783 ± 142 (100%) | 532 ± 73 (19%) | – |
| α::GFP | 3230 ± 132 (100%) | – | 1296 ± 126 (40%) |
-
The data are mean ± SEM of averaged fluorescence, n = 5 worms each. The p value for all pair-wise comparisons (wild type vs mutants or apa-2 vs apm-2) is p<0.0001. Student's t test. Note the beta subunit in C. elegans is shared by both the AP1 and AP2 complexes. Beta levels are reduced in apm-2 mutants compared to apa-2 mutants; however, beta is still present and stable in AP1 complexes in apm-2 mutants. In particular, beta is highly expressed in pharyngeal muscle, which is included in the region of interest.
Additional files
-
Supplementary file 1
Strains.
- https://doi.org/10.7554/eLife.00190.025
Download links
A two-part list of links to download the article, or parts of the article, in various formats.
Downloads (link to download the article as PDF)
Open citations (links to open the citations from this article in various online reference manager services)
Cite this article (links to download the citations from this article in formats compatible with various reference manager tools)
AP2 hemicomplexes contribute independently to synaptic vesicle endocytosis
eLife 2:e00190.
https://doi.org/10.7554/eLife.00190


