KDM2B links the Polycomb Repressive Complex 1 (PRC1) to recognition of CpG islands
- University of Oxford, UK
- RIKEN Research Center for Allergy and Immunology, Japan
Figures
Figure 1 with 1 supplement
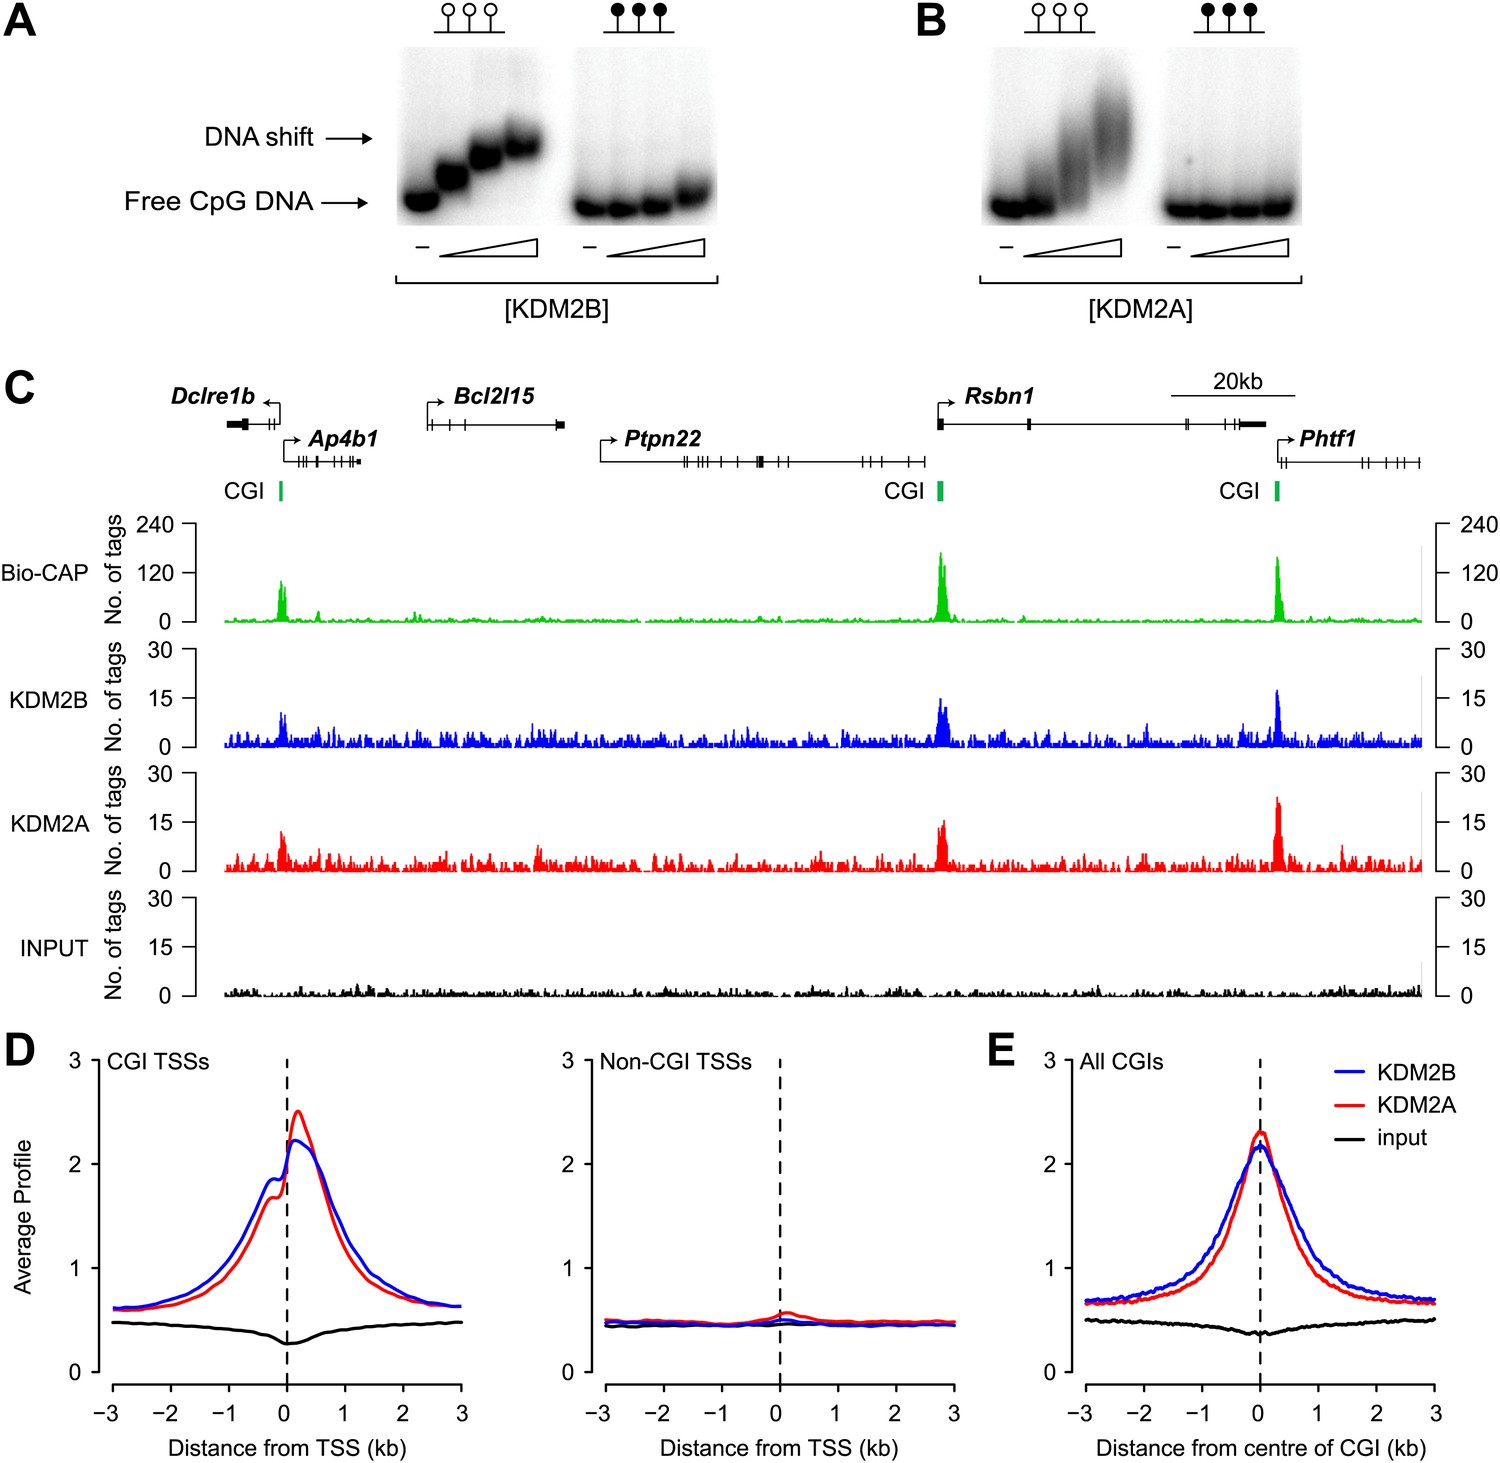
KDM2B binds to non-methylated CpG DNA and localises to CGIs genome-wide.
(A) Electrophoretic mobility shift assay (EMSA) demonstrating that the recombinant KDM2B ZF-CxxC domain binds to a DNA probe containing non-methylated CpGs (left panel) in a concentration-dependent manner. Binding is abrogated by CpG methylation (right panel). (B) An analogous EMSA to part (A) using the known CGI binding factor KDM2A for comparison. (C) Input, KDM2A, and KDM2B ChIP-seq profiles over a region of the genome containing CGI and non-CGI associated genes. Bio-CAP-seq profiles are shown to indicate the location of non-methylated DNA (Blackledge et al., 2012). Above the sequencing traces individual genes are shown with the arrow indicating the transcription start site and vertical black lines corresponding to exons. The location of CGIs are indicated by green bars. Both KDM2A and KDM2B associate specifically with CGIs containing non-methylated DNA. (D) KDM2A and KDM2B ChIP-seq signal segregates specifically with CGI associated gene promoters (left panel) and is excluded from gene promoters not associated with CGIs (right panel). (E) KDM2A and KDM2B ChIP-seq signal is centred over CGIs, in agreement with their capacity to recognize non-methylated DNA at these sites.
Figure 1—figure supplement 1
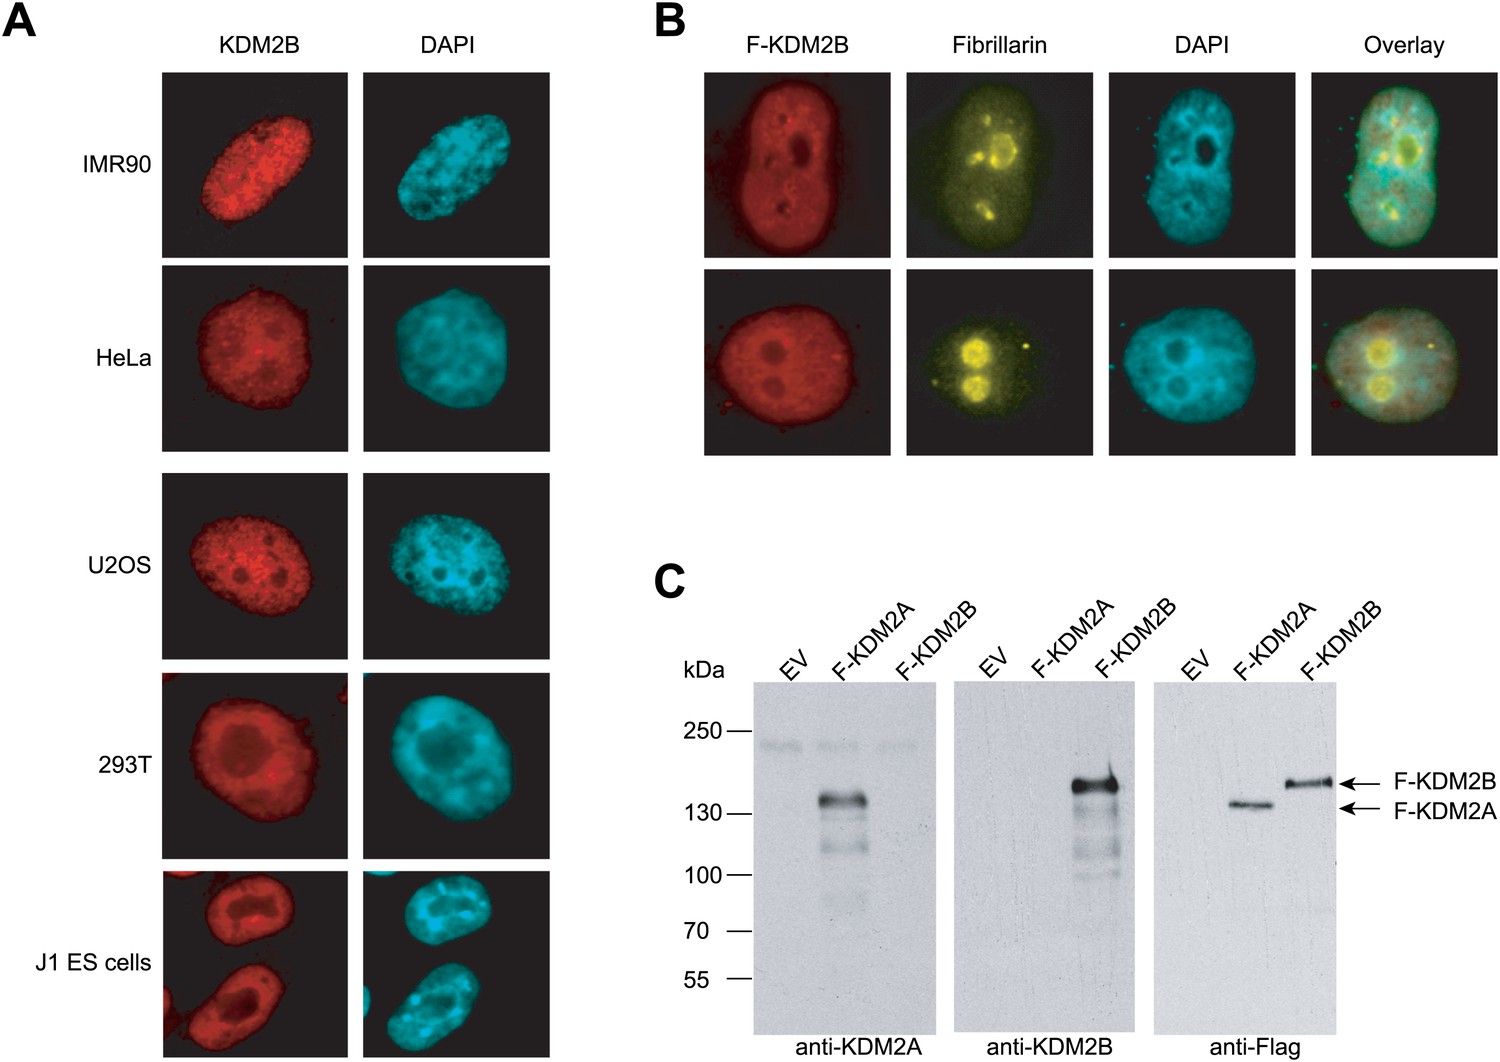
KDM2B is found throughout the nucleus and not concentrated in the nucleolus.
(A) Endogenous KDM2B immunofluorescence in five different mammalian cell lines. KDM2B signal is in red (left) and DAPI signal in blue (right). In all cell types KDM2B is a broadly distributed throughout the nucleus and not concentrated in the nucleolus as previously reported (Frescas et al., 2007). (B) Immunofluorescence in HeLa cells for Flag-tagged KDM2B and endogenous fibrillarin, a nucleolus marker. KDM2B is largely excluded from nucleoli. (C) The KDM2A and KDM2B antibodies specifically recognize their respective antigens. Empty expression vector, Flag-KDM2A, and Flag-KDM2B were transiently transfected into 293T cells. Whole cell extracts were made and probed with anti-KDM2A (left panel), anti-KDM2B (centre panel), or anti-Flag (right panel).
Figure 2 with 1 supplement
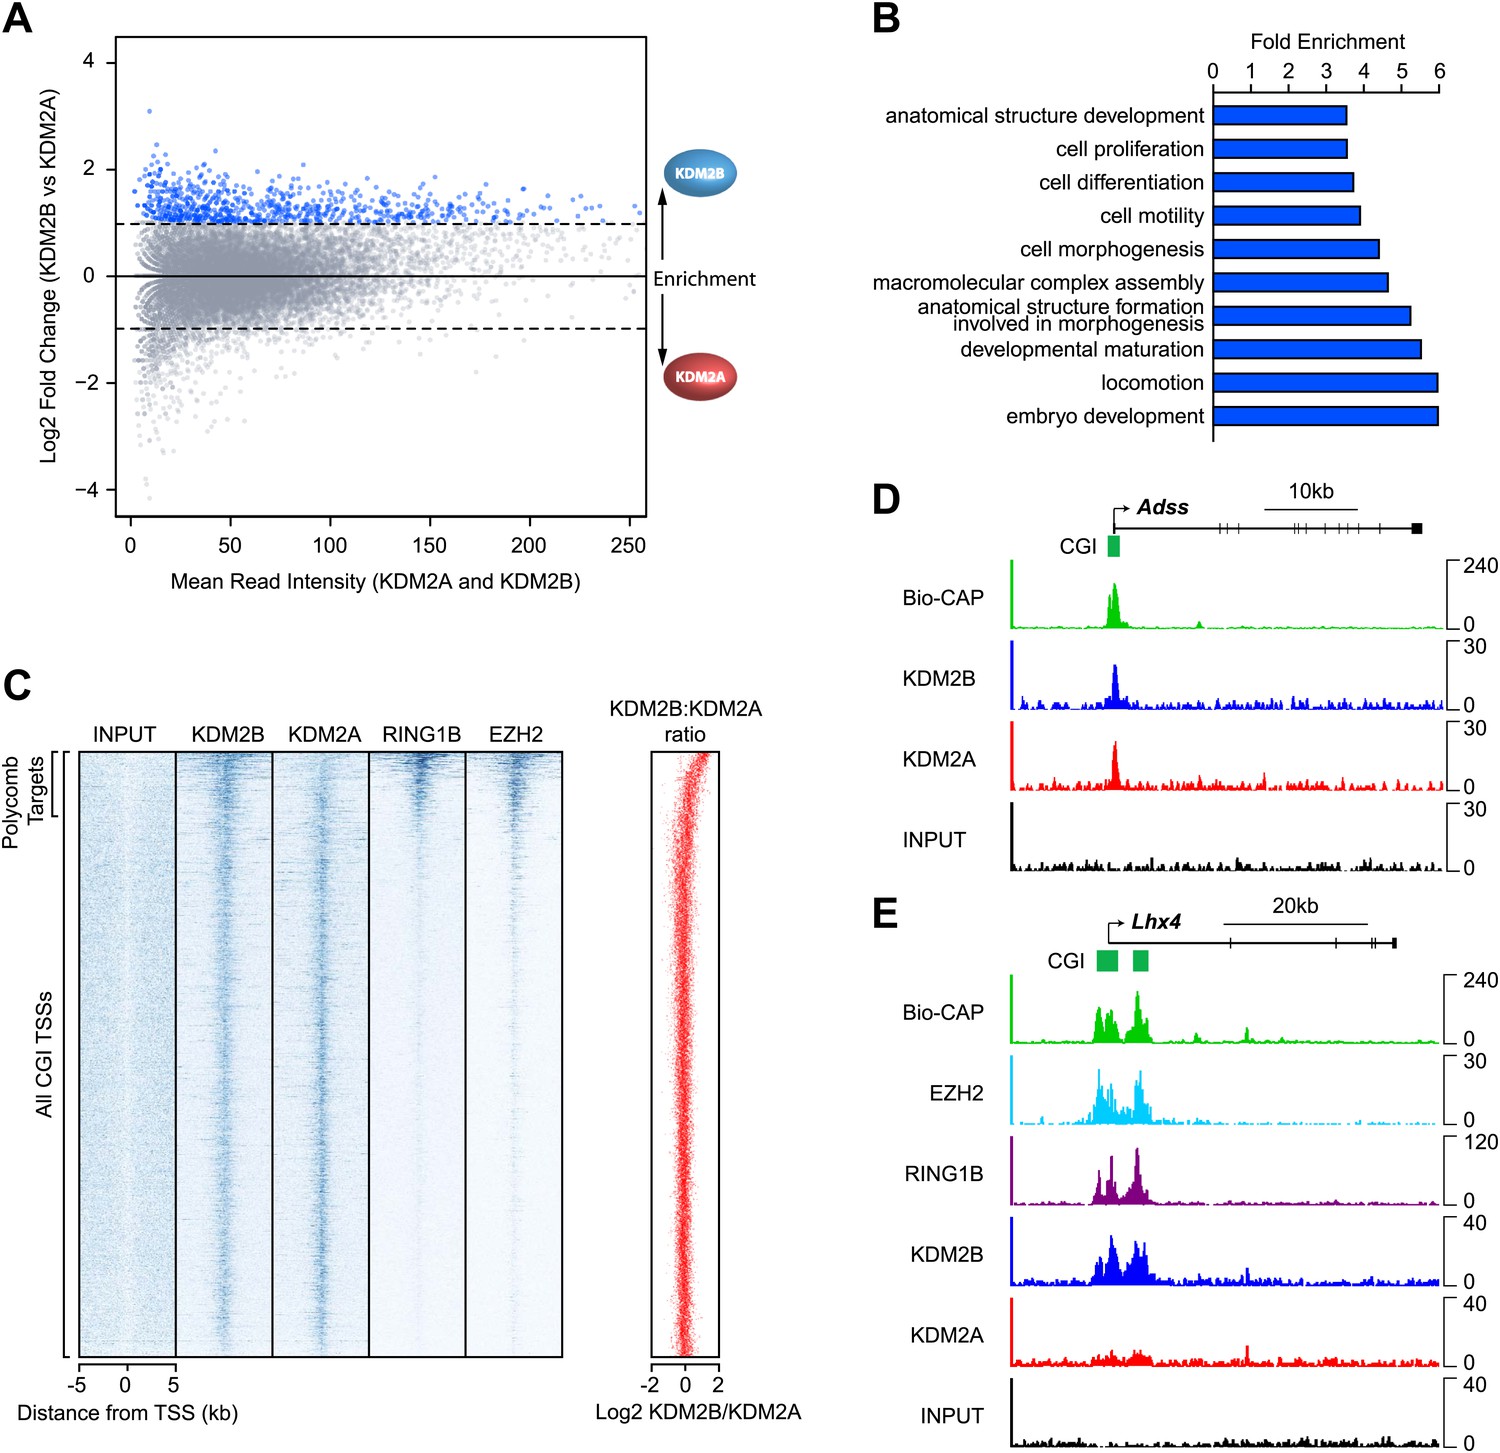
KDM2B is enriched at polycomb repressed CGIs.
(A) An MA-like plot depicting the relative enrichment of KDM2A and KDM2B at all gene associated CGIs in mouse ESC cells. The log2 mean read intensity is displayed on x-axis and the log2 relative enrichment of KDM2B compared to KDM2A is displayed on the y-axis. The subset of CGIs highly enriched for KDM2B is coloured blue. (B) A histogram displaying fold enrichment values for GO term analysis of the genes which are over twofold enriched for KDM2B (blue data points, part (A)) at a FDR <5%. (C) A heat map illustrating ChIP-seq signal at all CGI transcription start sites (TSSs) in mouse ESC cells indicating depletion of KDM2A and enrichment of KDM2B at polycomb target CGIs marked by RING1B and EZH2. The scatter plot (far right in red) illustrates the log ratio of KDM2B to KDM2A enrichment at the same intervals depicted in the heat map as a scatter plot. (D) ChIP-seq profiles for KDM2A and KDM2B at the Adss non-polycomb target CGI gene indicating similar binding of both KDM2A and B (upper panels). (E) ChIP-seq for KDM2A, KDM2B, RING1B (PRC1), and EZH2 (PRC2) at the Lhx4 gene (lower panels). KDM2B is specifically enriched and KDM2A depleted at this polycomb repressed CGI. In all cases Bio-CAP-seq indicates the location of underlying non-methylated DNA and clearly depicts the spatial relationship between KDM2B, polycomb group proteins, and non-methylated DNA.
Figure 2—figure supplement 1
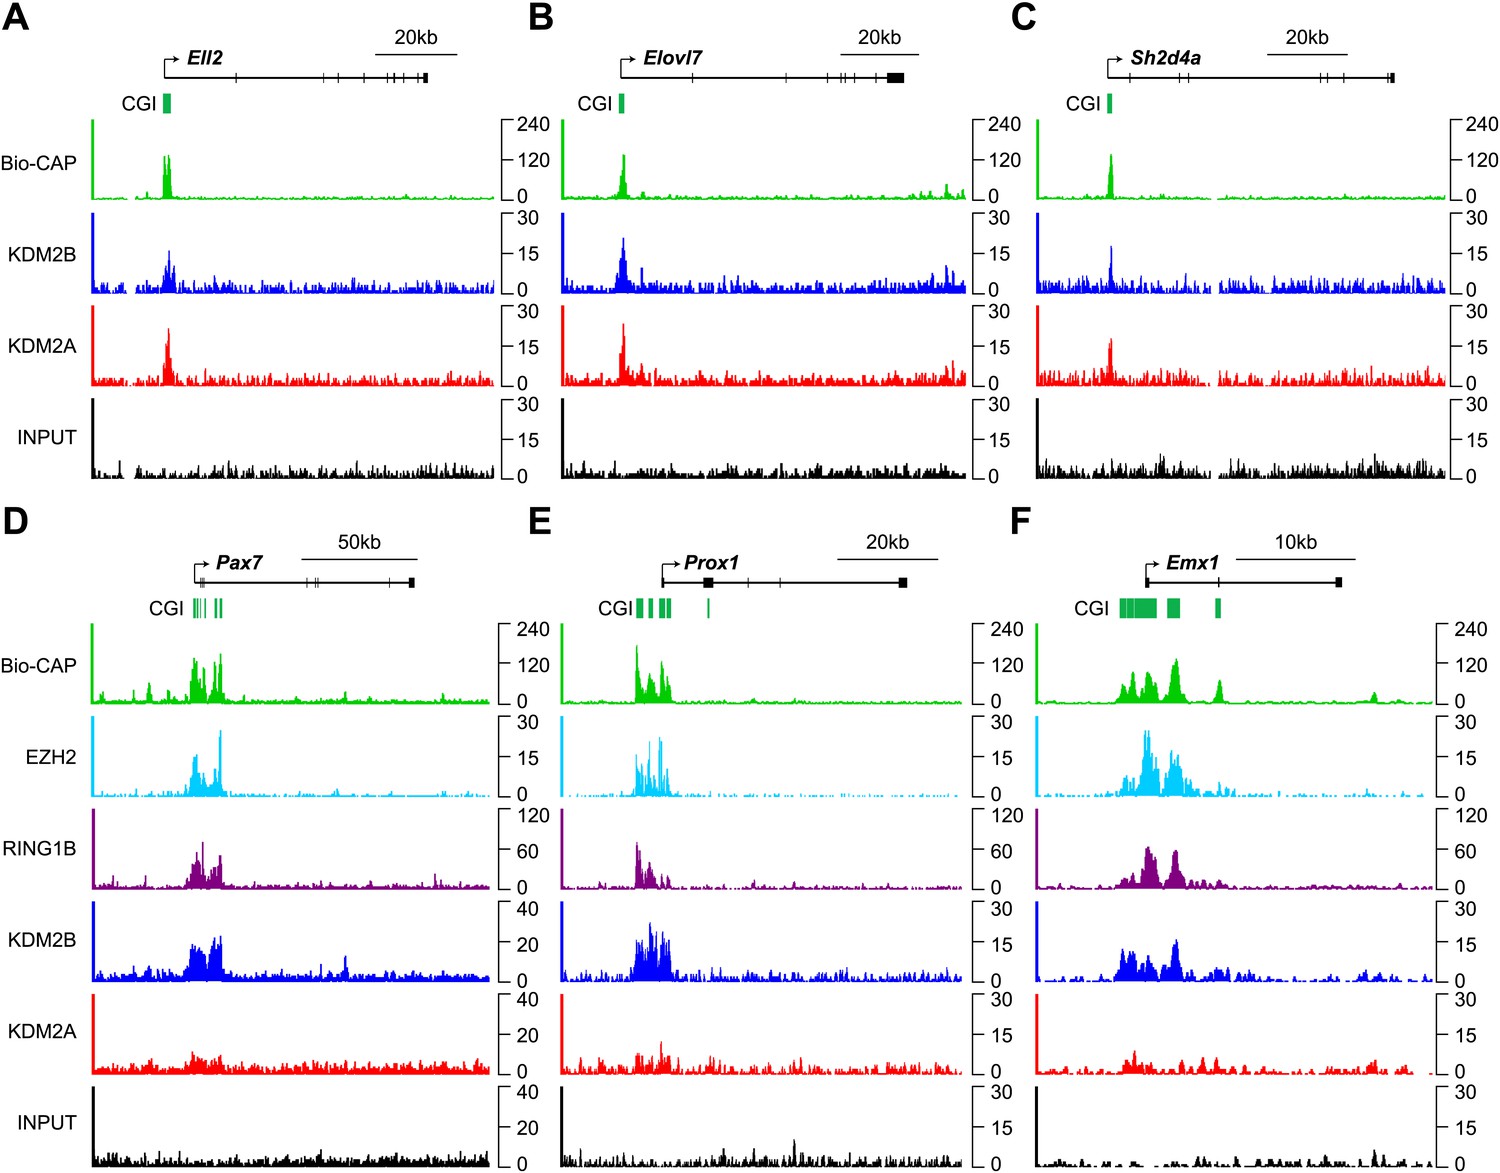
KDM2B is enriched at polycomb associated CGIs.
(A)–(C) ChIP-seq profiles for KDM2A and KDM2B over a series of non-polycomb associated CGIs. Similar enrichment of KDM2A and B is observed at these sites. (D)–(F) ChIP-seq profiles for KDM2A, KDM2B, RING1B, and EZH2 over a series of polycomb associated CGIs. KDM2B is enriched and KDM2A depleted at these sites.
Figure 3 with 1 supplement
KDM2B forms a variant PRC1 complex in mouse ESCs containing RING1B and PCGF1.
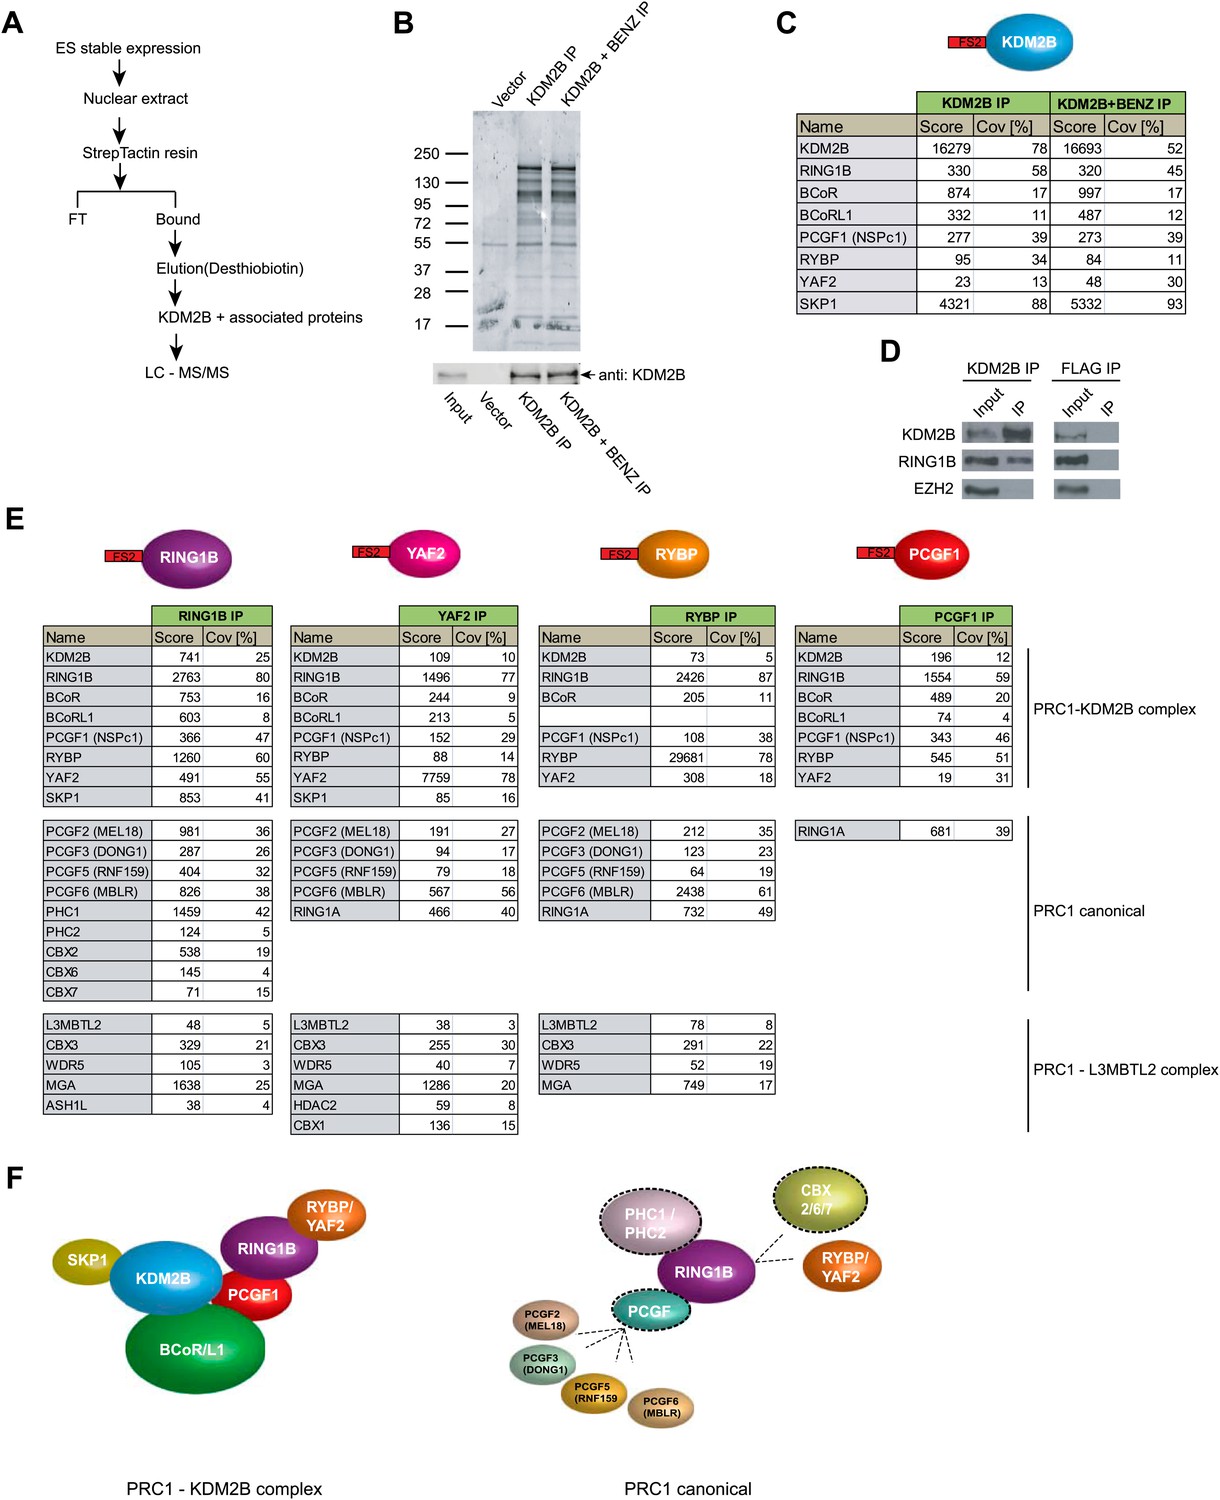
(A) To purify KDM2B and associated proteins, a mouse ESC cell line stably expressing Flag-2XStrepII-tagged KDM2B was generated. Nuclear extract was isolated from this cell line, KDM2B affinity purified, and the purified proteins subject to mass spectrometry. (B) Purified KDM2B fractions were resolved by gradient SDS-PAGE and visualized by SyproRuby staining. The purifications were performed in the absence and presence of benzonase to exclude DNA-mediated interactions and a cell line containing only the empty vector was used to control for non-specific binding to the affinity matrix. The elutions were probed by western blot for KDM2B as indicated. (C) Elutions from the KDM2B affinity purification were directly analysed by tryptic digestion followed by peptide identification by LC–MS/MS. The Mascot scores and peptide coverage are shown for the respective affinity purifications. KDM2B in ESCs associates with a variant PRC1 complex containing RING1B, BCOR/BCORL1, PCGF1, RYBP, YAF2 and SKP1. (D) Western blot analysis of endogenous KDM2B immunoprecipitation from ESC nuclear extract, verifying that KDM2B interacts with RING1B, but not the PRC2 component EZH2. Flag immunoprecipitation was performed as negative control. (E) Reciprocal affinity purifications and subsequent LC-MS/MS for RING1B, YAF2, RYBP, and PCGF1 confirm the interaction between KDM2B and these PRC1 components. This analysis further indicates that PCGF1 is unique to the KDM2B-PRC1 complex. Protein identification scores and sequence coverage (Cov [%]) are indicated. (F) A schematic representation of the variant KDM2B PRC1 complex (left panel) in comparison to canonical PRC1 complexes (right panel).
Figure 3—figure supplement 1
KDM2B forms a variant PRC1 complex in mouse ESCs containing RING1B and PCGF1.
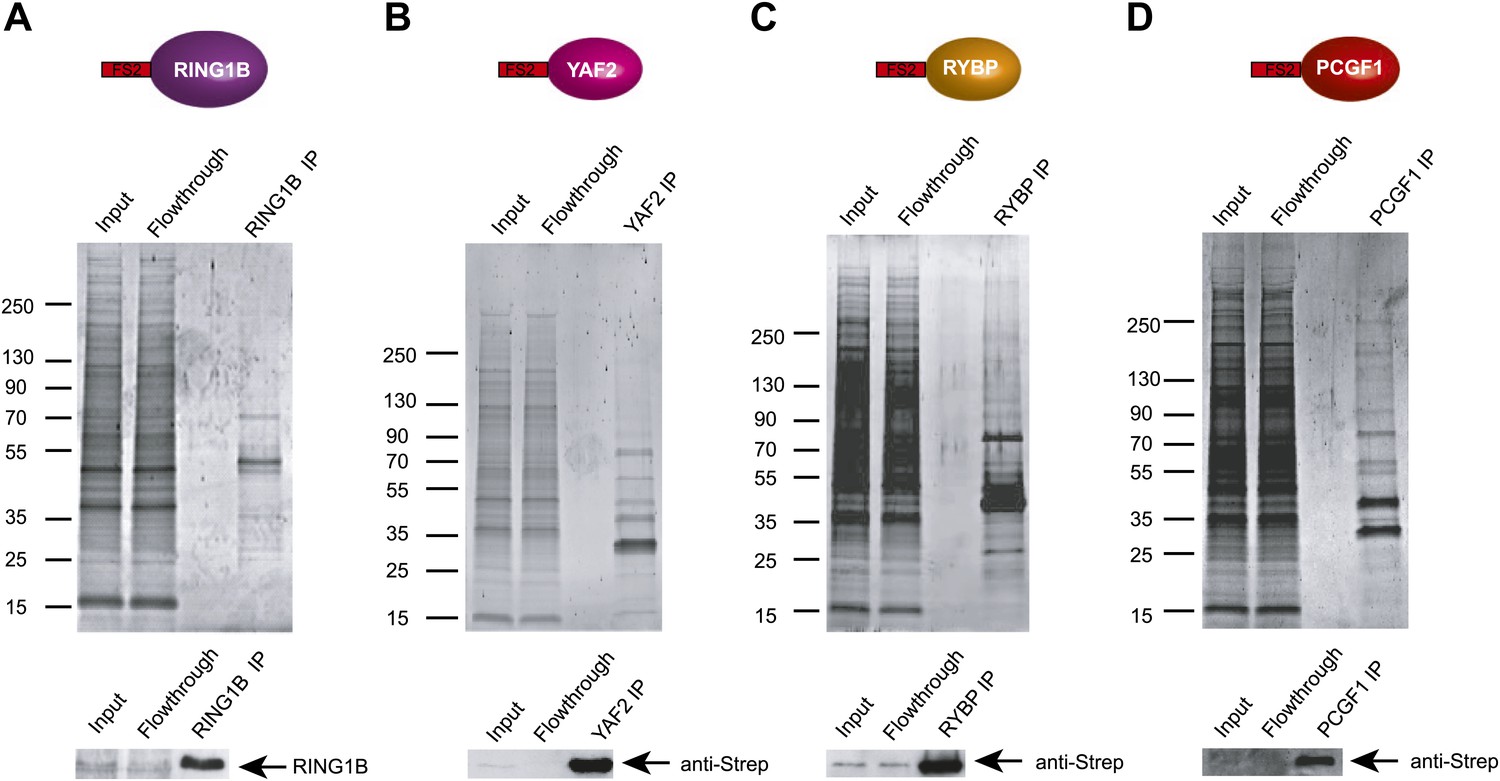
(A)–(D) Stable cell lines expressing Flag-2XStrepII tagged RING1B (A), YAF2 (B), RYBP (C), and PCGF1 (D) were generated and each protein affinity purified from mouse ESC nuclear extract. Purified fractions were resolved by gradient SDS-PAGE and visualized by SyproRuby staining. In each case the input, flowthrough, and elution is indicated above. The elutions were probed by western blot against the tagged protein as indicated below each SyproRuby stained gel.
Figure 4

KDM2B ZF-CxxC DNA binding domain is required for CGI binding.
(A) Schematic representation showing removal of RING1B in ESC Ring1a−/− Ring1bfl/fl cells by tamoxifen treatment. (B) ChIP analysis indicating that RING1B is enriched at polycomb target CGIs in untreated cells (red bars). After 48 hr of tamoxifen treatment RING1B binding is lost at polycomb targets (blue bars). Error bars represent SEM of three biological replicates. (C) ChIP analysis demonstrating that removal of RING1B does not lead to loss of KDM2B binding at regular or polycomb associated target CGIs (compare red and green bars). This demonstrates that RING1B is not required to recruit KDM2B to polycomb repressed sites. Error bars represent SEM of three biological replicates. (D) ChIP analysis in ESC cells stably expressing tagged wild-type (WT) KDM2B or a mutant KDM2B that disrupts its DNA-binding capacity (K643A).The ZF-CxxC domain of KDM2B is required for KDM2B binding to CGIs regardless of their polycomb status. Error bars represent SEM of two biological replicates.
Figure 5
KDM2B depletion in ESCs results in the up-regulation of a subset of polycomb repressed target genes.
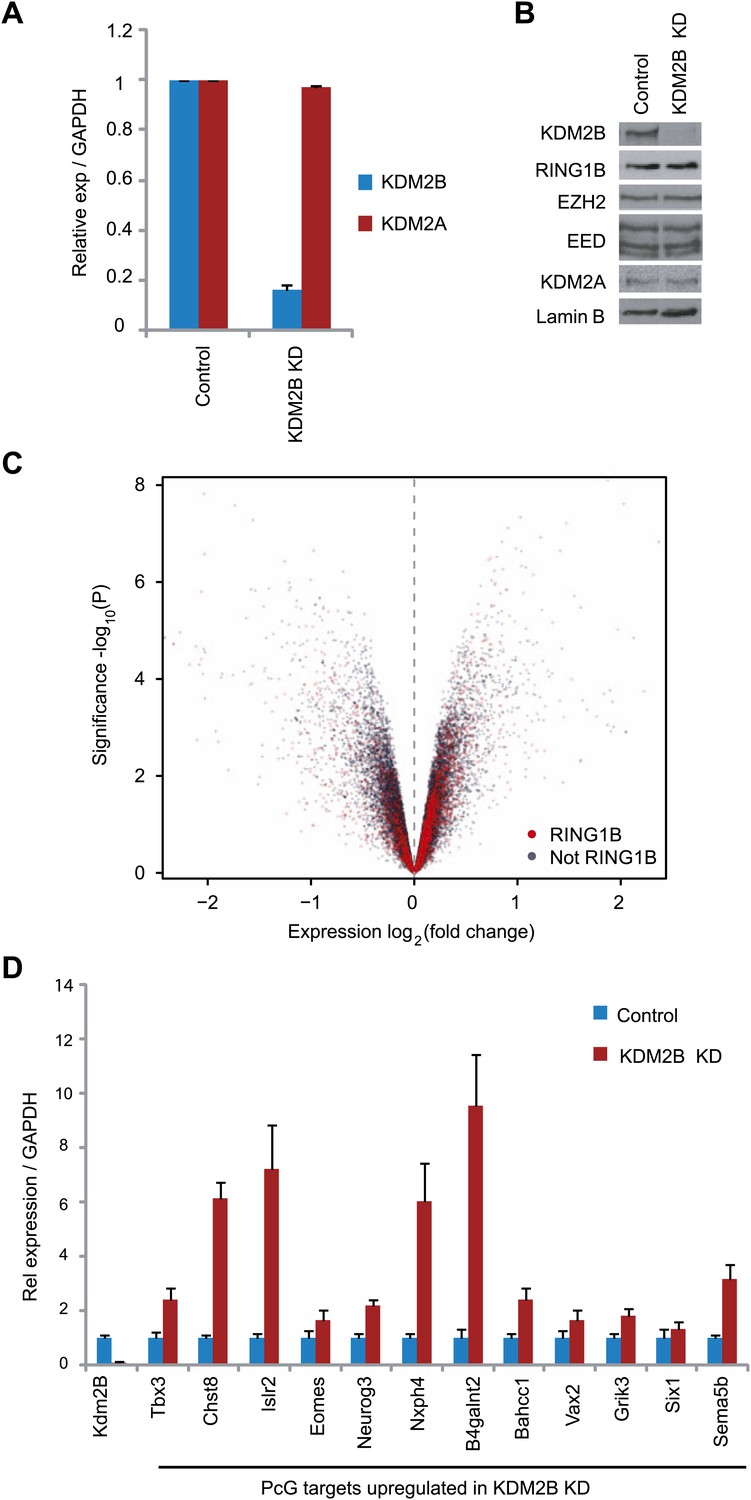
(A) RT-PCR showing reduction of KDM2B at the mRNA level in the knockdown (KD) but not control cell line. The levels of the closely related KDM2A mRNA were not affected. Error bars represent SEM of three biological replicates. (B) Western blot analysis showing that KDM2B knockdown depletes KDM2B but not the closely related KDM2A protein. Importantly depletion of KDM2B does not destabilize other polycomb group proteins including RING1B, EZH2 or EED. Lamin A/C indicates equal loading. (C) A volcano plot illustrating the gene expression changes in the KDM2B depletion line compared to the control cell line. The x-axis corresponds to fold change and the y-axis to the significance level. RING1B associated genes are coloured red and show preferential enrichment in the genes up-regulated upon KDM2B knockdown. (D) A panel of polycomb target genes identified in microarray analysis that were up-regulated upon depletion of KDM2B were validated by RT-PCR analysis. In most cases the level of up-regulation was more pronounced when analysed by RT-PCR. Error bars represent SEM of four biological replicates. Values are normalized to Gapdh and expression in the control line set to 1.
Figure 6 with 3 supplements
Depletion of KDM2B causes a reduction in RING1B occupancy.
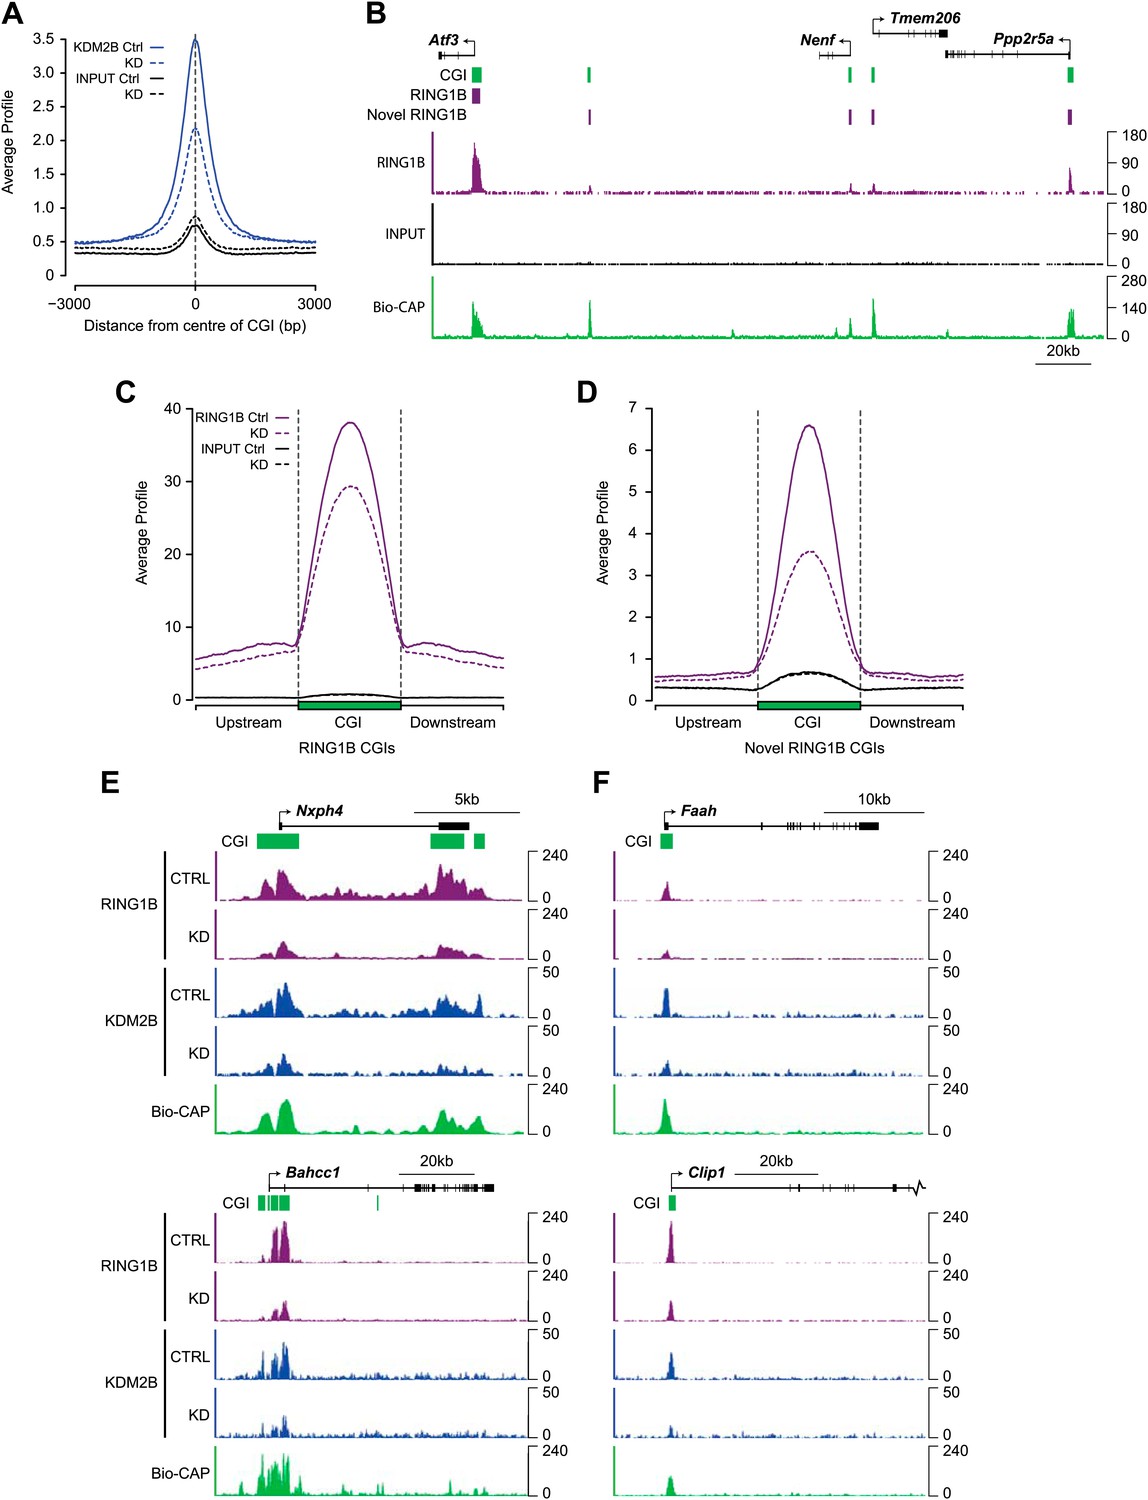
(A) KDM2B ChIP-seq signal was plotted at CGIs in the control (solid blue line) and knockdown cell line (dotted blue line). Sequencing signal in the input samples over the same regions are indicated as solid or dotted black lines. KDM2B ChIP-seq signal is specifically lost over CGIs genome-wide in the KDM2B knockdown cell line. (B) A snapshot showing RING1B ChIP-seq signal in the control cell line illustrating a previously identified high magnitude RING1B binding sites (i.e. Atf3) and novel low magnitude RING1B binding sites. Input sequencing traces over the same region are shown in black. Bio-CAP-seq signal indicates regions containing non-methylated DNA. Above the sequencing traces gene promoters are show by black arrows and exons by vertical black lines. CGIs are shown as green bars with previously identified RING1B peaks and novel RING1B peaks indicated with purple boxes. (C) RING1B ChIP-seq signal from the control (solid purple line) and KDM2B knockdown cell line (dotted purple line) were plotted over previously identified CGI associated RING1B binding sites. Input sequencing signal was plotted over same regions. In the KDM2B knockdown line there is a specific reduction of RING1B binding over the CGI. (D) The same ChIP-seq signal as in part (C) was plotted over novel low magnitude binding sites identified in part (B). In the KDM2B knockdown cell line there is an even more severe loss of RING1B binding at these novel RING1B occupied sites. (E),(F) Examples of ChIP-seq profiles at individual high (E) and low (F) magnitude RING1B binding sites showing clear reduction of RING1B following KDM2B knockdown.
Figure 6—figure supplement 1

Conditional removal of RING1B validates the identity of novel peaks identified in the RING1B ChIP-seq.
Eight genes corresponding to novel RING1B peaks identified in ChIP-seq were examined by ChIP quantitative-PCR (bar graphs) in the RING1B conditional ESC cells before (blue bars) and after (red bars) deletion of RING1B by addition of tamoxifen. In all cases deletion of RING1B leads to a loss of RING1B ChIP signal by quantitative-PCR, indicating that these are bona fide RING1B occupied sites. RING1B ChIP-seq traces are shown in each case for comparison. Error bars indicate the SEM for three biological replicates.
Figure 6—figure supplement 2
KDM2B depletion results in a loss of RING1B at polycomb associated CGIs.
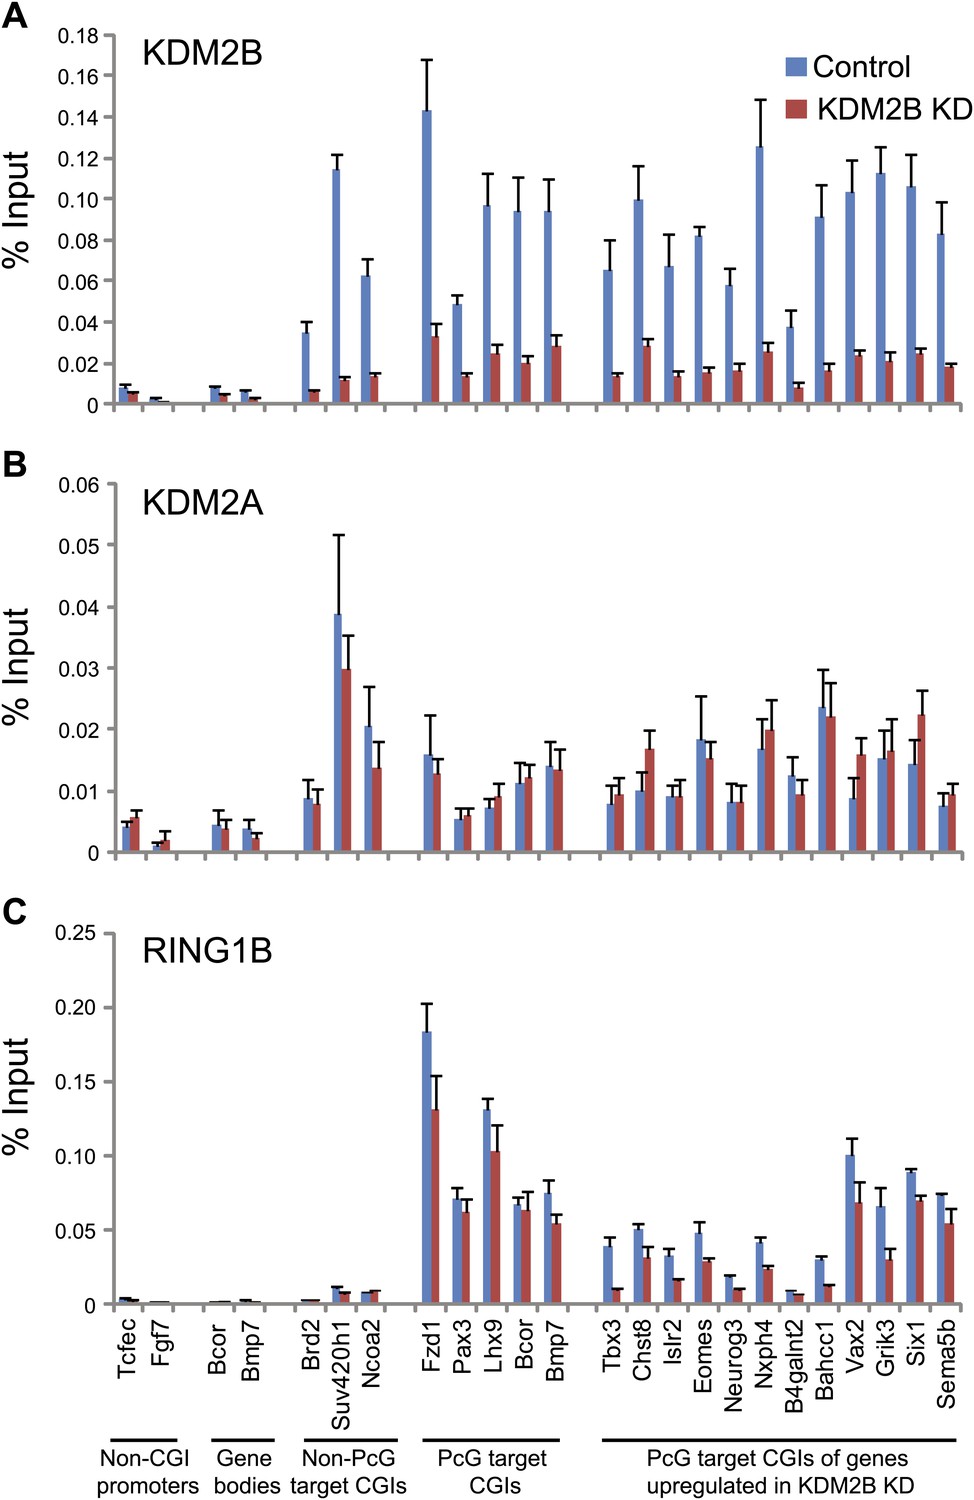
(A) ChIP q-PCR analysis demonstrating that KDM2B depletion results in a clear reduction of KDM2B occupancy at polycomb and non-polycomb CGIs. Error bars represent SEM of three biological replicates (B) ChIP analysis demonstrating that KDM2B depletion does not result in major effects on KDM2A occupancy. Error bars represent SEM of three biological replicates. (C) ChIP analysis demonstrating that KDM2B depletion causes a reduction in RING1B occupancy at polycomb associated CGIs. Error bars represent SEM of four biological replicates. In all cases ChIP material was analysed by qPCR using primers specific for (i) non-CGI promoters, (ii) gene bodies, (iii) non-PcG target CGIs, (iv) PcG target CGIs, and (v) PcG target CGIs of genes upregulated in KDM2B knockdown cells.
Figure 6—figure supplement 3
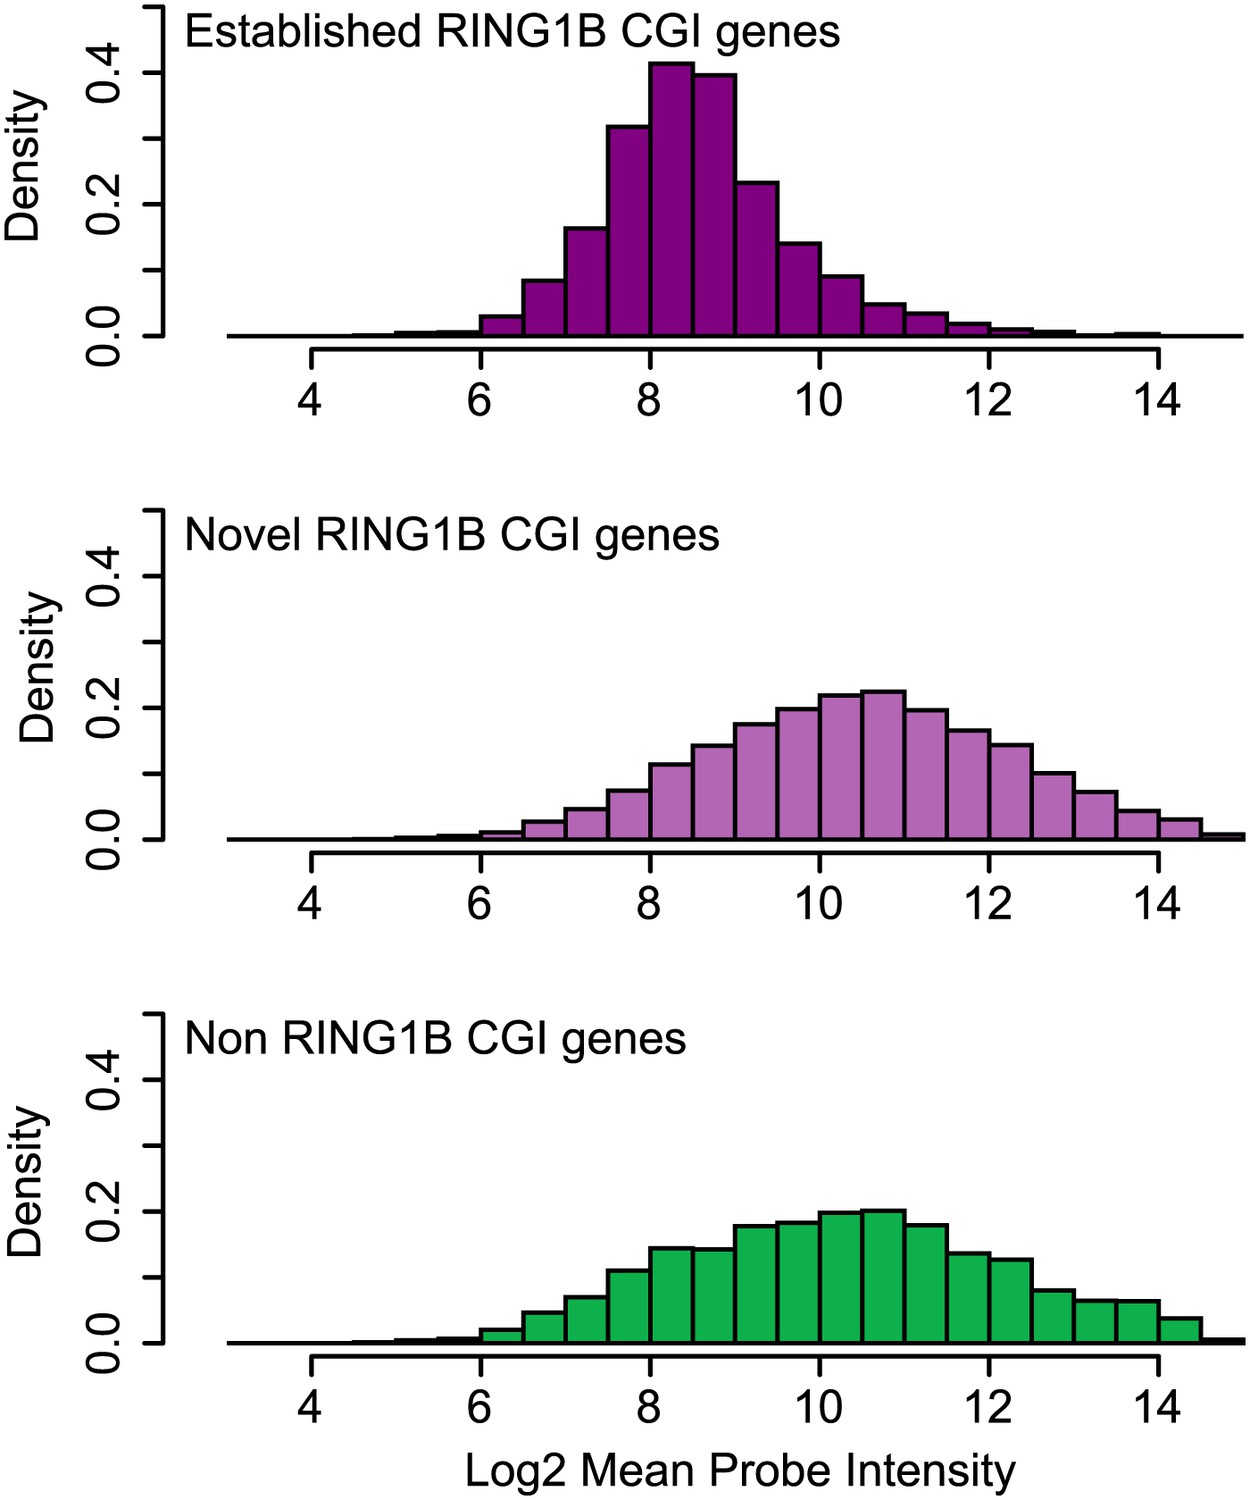
Genes associated with novel RING1B CGIs are on average expressed at higher levels than genes associated with established RING1B CGIs.
Average microarray signal intensity for genes characterized as associated with established RING1B CGIs (top panel), novel RING1B CGIs (middle panel), and non-RING1B associated CGIs (bottom panel). On average, novel RING1B associated CGI associated genes are expressed at similar levels to non-RING1B associated CGI genes (median signal of 10.47 vs 10.24). In contrast, established RING1B associated CGIs are on average expressed at lower levels (median signal of 8.47).
Figure 7 with 3 supplements
Depletion of KDM2B causes a reduction in H2AK119ub1.
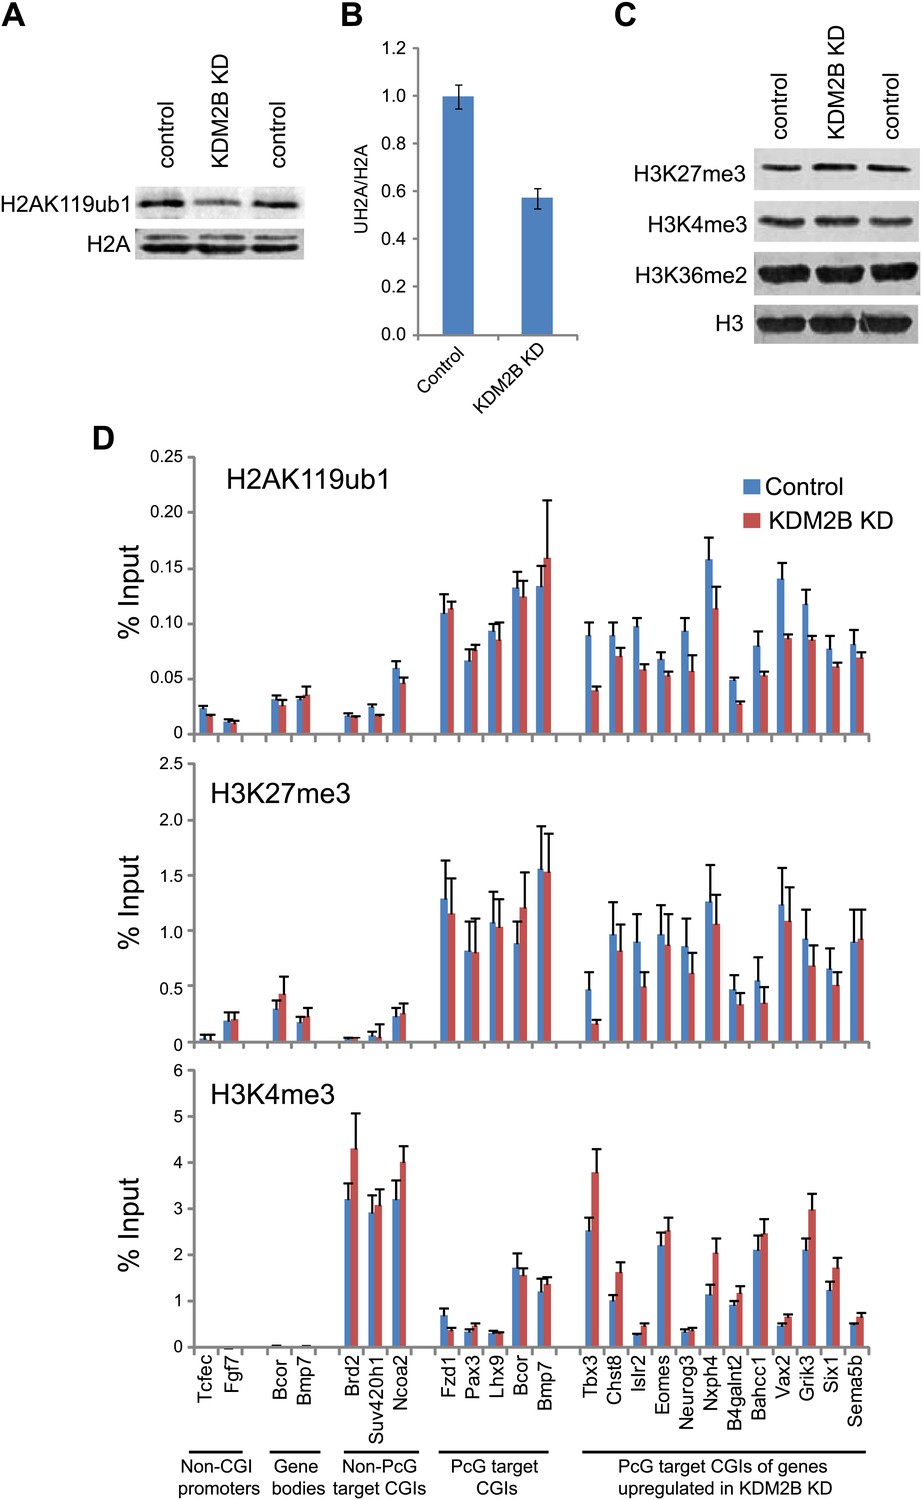
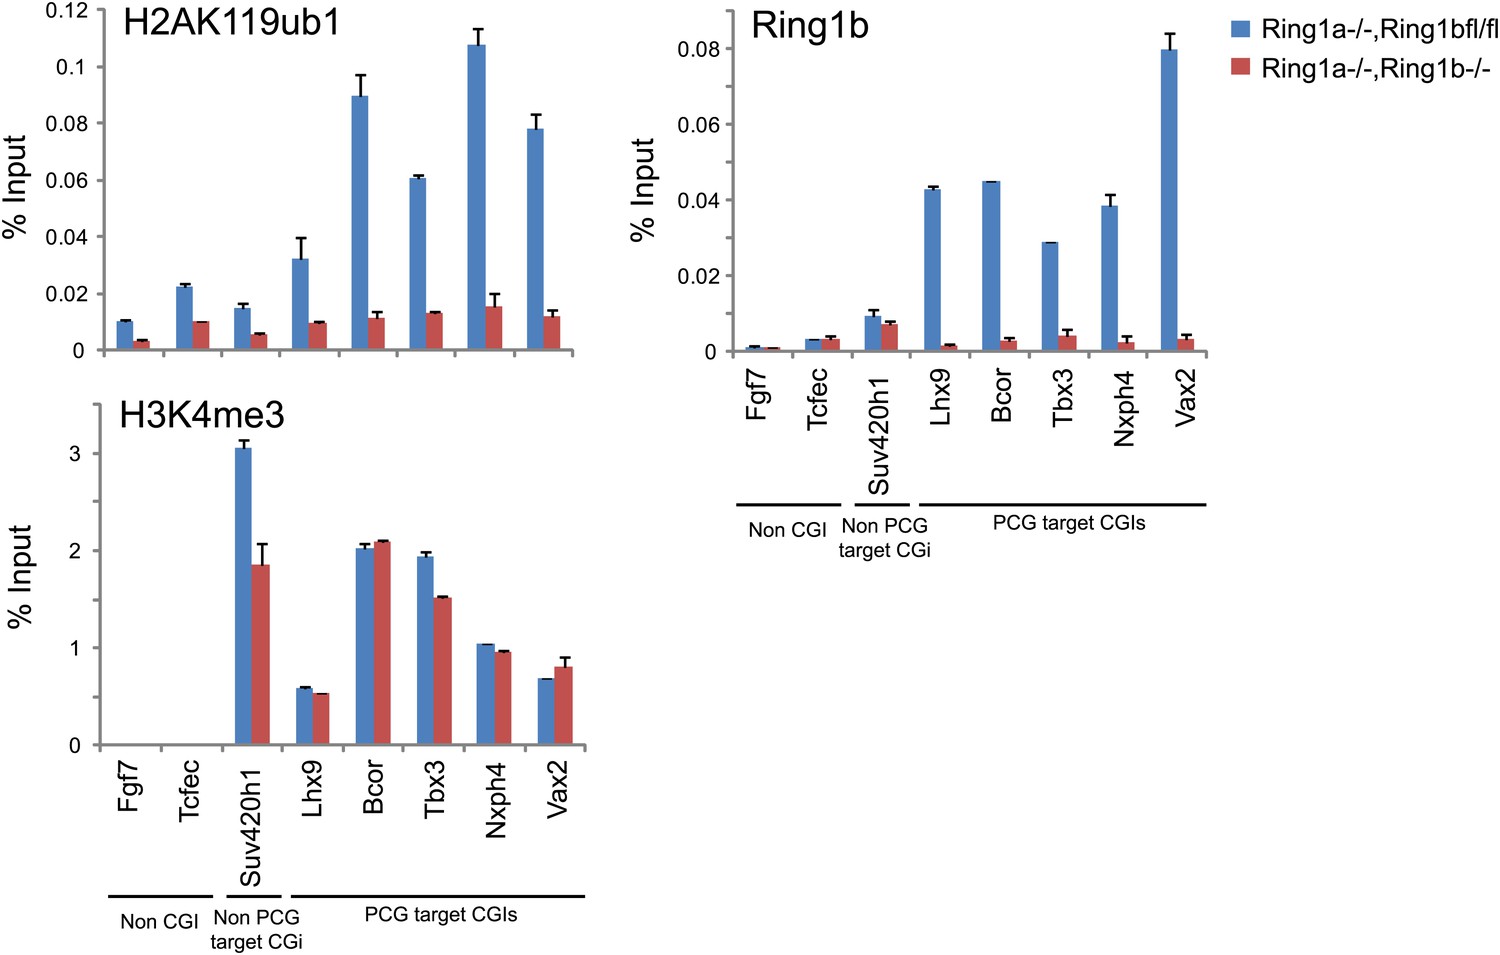
(A) KDM2B knockdown results in a global loss of H2AK119ub1, as demonstrated by western blot for H2AK119ub1 in KDM2B knockdown and control cells. Western blot for total H2A is shown as a loading control. (B) Quantification of H2AK119ub1 levels by fluorescence based quantitative western blotting. The levels of H2AK119ub1 are approximately 40% lower in KDM2B knockdown compared to control cells. The western blot signal for H2AK119ub1 was quantified relative to H2A and the error bars represent the SEM of six biological replicates. (C) KDM2B knockdown does not cause global changes in levels of H3K27me3, H3K4me3 or H3K36me2, as demonstrated by western blot in the KDM2B knockdown and control cells. Western for total Histone H3 is shown as a loading control. (D) KDM2B knockdown cells show locus specific depletion of H2AK119ub1 at genes up-regulated in the KDM2B knockdown cell line. Comparatively there are only small changes in H3K27me3 and H3K4me3 at these same sites. ChIP material was analysed by qPCR using primers specific for (i) non-CGI promoters, (ii) gene bodies, (iii) Non-PcG target CGIs, (iv) PcG target CGIs, and (v) PcG target CGIs of genes up-regulated in KDM2B knockdown cells. Error bars represent the SEM of four biological replicates.
Figure 7—figure supplement 1
Purification of an H2AK119ub1 antibody.
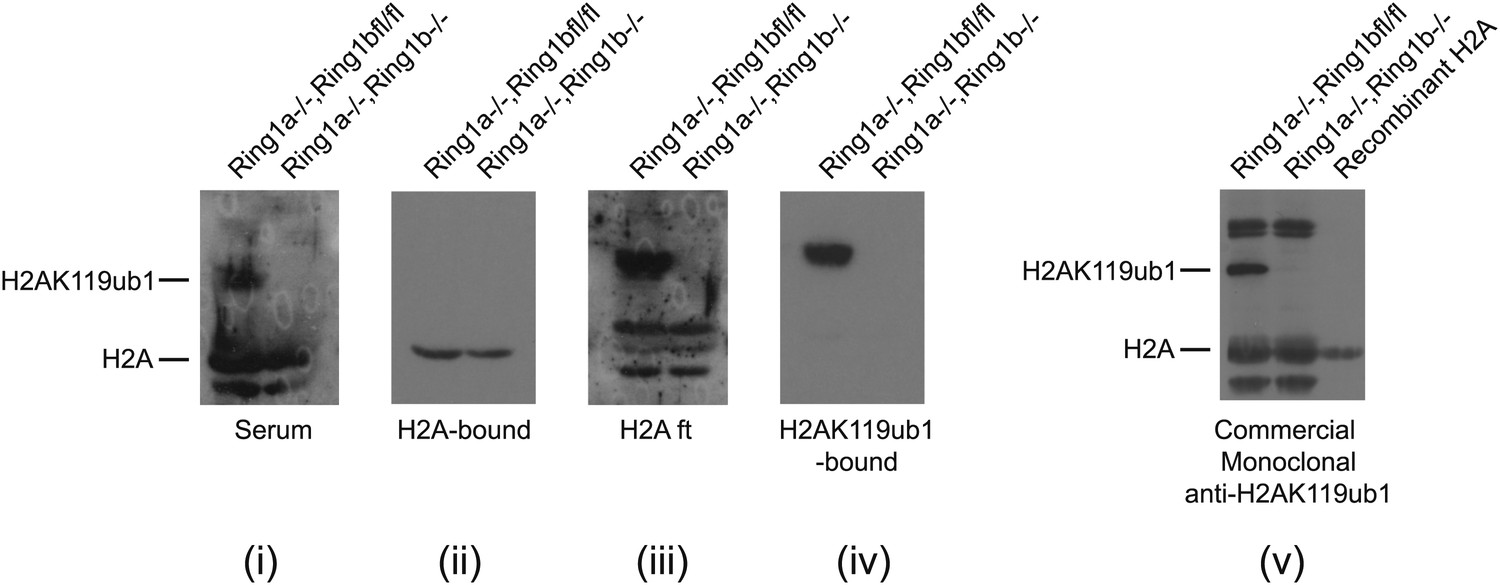
A rabbit was immunized with a synthetic branched peptide containing H2AK119ub1. Serum from the immunized animal was tested against histone extracts from cells that contain a conditional allele of Ring1b that can be deleted by the addition of the drug tamoxifen. Drug treatment removes the RING1B H2AK119 E3 ligase and eliminates H2AK119ub1. In the crude serum from the immunized animal there is a clear H2AK119ub1 signal in the RING1B containing cell line that is lost upon drug treatment (panel i), however there was some cross-reactivity with unmodified H2A. To remove the H2A cross-reactivity the serum was first depleted of H2A reactivity (panel ii) and the flowthrough (panel iii) was then affinity purified on a column containing the H2AK119ub1 antigen (panel iv) yielding a highly specific antibody against H2AK119ub1 when compared to the commercially available H2AK119ub1 monoclonal antibody (panel v).
Figure 7—figure supplement 2
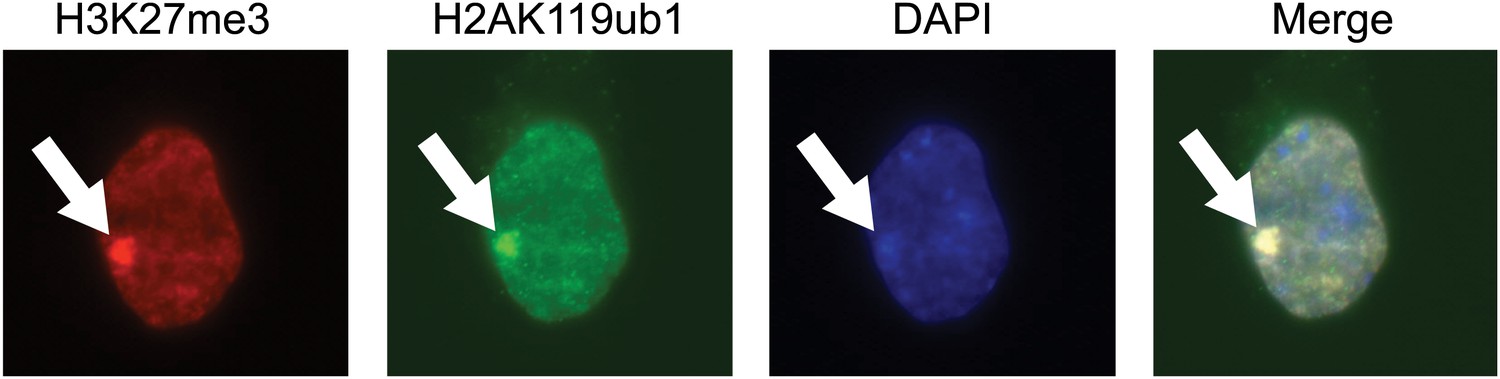
The purified H2AK119ub1 antibody recognizes a Xist inactivated chromosome.
The H2AK119ub1 antibody recognizes native H2AK119ub1 in cells as indicated by specific immunofluorescence staining of a Xist inactivated chromosome in mouse embryonic stem cells. H3K27me3 specific antibodies are used to identify the Xist inactivated chromosome and the merged image shows a clear overlap between H3K27me3 and H2AK119ub1.
Figure 7—figure supplement 3
The purified H2AK119ub1 antibody works in chromatin immunoprecipitation.
The H2AK119ub1 antibody works specifically in chromatin immunoprecipitation as indicated by a loss of H2AK119ub1 ChIP signal following removal of RING1B in the conditional mouse ESCs.
Download links
A two-part list of links to download the article, or parts of the article, in various formats.
Downloads (link to download the article as PDF)
Open citations (links to open the citations from this article in various online reference manager services)
Cite this article (links to download the citations from this article in formats compatible with various reference manager tools)
KDM2B links the Polycomb Repressive Complex 1 (PRC1) to recognition of CpG islands
eLife 1:e00205.
https://doi.org/10.7554/eLife.00205


