Recognition of familiar food activates feeding via an endocrine serotonin signal in Caenorhabditis elegans
- Virginia Commonwealth University, United States
- University of Texas Southwestern Medical Center, United States
- University of Oregon, United States
Figures
Figure 1
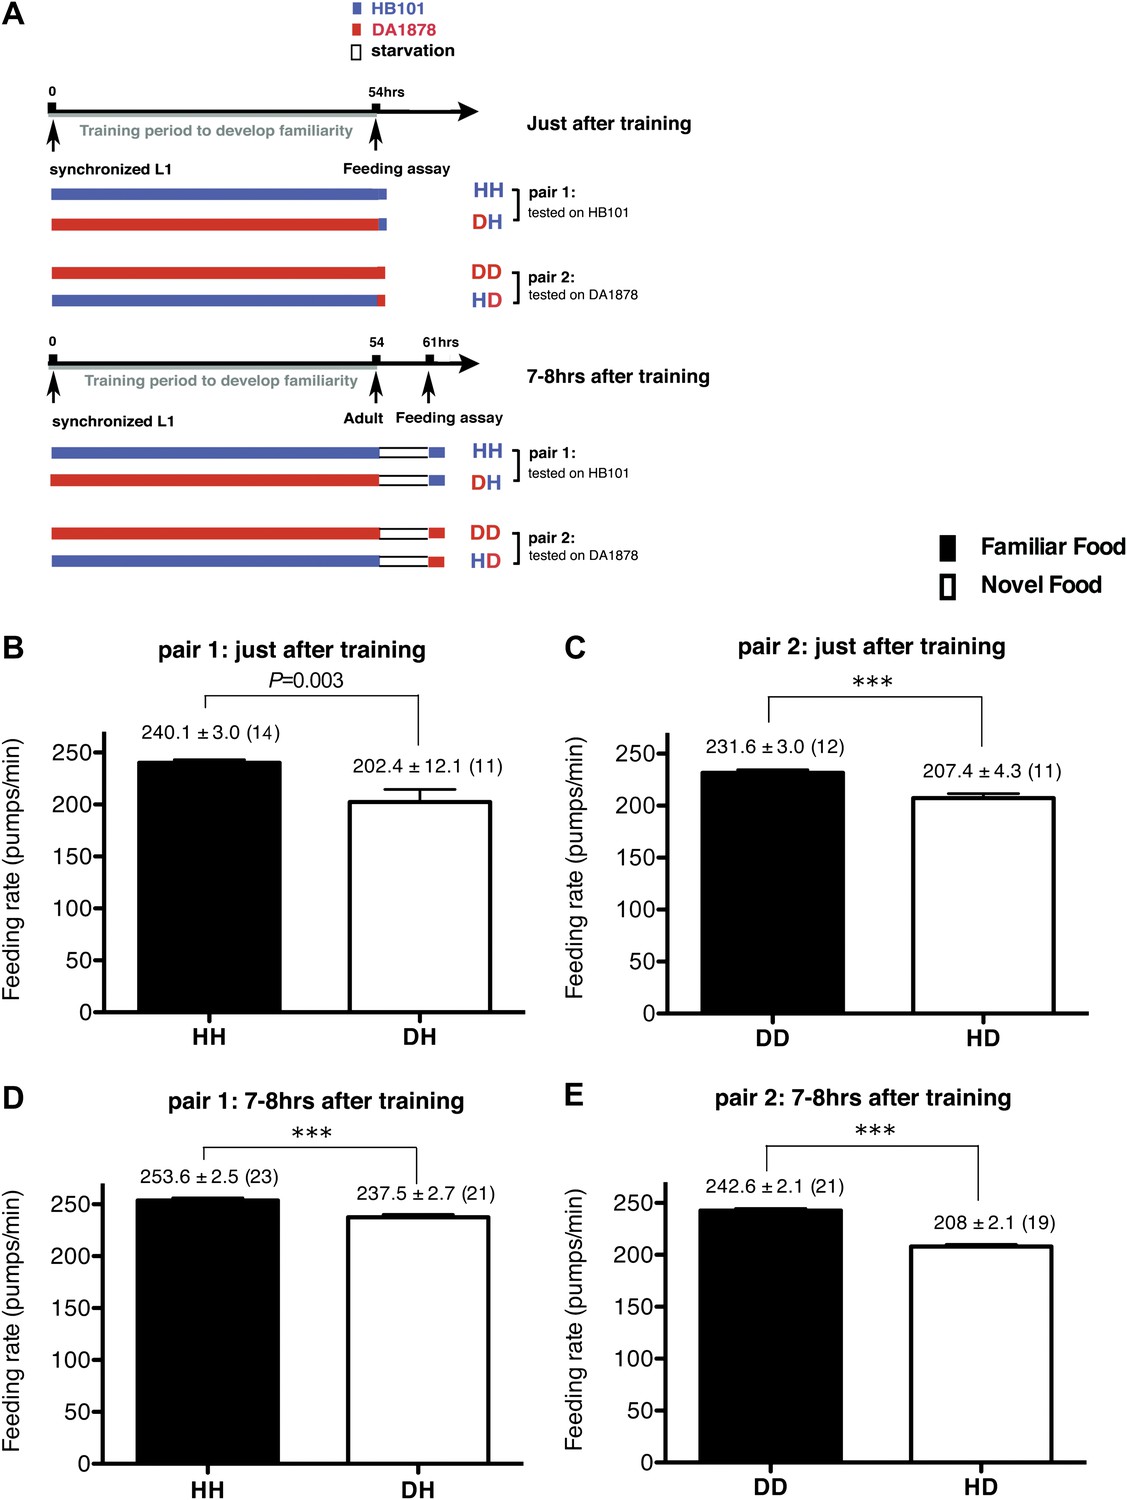
Recognition of familiar food increases feeding response in C. elegans. The memory of familiar food lasts for at least 7 hr.
(A) Experimental design for the feeding assay. The periods during which animals were exposed to HB101, DA1878, and starvation are shown in blue, red, and white, respectively. Each condition is coded by two letters representing the training and test food in order. H and D represent HB101 and DA1878, respectively. (B)–(C) Feeding rates of wild-type worms on HB101 (B) and DA1878 (C) just after training the animals on one or the other bacterium. (D)–(E) Feeding rates of wild-type worms on HB101 (D) and DA1878 (E) after a 7- to 8-hr interval from training the animals on one or the other bacterium. Data shown as mean ± SEM, ***p<0.001, unpaired t-test and Mann–Whitney U test (two-tailed). The number of animals tested (n ≥ 3 independent assays for each group) is shown in parenthesis.
Figure 2
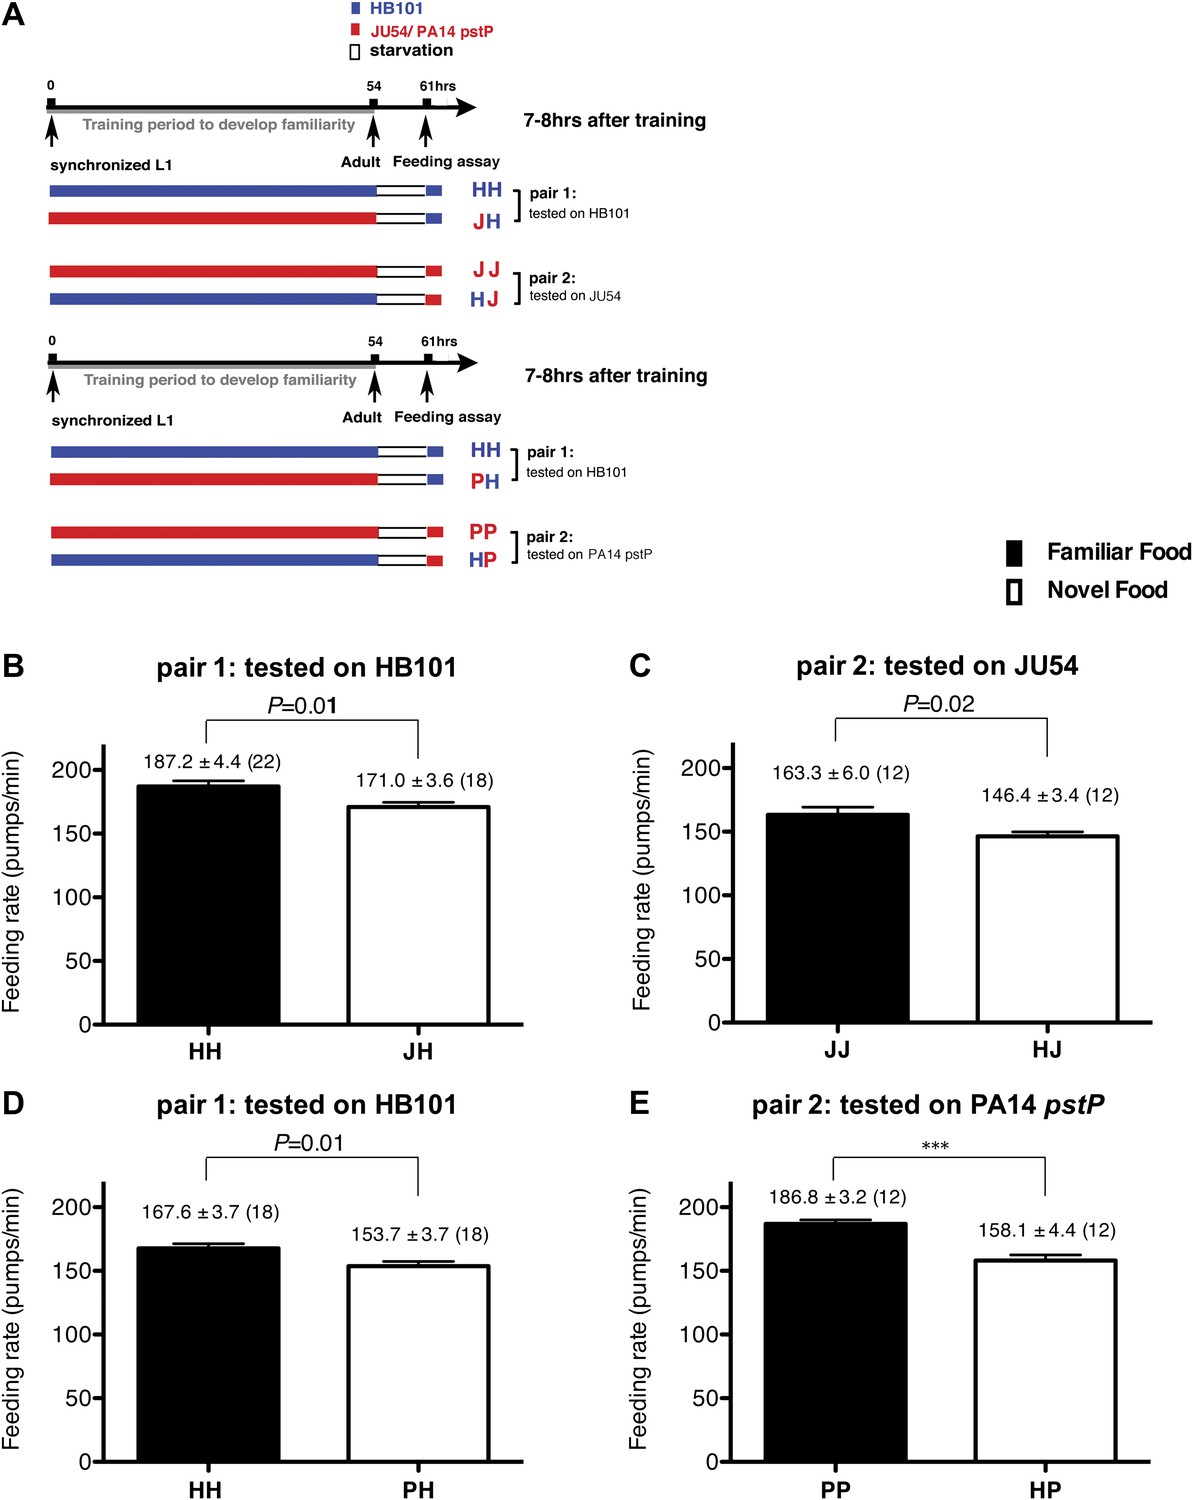
Recognition of familiar food increases feeding response in C. elegans. The memory of familiar food lasts for at least 7 hr.
(A) Experimental design for the feeding assay. The periods during which animals were exposed to HB101, JU54 or PA14 pstP, and starvation are denoted blue, red, and white, respectively. Each condition is coded by two letters representing the training and test foods in order. H, J and P represent HB101, JU54 and PA14 pstP, respectively. (B)–(C) Feeding rates of wild-type worms on HB101 (B) and JU54 (C) after a 7- to 8-hr interval from training the animals on one or the other bacterium. (D)–(E) Feeding rates of wild-type worms on HB101 (D) and PA14 pstP (E) after a 7- to 8-hr interval from training the animals on one or the other bacterium. Data shown as mean ± SEM, ***p<0.001, unpaired t-test and Mann–Whitney U test (two-tailed). The number of animals tested (n ≥ 3 independent assays per each group) is shown in parentheses.
Figure 3
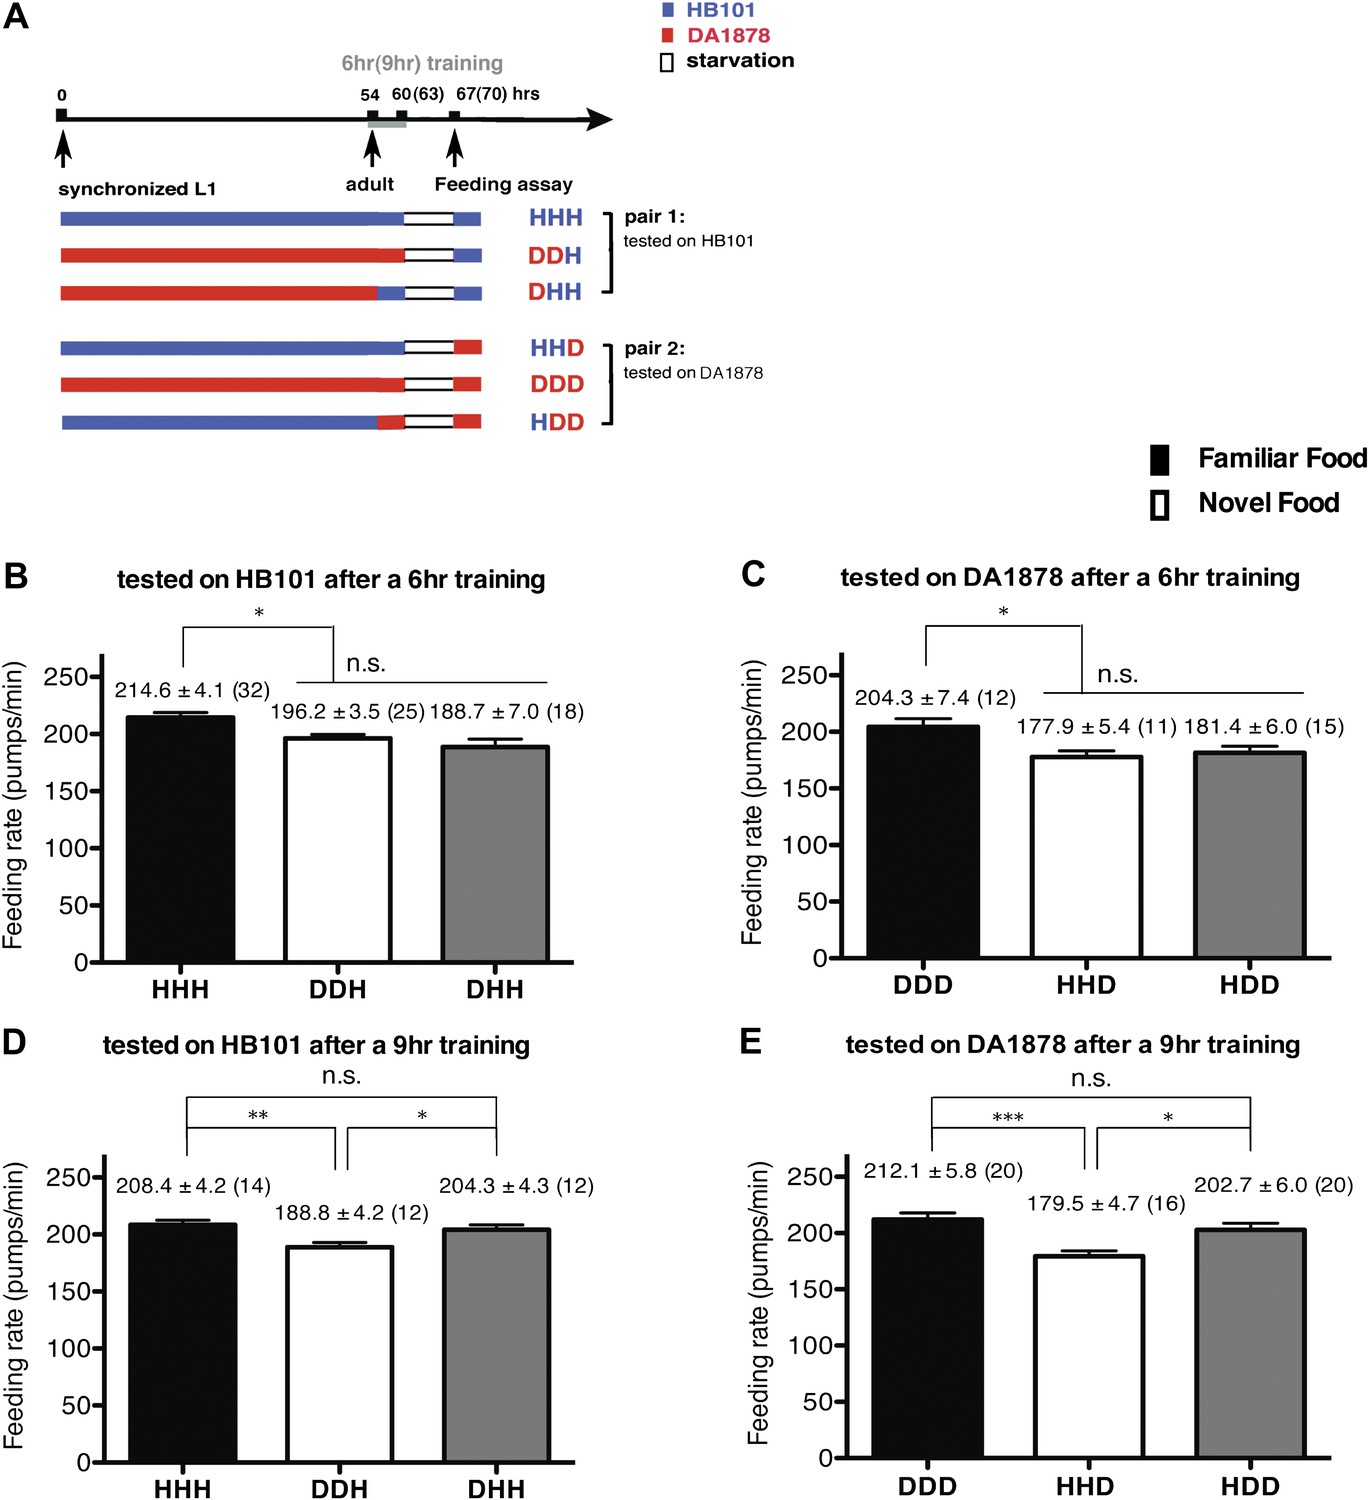
A 9-hr exposure, but not a 6-hr exposure, to particular bacteria during adulthood increases its subsequent consumption.
(A) Experimental design for the feeding assay. Coding is as in Figure 1A. Each condition is coded by three letters representing the cultivation, training and test food in order. (B)–(E) feeding rates of wild-type worms on HB101 (B and D) And DA1878 (C and E) After a 7- to 8-hr interval from training the animals on one or the other bacterium. Data shown as mean ± SEM, n.s., not significant (p≥0.05), *p<0.05, **p<0.01, ***p<0.001, one-way ANOVA, post hoc Tukey test. The number of animals tested (n ≥ 3 independent assays per each group) is shown in parenthesis.
Figure 4

Recognition of familiar food increases feeding response by activating serotonin signaling via SER-7. SER-4 and MOD-1 are putative inhibitory receptors.
(A)–(B) Familiarity of food does not alter the feeding rates in tph-1(mg280). (C)–(D) Exogenous serotonin treatment selectively increases feeding rates of wild type worms on novel food to the level of the worms on familiar food. The average values of the feeding rates presented in (C) are 197.7 ± 4.6, 174.3 ± 5.8, 191.2 ± 4.9 and 190.7 ± 3.4 in order. The average values of the feeding rates presented in (D) are 189.0 ± 7.9, 158.4 ± 9.2, 184.2 ± 3.3 and 181.2 ± 4.6 in order. (E)–(F) ser-7(tm1325) is defective in increasing feeding response to familiar food compared to novel food. Familiarity of food does not alter the feeding rates in ser-4(ok512); mod-1(ok103); ser-7(tm1325). The average values of the feeding rates presented in (E) are 189.7 ± 2.6, 225.5 ± 3.6, 238.3 ± 2.1 and 231.3 ± 3.4 in order. The average values of the feeding rates presented in (F) are 178.8 ± 5.5, 188.4 ± 4.2, 196.3 ± 3.2 and 191.9 ± 3.1 in order. (G) Serotonin controls feeding positively via SER-7 and negatively via SER-4 and MOD-1. The feeding rate of the ser-4; mod-1; ser-7 triple null mutant is not altered by serotonin treatment. These assays were conducted on 3- to 5-hr-old L1 larvae, which pumped much more slowly than the adults used in other measurements. The average values of the feeding rates presented in (G) are 29.1 ± 4.0, 73.6 ± 3.3, 29.8 ± 4.2, 12.2 ± 1.8, 42.7 ± 11.3, 26.3 ± 4.3, 45.9 ± 8.0 and 86.8 ± 11.5 in order. (H) Serotonin signaling via SER-7 that activates the feeding response is more active on familiar food than novel food. The y axis indicates the difference in the feeding rates between wild-type and ser-7(tm1325) animals. Each value corresponds to the difference in the feeding rates between wild-type and the ser-7 null mutant presented in Figure 7A and B. Data shown as mean ± SEM, n.s., not significant (p≥0.05), *p<0.05, **p<0.01, ***p<0.001; for Figure 4A and B, unpaired t-test and Mann–Whitney U test (two-tailed), for Figure 4C–G, one-way ANOVA, post hoc Tukey test and for Figure 4H, Student's t test (two-tailed; see ‘Detailed data analysis’ in ‘Materials and methods’). The number of animals tested (n ≥ 3 independent assays per each group) is shown in parentheses or at the bottom of each bar.
Figure 5
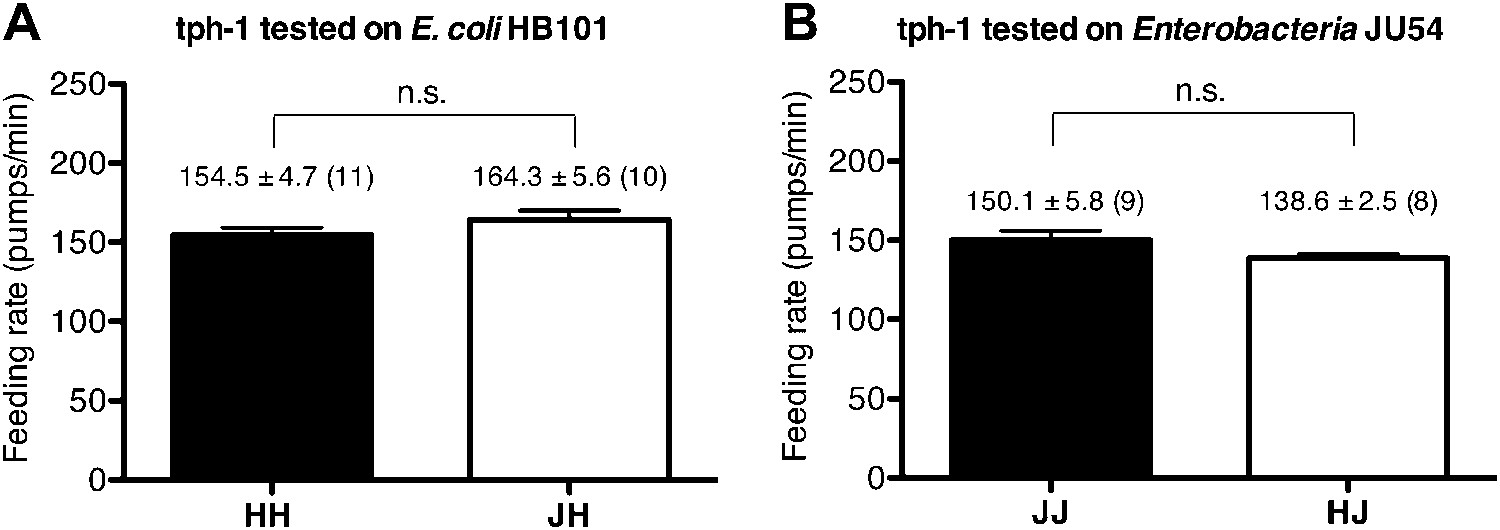
Serotonin is required to increase feeding in response to familiar food.
Feeding rates of tph-1(mg280) on HB101 (A) and JU54 (B) after a 7- to 8-hr interval from training the animals on one or the other bacterium. Data shown as mean ± SEM, n.s., not significant (p≥0.05), unpaired t-test and Mann–Whitney U test (two-tailed). The number of animals tested (n ≥ 3 independent assays per each group) is shown in parentheses.
Figure 6

Feeding rates of wild type and five serotonin receptor null mutants in presence of serotonin.
Among five serotonin receptor null mutants, only ser-7(tm1325) failed to activate feeding in response to serotonin. A null mutation in ser-4 also decreased the feeding rate in presence of serotonin but the effect was relatively small. These assays were conducted on 3- to 5-hr-old L1 larvae, which pumped much more slowly than the adults used in other measurements. The average values of the feeding rates presented in this figure are 73.6 ± 3.3, 63.5 ± 6.2, 52.1 ± 5.4, 82.3 ± 10.5, 12.2 ± 1.8 and 90.9 ± 11.6 in order. *p<0.05, ***p<0.001; one-way ANOVA, post hoc Tukey test. The number of animals tested (n ≥ 2 independent assays per each group) is shown at the bottom of the bar.
Figure 7
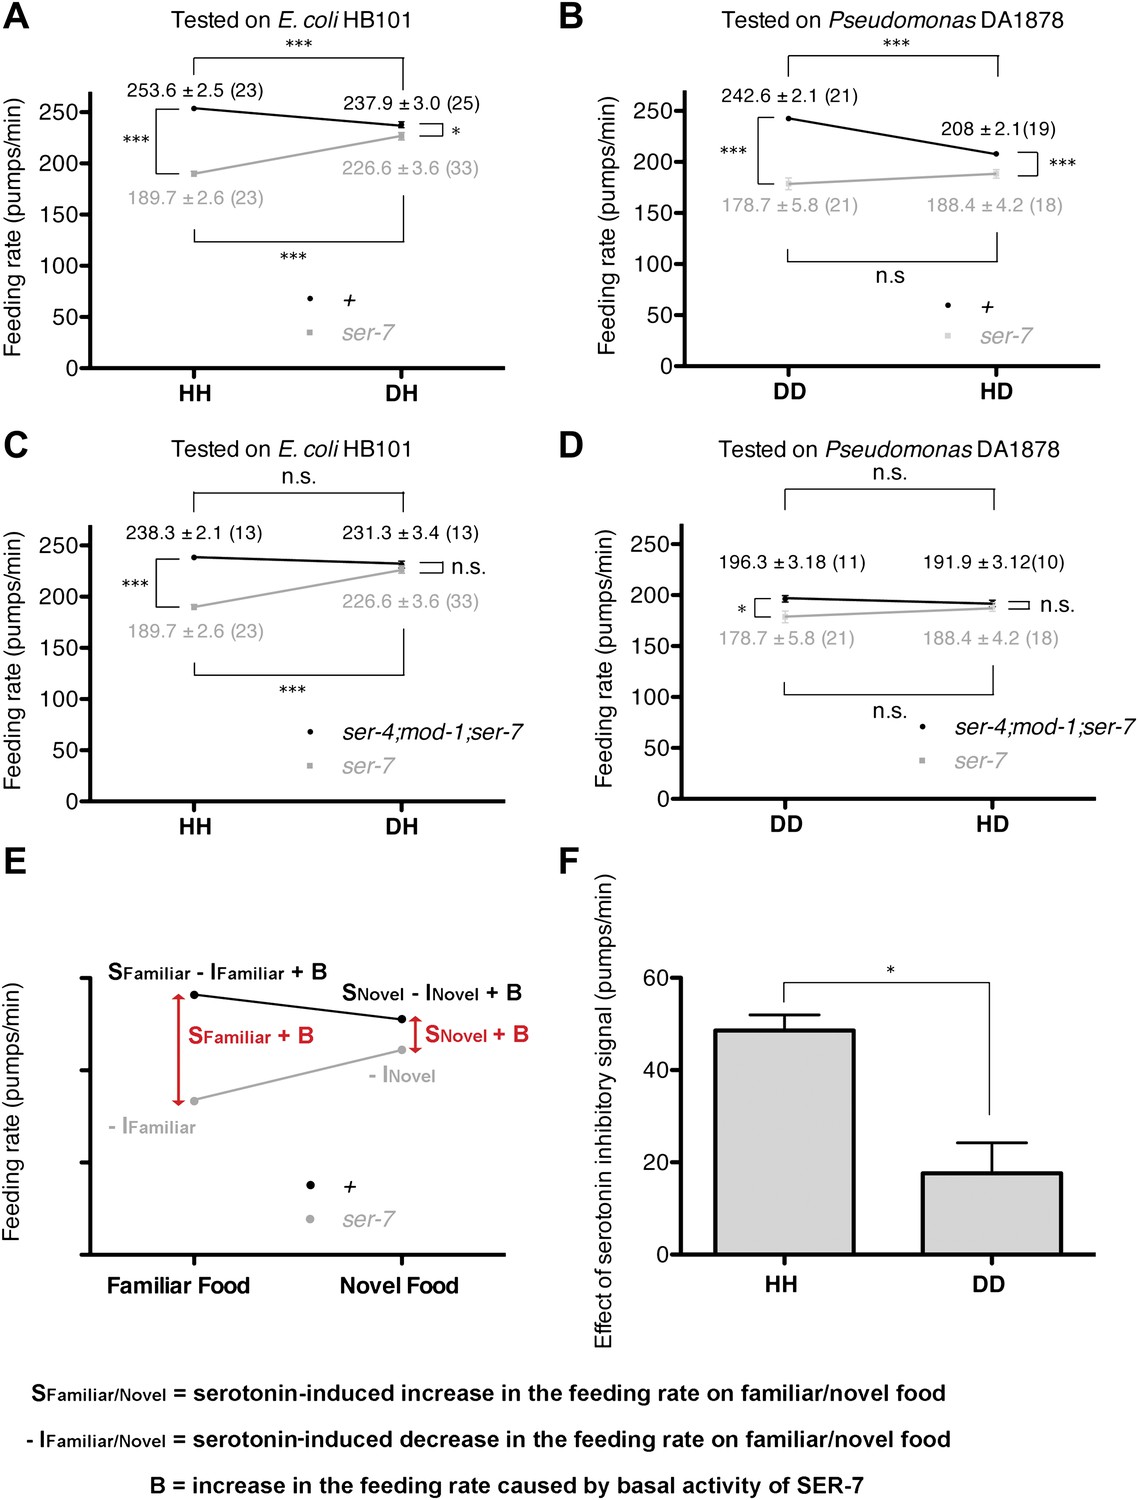
Feeding rates of wild-type, ser-7 single and ser-4; mod-1; ser-7 triple null mutant on HB101 and DA1878 and model of feeding regulation by serotonin.
(A)–(B) Feeding rates of wild-type(+) and ser-7(tm1325) on HB101 (A) and DA1878 (B) after a 7- to 8-hr interval from training the animals on one or the other bacterium. Wild-type worms feed more actively on familiar food than novel food. On novel food the feeding rate of wild-type is slightly higher than that of the ser-7 null mutant. The difference may be due to constitutive activity of SER-7; that is, SER-7 is active to some extent even in absence of its ligand, serotonin (Hobson et al., 2003). (C)–(D) Feeding rates of ser-4(ok512); mod-1(ok103); ser-7(tm1325) and ser-7(tm1325) on HB101 (C) and DA1878 (D) after a 7- to 8-hr interval from training the animals on one or the other bacterium. ser-7(tm1325) is defective in increasing the feeding response to familiar food compared to novel food. Familiarity of food does not alter feeding rates in ser-4(ok512); mod-1(ok103); ser-7(tm1325). Like the positive SER-7-mediated signal, the inhibitory SER-4- and MOD-1-mediated serotonin signaling is more active on familiar food than novel food, but it decreases the feeding rate. (E) A simple linear model explaining how different serotonin receptors might contribute to the regulation of pumping on familiar food and on novel food. There are three effects: B: Basal activity of SER-7, S: Serotonin-stimulated activity of SER-7, and −I: Serotonin-stimulated activity of inhibitory serotonin receptors SER-4 and MOD-1. The net effect of serotonin on wild-type(+) pumping is S + B − I; the net effect on pumping in a mutant lacking SER-7 is −I. While it is presented as an aid to thinking about the results, none of the results presented in the paper depend on this model. Figure 4H, in particular, is a direct measurement of the effect of SER-7 under differing conditions, calculated as the difference in feeding rates between wild-type(+) and the ser-7 null mutant worms. A change in this number suggests the action of serotonin via SER-7. We use this as the measure of serotonin action via SER-7 because it is model-independent and robust. (F) Serotonin signaling via SER-4 and MOD-1 that suppresses the feeding response on familiar food is more active on HB101 than DA1878. The y axis indicates the difference in the feeding rates between ser-4(ok512); mod-1(ok103); ser-7(tm1325) and ser-7(tm1325) animals. Each value corresponds to the difference in the feeding rates between the triple null mutant and the ser-7null mutant presented in (C) and (D). For (A–D) and (F), data shown as mean ± SEM, n.s., not significant (p≥0.05), *p<0.05, ***p<0.001; for (A–D), one-way ANOVA, post hoc Tukey test and for (F), Student's t test. The number of animals tested (n ≥ 3 independent assays per group) is shown in parentheses.
Figure 8

Serotonin from ADF activates feeding in response to familiar food mainly by directly activating SER-7 in MC pharyngeal motor neurons. Active SER-7 in MC (and possibly in M4) acts mainly via cholinergic transmission from MC to the pharyngeal muscles.
(A–B) tph-1 expression in ADF, but not in NSM, restores feeding rate in the tph-1 null mutant. The rescue effect is suppressed by loss of ser-7, but not by loss of mod-5. No difference was found in feeding rates between the tph-1 single null mutant, the ser-7 single null mutant and the tph-1; ser-7 double null mutant. The average values of the feeding rates presented in (A) are 266.1 ± 3.0, 207.7 ± 1.9, 206.6 ± 4.2, 277.2 ± 6.0, 261.1 ± 5.3, 216.4 ± 4.0, 267.3 ± 3.1, 217.5 ± 2.8, 204.1 ± 3.0 and 216.9 ± 1.8 in order. (C–D) ADF-minus animals, but not NSM-minus animals, feed significantly less in response to familiar food. (E) Expression of ser-7 cDNA driven either by the flp-2 promoter or by the flp-21 promoter (MC, M4, and other neurons) but not by the ser-7b promoter (M4 only) fully restored the feeding rate in the ser-7 null mutant in response to serotonin. The rescue effect was suppressed by blocking cholinergic transmission from MC to the pharyngeal muscles. #Pharyngeal pumping rate was lower in the eat-2; ser-7 double null mutant than the eat-2 single null mutant (p<0.001) and the ser-7 single null mutant (p=0.002). The difference suggests that acetylcholine marginally activates pumping in an EAT-2-independent manner and that there is residual acetylcholine release in absence of SER-7 in response to serotonin. No difference in feeding rates was found between the eat-2; ser-7 mutant expressing pflp-21::gfp and the mutant expressing pflp-21::ser-7 cDNA. The average values of the feeding rates presented in (E) are 73.6 ± 3.3, 12.2 ± 1.8, 39.3 ± 7.1, 51.2 ± 8.9, 117.8 ± 13.7, 107.7 ± 10.4, 132.6 ± 10.6, 16.9 ± 3.1, 2.9 ± 1.0, 8.3 ± 4.1 and 15.6 ± 1.4 in order. (F) Expression of ser-7 cDNA driven either by the flp-2 promoter or by the flp-21 promoter fully restored the feeding rate in the ser-7 null mutant in response to familiar food. Expression of ser-7 cDNA in M4 (and occasionally in M2) driven by the ser-7b promoter also increased the feeding rate, but the effect was relatively small. The average values of the feeding rates presented in (F) are 189.7 ± 2.6, 194.9 ± 3.4, 212.0 ± 5.1, 245.1 ± 4.7, 240.7 ± 4.6 and 253.6 ± 2.5 in order. Data shown as mean ± SEM, n.s., not significant (p≥0.05), *p<0.05, ***p<0.001; for (A–B) and (E–F), one-way ANOVA, post hoc Tukey test, for (C–D), unpaired t-test and Mann–Whitney U test (two-tailed). The number of animals tested (n ≥ 3 independent assays per each group) is shown on each bar. ‘0’ and ‘wt’ in this figure indicate absence of transgene and wild type, respectively.
Figure 9
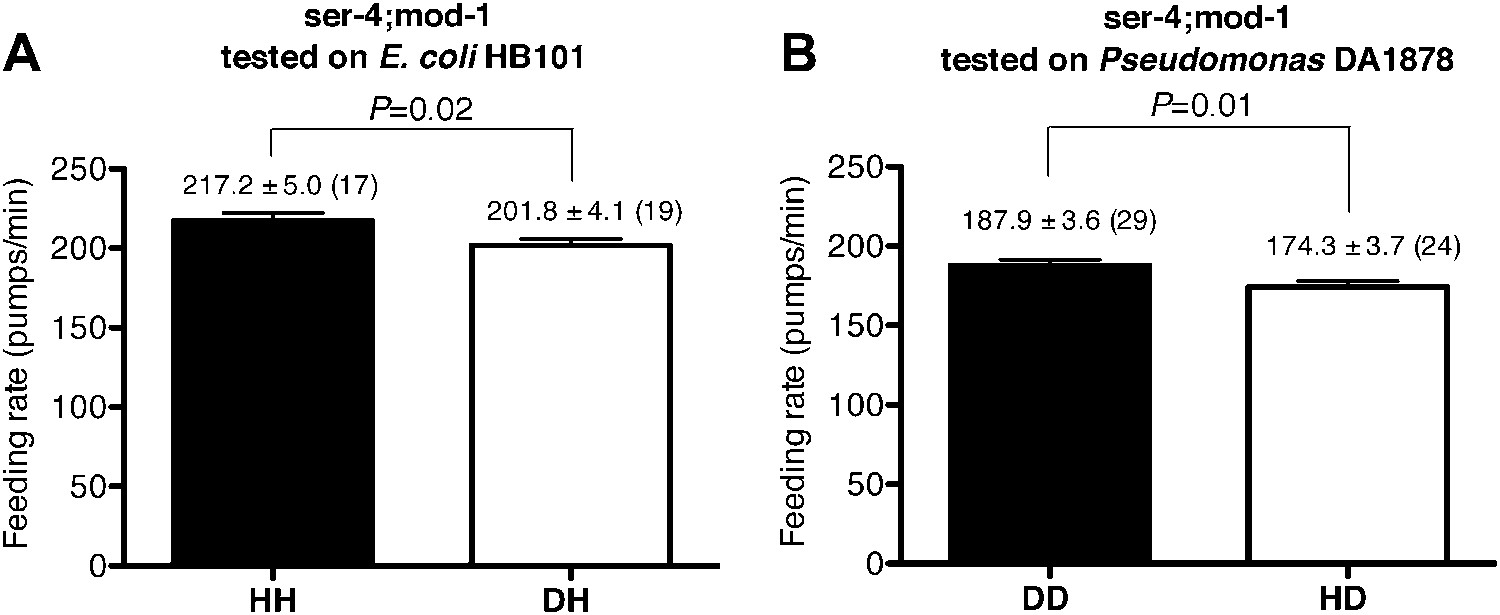
SER-4 and MOD-1 are not essential for discriminating familiar food from novel food.
Feeding rates of ser-4(ok512); mod-1(ok103) on HB101 (A) and DA1878 (B) after a 7- to 8-hr interval from training the animals on one or the other bacterium. Like wild type worms, ser-4(ok512); mod-1(ok103) show increased feeding response on familiar food compared to novel food. Data shown as mean ± SEM, unpaired t-test and Mann–Whitney U test (two-tailed). The number of animals tested (n ≥ 3 independent assays per group) is shown in parentheses.
Figure 10
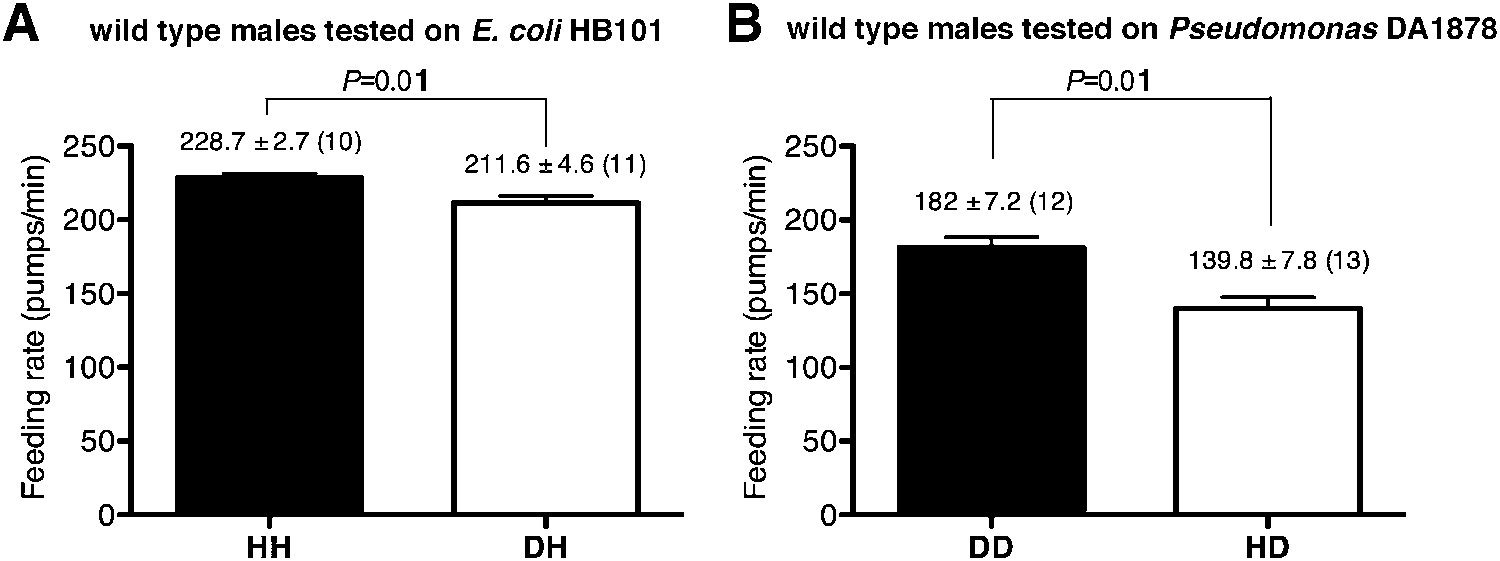
Male worms discriminate familiar food from novel food.
(A–B) Feeding rates of wild-type male worms on HB101 (A) and DA1878 (B) after a 7- to 8-hr interval from training the animals on one or the other bacterium. Data shown as mean ± SEM, unpaired t-test and Mann–Whitney U test (two-tailed). The number of animals tested (n ≥ 3 independent assays per each group) is shown in parentheses above each bar.
Figure 11
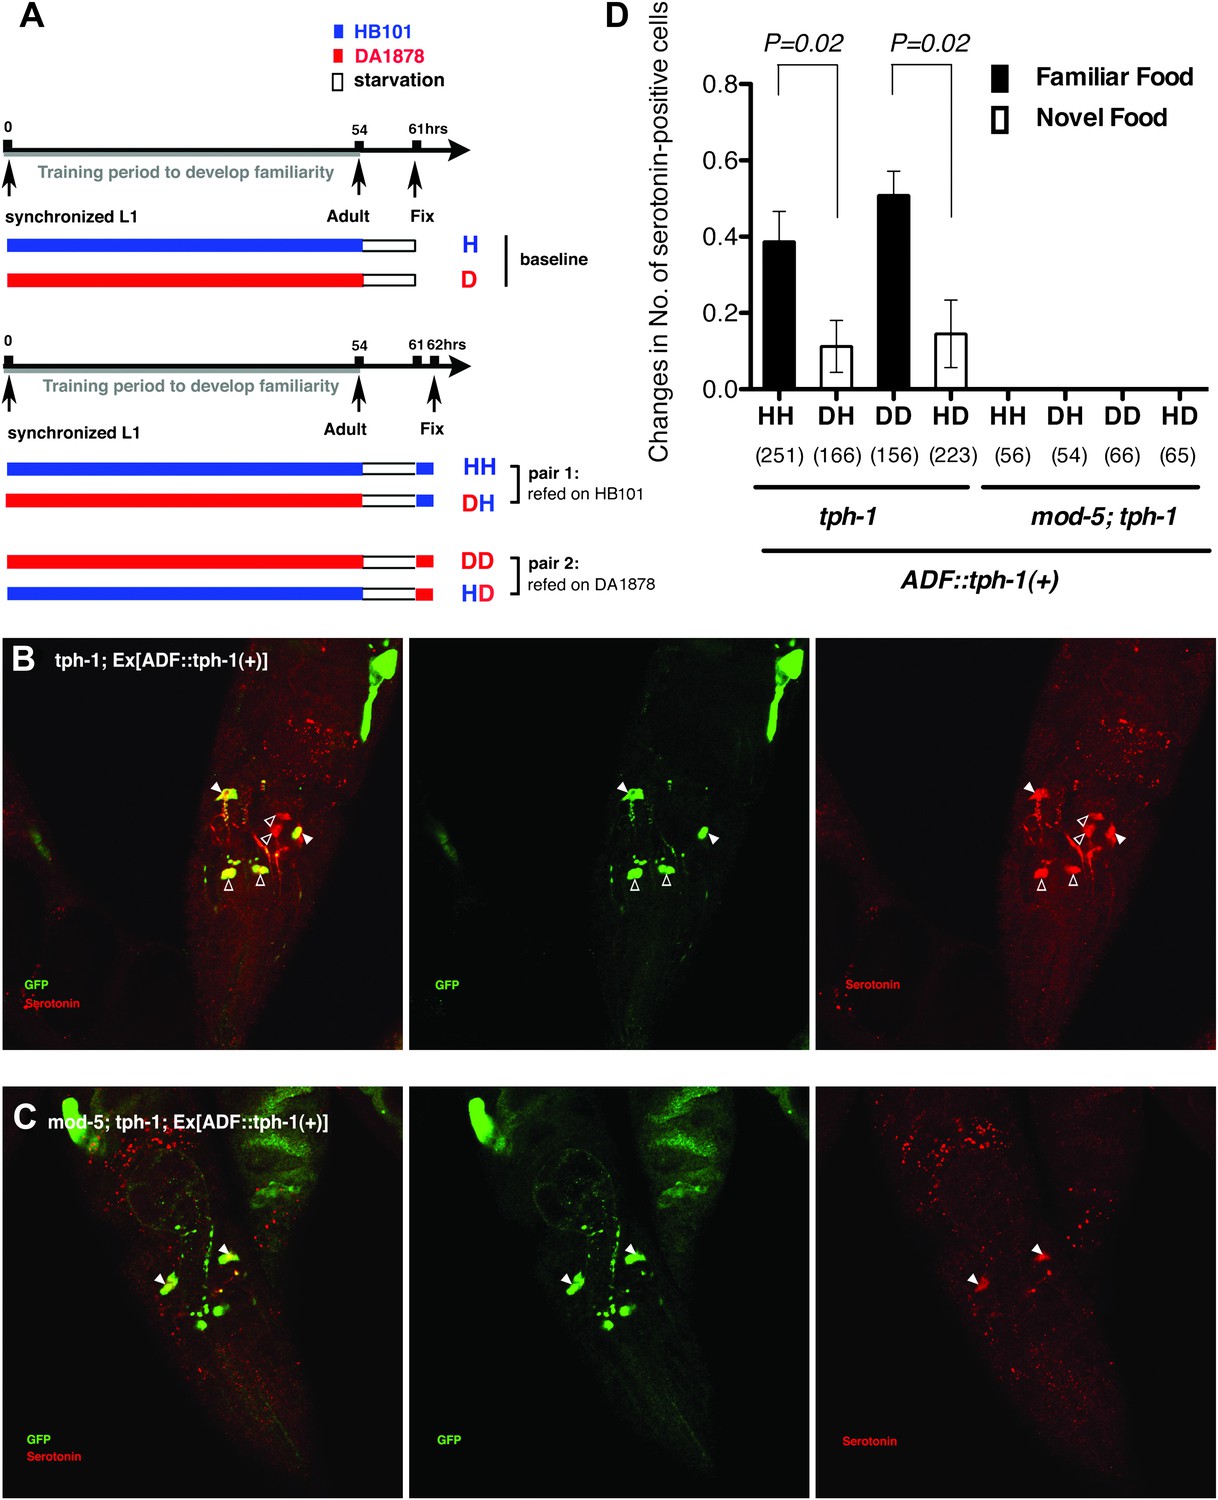
Recognition of familiar food may increase serotonin release from ADF.
(A) Schematic of experimental design for anti-serotonin staining. Coding is as in Figure 1A. (B–C) serotonin immunoreactivity in tph-1; Is[ptph-1::gfp]; Ex[ADF::tph-1(+)::gfp] (B) and in mod-5; tph-1; Is[ptph-1::gfp]; Ex[ADF::tph-1(+)::gfp], the paired control animals defective in serotonin uptake (C). The Is[ptph-1::gfp] allows the identification of NSM and ADF by GFP expression. Filled arrowheads and open arrowheads indicate ADFs and serotonin-uptaking cells, respectively. The serotonin signals not marked by arrowheads are neuronal processes. (D) Increase in the average number of serotonin-positive serotonin-uptaking cells during the 1 hr refeeding on familiar or novel food in tph-1; Is[ptph-1::gfp]; Ex[ADF::tph-1(+)::gfp] and in mod-5; tph-1; Is[ptph-1::gfp]; Ex[ADF::tph-1(+)::gfp] (see ‘Immunohistochemistry’, ‘Quantification of serotonin positive neurons’ and ‘Detailed data analysis’ in ‘Materials and methods’ for details). The baseline for each measurement is the average number of serotonin positive AIMs and RIH after starvation. The baseline was 2.06 ± 0.07 in animals trained on HB101 and 1.99 ± 0.05 in animals trained on DA1878. The number of animals examined (n = 3 independent assays per each group) is shown under each bar. Data shown as mean ± SEM, Student's t test (see ‘Detailed data analysis’ in ‘Materials and methods’).
Figure 12
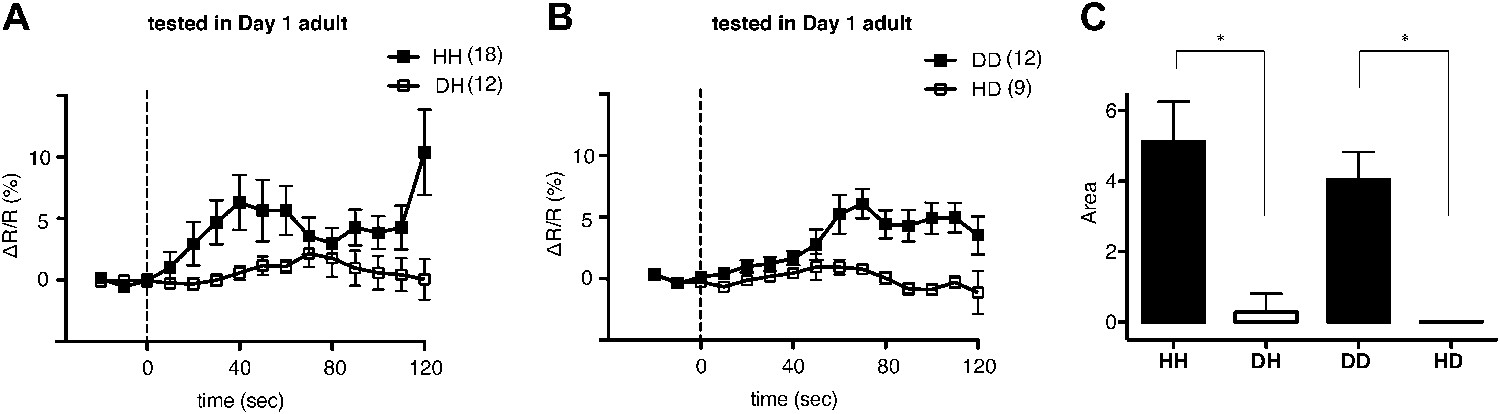
Familiar bacteria, not novel bacteria, activate ADF serotonergic neurons.
(A–B). Average calcium transients in response to familiar (HH and DD groups) or novel (DH and HD groups) food. Traces represent the average percentage change from baseline over time of the fluorescence emission ratio of the ratiometric calcium sensor Cameleon YC3.60. Dashed line at t = 0 represents the time at which the stimulus is delivered. The number of individual recordings is indicated in parenthesis next to each group. (C) Average response to familiar or novel food. The bars represent the average signed area below ΔR/R between t = 0 and t = 120 s. Data shown as mean ± SEM, *p < 0.05; one-way ANOVA, post hoc Tukey test.
Figure 13

Serotonin immunoreactivity in tph-1 single and mod-5; tph-1 double null mutants.
(A–B). No serotonin signal was detected in the tph-1(mg280);Is[ptph-1::gfp] (A) and in the mod-5(n3314);tph-1(mg280);Is[ptph-1::gfp] (B) mutant animals. Filled arrowheads indicate ADFs. The Is[ptph-1::gfp] allows the identification of NSM and ADF by GFP expression.
Figure 14
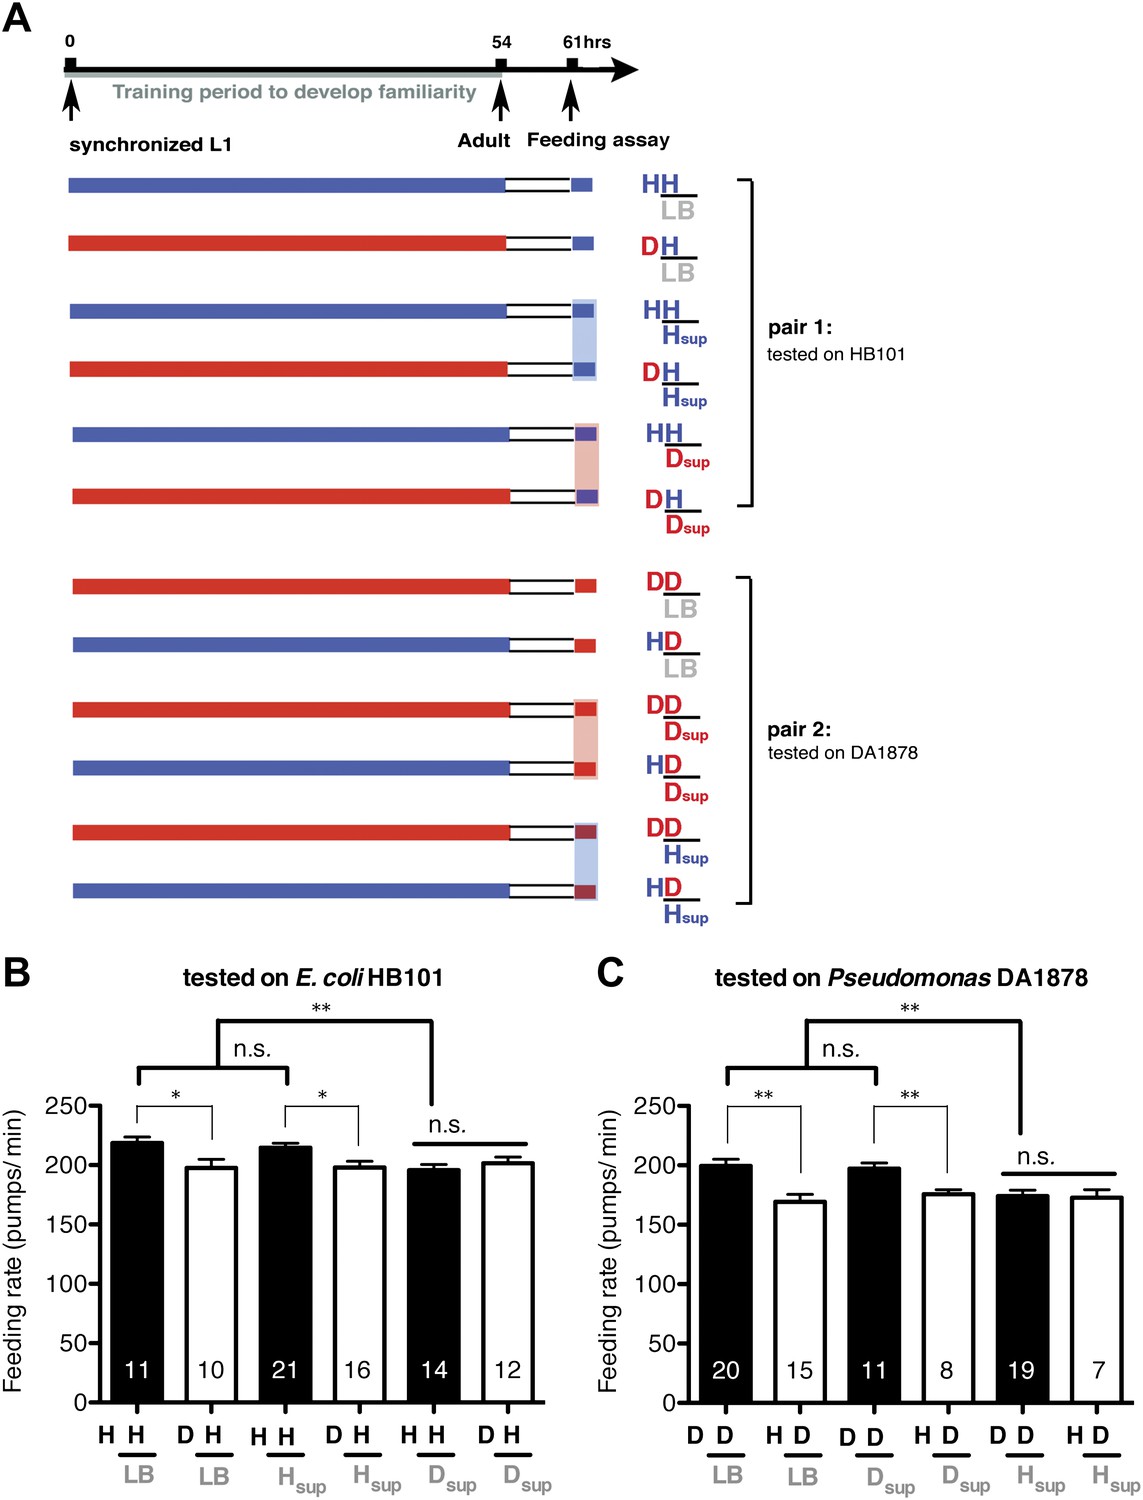
Taste and/or smell of novel bacteria override the stimulatory effect of familiar bacteria on feeding.
(A) Experimental design for the feeding assay. Coding is as in Figure 1A. Each condition is coded by three symbols. The first and the second letter above the bar represent training and test food in order. The third symbol, below the bar, represents the conditioned media that was mixed with the test food. LB, Hsup and Dsup represent LB broth and conditioned media filtered from cultures of HB101 and DA1878, respectively. (B–C) Conditioned media from novel bacteria override the stimulatory effect of familiar bacteria on feeding. The average values of the feeding rates presented in (B) are 218.5 ± 5.0, 197.5 ± 7.3, 214.6 ± 3.9, 197.9 ± 5.4, 195.8 ± 4.7, 201.6 ± 5.2 in order. The average values of the feeding rates presented in (C) are 199.4 ± 5.6, 169.2 ± 6.3, 197.2 ± 4.7, 175.8 ± 3.8, 174.0 ± 5.1 and 172.8 ± 6.7 in order. Data shown as mean ± SEM, n.s., not significant (p≥0.05), *p<0.05, **p<0.01; one-way ANOVA, post hoc Tukey test. The number of animals tested (n ≥ 3 independent assays per each group) is shown on each bar.
Figure 15
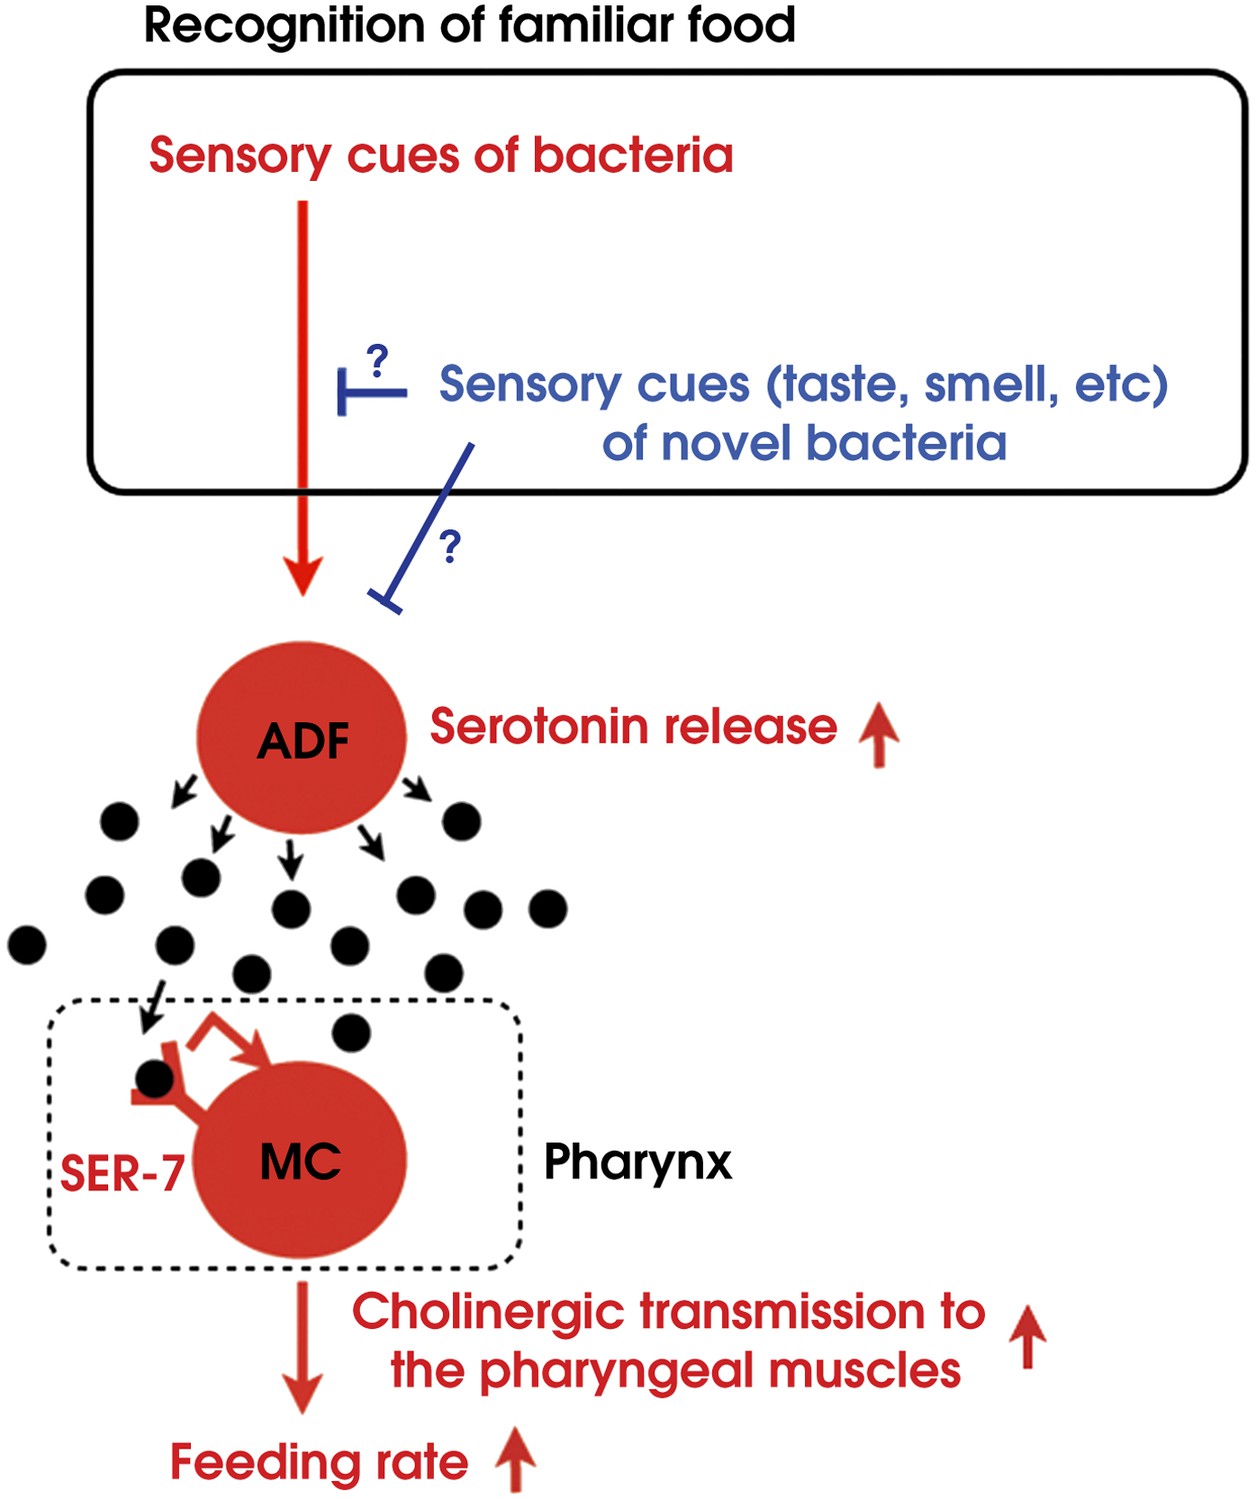
Model of activation of the feeding response by recognition of familiar food in C. elegans.
https://doi.org/10.7554/eLife.00329.017
Figure 16

The schematic of the experimental setup for calcium imaging.
The microfluidic chamber consisted of a T-shaped channel formed in PDMS bonded to a glass coverslip. The main branch of the channel was connected to an inlet and outlet, allowing LB or bacterial solutions to flow through. Switching from LB to the bacterial solutions was achieved via an upstream valve. A smaller branch orthogonal to the first one contained the worm. This tapered channel allowed immobilization of the animal while exposing only the tip of the nose to the flowing LB or bacterial solutions.
Author response image 1
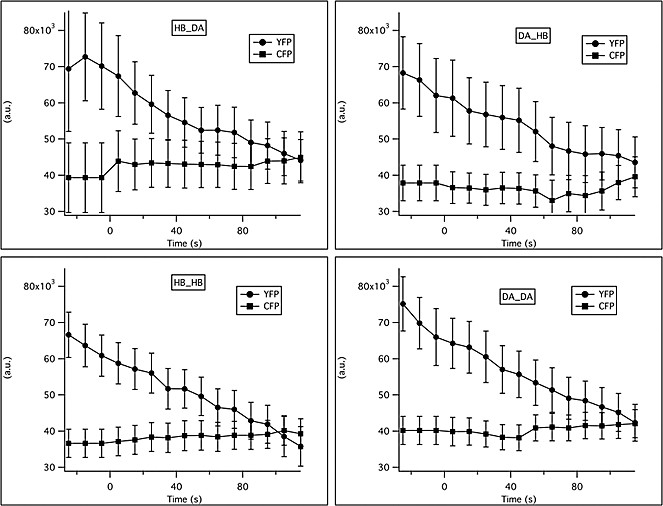
Changes in YFP and CFP intensity in response to familiar or novel food.
The total intensity in the CFP and YFP channels was measured in a region of interest (ROI) surrounding ADF. Background intensity was subtracted from the raw traces. Traces were averaged in 10 s bins and across animals. Solutions were switched from LB broth to novel or familiar bacteria at time t = 0.
Author response image 2
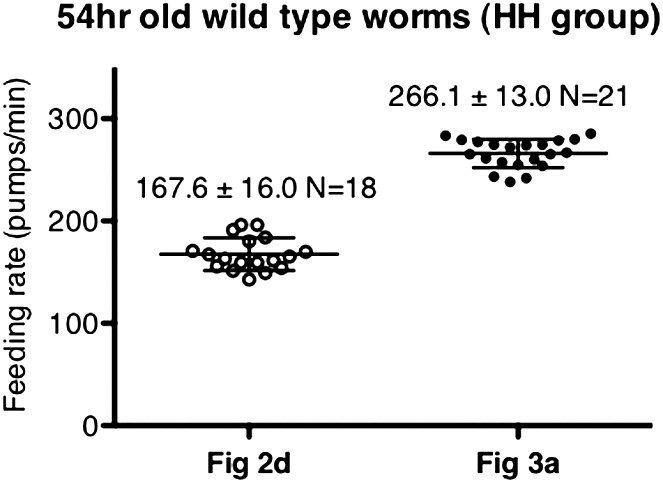
Difference in pumping rates among different datasets was not caused by day-to-day variation.
These datasets were chosen as an example due to their difference in values. Data shown as mean ± SD.
Author response image 3
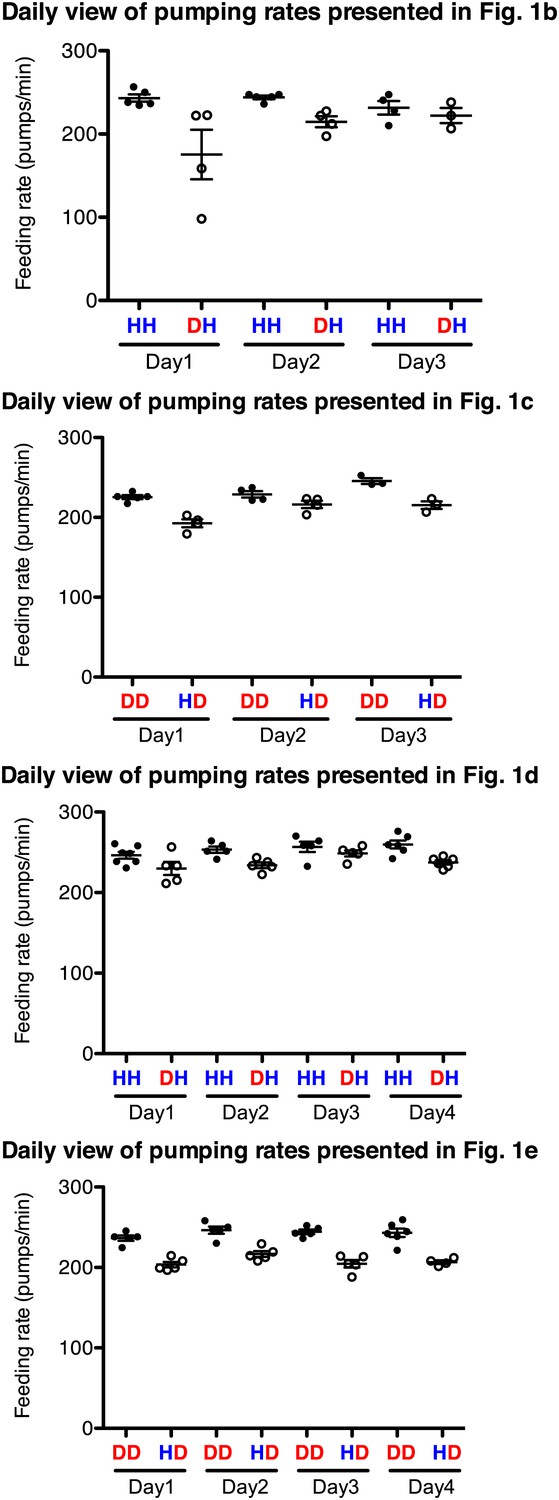
Familiar food effect of stimulating pumping is consistently observed throughout the 3–4 independent assays for each comparison.
Datasets for Figure 1 were chosen as an example. HH and DD are familiar food groups (filled circle) and DH and HD are novel food groups (open circle). HH and DH groups, and DD and HD groups that were tested each day were prepared side by side and the feeding assays were performed blindly using the same reagents. Each circle indicates an average value of 3 measured pumping rates of each worm.
Download links
A two-part list of links to download the article, or parts of the article, in various formats.
Downloads (link to download the article as PDF)
Open citations (links to open the citations from this article in various online reference manager services)
Cite this article (links to download the citations from this article in formats compatible with various reference manager tools)
Recognition of familiar food activates feeding via an endocrine serotonin signal in Caenorhabditis elegans
eLife 2:e00329.
https://doi.org/10.7554/eLife.00329


