Plants regenerated from tissue culture contain stable epigenome changes in rice
- University of California, Los Angeles, United States
- Ohio State University, United States
- Delaware Biotechnology Institute, University of Delaware, United States
- Howard Hughes Medical Institute, University of California, Los Angeles, United States
Figures
Figure 1

Aberrant loss of DNA methylation in regenerated rice.
(A) Genome browser views of fractional CG methylation levels. Sample numbers correspond to those listed in Table 1. Regenerated samples of the same line are grouped together in red boxes. (B) Genome coverage of identified CG hypermethylation and hypomethylation DMRs. DMRs were defined relative to sample 1 (wild type). (C) Distribution of sizes of CG hypomethylation DMRs in regenerated plants. (D) Heat map representation of hierarchical clustering based on CG methylation levels within DMRs. Rows represent all 3610 CG-DMRs identified and columns represent the samples. (E) Overlap of CG-DMRs between samples. The bottom triangle represents the percent overlap of elements listed in the x-axis with those listed in the y-axis. The upper triangle on the other hand represents the percent overlap of elements listed in the y-axis with those listed in the x-axis.
-
Figure 1—source data 1
List of CG, CHG, CHH DMRs identified in this study.
Defined hypomethylation DMRs for each sample are listed.
- https://doi.org/10.7554/eLife.00354.005
Figure 2
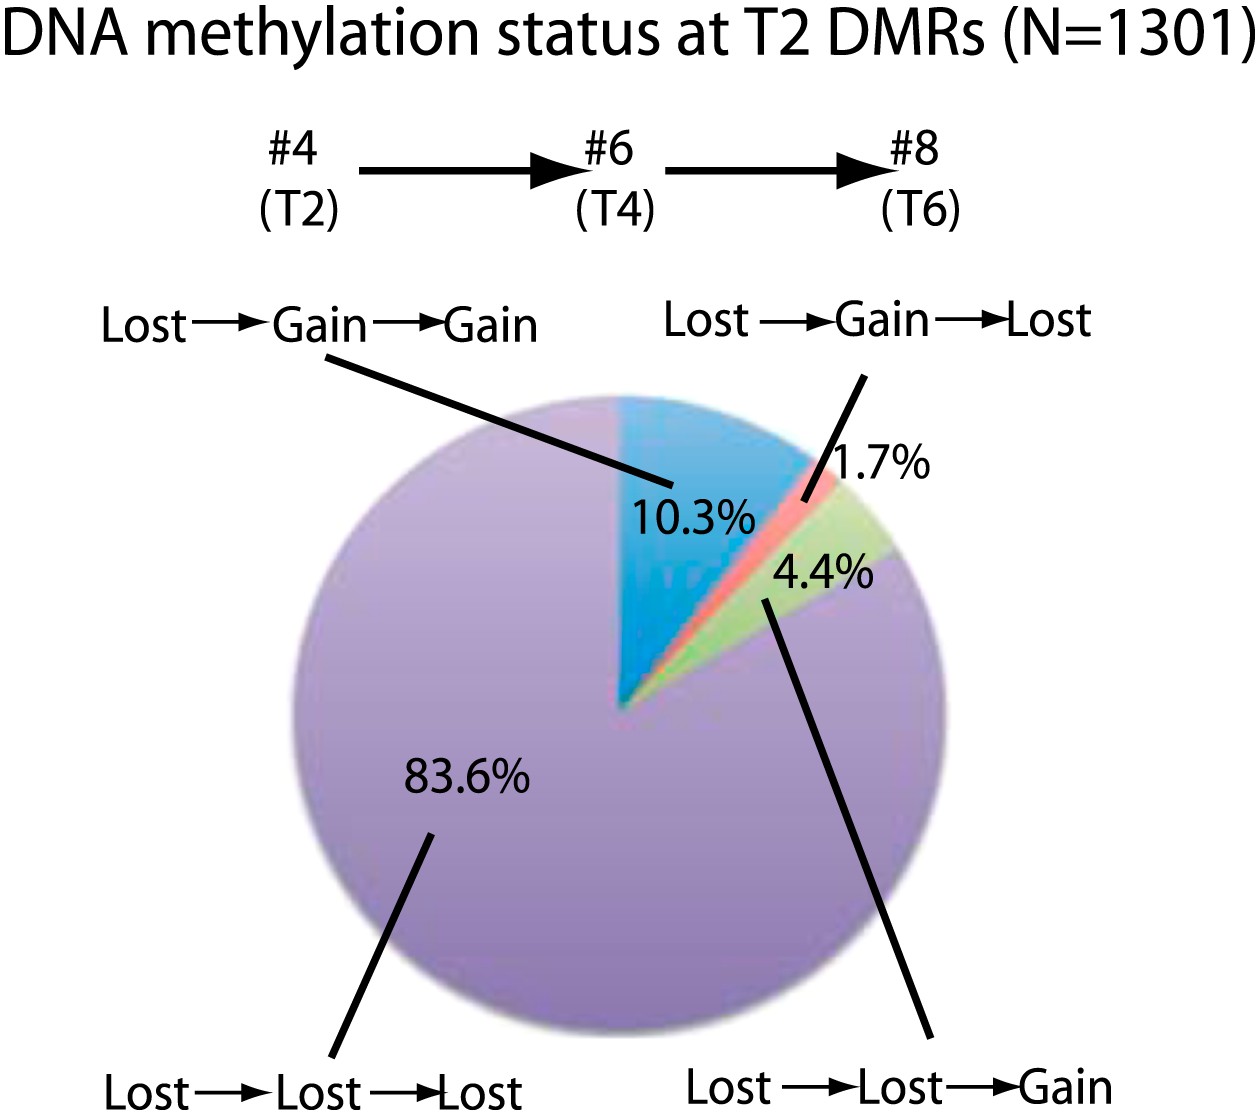
Stability of loss of DNA methylation over generations.
Methylation status of sample 4 (T2) DMRs in T4 and T6 generations are indicated. Loss: less than half of respective wild-type CG methylation levels. Gain: more than half of respective wild-type CG methylation levels.
Figure 3

Loss of DNA methylation occurs in all three cytosine contexts.
(A) Average distributions of DNA methylation in wild type (faded) and regenerated plants (solid) were plotted over defined CG hypomethylation DMRs in the indicated samples. Flanking regions are the same lengths as the middle region. (B) Heat map of DNA methylation levels within all defined hypomethylation DMRs (CG + CHG + CHH). (C) Average distribution of smRNA-seq reads in wild type (black) and regenerated plants (red) over defined CHH hypomethylation DMRs in indicated samples. Flanking regions are the same lengths as the middle region.
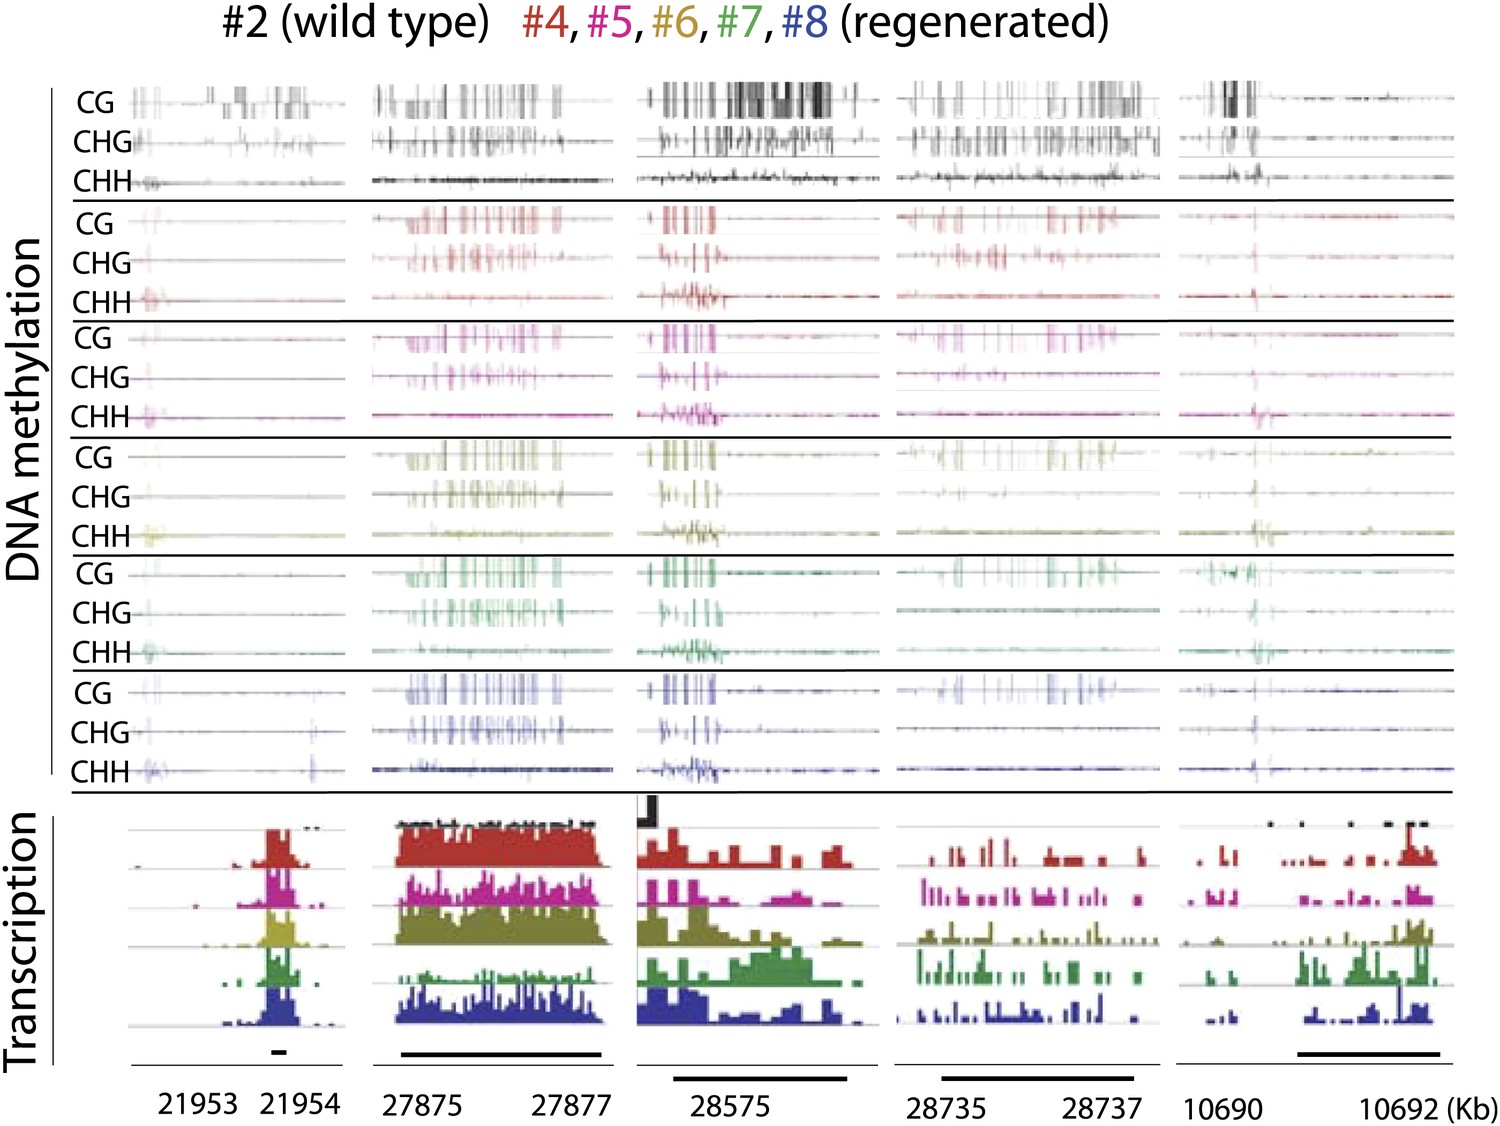
Figure 4 with 4 supplements

Loss of DNA methylation at promoters may impact gene expression.
(A) Overlap of hypomethylation DMRs with indicated genomic elements. Observed overlap (dark bars) is compared to randomized regions of similar number and size distribution as the DMRs (light bars). Gene body: transcribed region of protein coding genes. Gene promoter: TSS to 2 kb upstream of TSS. 3' downstream of gene TTS (transcription termination site): TTS to 2 kb downstream of TTS. CDS: Coding sequence. TE: Transposable element. Error bars represent standard deviation. *Significant enrichment, p<0.01. (B) Percentages of genes with CG hypomethylation DMRs near TSSs that have significantly altered expression levels (fourfold up/down regulation, FDR<0.01). Genes with zero mRNA-seq reads in both wild type and regenerated samples were removed from the analyses. An average of 11.3 genes were deregulated. (C) Genome browser views of DNA methylation and gene expression levels.
-
Figure 4—source data 1
List of genes with CG hypomethylation DMRs at promoters and their expression levels.
Genes with CG hypomethylation DMRs at the promoter regions (TSS minus 2 kb to TSS) in samples 4–10 along with their normalized expression levels are listed. Also indicated are whether they were significantly up- or down-regulated based on fourfold and FDR < 0.01 cutoffs. Descriptions of genes were directly taken from the rice genome annotation project website (http://rice.plantbiology.msu.edu/).
- https://doi.org/10.7554/eLife.00354.010
Figure 4—figure supplement 1
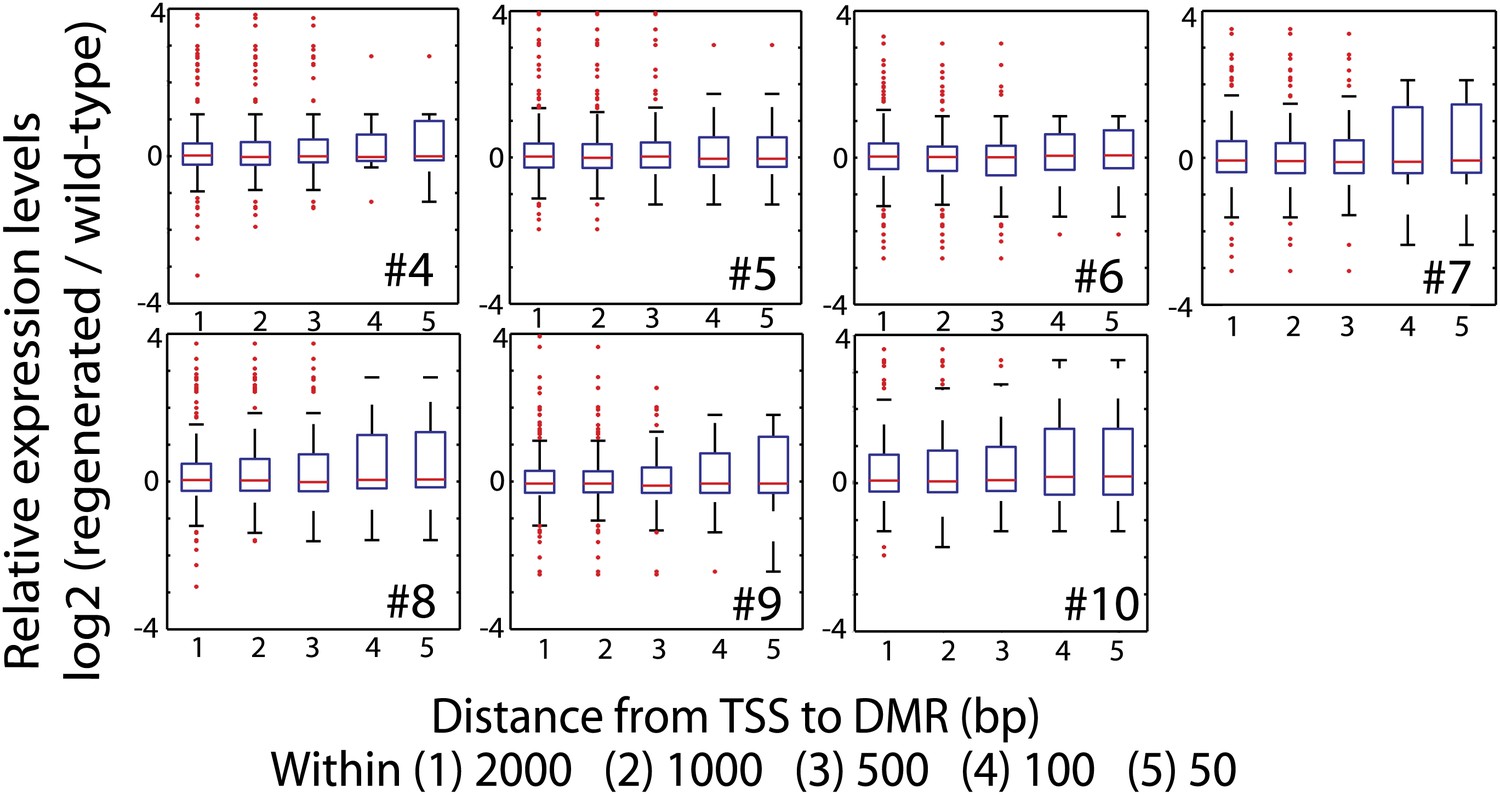
Impact of loss of DNA methylation at promoters on gene expression.
Relative expression levels of genes with CG hypomethylation DMRs near TSS. Log2 ratios between RPKM values of indicated regenerated lines and wild type (sample 2) were calculated, and data is represented as boxplots. Genes with zero mRNA-seq reads in both wild type and regenerated samples were removed from the analyses. Red lines, median; edges of boxes, 25th (bottom) and 75th (top) percentiles; error bars, minimum and maximum points within 1.5 × IQR (Interquartile range); red dots, outliers.
Figure 4—figure supplement 2
Genome browser views of DNA methylation and gene expression levels.
https://doi.org/10.7554/eLife.00354.012
Figure 4—figure supplement 3
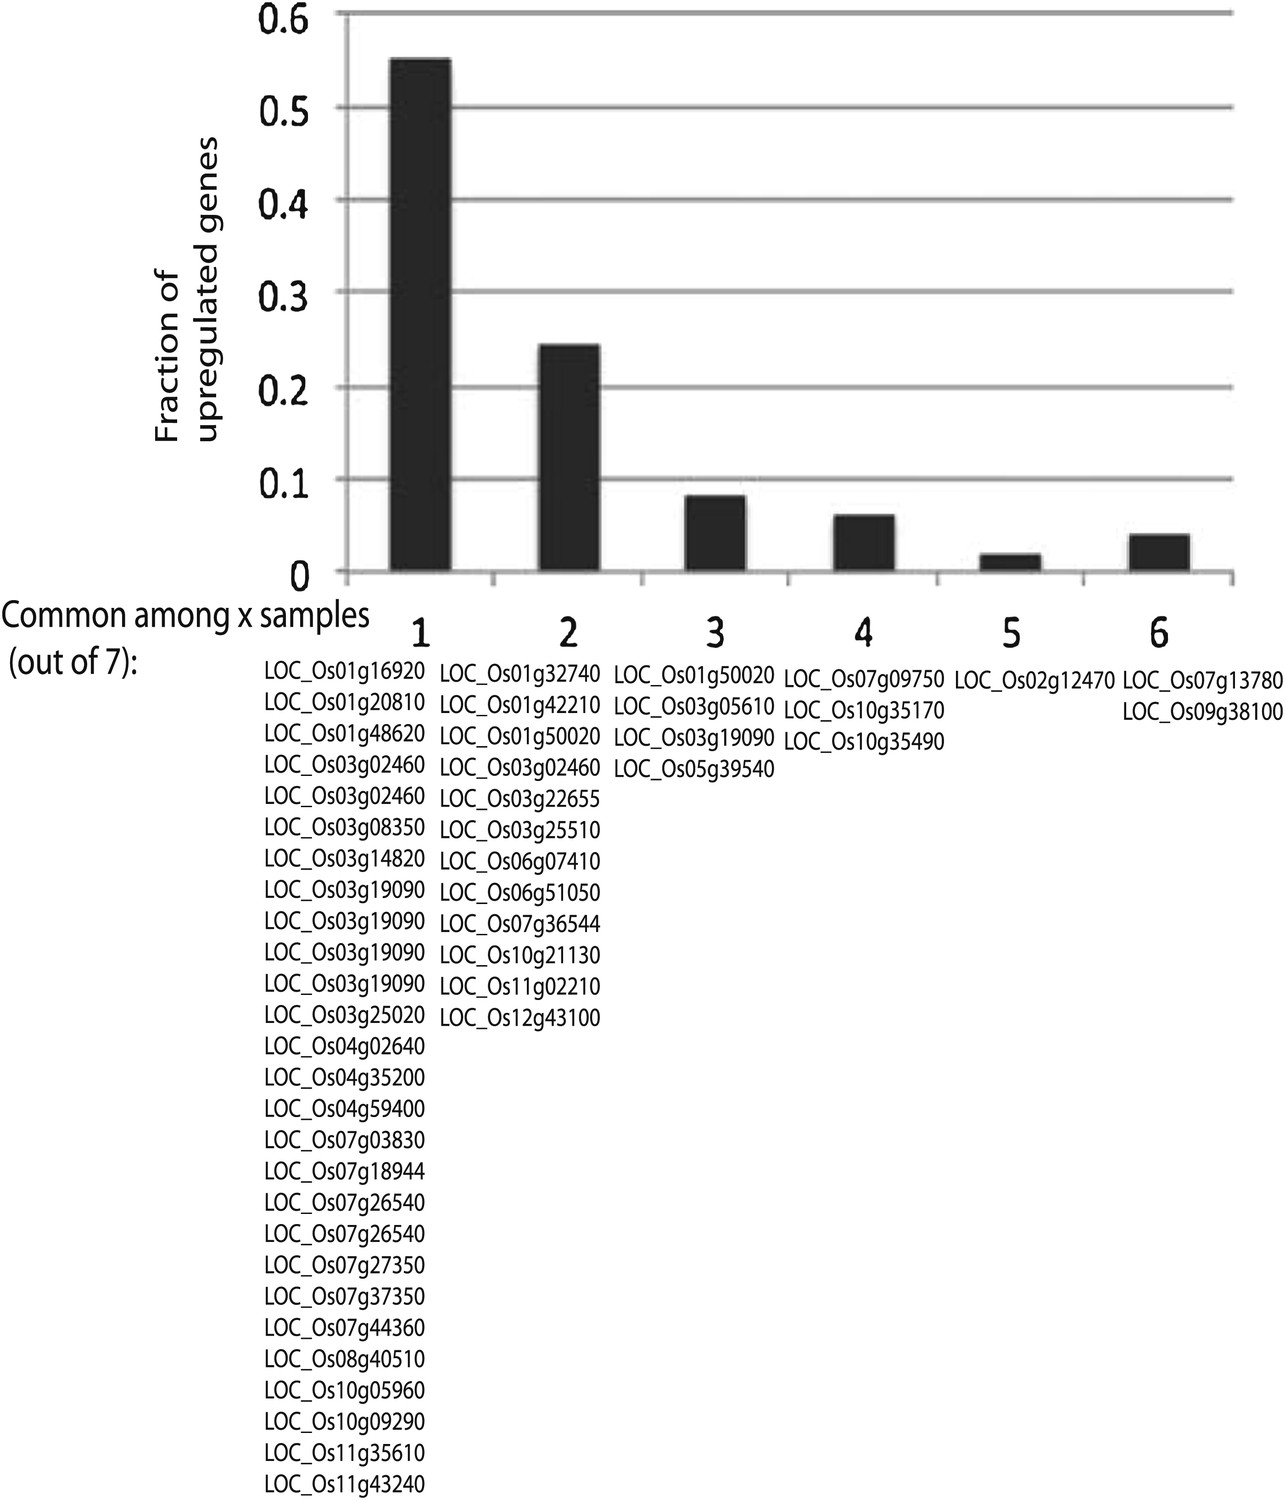
Significantly up-regulated genes are largely different across different lines.
Defined significantly up-regulated genes with CG hypomethylation DMRs at promoters were categorized based on the number of lines (out of seven tested) in which they were up-regulated. Gene identifiers are listed below.
Figure 4—figure supplement 4
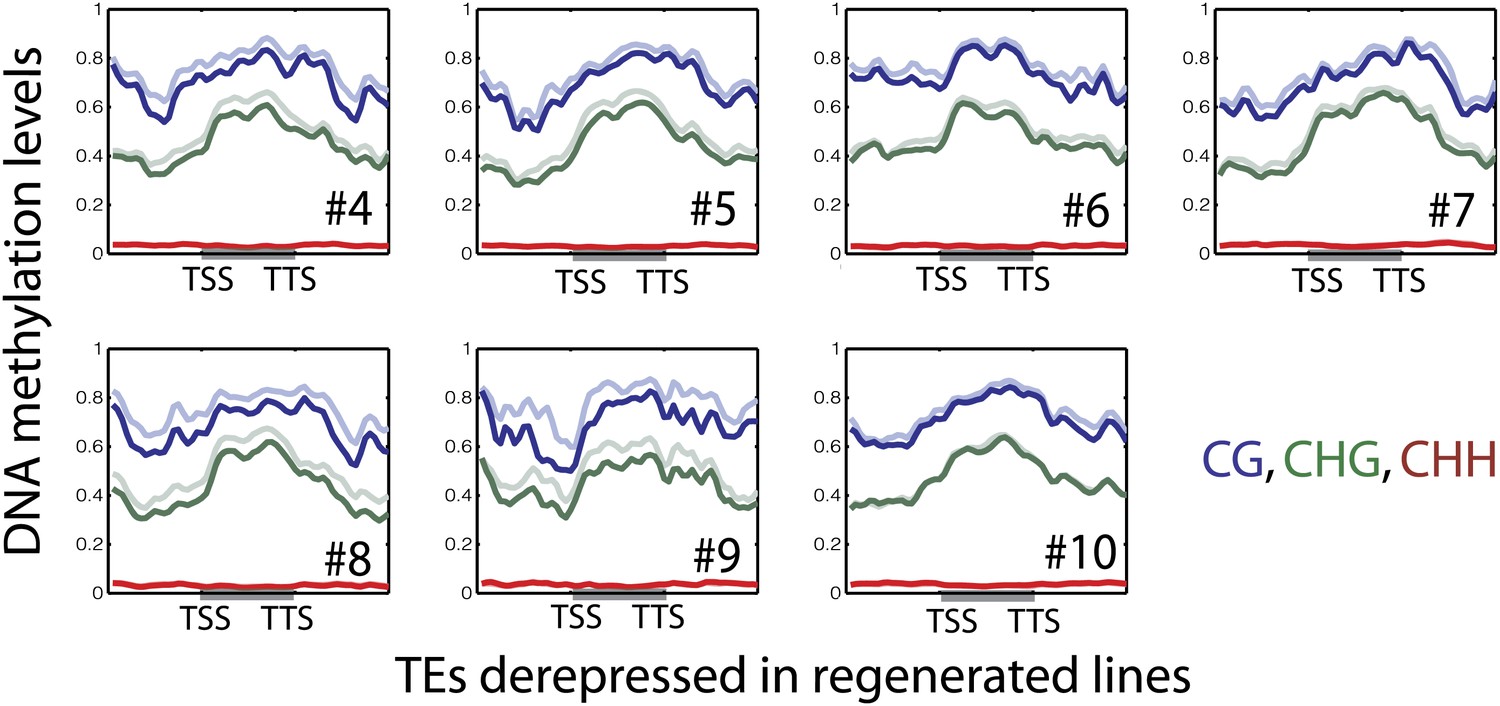
DNA methylation levels over upregulated TE genes in regenerated samples.
Average distributions of DNA methylation in wild type (faded lines) and regenerated lines (solid lines) over defined up-regulated TE genes in the indicated regenerated samples.
Figure 5

Tissue culture step induces loss of DNA methylation.
(A) Genome coverage of identified CG hypermethylation and hypomethylation DMRs. DMRs were defined relative to sample 18 (wild type). (B) Heat map of CG methylation levels within all 1074 CG hypomethylation DMRs identified in samples 13 to 17 (callus samples and wild-type plants regenerated from callus). (C) Heat map of CG methylation levels within 241 CG hypomethylation DMRs that were observed in all tested regenerated plants. (D) Boxplot representations of (C). Red lines, median; edges of boxes, 25th (bottom) and 75th (top) percentiles; error bars, minimum and maximum points within 1.5 × IQR (Interquartile range); red dots, outliers.
Figure 6 with 1 supplement
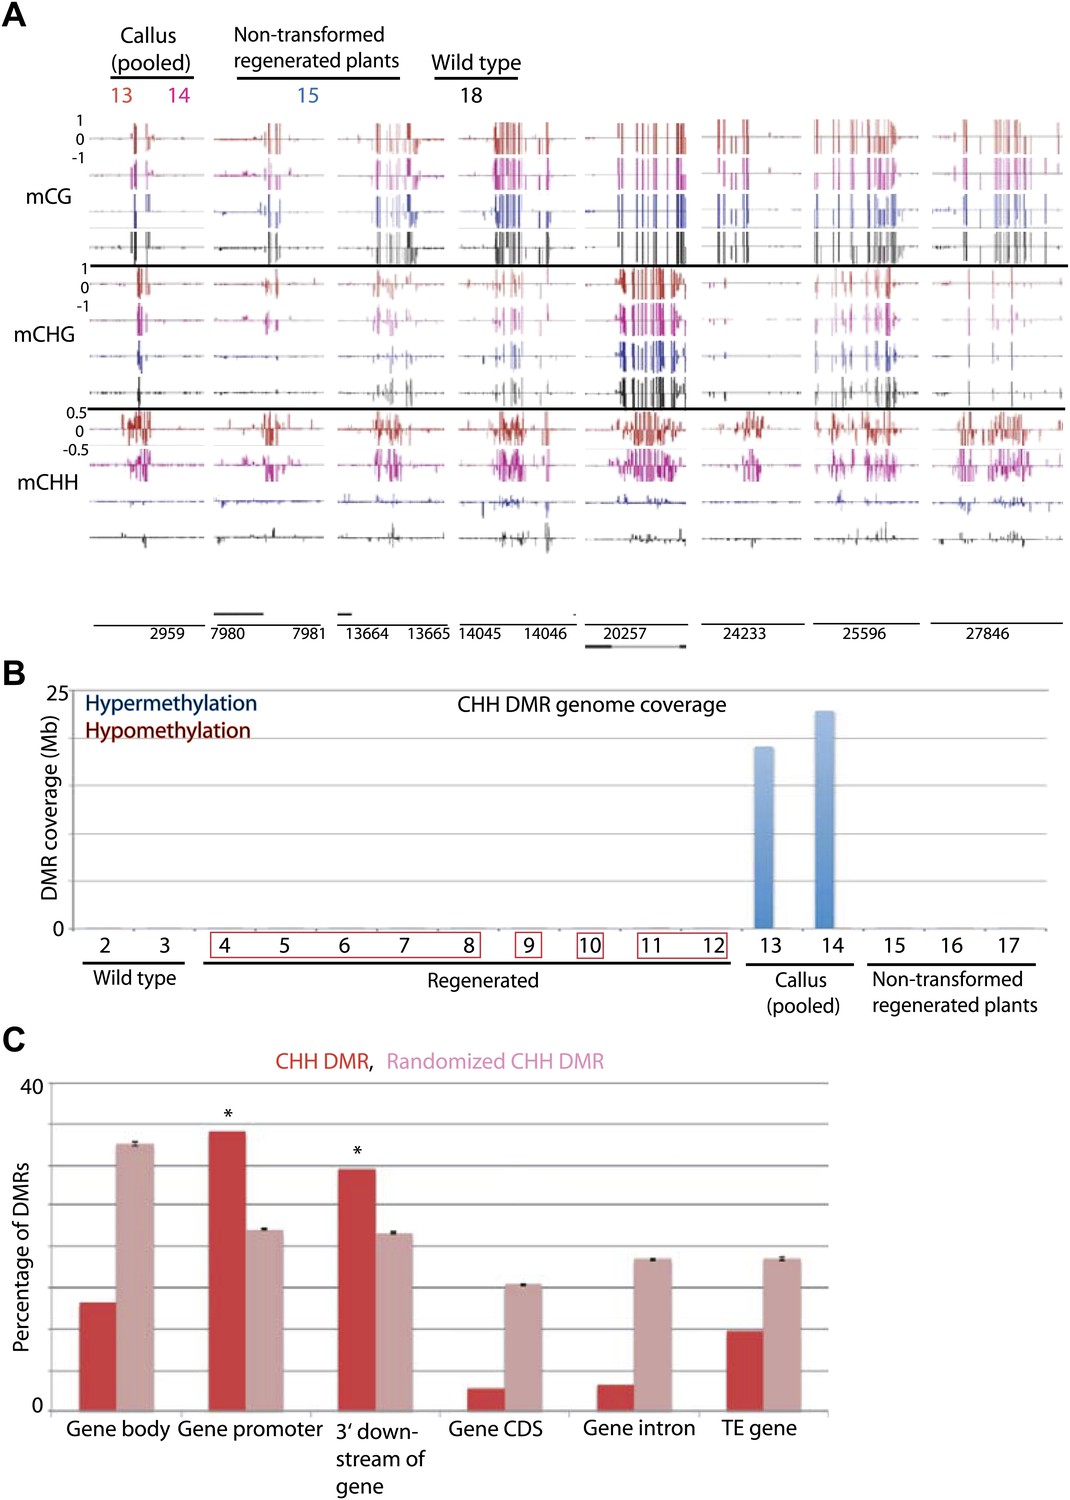
Tissue culture-induced CHH hypermethylation is eliminated upon regeneration.
(A) Genome browser views of DNA methylation. (B) Genome coverage of identified CHH hypermethylation and hypomethylation DMRs. Regenerated samples of the same line are grouped together in red boxes. (C) Overlap of callus CHH hypermethylation DMRs with indicated genomic elements. Observed overlap (dark bars) is compared to randomized regions of a similar number and size distribution as the DMRs (light bars). Error bars represent standard deviation.
Figure 6—figure supplement 1
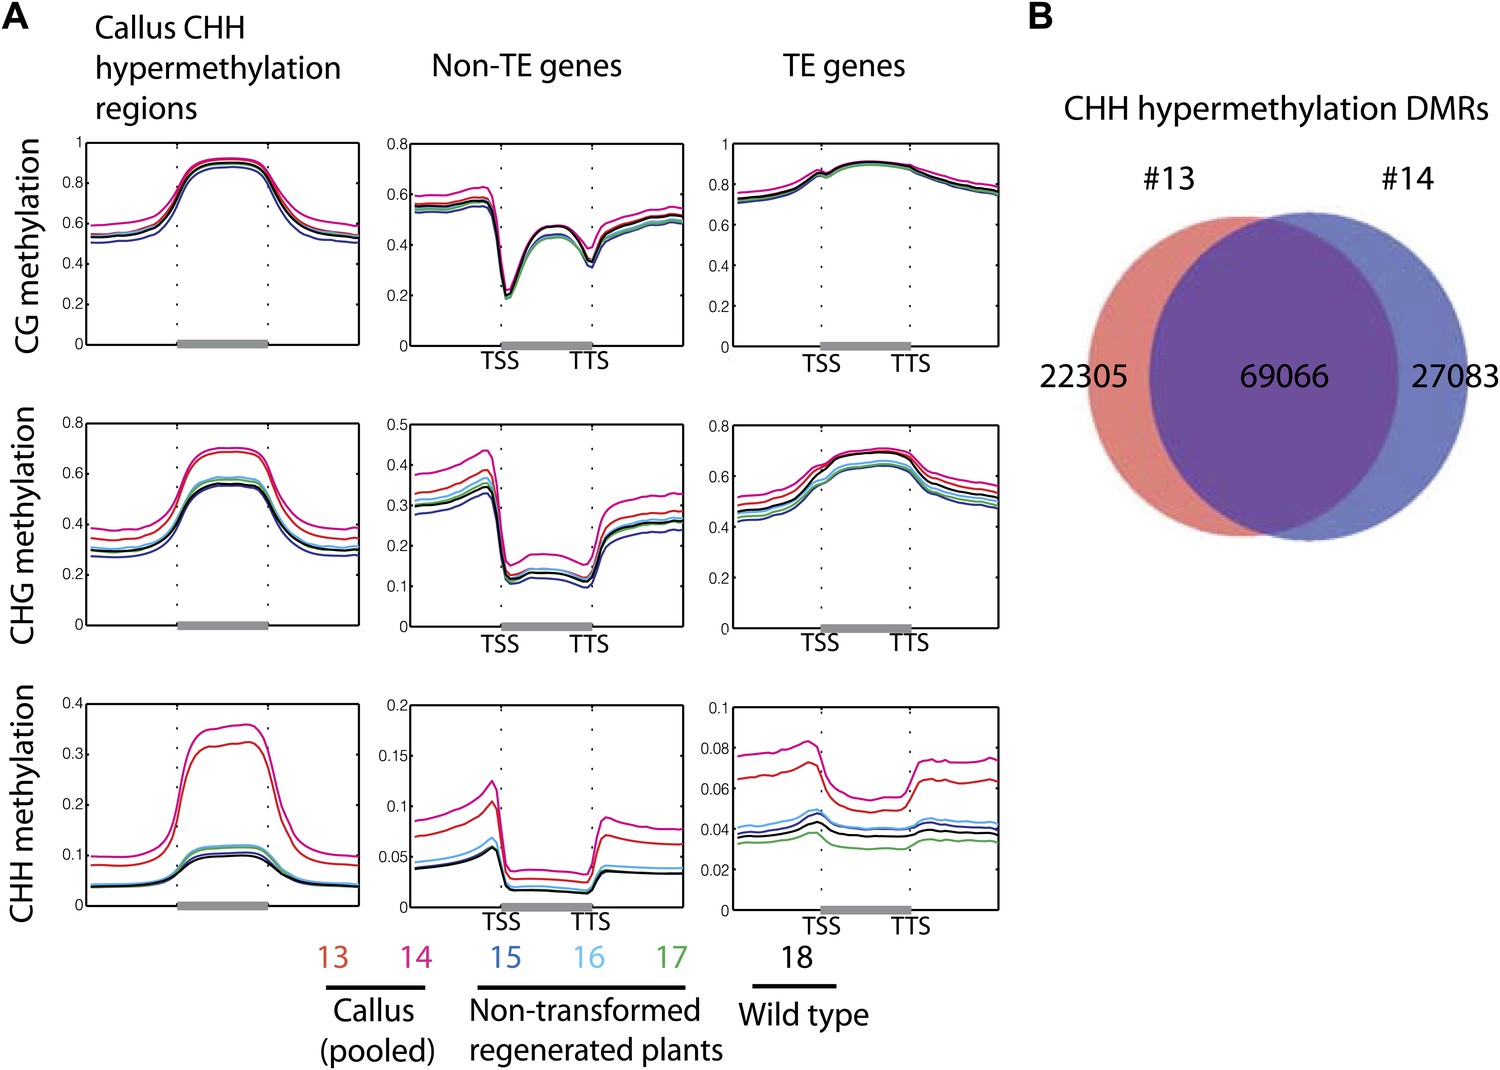
Callus induced CHH hypermethylation.
(A) Average distribution of DNA methylation over defined CHH hypermethylated regions in callus, genes, and TE genes. Flanking regions are the same lengths as the middle region. (B) Overlap between defined CHH hypermethylation DMRs of the two callus samples in this study (13 and 14).
Tables
Table 1
BS-Seq samples analyzed in this study
| Sample | Description | Raw reads | Uniquely mapping reads | Coverage (X) | CG error rate | CHG error rate | CHH error rate |
| 1 | WT2003 | 231568902 | 100572780 | 13.5178 | 0.0176 | 0.0122 | 0.0099 |
| 2 | WT2007 | 203541357 | 104376988 | 14.0292 | 0.0107 | 0.0087 | 0.0082 |
| 3 | WT2011 | 187803109 | 84301904 | 11.3309 | 0.0158 | 0.0095 | 0.0065 |
| 4 | T2-PiZt-11-R | 229650259 | 118710094 | 15.9557 | 0.0139 | 0.0099 | 0.0069 |
| 5 | T2-PiZt-11-S | 263329602 | 136471411 | 18.3429 | 0.0101 | 0.0096 | 0.0076 |
| 6 | T4-PiZt-11-R | 270670871 | 131056700 | 17.6151 | 0.0117 | 0.0100 | 0.0074 |
| 7 | T4-PiZt-11-S | 252150298 | 128467721 | 17.2672 | 0.0096 | 0.0076 | 0.0074 |
| 8 | T6-PiZt-11-R | 237280137 | 121966745 | 16.3934 | 0.0105 | 0.0096 | 0.0064 |
| 9 | T6-Pi9-R | 204752699 | 86995742 | 11.6930 | 0.0106 | 0.0093 | 0.0050 |
| 10 | T6-Spin1i-1-R | 215451022 | 90468236 | 12.1597 | 0.0113 | 0.0088 | 0.0061 |
| 11 | T2-PiZt-839-8-R (non functional PiZt) | 238730281 | 117471332 | 15.7892 | 0.0129 | 0.0079 | 0.0056 |
| 12 | T2-PiZt-839-8-S (non functional PiZt) | 211006119 | 106172872 | 14.2705 | 0.0178 | 0.0129 | 0.0095 |
| 13 | WT Callus 1 | 217121522 | 96145279 | 12.9228 | 0.0185 | 0.0178 | 0.0070 |
| 14 | WT Callus 2 | 199261493 | 82617643 | 11.1045 | 0.0232 | 0.0222 | 0.0084 |
| 15 | WT regenerated from tissue culture 1 | 218008835 | 116367626 | 15.6408 | 0.0170 | 0.0155 | 0.0078 |
| 16 | WT regenerated from tissue culture 2 | 225202113 | 97905142 | 13.1593 | 0.0262 | 0.0206 | 0.0093 |
| 17 | WT regenerated from tissue culture 3 | 252306428 | 106544735 | 14.3205 | 0.0194 | 0.0160 | 0.0073 |
| 18 | WT2011 (replicate) | 253971827 | 118140062 | 15.8790 | 0.0172 | 0.0148 | 0.0086 |
-
Number of raw sequencing reads, number of uniquely mapping reads (post-removal of identical reads), genome coverage (rice genome size = 372 Mb), and error rates are listed. DNA methylation levels of the chloroplast genome were used to estimate error rates. Samples 1–12 and samples 13–18 were prepared separately. “R” and “S” correspond to plants that either contain the transgene (R) or plants in which the transgene was segregated away (S).
Table 2
smRNA-seq samples analyzed in this study
| Sample | Description | Raw reads | Uniquely mapping reads |
| 1 | WT2003 | 22030663 | 3186666 |
| 2 | WT2007 | 17069498 | 2598780 |
| 3 | WT2011 | 14860767 | 2399713 |
| 4 | T2-PiZt-11-R | 22024881 | 3965317 |
| 5 | T2-PiZt-11-S | 17641623 | 3127938 |
| 6 | T4-PiZt-11-R | 18999415 | 3090933 |
| 7 | T4-PiZt-11-S | 22115074 | 4258752 |
| 8 | T6-PiZt-11-R | 12995193 | 2044615 |
| 9 | T6-Pi9-R | 16700524 | 3114923 |
| 10 | T6-Spin1i-1-R | 17275813 | 2973100 |
-
Number of raw sequencing reads and number of uniquely mapping reads are listed.
Table 3
mRNA-seq samples analyzed in this study
| Sample | Description | Raw reads | Uniquely mapping reads |
| 2 | WT2007 | 44029089 | 29461162 |
| 3 | WT2011 | 33997755 | 22657098 |
| 4 | T2-PiZt-11-R | 42550136 | 27839598 |
| 5 | T2-PiZt-11-S | 43173764 | 28688381 |
| 6 | T4-PiZt-11-R | 46624891 | 35826861 |
| 7 | T4-PiZt-11-S | 31729173 | 22667633 |
| 8 | T6-PiZt-11-R | 46624532 | 35335627 |
| 9 | T6-Pi9-R | 38978541 | 30623633 |
| 10 | T6-Spin1i-1-R | 42280235 | 32485204 |
-
Number of raw sequencing reads and number of uniquely mapping reads are listed.
Download links
A two-part list of links to download the article, or parts of the article, in various formats.
Downloads (link to download the article as PDF)
Open citations (links to open the citations from this article in various online reference manager services)
Cite this article (links to download the citations from this article in formats compatible with various reference manager tools)
Plants regenerated from tissue culture contain stable epigenome changes in rice
eLife 2:e00354.
https://doi.org/10.7554/eLife.00354


