Nutrient restriction enhances the proliferative potential of cells lacking the tumor suppressor PTEN in mitotic tissues
- ETH Zürich, Switzerland
Figures
Figure 1

Response to yeast starvation in wild-type and insulin signaling defective Drosophila.
(A and B) Control flies reared on standard culture medium with varying yeast concentrations. (A) Weight reduction in males (blue line) and females (red line). (B) Time from first instar to pupariation (black line) and the survival rates of first instar larvae to pupariation (green line). (C) Adult dry weight of wild-type, PKB and PTEN mutants reared on 100 g/l and 10 g/l yeast food, respectively. Weight difference (in %) with respect to control (y w) on 100 g/l yeast food is depicted in each column. (D) Size comparison of female control flies (y w) and PKB hypomorphic mutants reared on 100 g/l and 10 g/l food, respectively. (E) Larvae of y w and a PTEN hypomorphic combination (PTEN117/PTEN100) reared on 100 g/l (late L3) and 10 g/l (mid L3). (F) Eye and wing discs of the larvae from (E).
-
Figure 1—source data 1
Adult dry weight; survival L1 to pupariation; pupariation time; weight analysis of IIS mutants.
- https://doi.org/10.7554/eLife.00380.004
Figure 2 with 6 supplements
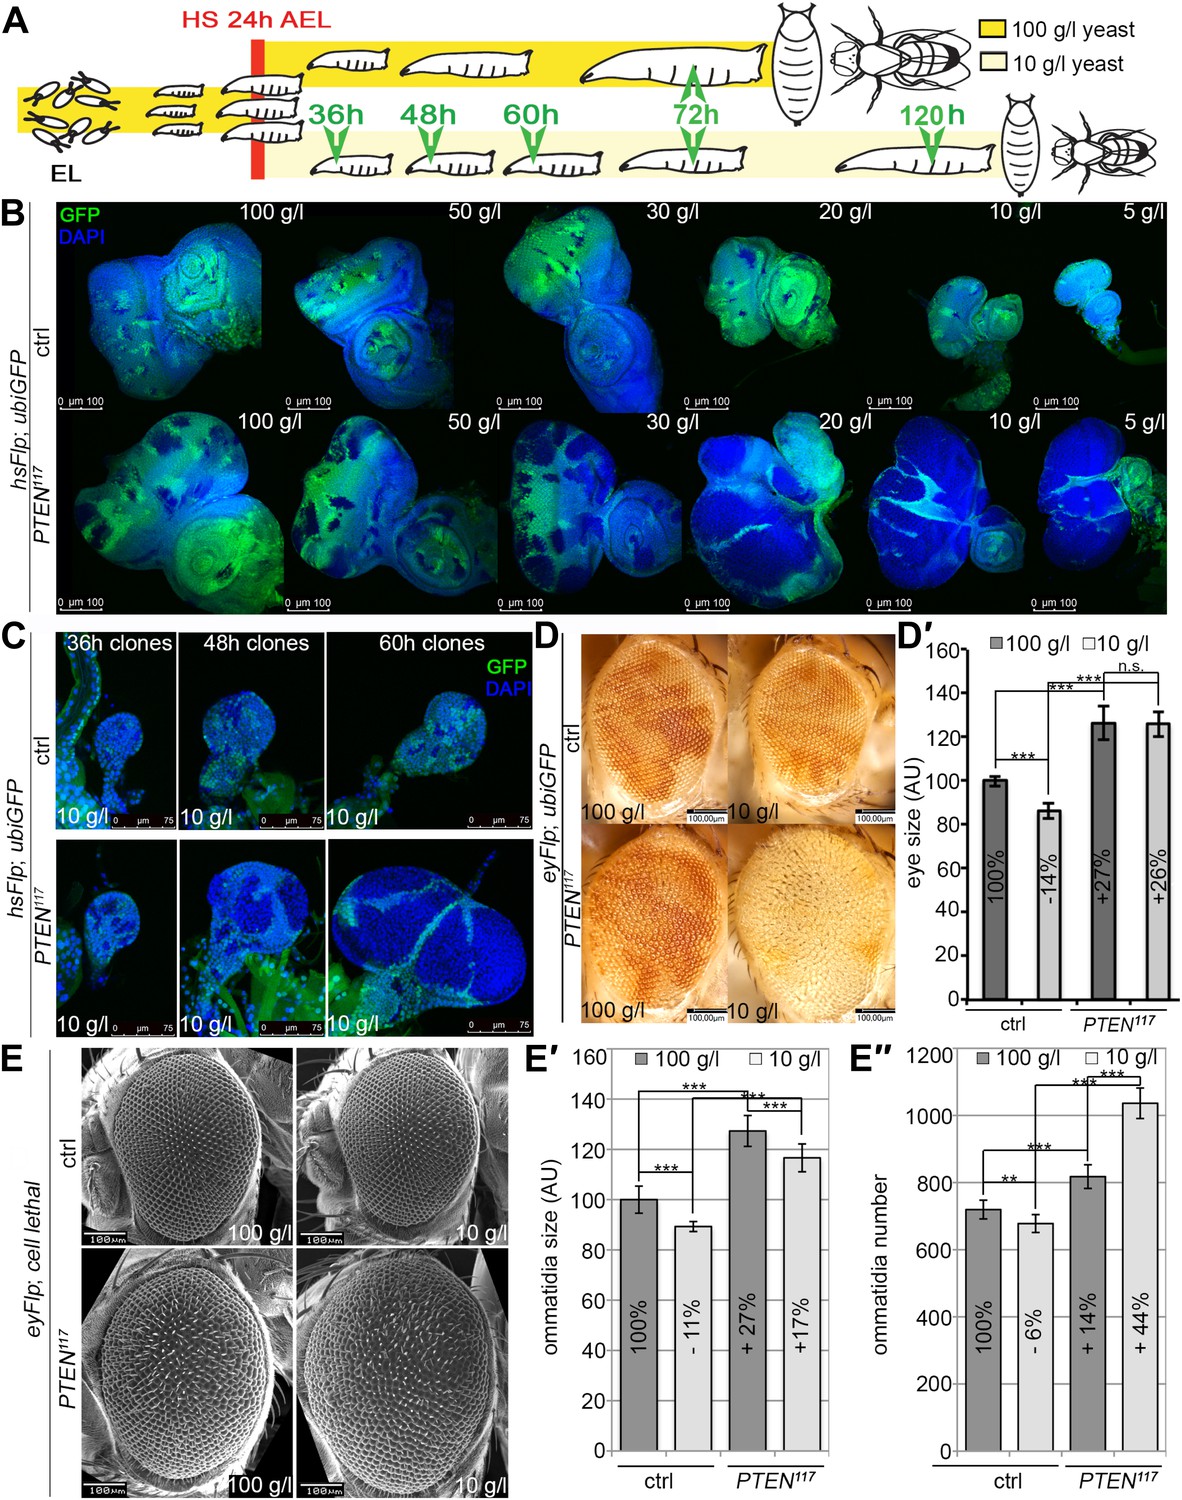
PTEN mutant cells are resistant to starvation and have a growth advantage upon NR.
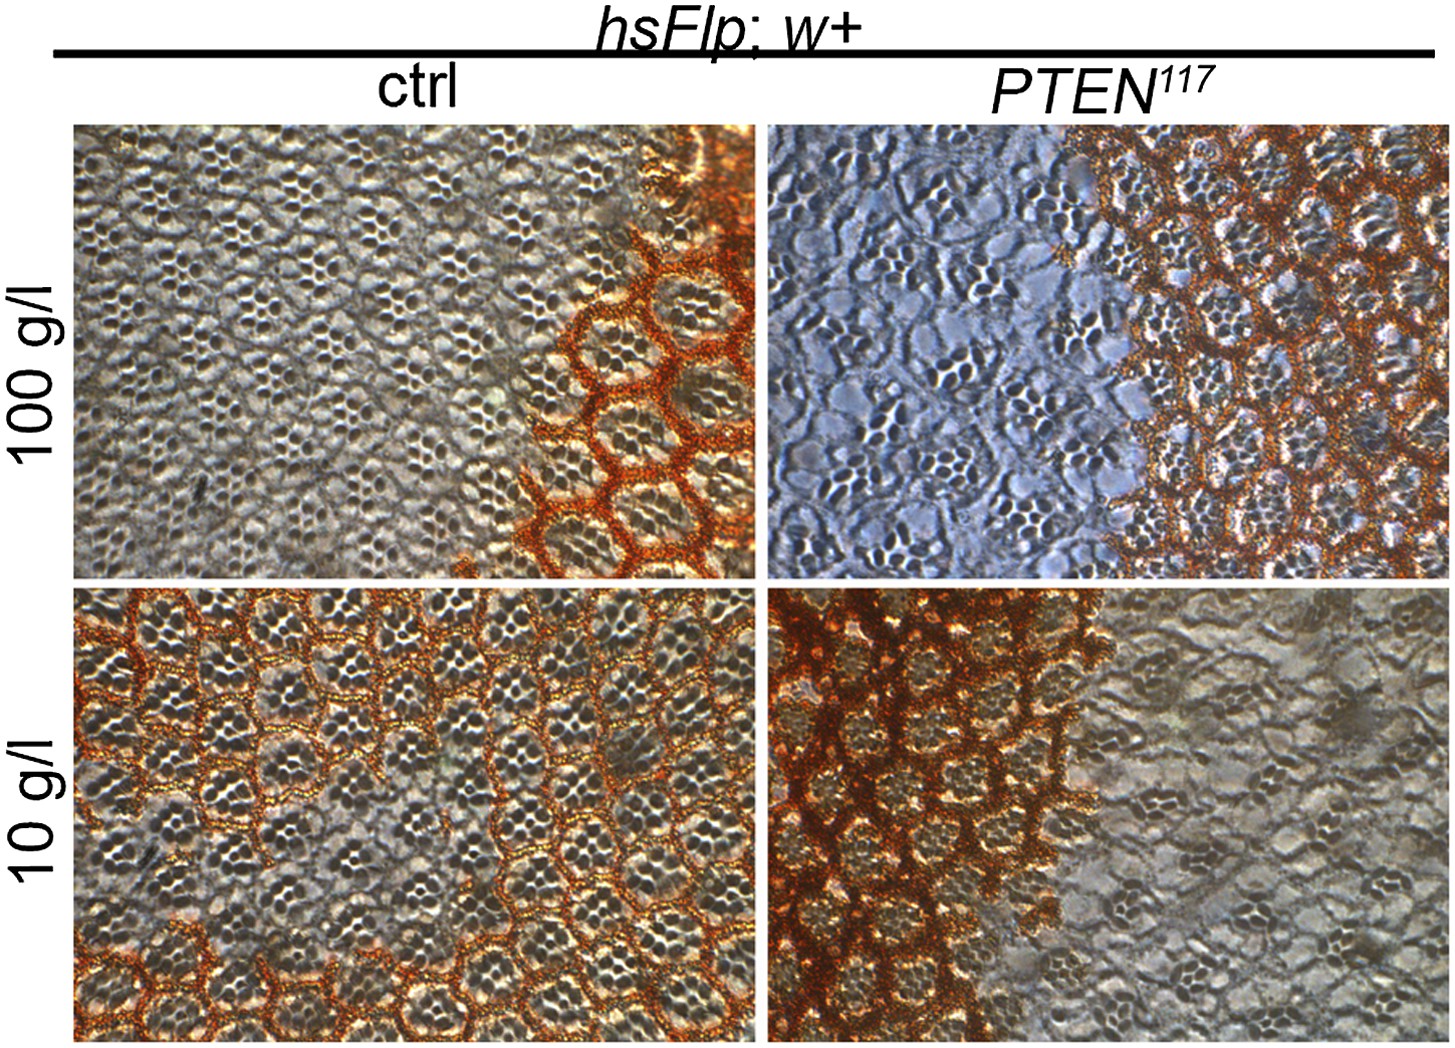
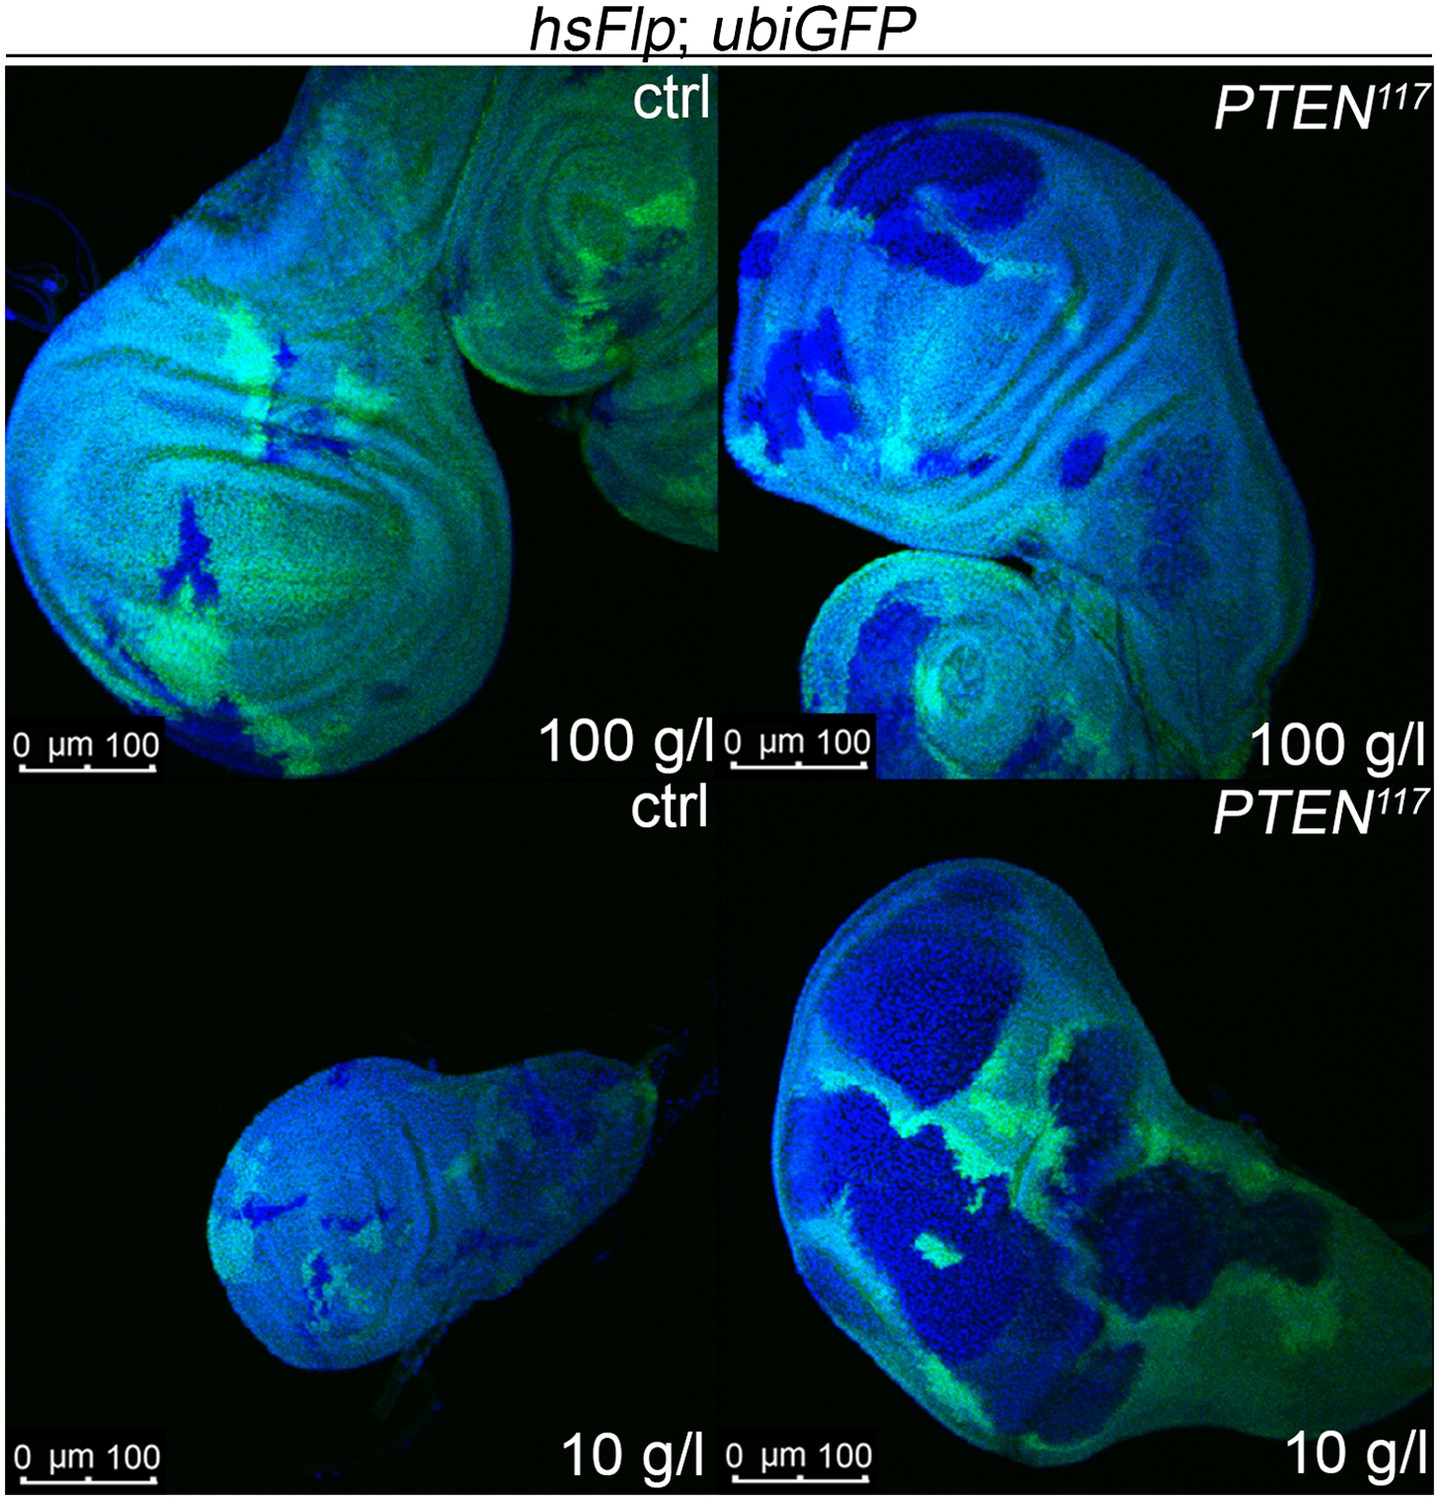
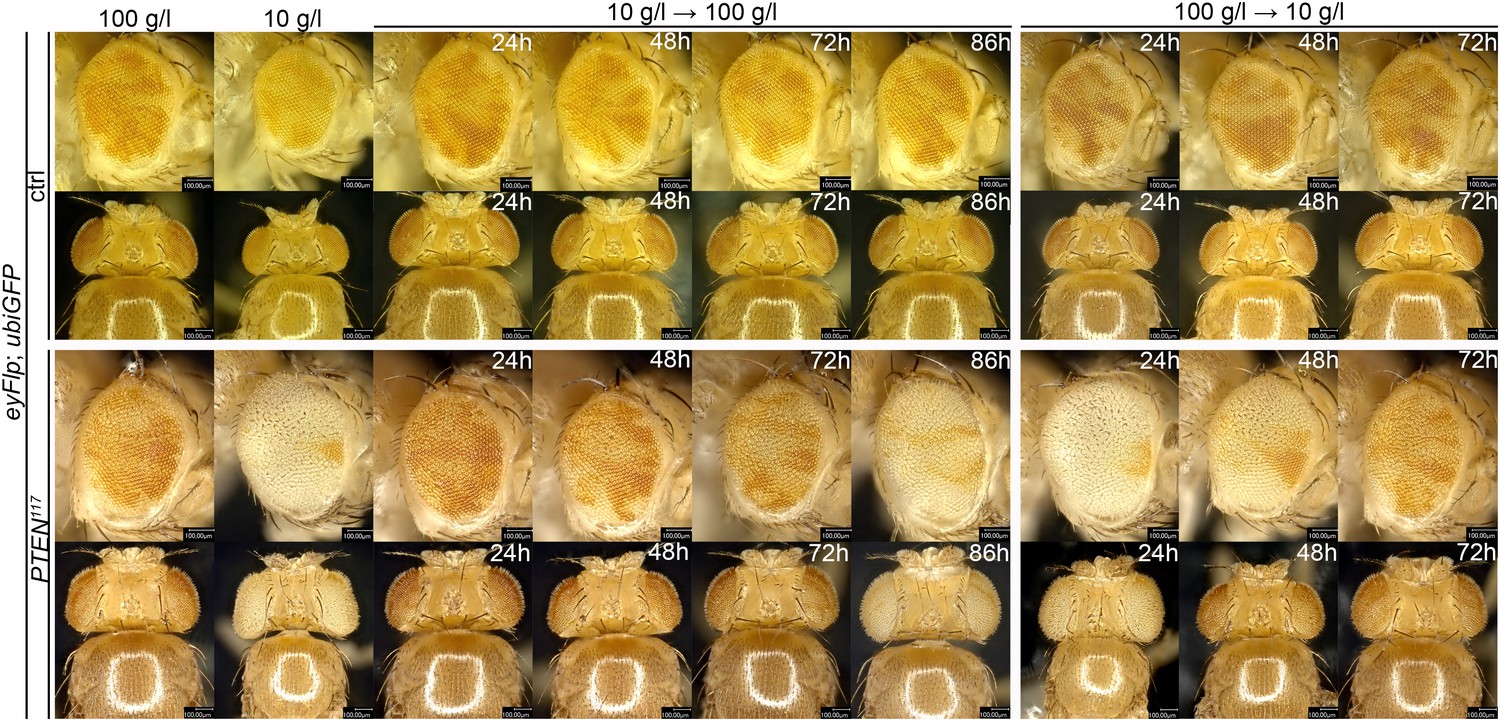
(A) Schematic drawing of the clonal induction with hsFlp/FRT-mediated mitotic recombination. After egg laying, larvae were allowed to grow for 24 hr on yeast paste. After the heat shock, larvae were distributed on different food conditions (e.g., 100 g/l and 10 g/l yeast). The time points of dissection are depicted in green. (B) Third instar eye discs bearing hsFlp/FRT PTEN mutant and control clones (marked by the absence of GFP) of larvae reared under varying yeast concentrations. (C) Eye discs with hsFlp/FRT PTEN mutant and control clones (marked by the absence of GFP) induced at the same time and conditions, reared on 10 g/l yeast food, and dissected at the indicated age of the clones. (D) Eyes bearing eyFlp/FRT PTEN mutant and control clones (marked by the absence of pigmentation) of animals reared on 100 g/l and 10 g/l yeast food, respectively. (D′) Quantification of the respective eye sizes. (E) Scanning electron micrographs of eyes almost exclusively composed of PTEN mutant or control tissue of animals reared on 100 g/l and 10 g/l food, respectively, and the quantification of ommatidia size (E′) and number (E′′) from PTEN mutant and control eyes.
-
Figure 2—source data 1
Eye size; eye measurements of SEM pictures.
- https://doi.org/10.7554/eLife.00380.006
Figure 2—figure supplement 1
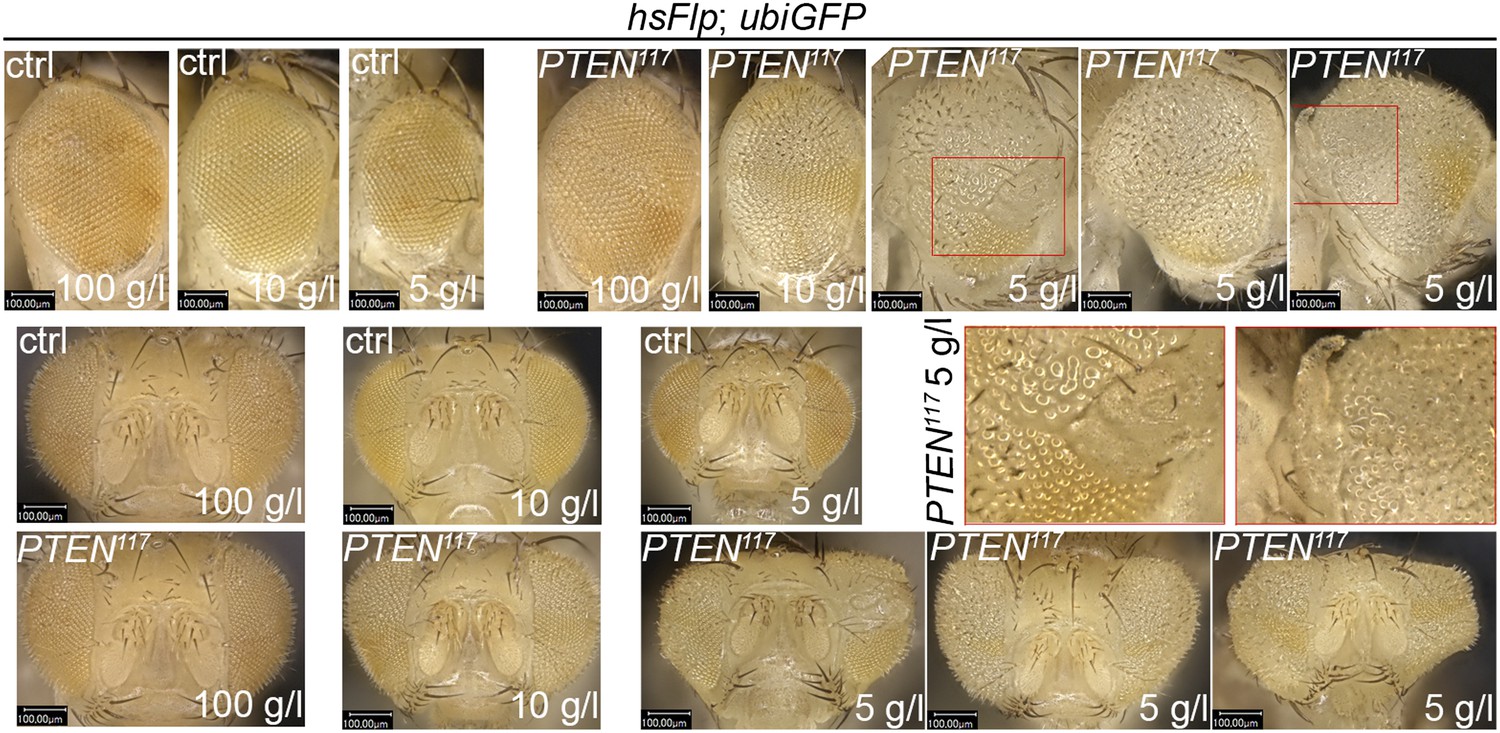
Severe starvation induces malformations in adult eyes bearing PTEN clones.
The structure of adult eyes carrying PTEN clones from animals raised on 10 g/l yeast food is unaltered. By contrast, severe distortions are observed in animals raised on 5 g/l yeast food. Magnifications of distorted parts of the eye are indicated with red boxes. The clones are marked by the absence of pigmentation.
Figure 2—figure supplement 2
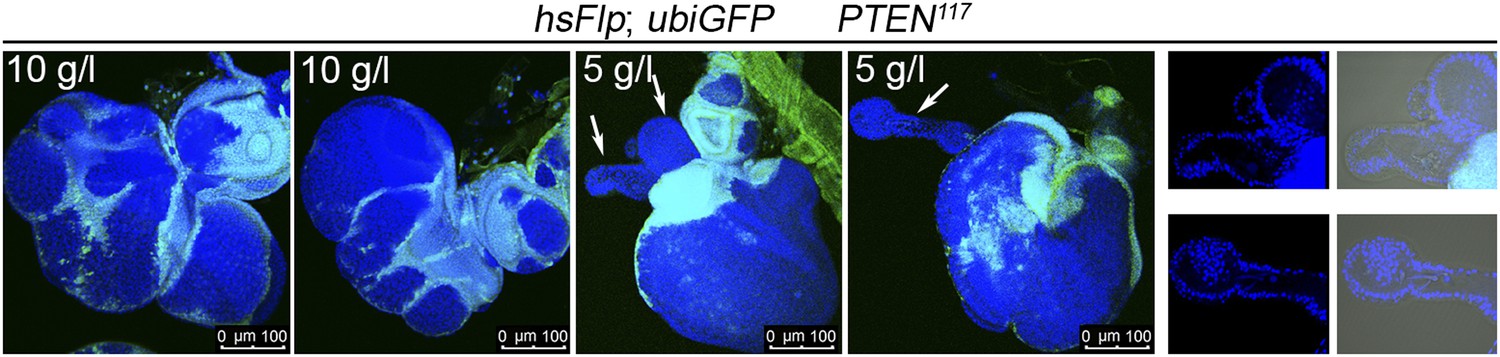
Severe starvation affects architecture of discs bearing PTEN clones.
Discs bearing PTEN clones (marked by the absence of GFP) have a lobed appearance in larvae on 10 g/l yeast food, and they are severely distorted with polyp-like outgrowths of hollow appearance (white arrow) in larvae on 5 g/l yeast food. On the right: close-ups of polyp-like structures indicated with white arrows.
Figure 2—figure supplement 3
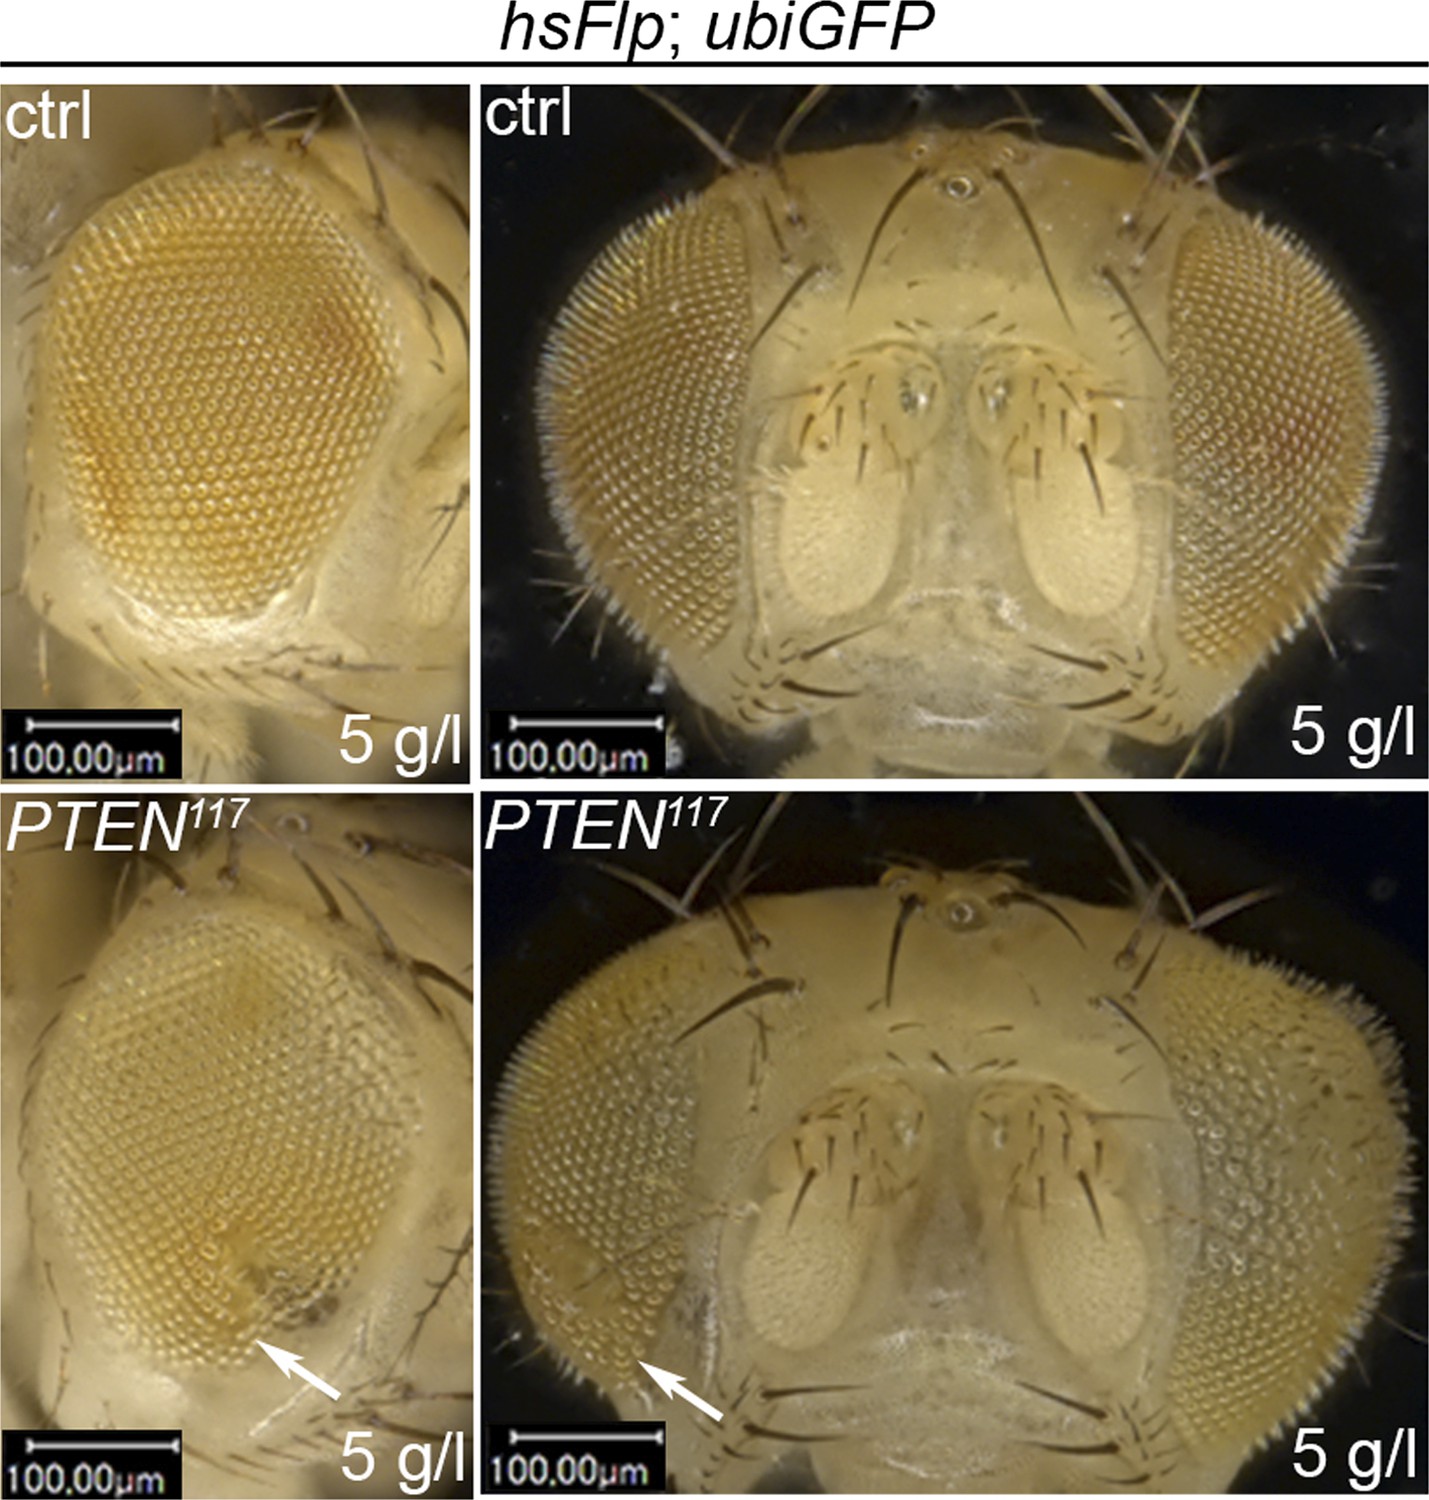
Severely overgrown PTEN clones tend to collapse.
Melanized scars (indicated with white arrows) are sometimes observed in adult structures, probably as remnants of collapsed PTEN clones in animals reared on 5 g/l yeast food.
Figure 2—figure supplement 4
PTEN mutant overgrowth is cell autonomous and does not affect differentiation.
Eye sections of the adult eyes bearing control and PTEN clones from animals reared on 100 g/l and 10 g/l yeast food, respectively. The clones are marked by the absence of pigmentation.
Figure 2—figure supplement 5
PTEN clones have a growth advantage in wing discs under starvation.
The starvation-dependent overgrowth of PTEN clones (marked by the absence of GFP) is not restricted to the eye imaginal disc but is also observed in wing imaginal discs.
Figure 2—figure supplement 6
PTEN mutant cells rapidly respond to the yeast content in the food.
Food switch experiments reveal that a short starvation period early after clone induction is sufficient to result in the overgrowth phenotype of PTEN mutant tissue under starvation. The time points of the shifts are indicated; clones are marked by the absence of pigmentation.
Figure 3 with 2 supplements
PTEN mutant cells are susceptible to cell death.
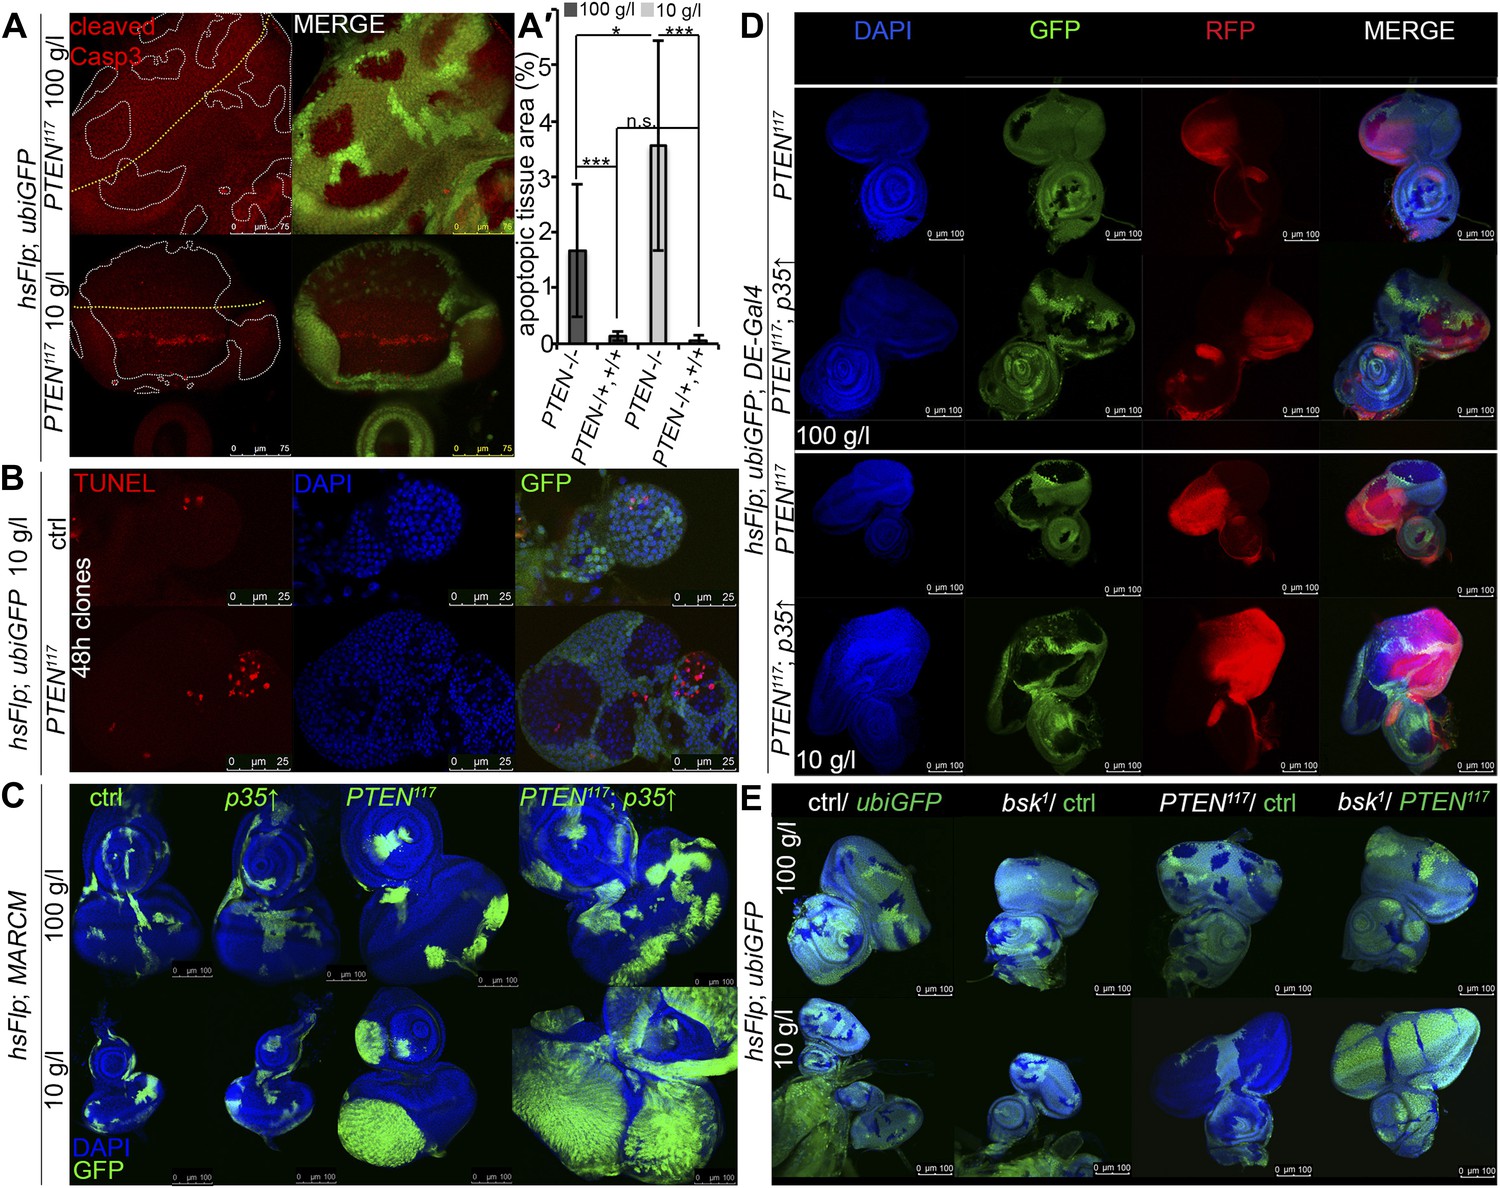
(A) Cleaved Caspase-3 antibody staining (in red) of hsFlp/FRT PTEN clones (marked by the absence of GFP) in eye imaginal discs of larvae reared under the indicated conditions. The yellow dashed line indicates the morphogenetic furrow. About one third of the PTEN clones contain apoptotic cells. (A′) Quantification of the apoptotic tissue area (positive for cleaved Caspase-3 immunostaining) in the PTEN mutant and the surrounding tissue (PTEN117/+, +/+), respectively, relative to the total area of the respective cell populations. (B) TUNEL staining (in red) on eye imaginal discs harboring 48 hr control and PTEN clones reveals high apoptotic levels within the PTEN clones but only residual apoptosis in surrounding tissue or control discs. (C) Expression of anti-apoptotic p35 within PTEN clones (marked by GFP) enhances the overgrowth potential of PTEN mutant tissue. (D) Inhibition of apoptosis in the dorsal half of the eye discs by expression of p35 under the control of DE-Gal4 (marked by RFP, red) with randomly induced PTEN clones (marked by the absence of GFP) does not rescue the surrounding (GFP positive) tissue. (E) Inhibition of JNK-mediated apoptosis in the sister clones of the PTEN clones does not rescue the surrounding tissue. The different clones are marked as depicted with the colors in the labeling (green: GFP positive, white: GFP negative).
-
Figure 3—source data 1
Tissue size; apoptotic area; ratio apoptotic area/tissue size.
- https://doi.org/10.7554/eLife.00380.014
Figure 3—figure supplement 1
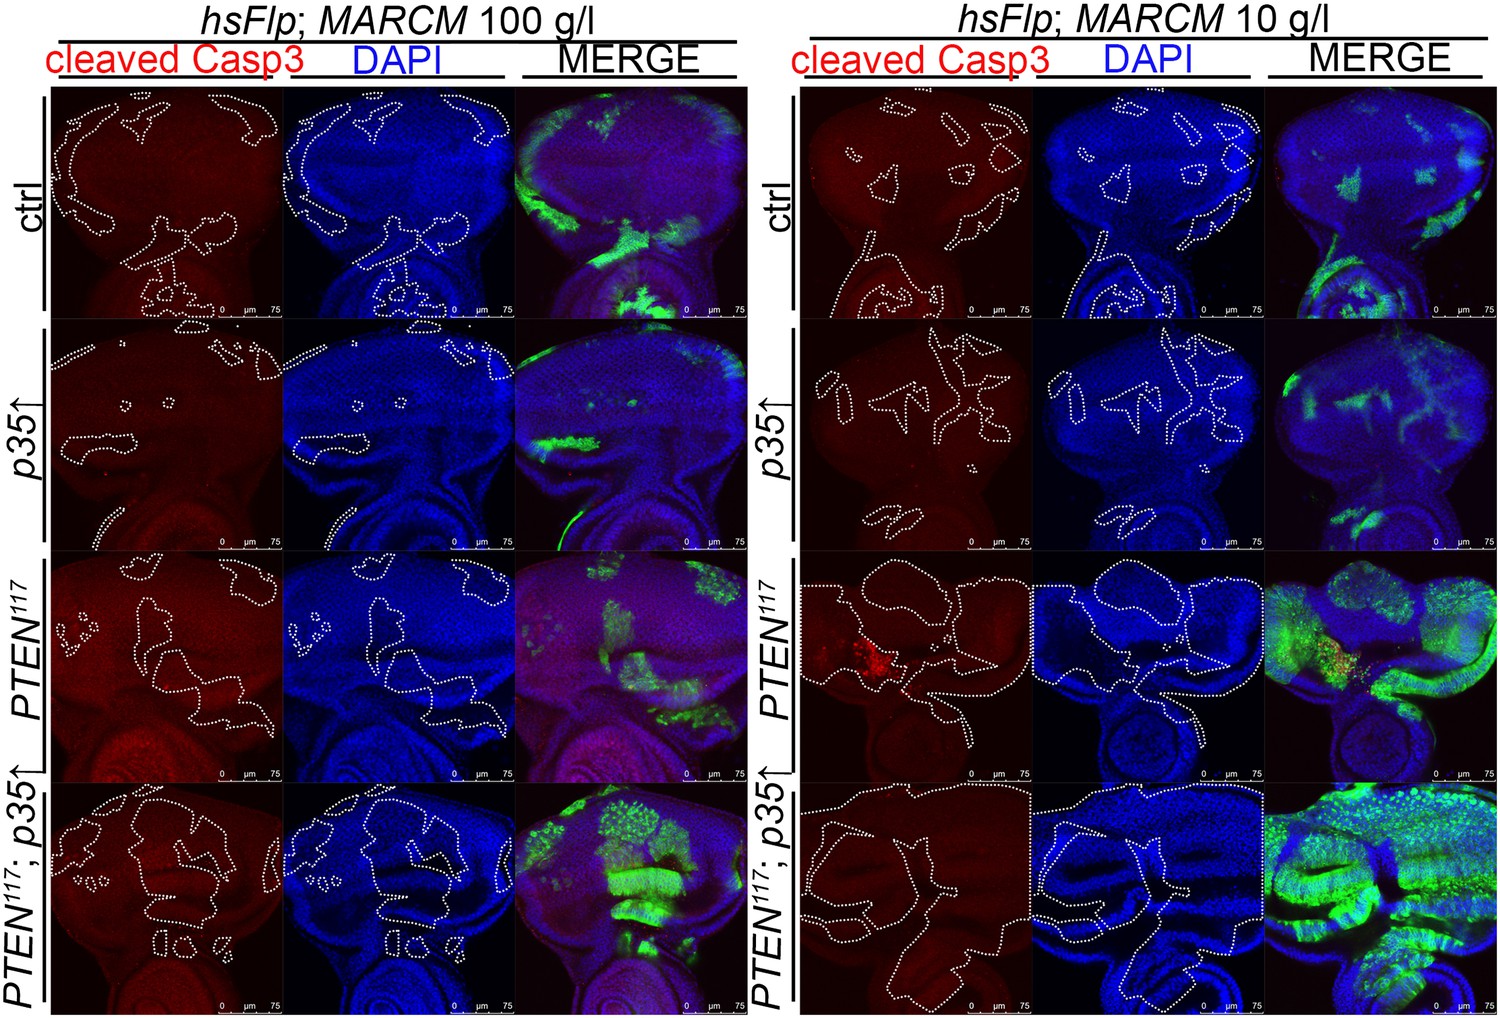
Blocking cell death in PTEN clones enhances the overgrowth.
Cleaved Caspase-3 antibody staining (in red) of PTEN and control clones expressing anti-apoptopic p35 (positively marked by GFP) in eye imaginal discs of larvae reared under the indicated conditions. Cleaved Caspase-3 signal is exclusively observed in the PTEN mutant clones and efficiently suppressed by expression of p35.
Figure 3—figure supplement 2
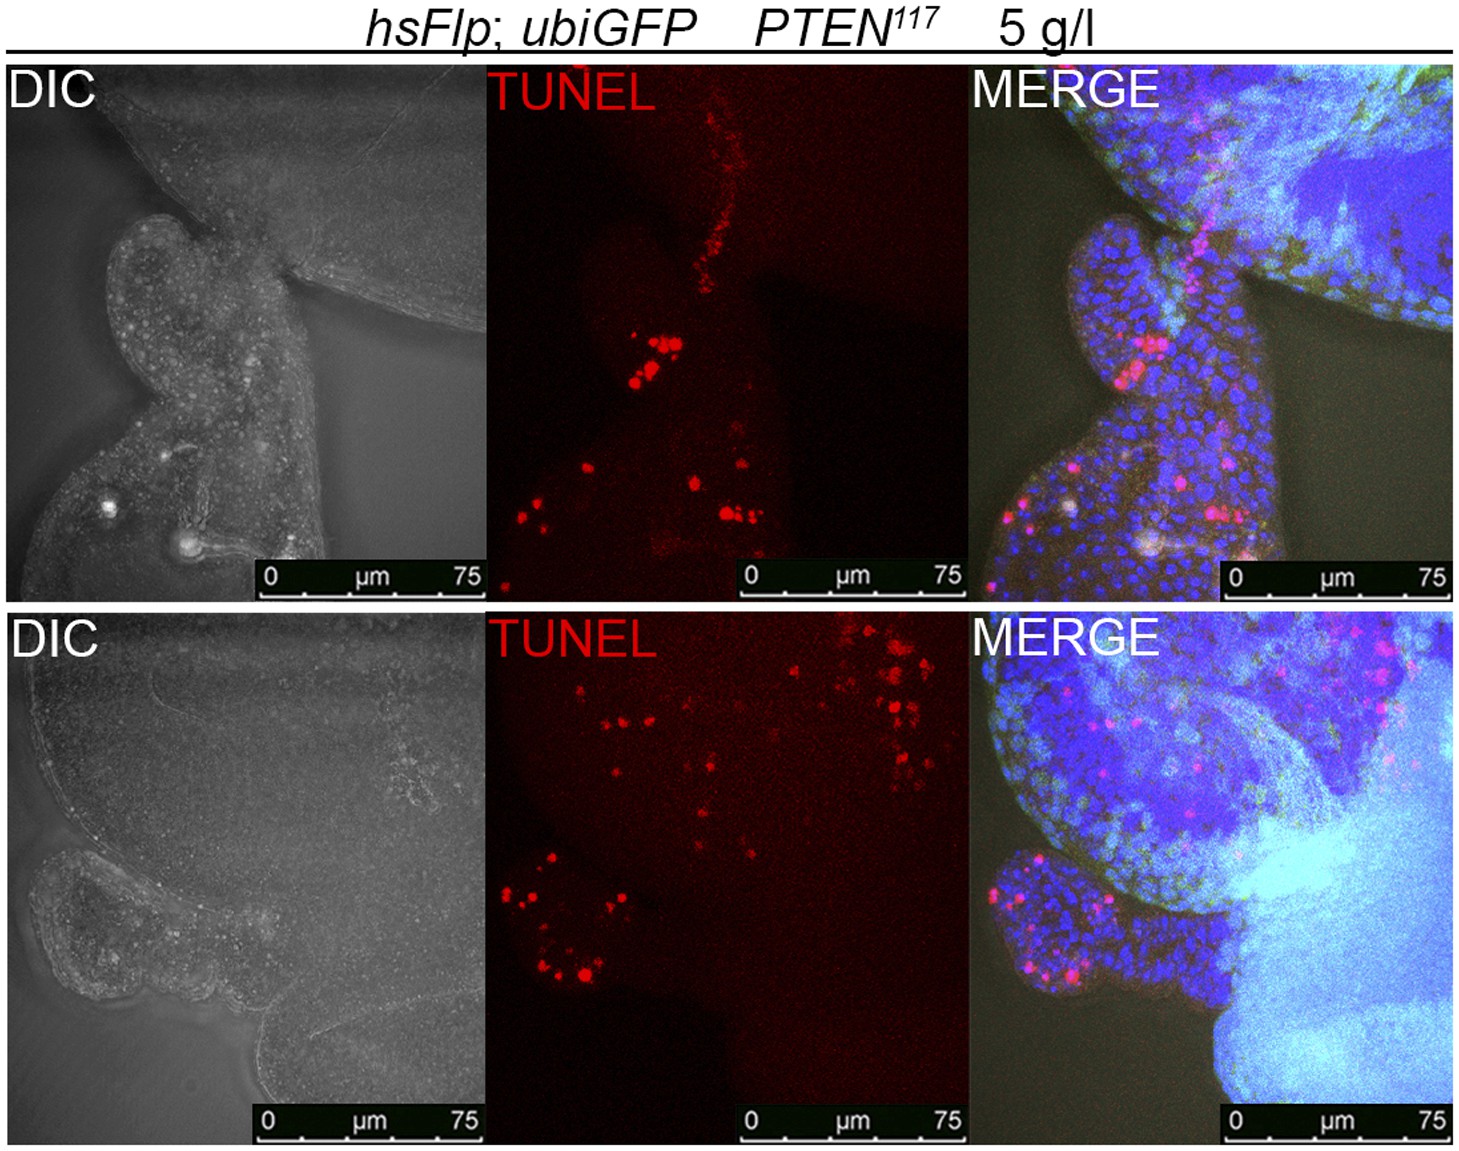
The massive overgrowth of PTEN clones under harsh starvation conditions correlates with high levels of apoptosis.
Outgrowing structures observed on 5 g/l yeast food are exclusively composed of PTEN mutant tissue (marked by the absence of GFP) and show high levels of cell death.
Figure 4 with 7 supplements
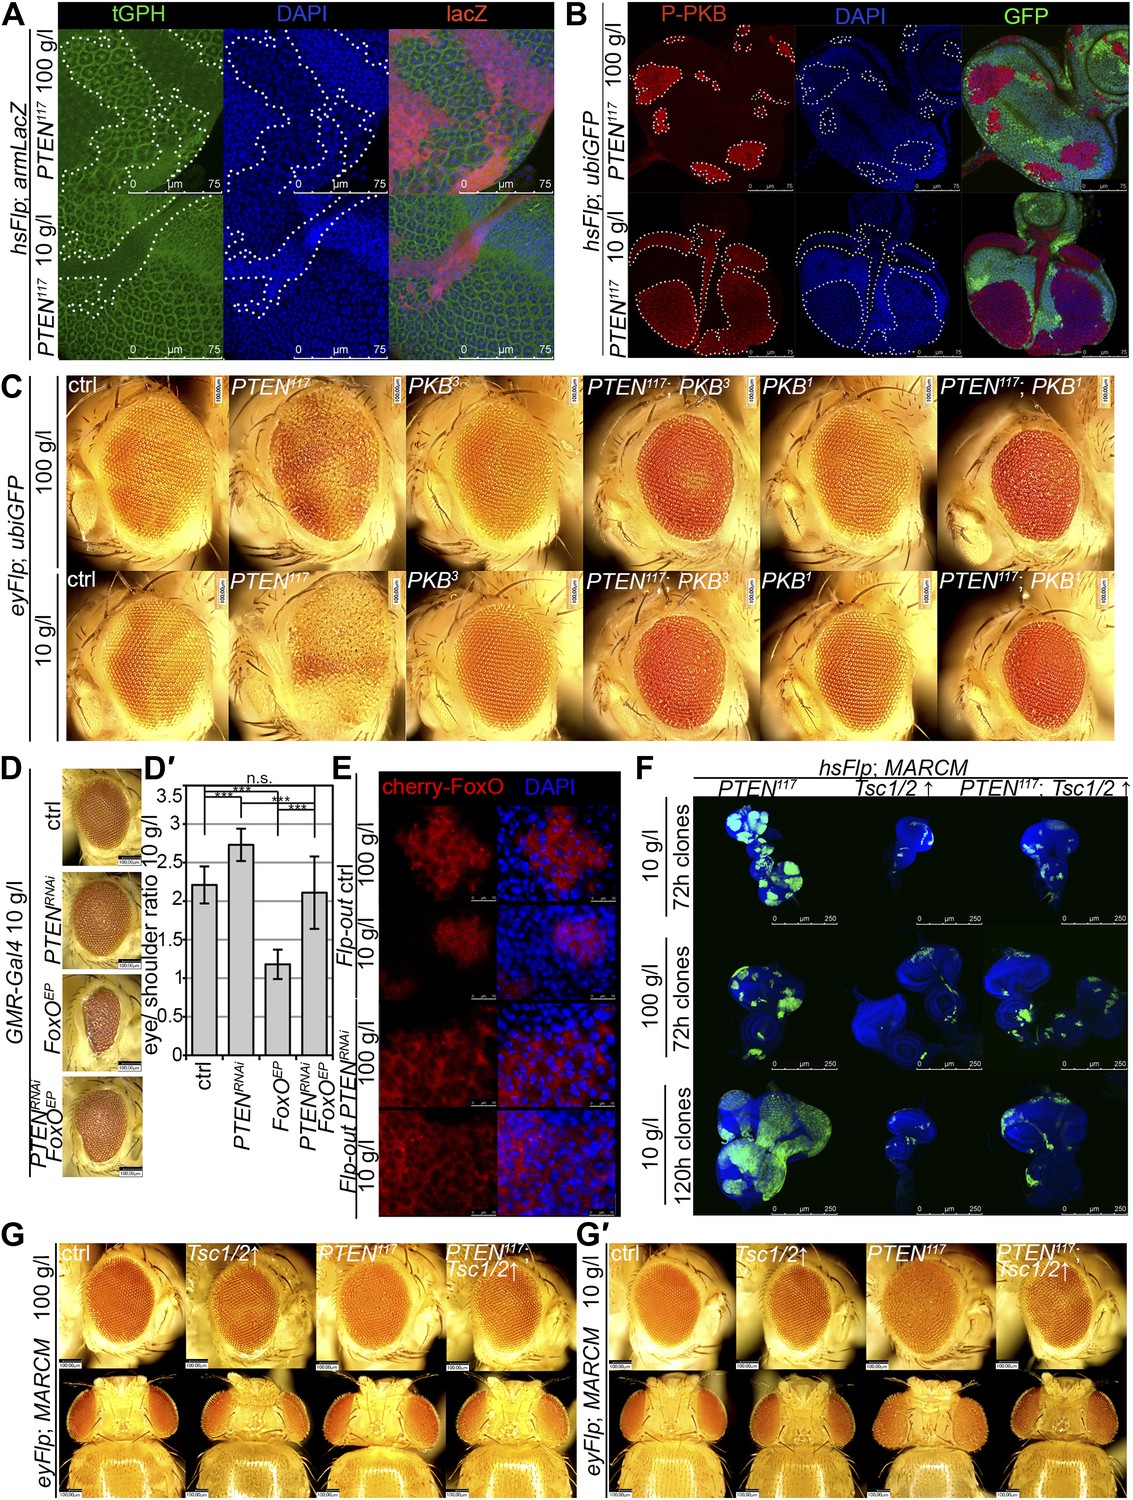
Interaction of insulin and TOR signaling with PTEN clones under starvation.
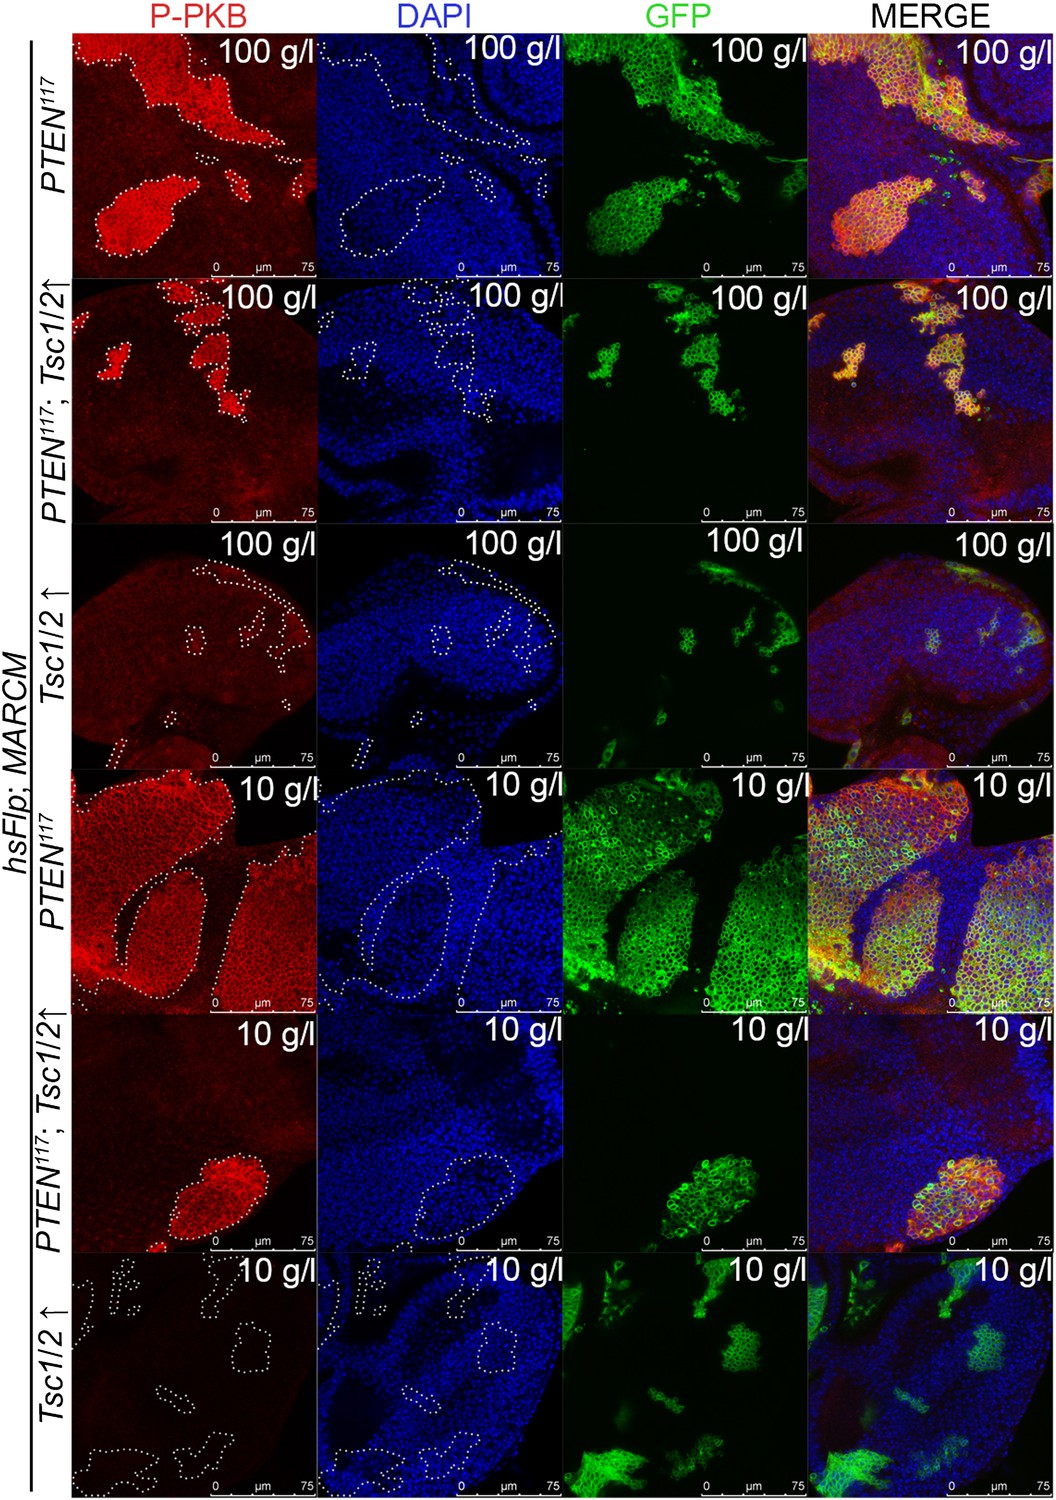
(A) tGPH reporter (green) reveals high levels of PIP3 in PTEN clones (clones marked by absence of LacZ in red) under food conditions indicated. (B) P-PKB (red) is strongly increased in PTEN clones (marked by the absence of GFP) under normal conditions as well as under starvation. (C) PTEN overgrowth under normal and starvation conditions is strictly dependent on PKB activity. (D) Overexpression of FoxO results in a small eye under starvation conditions. This phenotype is suppressed by co-knockdown of PTEN. (D′) Quantification of eyes from (D). (E) Cherry-tagged FoxO localizes to the cytoplasm under normal food conditions and moves to the nucleus under starvation. This nuclear shuttling is prevented in PTEN clones. Clones are positively marked by Cherry (in red). (F) Inhibiting TORC1 activity by overexpression of Tsc1/2 in PTEN clones (positively marked by GFP) suppresses the overgrowth. The suppression is evident already at 72 hr after clone induction. (G) Adult eyes showing the suppression of the overgrowth associated with PTEN clones by overexpression of Tsc1/2 under starvation under standard conditions and under starvation (G′).
-
Figure 4—source data 1
Eye size; shoulder size; eye/shoulder ratio; ommatidia number.
- https://doi.org/10.7554/eLife.00380.018
Figure 4—figure supplement 1
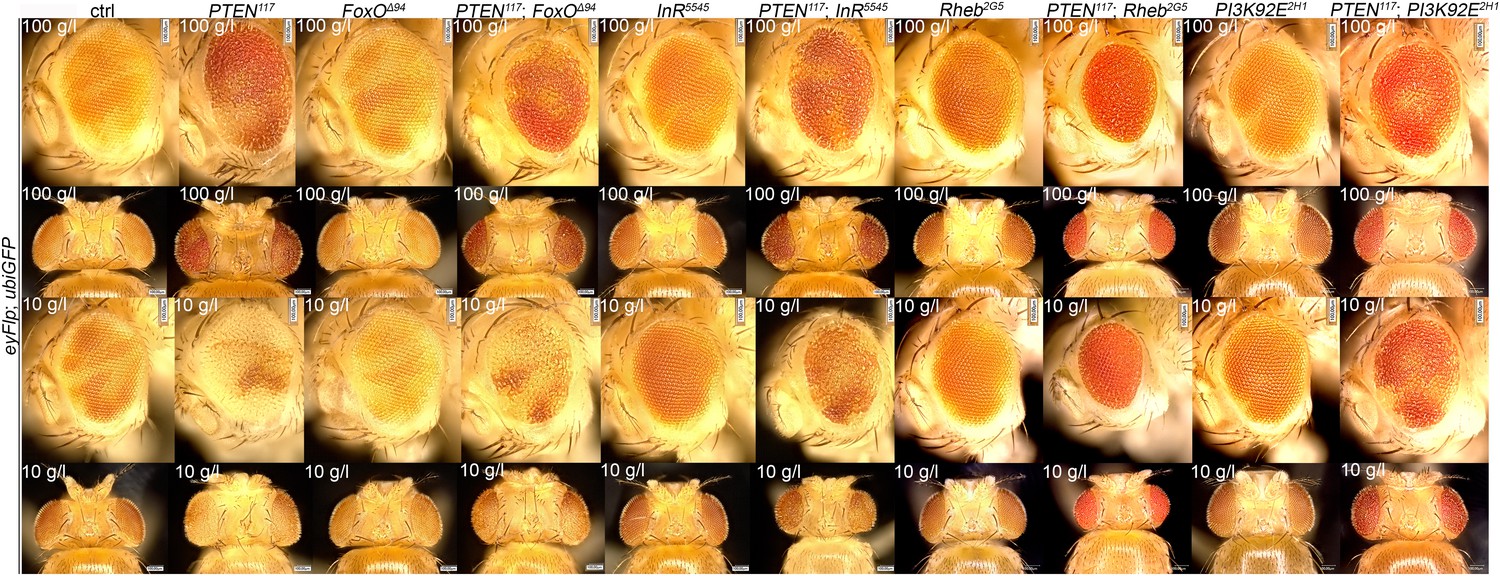
Genetic interactions between PTEN and IIS/TOR signaling components.
Comparison of adult eyes bearing clones mutant for InR, FoxO, Rheb, PI3K92E, PTEN or combinations of PTEN with InR/FoxO/Rheb/PI3K92E under 100 g/l and 10 g/l yeast food conditions. Removal of FoxO slightly suppresses the overgrowth phenotype of PTEN mutant tissue under starvation. Similarly, a partial suppression is observed in PTEN InR and PTEN PI3K92E double mutants. Complete suppression is observed in PTEN Rheb double mutants.
Figure 4—figure supplement 2
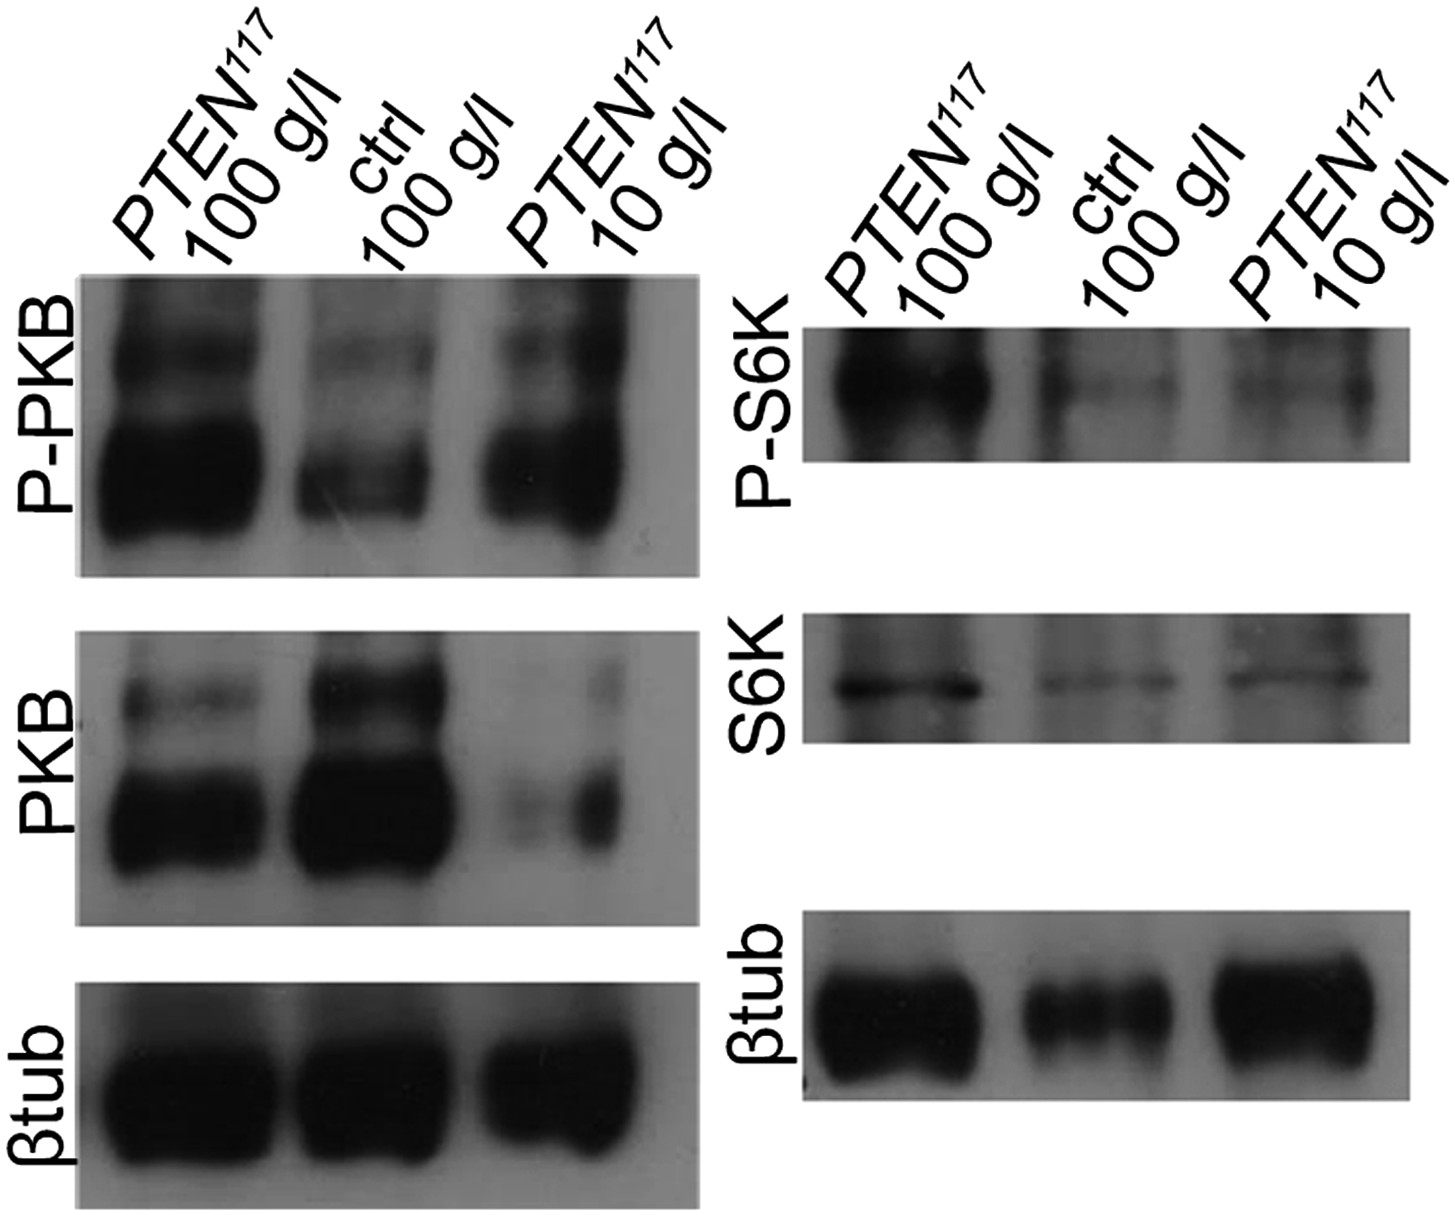
Insulin and TOR signaling is modulated in PTEN clones in response to starvation.
Western blots on eye imaginal disc tissue. On the left: PTEN mutant discs have strongly elevated P-PKB levels. Upon starvation, P-PKB levels are reduced but still much higher than in the control under normal conditions. Surprisingly, PKB levels are strongly reduced in the PTEN mutant tissue under starvation. On the right: PTEN mutant discs display high levels of P-S6K that strongly drop in starved animals. β-Tubulin served as loading control.
Figure 4—figure supplement 3
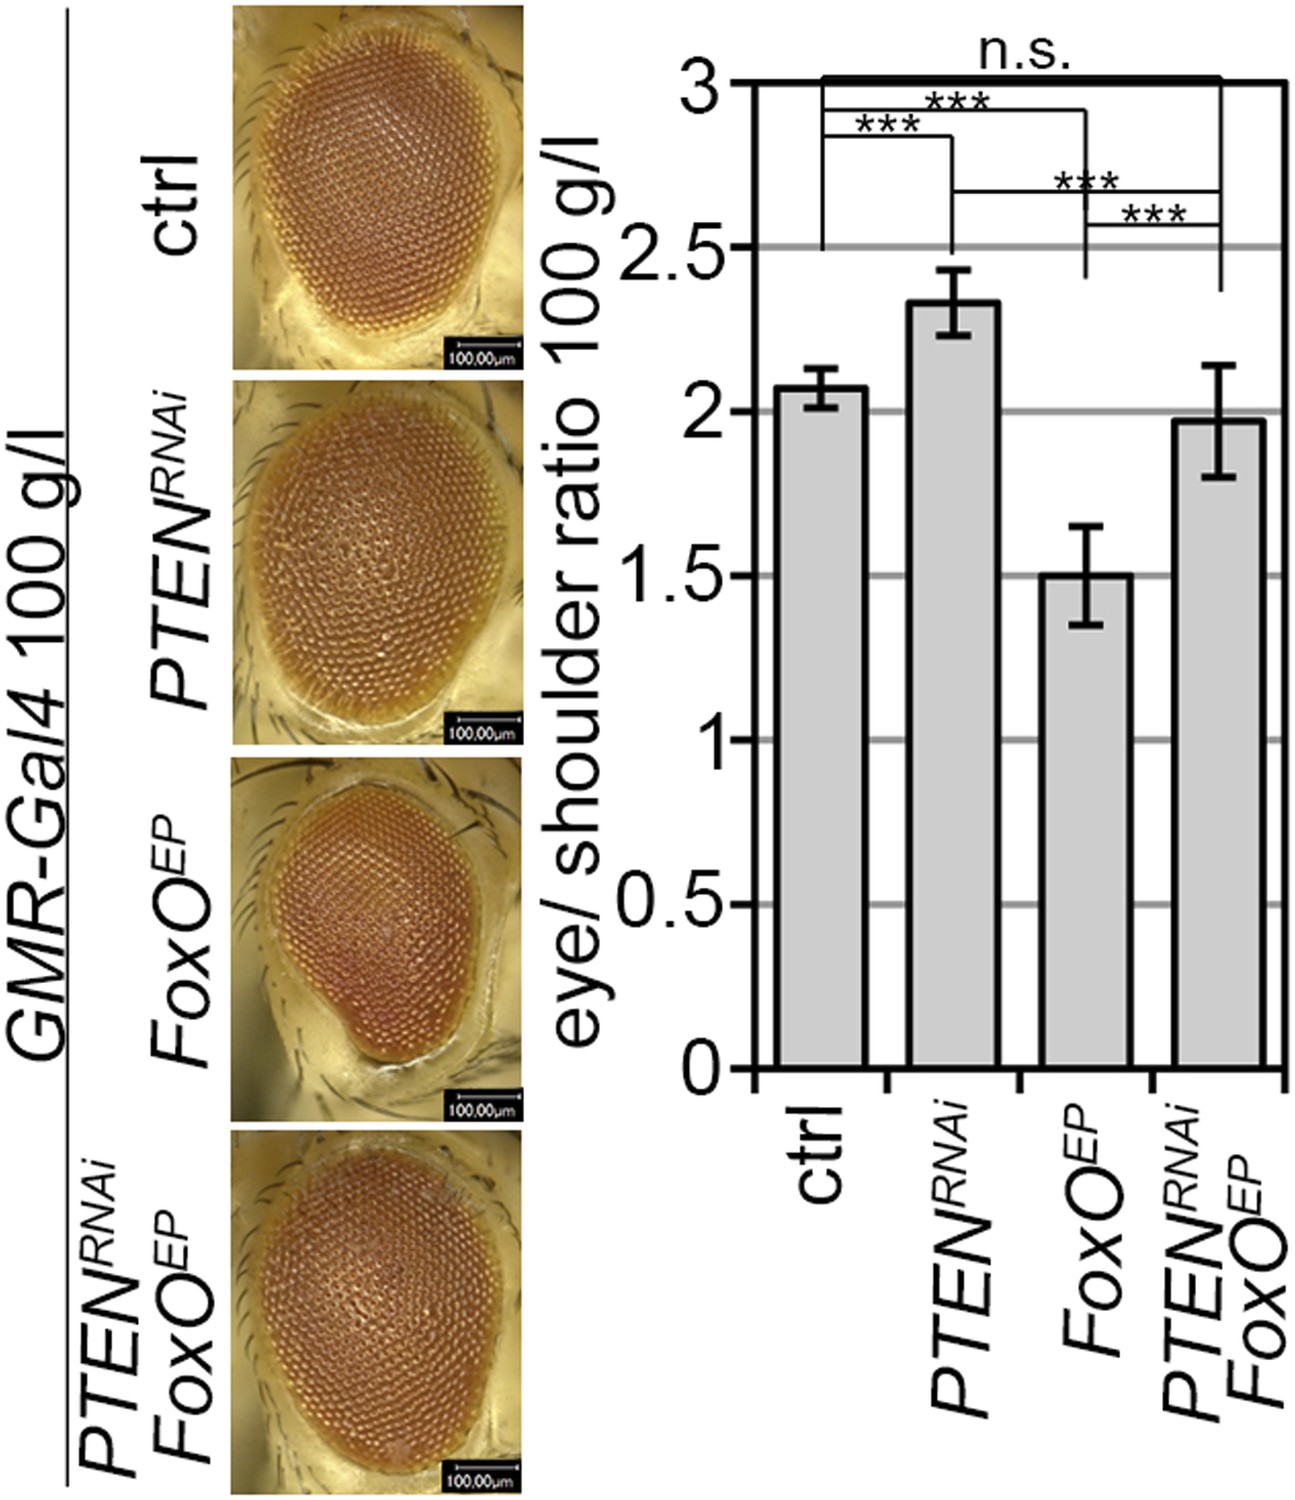
The effects of PTEN knockdown and FoxO overexpression neutralize each other.
GMR-Gal4 mediated expression of PTEN-RNAi, FoxO or both under 100 g/l yeast food conditions and quantification of the eye size normalized to shoulder size.
Figure 4—figure supplement 4
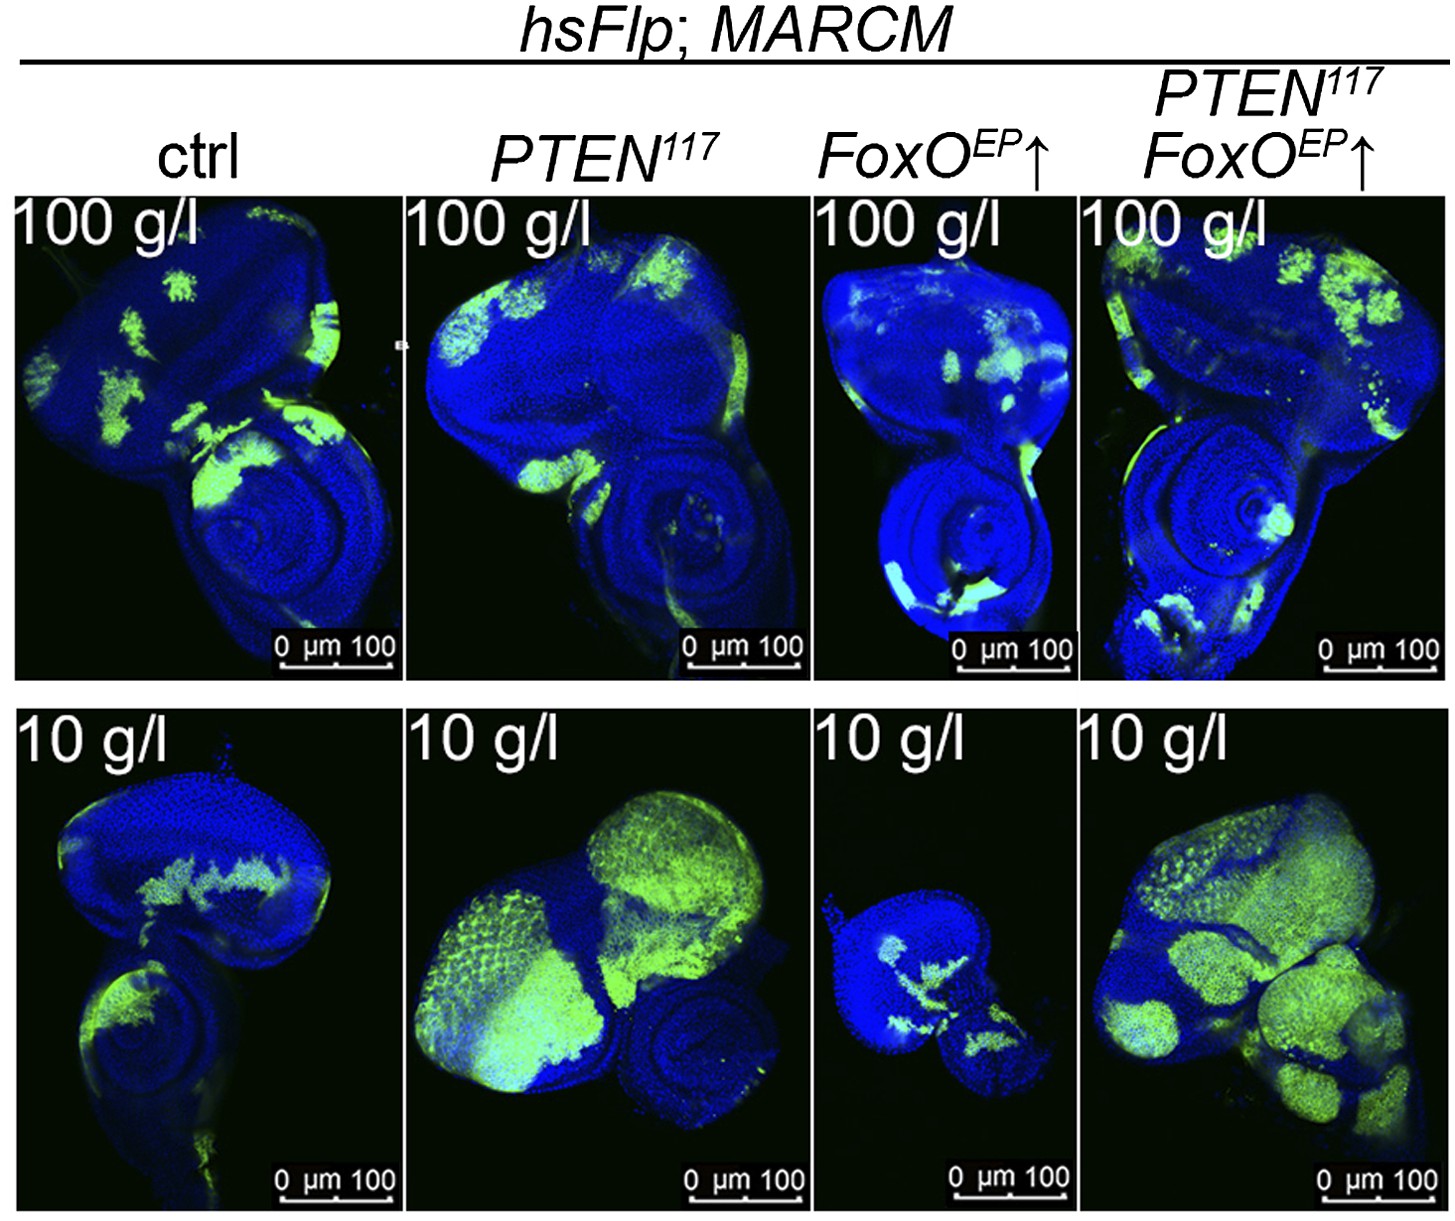
Overexpression of FoxO does not suppress PTEN mutant overgrowth.
Overexpression of FoxO in PTEN clones (MARCM system, positively marked by GFP) does not suppress the PTEN mutant tissue overgrowth under both under normal and starvation conditions.
Figure 4—figure supplement 5
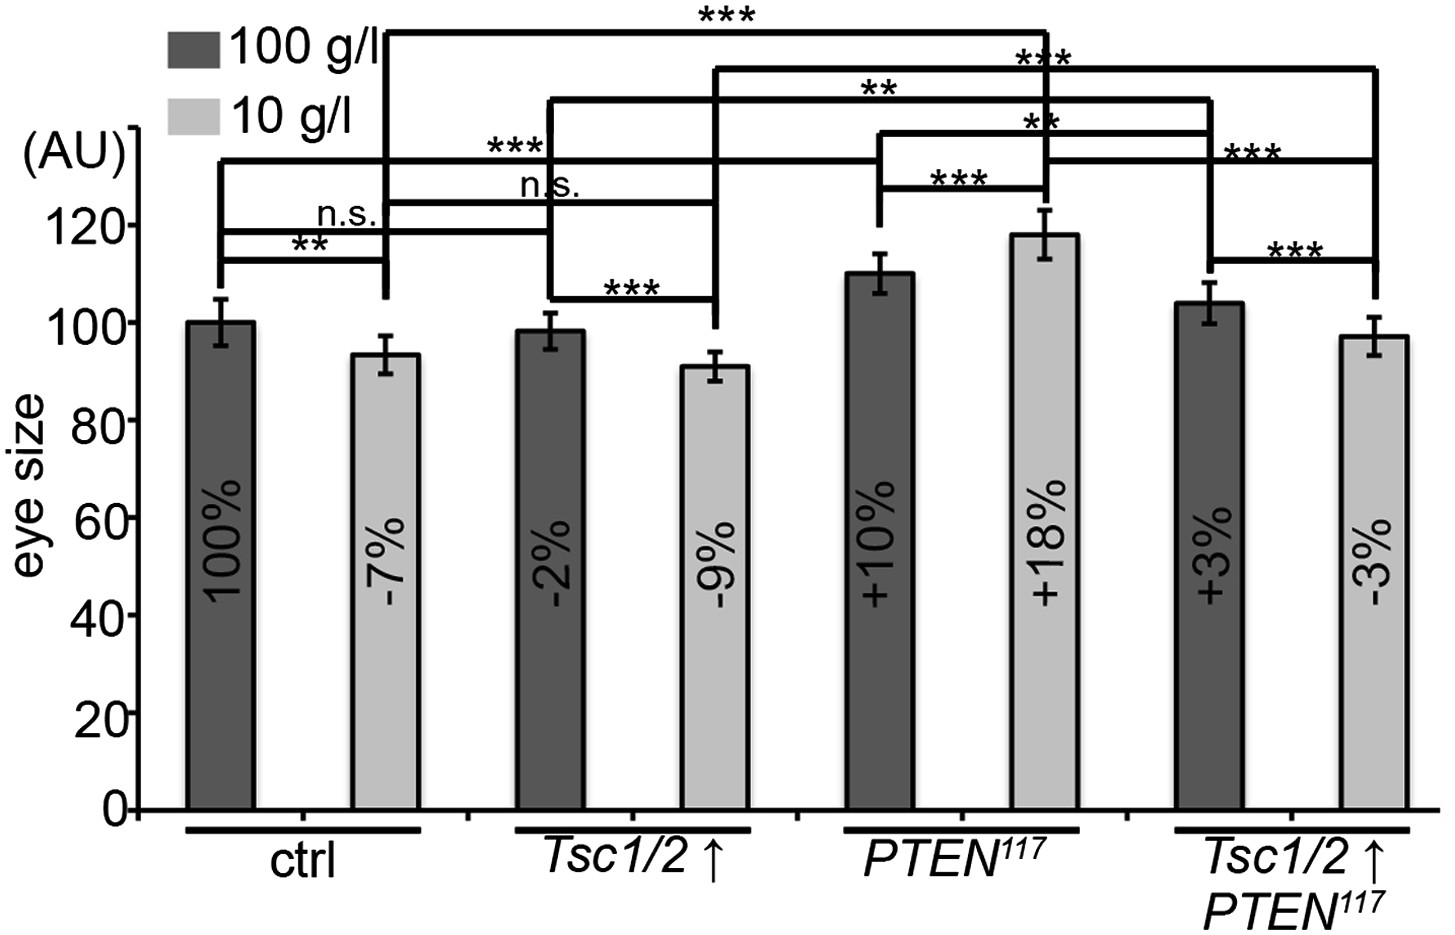
PTEN clones require TORC1 activity to overgrow.
Size measurements of eyes bearing PTEN and control clones co-expressing Tsc1/2 of animals reared on 100 g/l and 10 g/l yeast food.
Figure 4—figure supplement 6
Reducing TORC1 activity suppresses PTEN mutant overgrowth.
Overexpression of Tsc1/2 in PTEN clones (positively marked by GFP) suppresses the overgrowth phenotype without reducing the P-PKB levels (red).
Figure 4—figure supplement 7
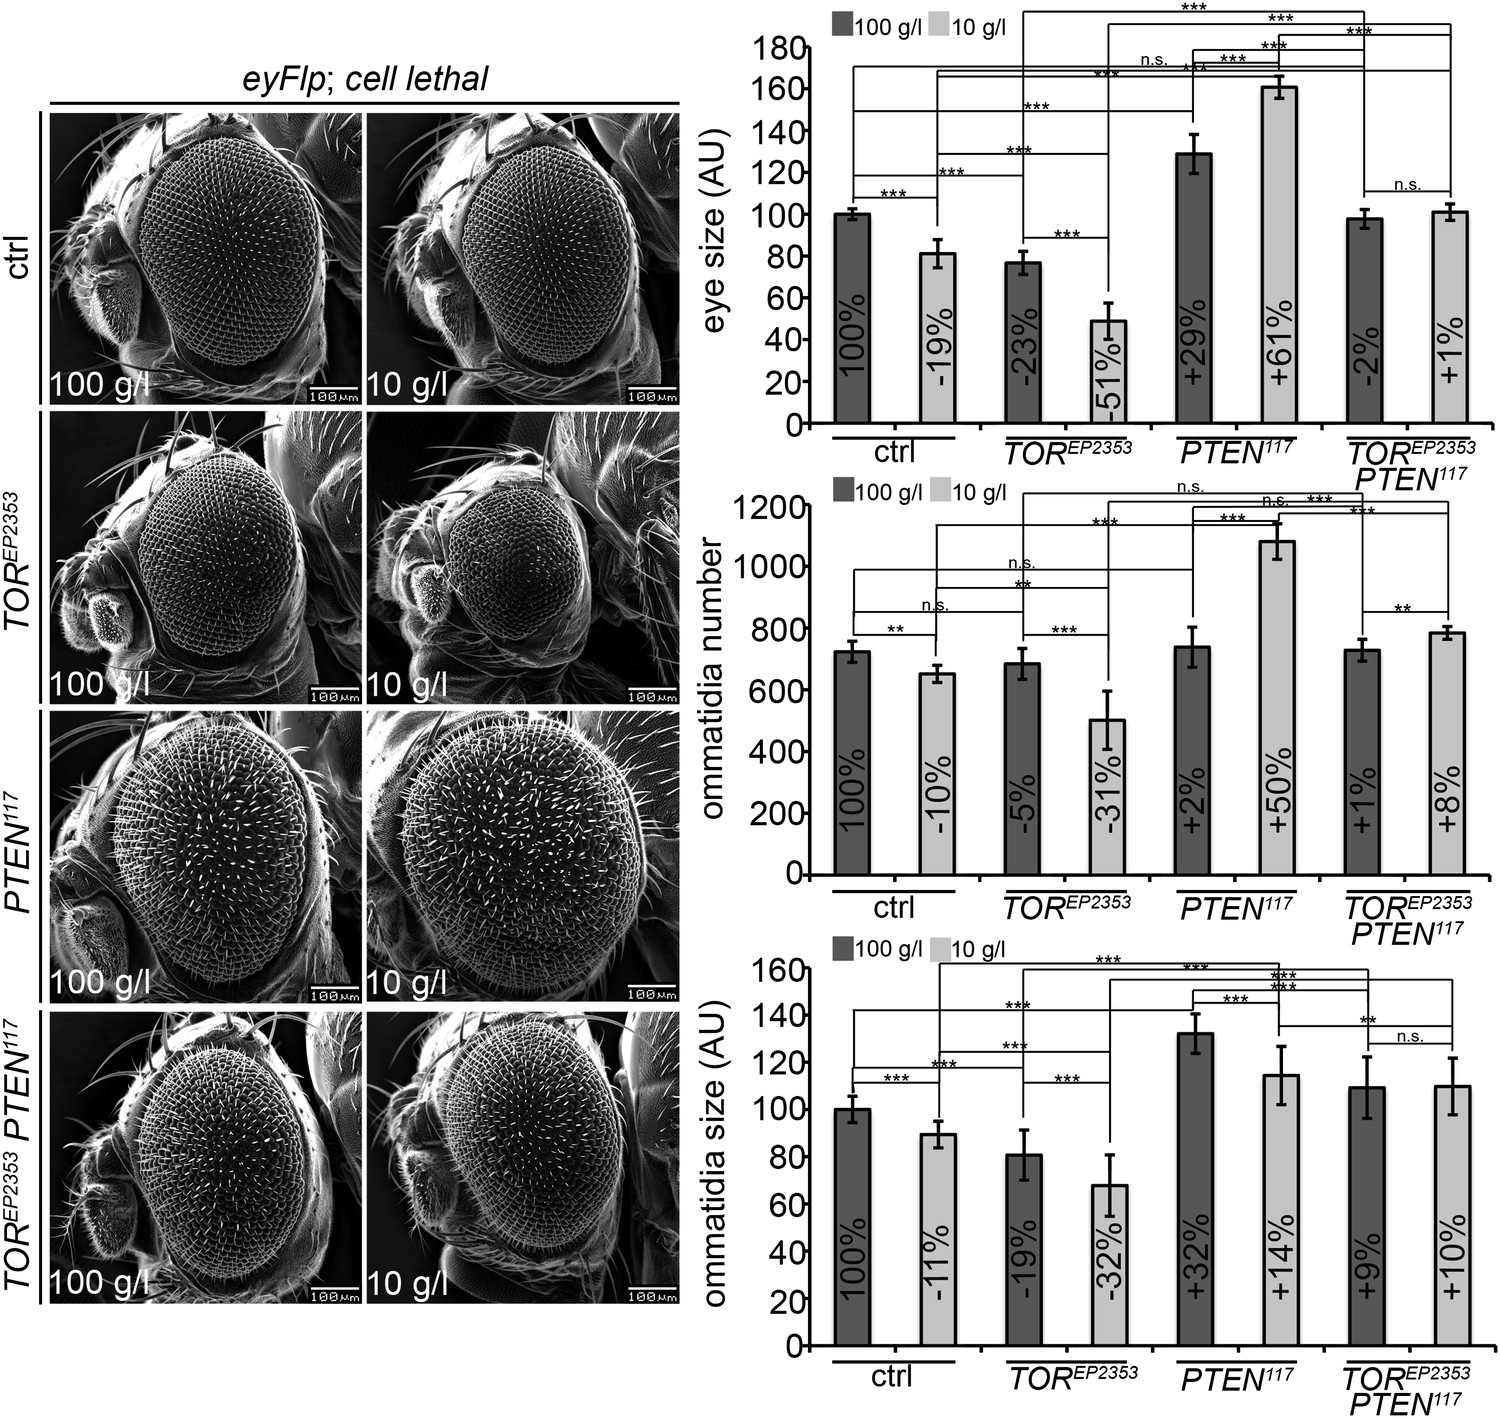
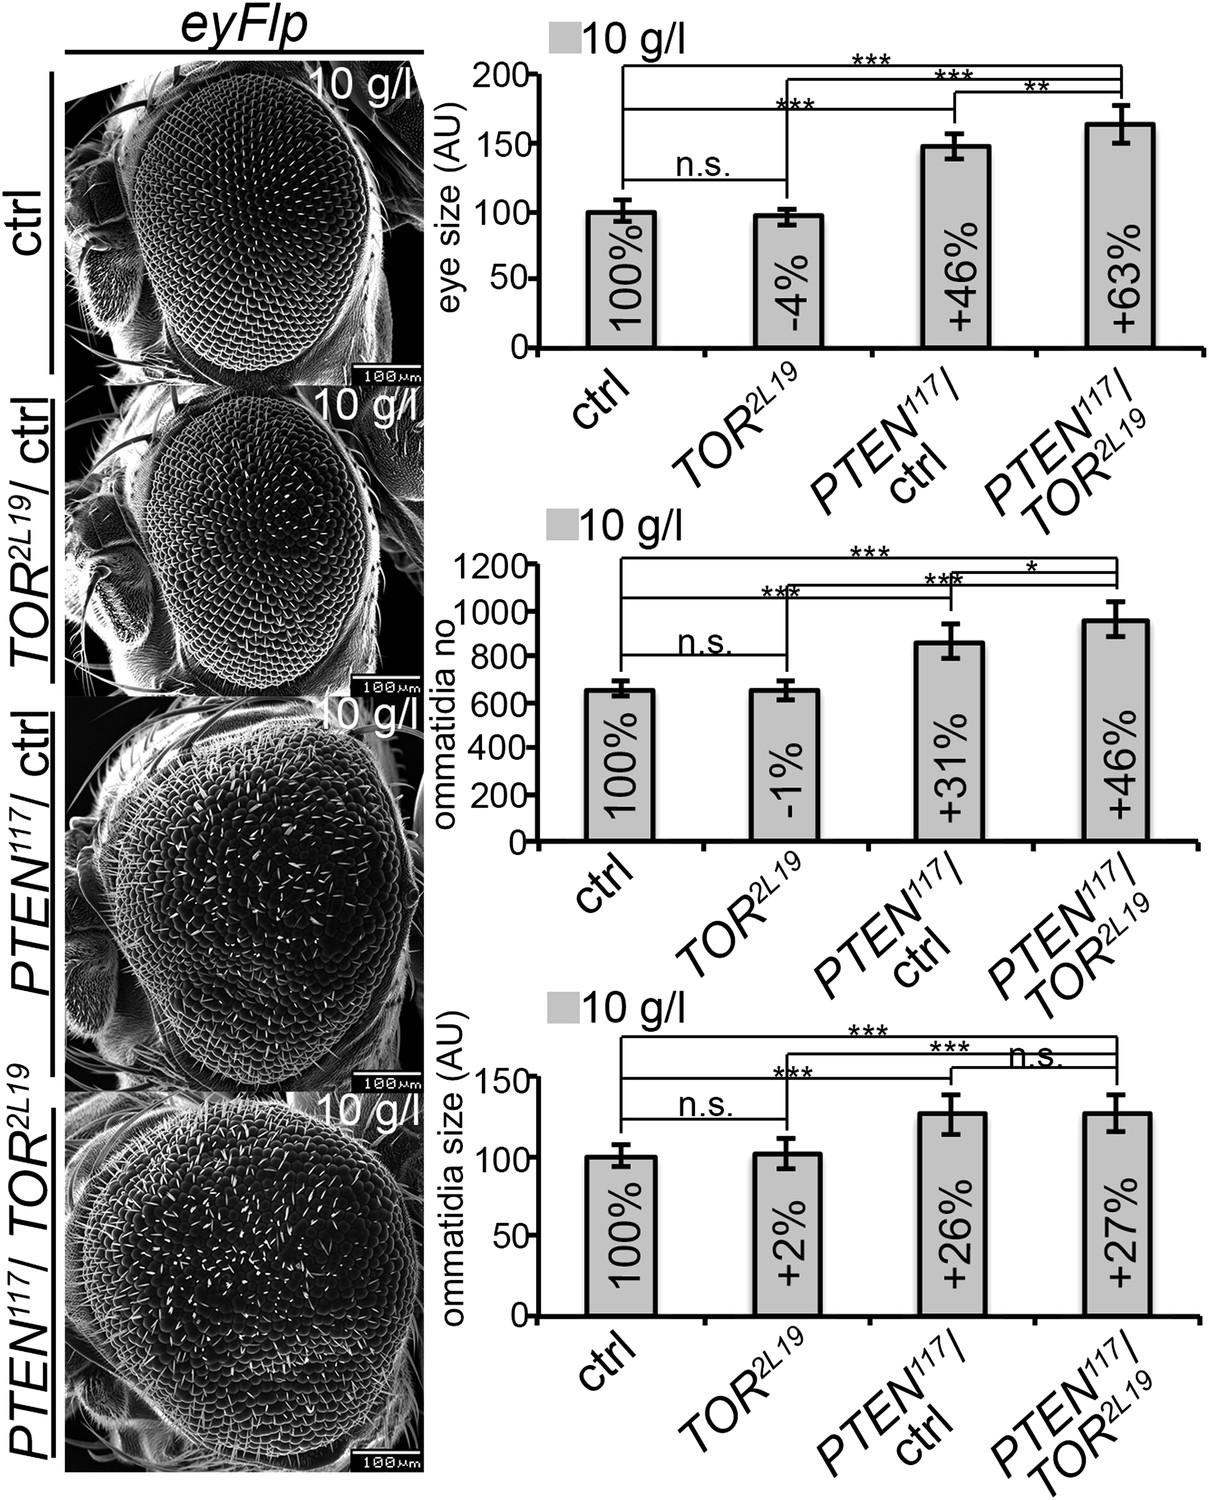
PTEN mutant cells require TORC1 activity to acquire a proliferative advantage under starvation.
Scanning electron micrographs of eyes generated with the eyFlp/FRT cell lethal system and almost exclusively composed of PTEN, TOR, PTEN TOR mutant or control tissue of animals reared on 100 g/l and 10 g/l yeast food, respectively. On the right side: Quantification of eye size, ommatidia number and ommatidia size. Note that the PTEN TOR double mutant eyes are very convex. As the projection of the eye onto the plane of the picture is measured, the indicated eye size is an underestimate.
Figure 5 with 3 supplements
PTEN mutant tissue critically depends on the amino acid transporter Slimfast.
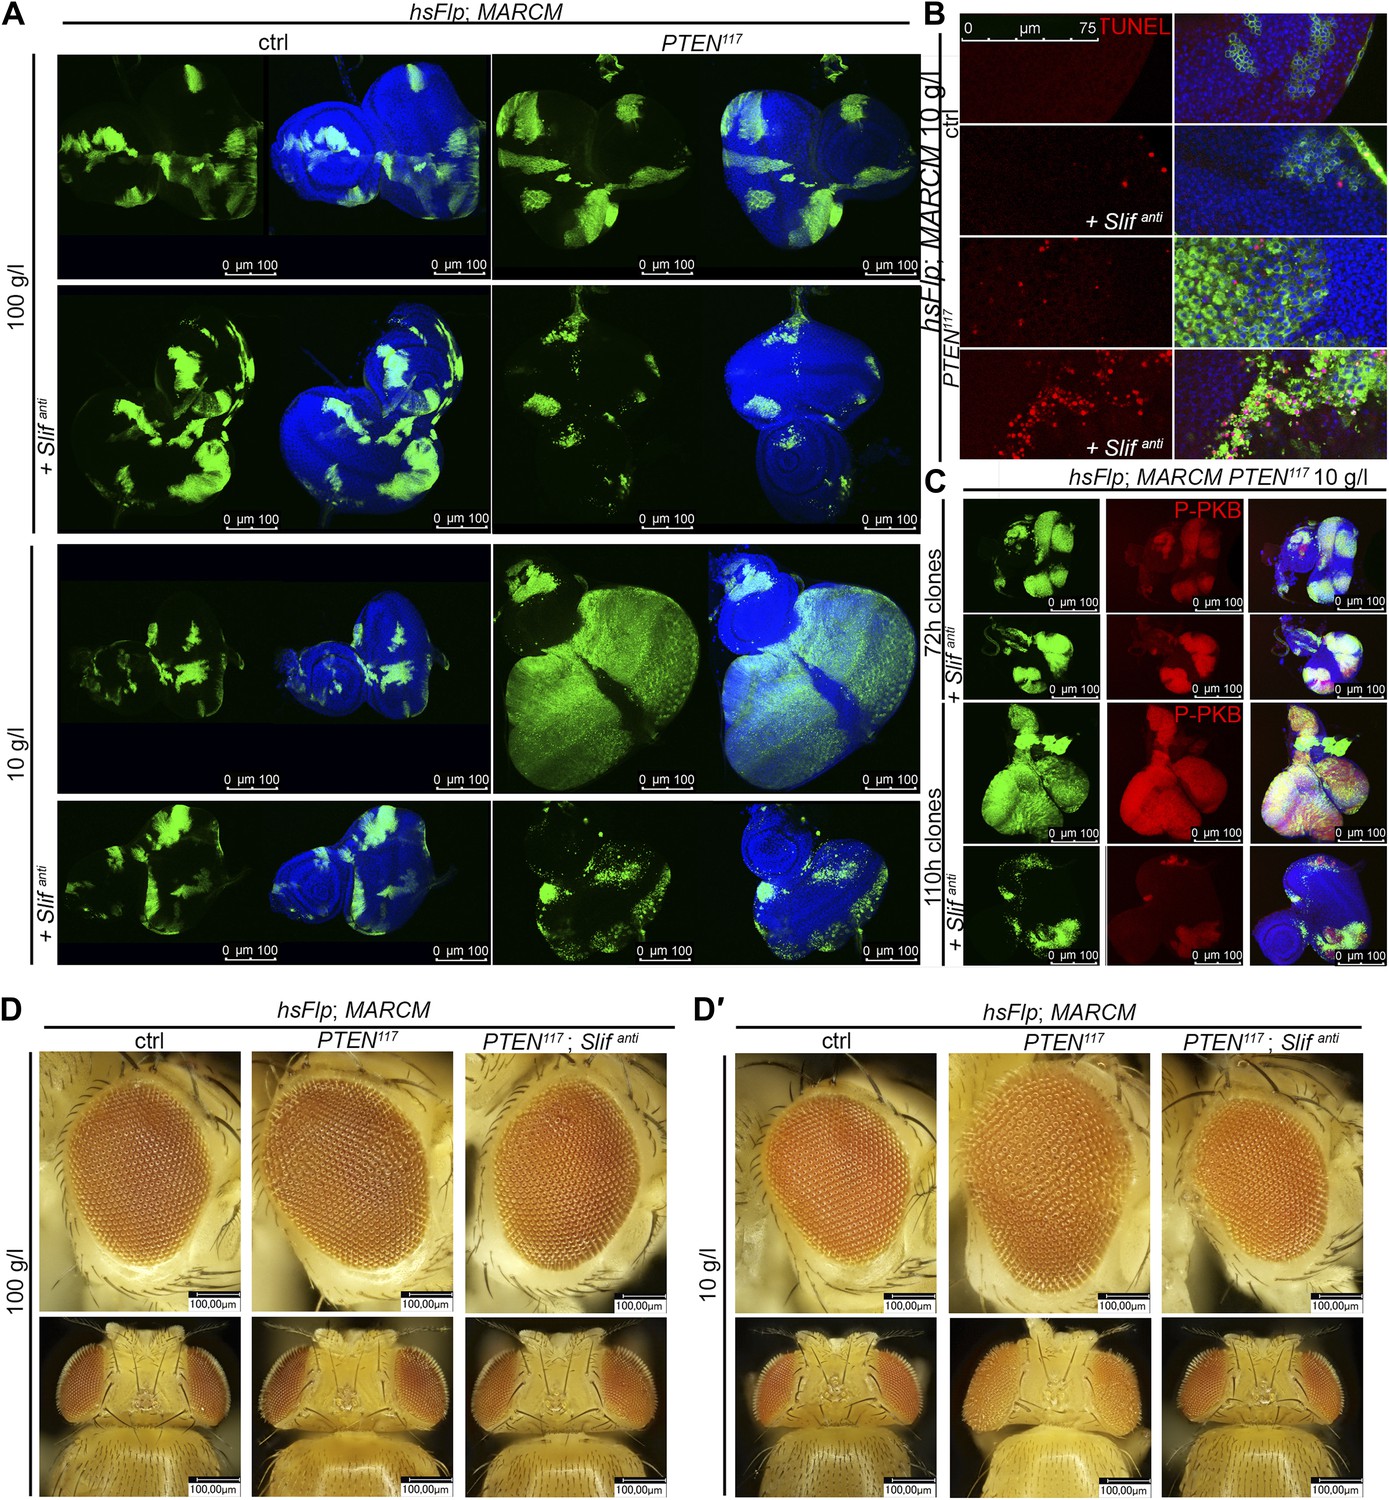
(A) PTEN clones co-expressing Slifanti collapse and disappear under starvation, whereas Slif reduction does not affect control clones. (B) TUNEL staining reveals high apoptosis levels (in red) in cells with Slifanti expression. Reducing the levels of Slif eliminates PTEN mutant cells by apoptosis. (C) Dying 110 hr-old PTEN clones expressing Slifanti lose the P-PKB signal (red), although they initially overproliferate (72 hr-old clones) indistinguishably from PTEN mutant tissue. (D and D′) Adult eyes with unmarked control, PTEN and PTEN plus Slifanti clones under standard (D) and starvation conditions (D′). The reduction of Slif levels rescues the overgrowth associated with PTEN mutant eyes, especially under starvation conditions. All clones in the discs are positively marked by GFP.
Figure 5—figure supplement 1
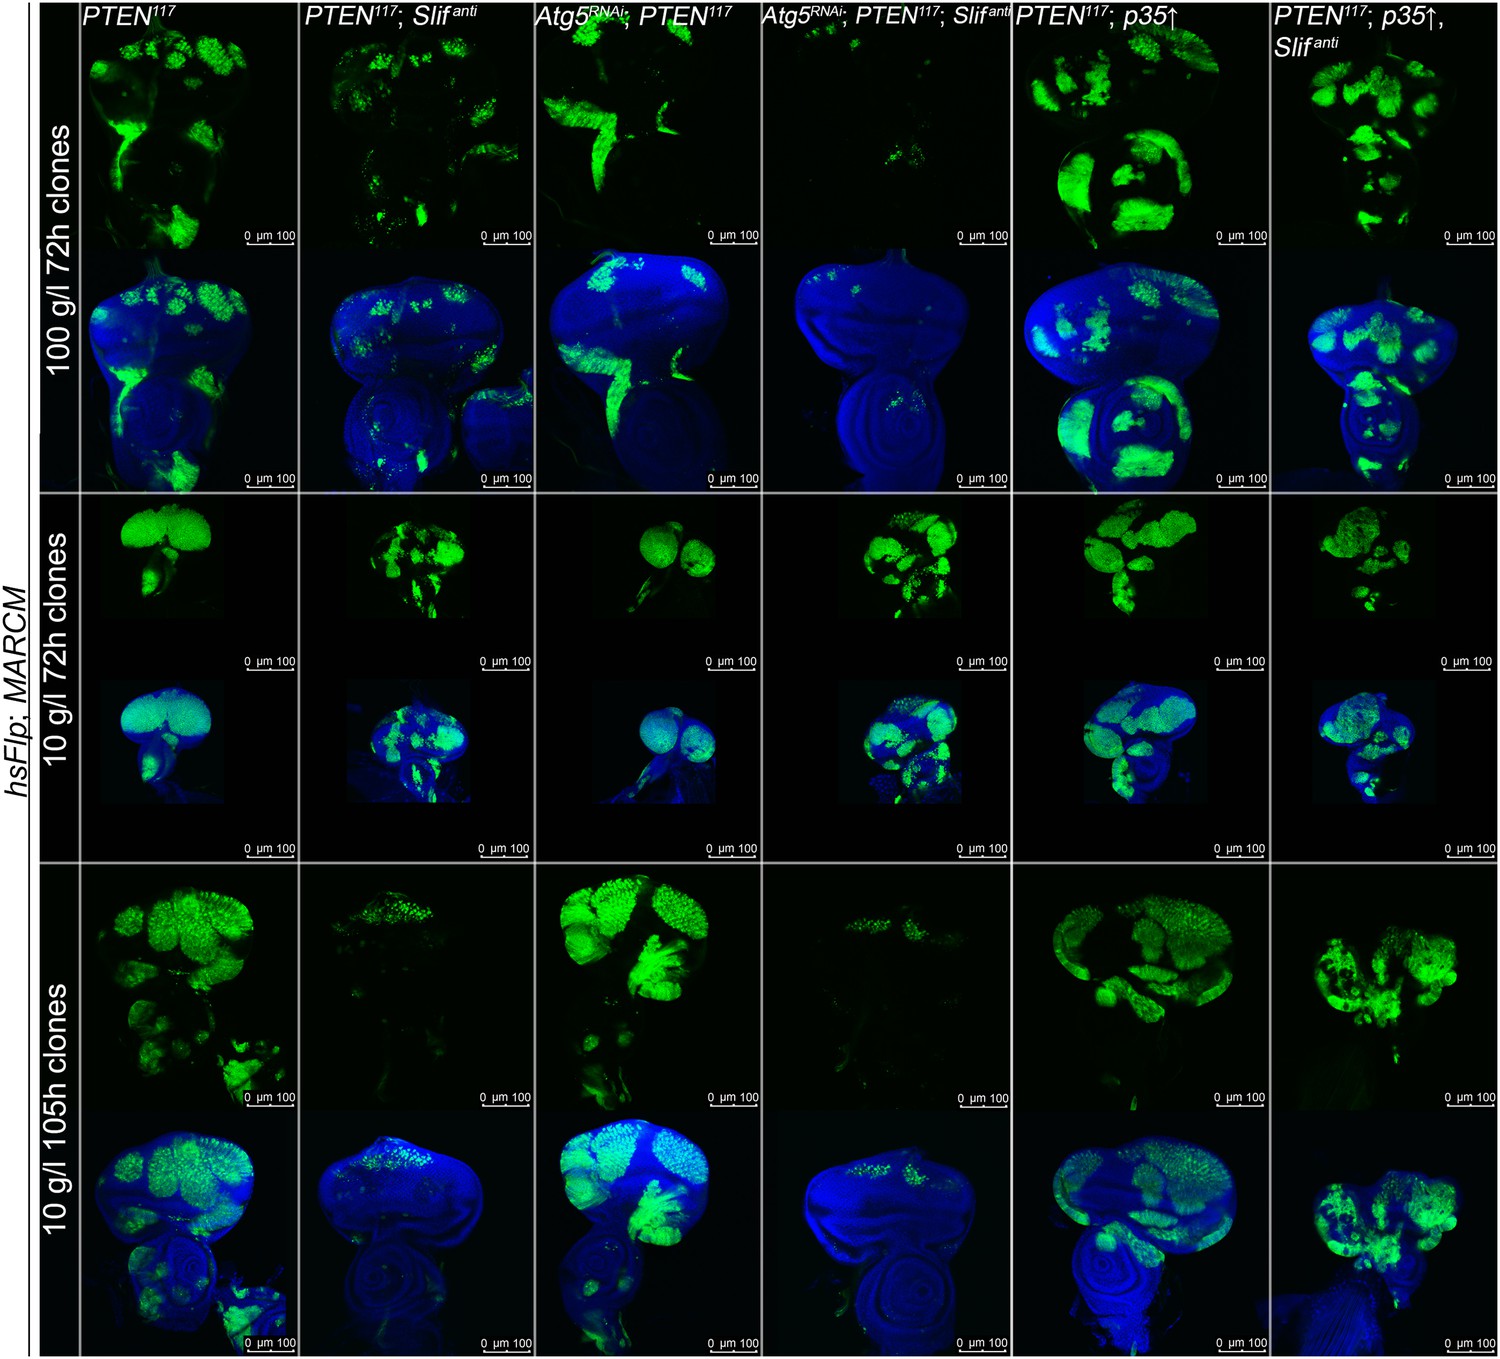
Autophagy does not contribute to the initial survival of PTEN clones with reduced Slif levels under starvation.
Inhibiting autophagy (by means of Atg5-RNAi) in PTEN clones with reduced Slif function (positively marked by GFP) neither impacts on their initial overgrowth nor on their later collapsing under starvation. Blocking apoptosis (by means of p35 expression) in PTEN clones with reduced Slif (positively marked by GFP) prevents the PTEN mutant cells from being eliminated.
Figure 5—figure supplement 2
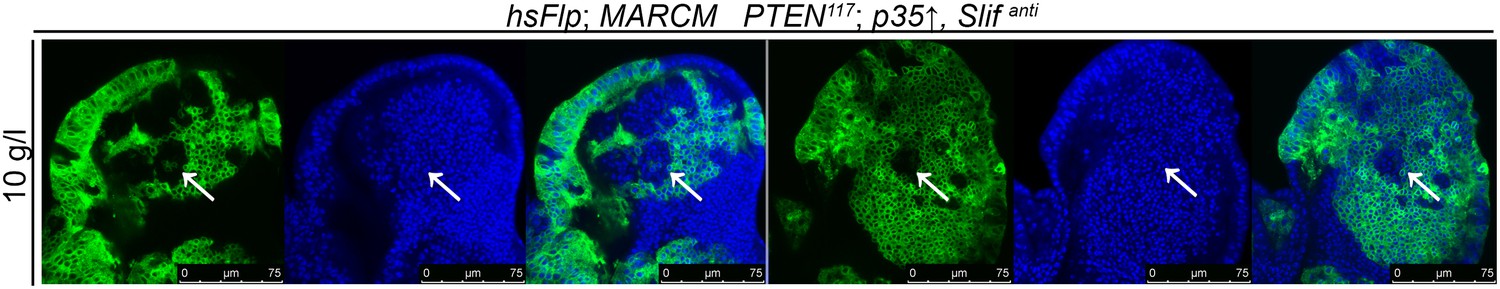
Inhibition of cell death in PTEN clones with reduced Slif prevents the initial collapsing in eye discs.
Higher magnification pictures of the undead PTEN mutant cells. Some large (and thus PTEN mutant) cells have lost GFP expression (white arrows).
Figure 5—figure supplement 3
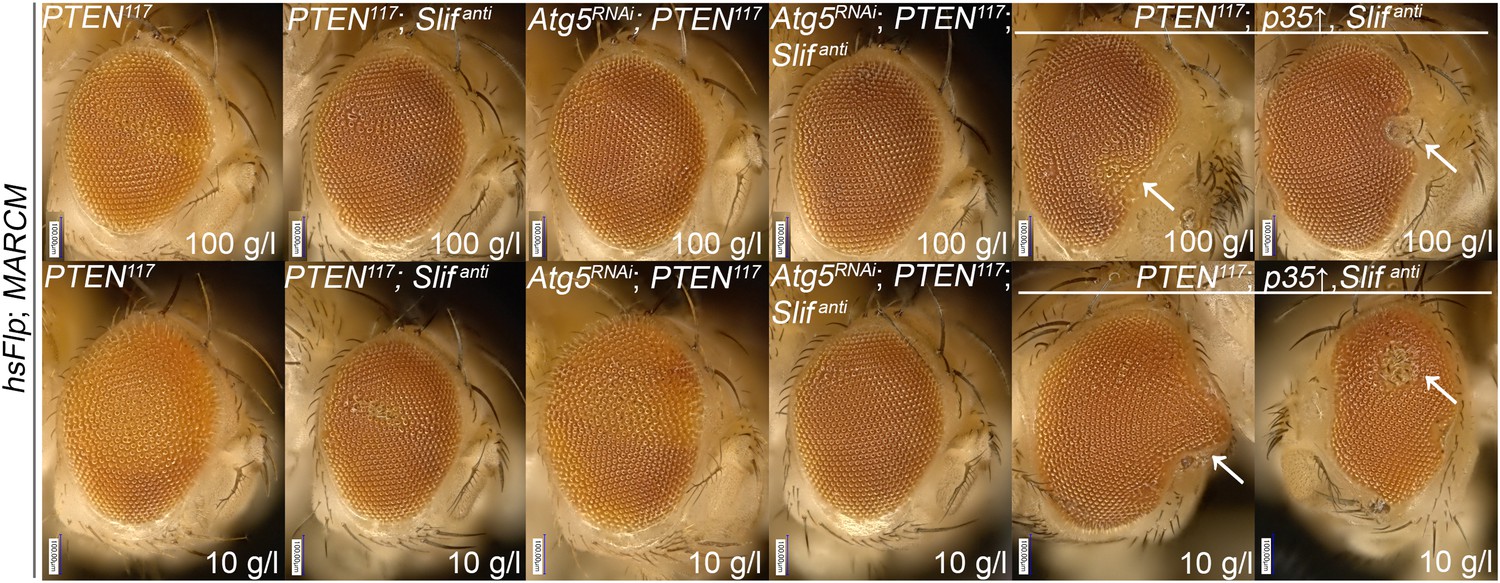
Blocking autophagy and apoptosis in PTEN clones with reduced Slif does not prevent them from dying.
Adult eye phenotypes of the clones shown in figure supplement 1. PTEN clones with reduced Slif function are not recovered in adult eyes upon inhibition of autophagy or apoptosis under starvation conditions. White arrows indicate malformations reminiscent of the collapsed clones.
Figure 6 with 1 supplement
Systemic effects of PTEN clones on peripheral tissues.
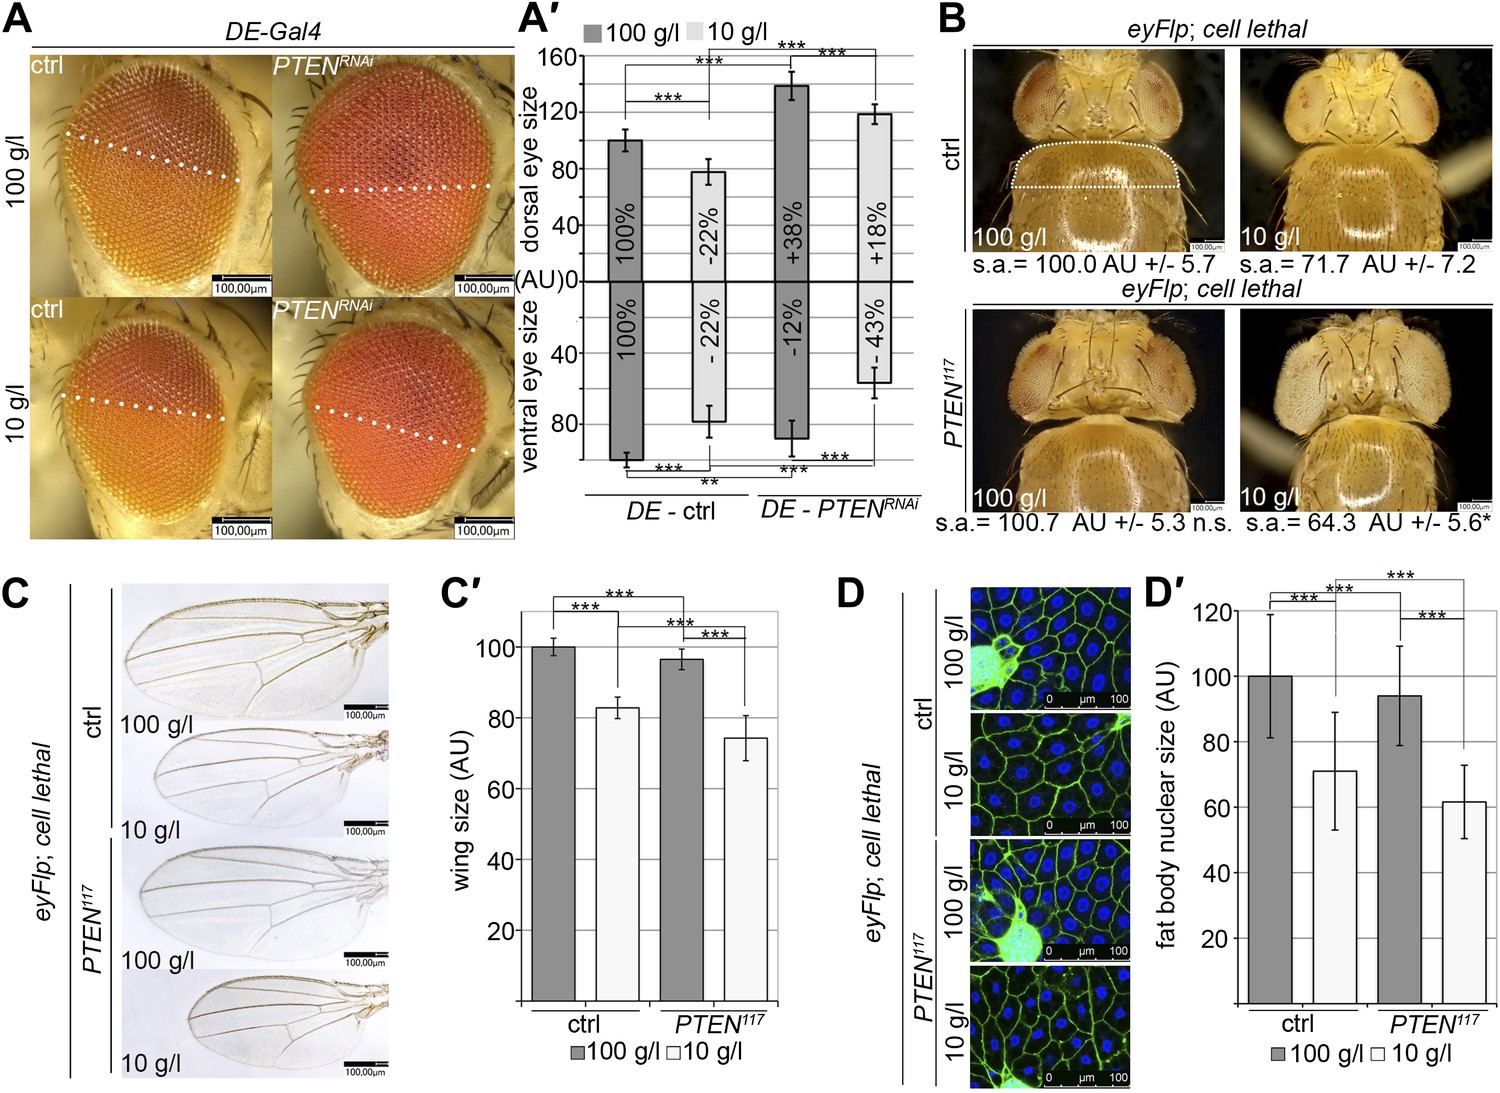
(A) PTEN was knocked down in the dorsal part of the eye by means of DE-Gal4. (A′) Quantification of the sizes of the ventral and dorsal halves. Percentage indicated in the bars represents the size reduction with respect to the respective part of control eyes under normal conditions. (B) Flies with PTEN mutant heads have smaller bodies as judged by shoulder area (s.a.) under starvation conditions. (C) Wings of flies with PTEN mutant heads under starvation are smaller than wings of control flies. (C′) Quantification of the wings from (C). (D) Size of fat body nuclei of larvae with PTEN mutant eye discs is decreased under starvation as compared to the control. (D′) Quantification of nuclear size from (D). PTEN mutant heads were generated by the eyFlp/FRT cell lethal system. Statistical analyses were done with Student’s t-test (two tailed).
-
Figure 6—Source data 1
Dorsal eye size; shoulder size; wing size; nuclear size in fat bodies.
- https://doi.org/10.7554/eLife.00380.031
Figure 6—figure supplement 1
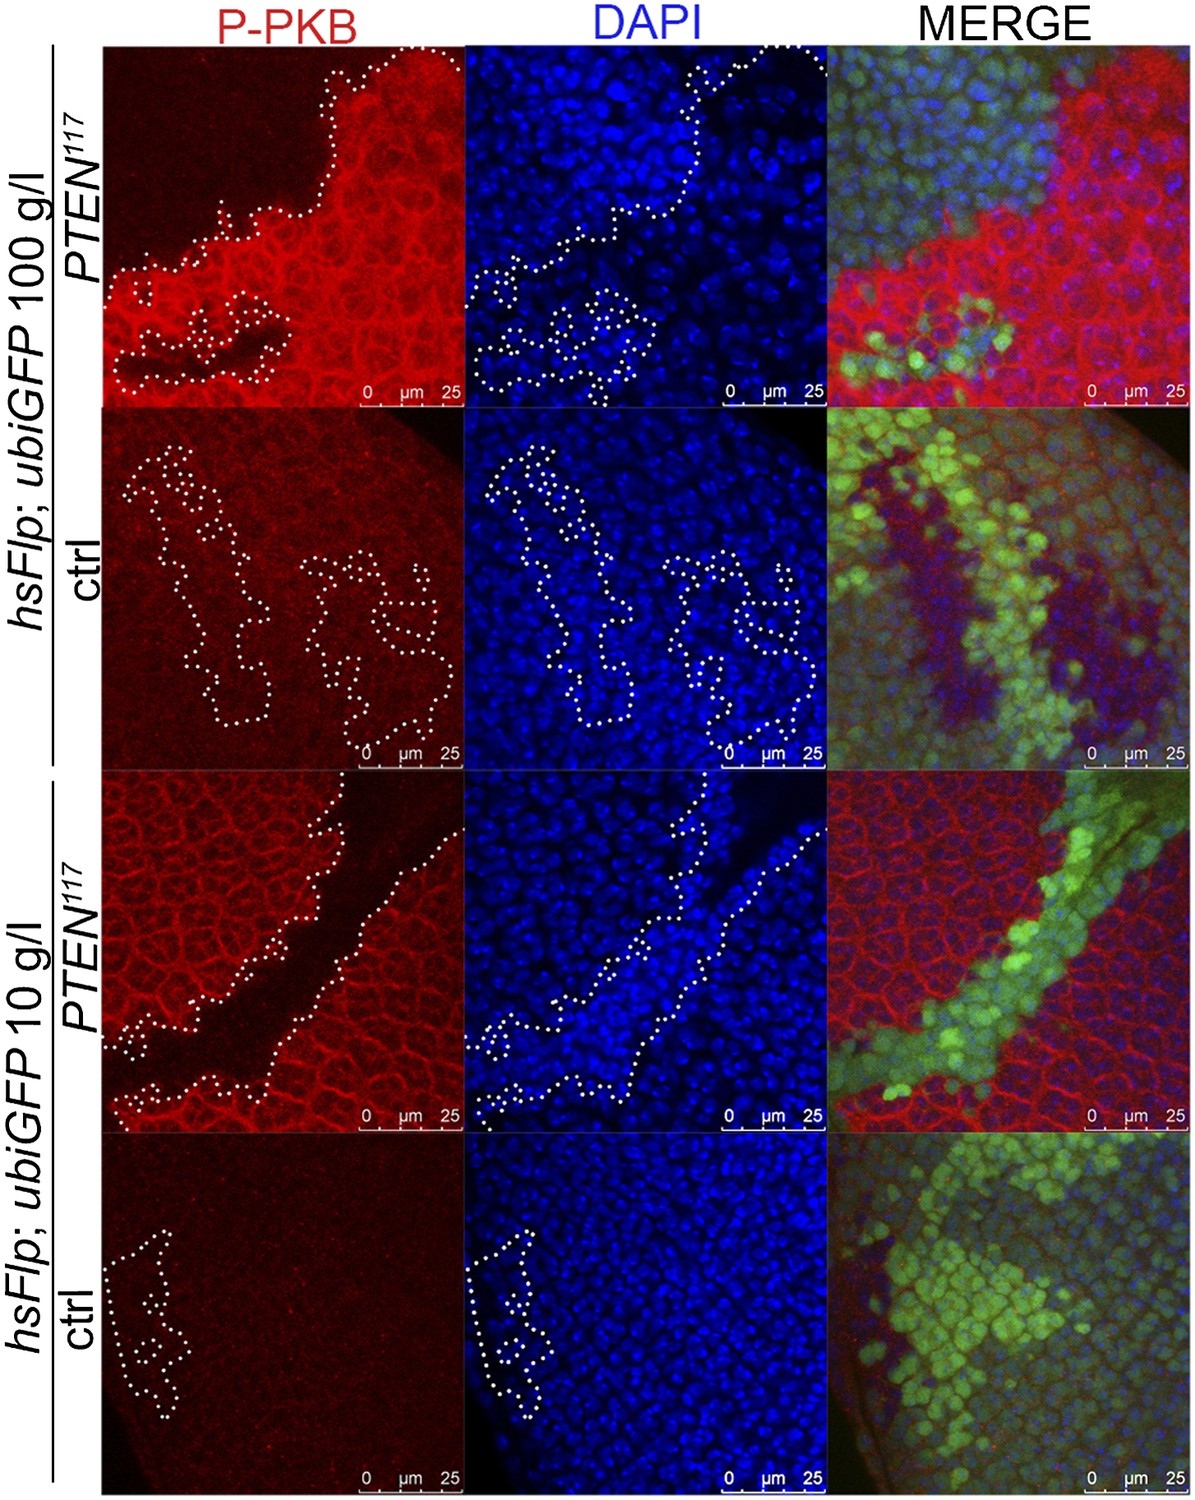
PTEN mutant tissue influences PKB signaling in the neighboring tissue.
The tissue surrounding PTEN clones (marked by the absence of GFP) displays a reduction in P-PKB levels (red) as compared to the tissue surrounding wild-type clones. Note that the nuclei of the cells adjacent to PTEN clones under starvation are more densely packed, indicative of a reduced cell size.
Figure 7 with 6 supplements
A reduction in growth signaling in the direct neighborhood and in peripheral tissues is required for the overgrowth of PTEN mutant cells.
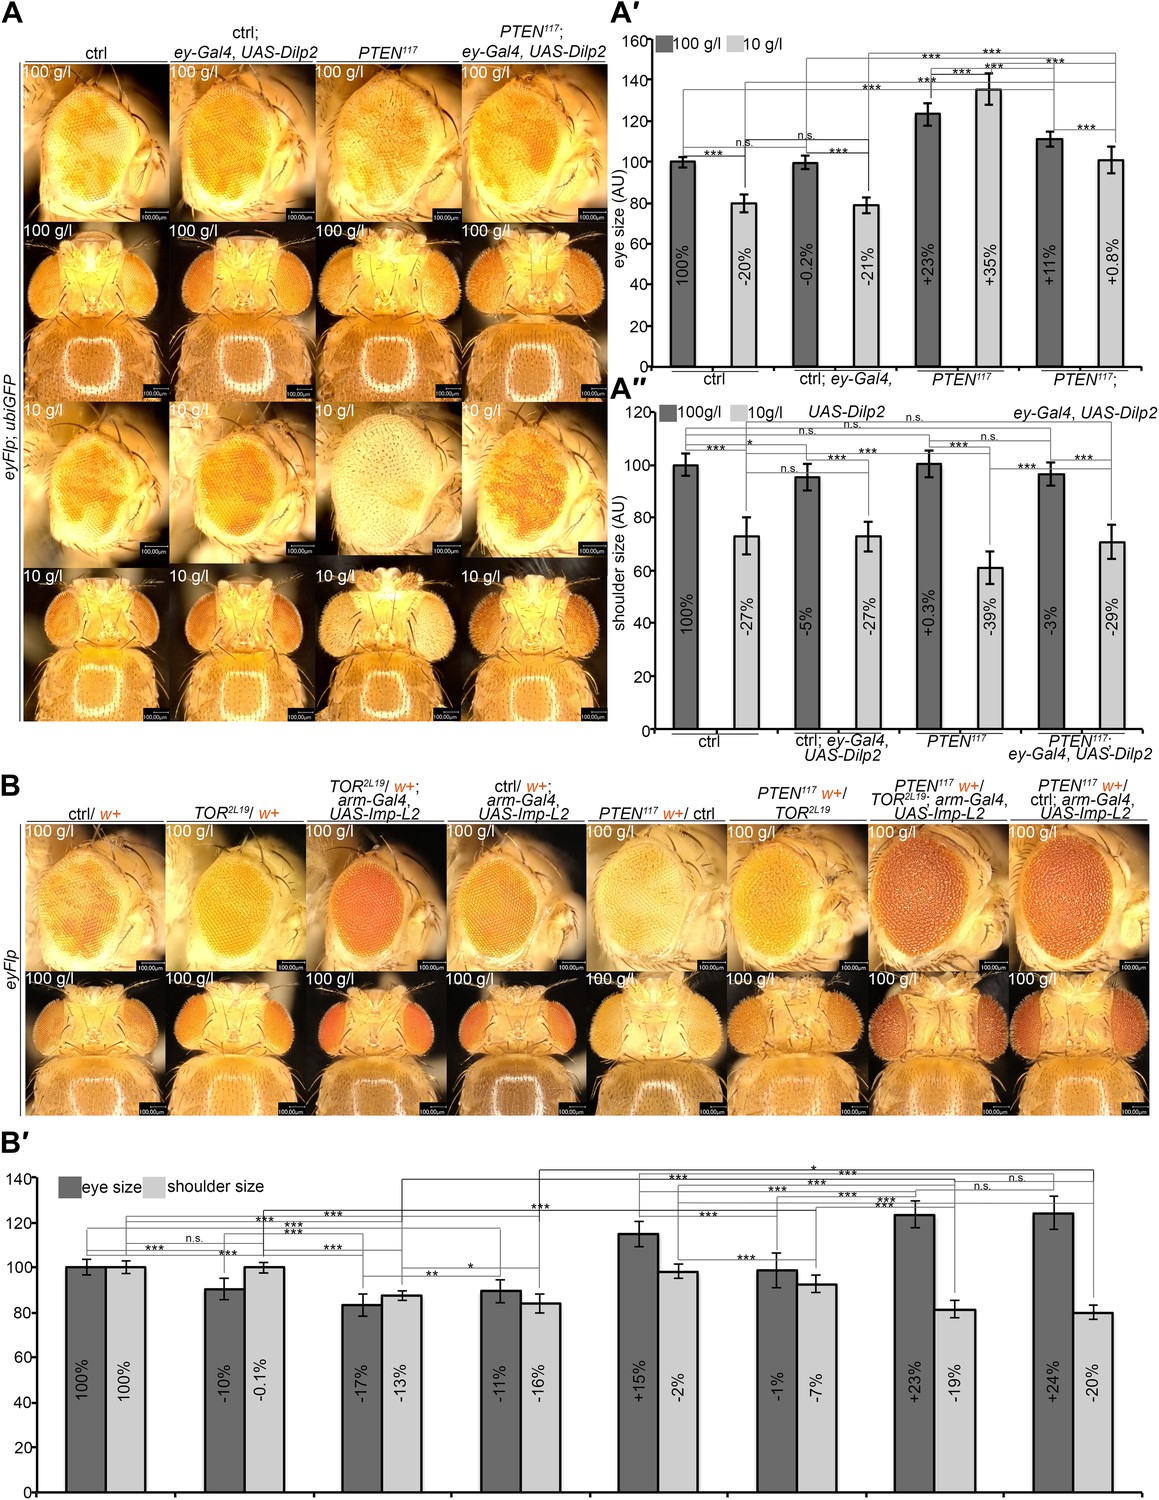
(A) Restoring insulin signaling by means of Dilp-2 expression (driven by ey-Gal4) suppresses the overgrowth of PTEN mutant cells under starvation. The eyes get smaller and the growth of the surrounding and the peripheral tissue is restored. The expression of Dilp-2 has no effect on control eyes. Quantification of eye size (A′) and shoulder area (A′′) from (A). (B) Systemic reduction of growth by ubiquitous expression of Imp-L2 with arm-Gal4 under standard conditions decreases the size of the control eyes but enhances PTEN mutant overgrowth. (B′) Quantification of eye size and shoulder area from (B).
-
Figure 7—Source data 1
Eye size, shoulder size; ommatidia number; ommatidia size.
- https://doi.org/10.7554/eLife.00380.034
Figure 7—figure supplement 1
Growth properties of PTEN mutant tissue are influenced by the neighboring tissue.
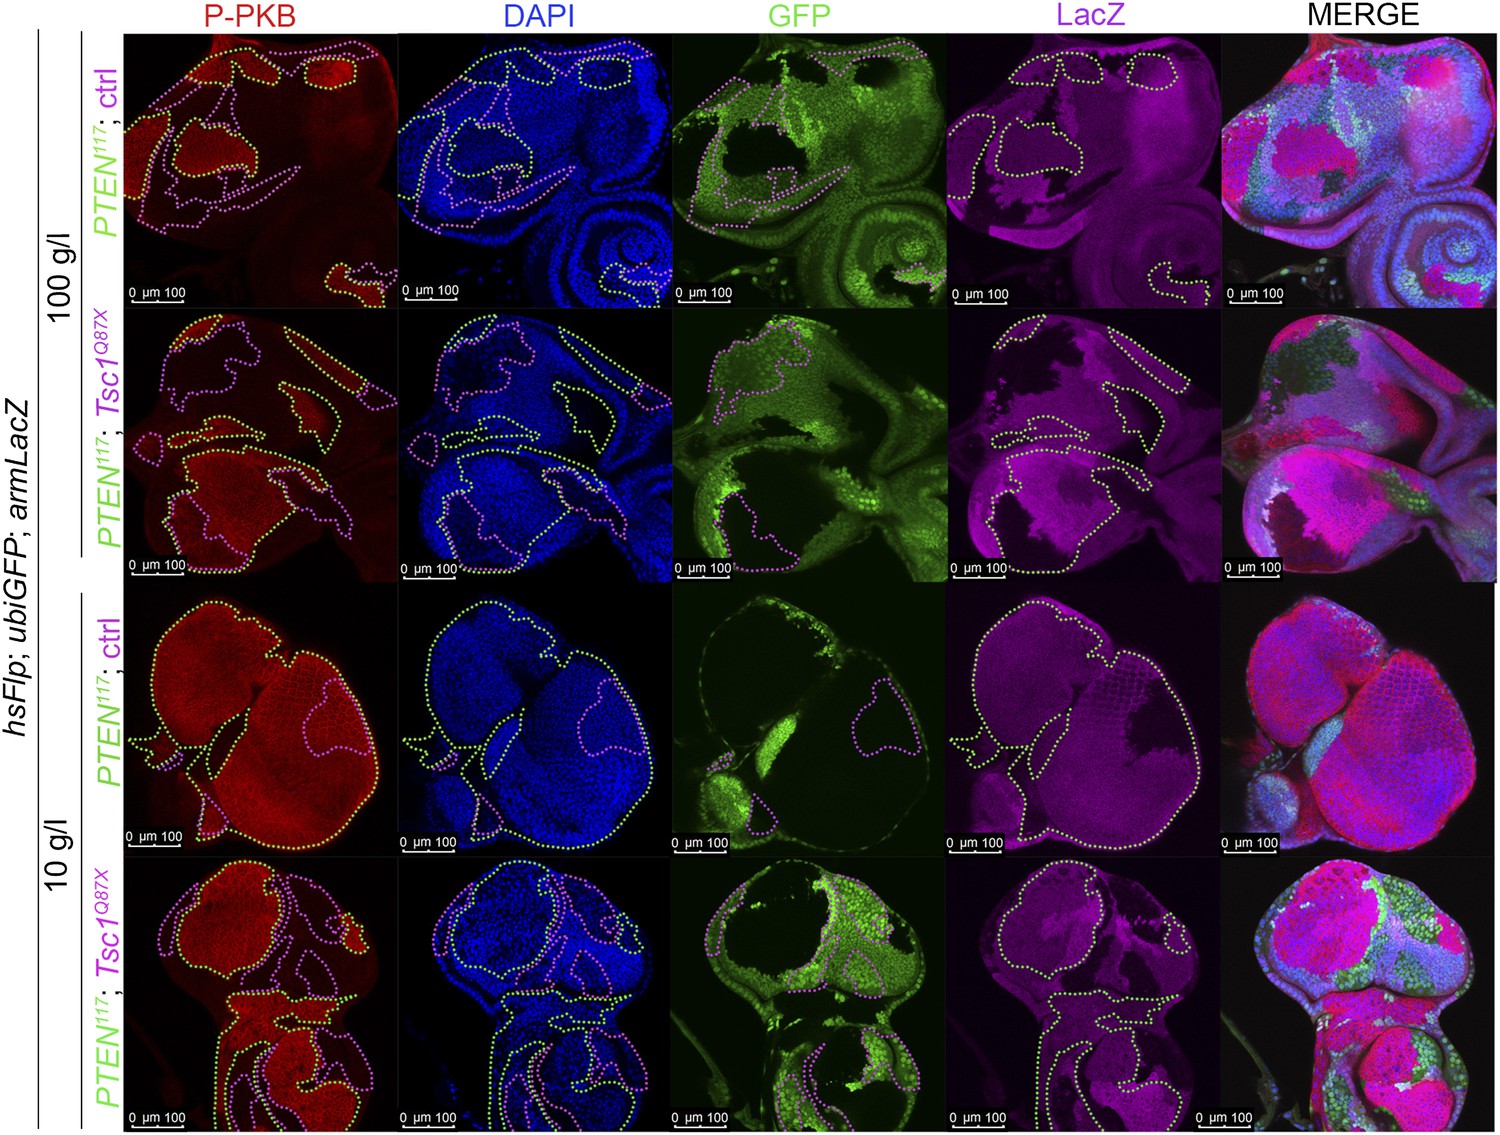
PTEN clones (marked by the absence of GFP) overgrow less under starvation when neighboring with Tsc1 clones (marked by the absence of LacZ, pink), indicating that both clonal populations compete for common resources.
Figure 7—figure supplement 2
Autonomous and non-autonomous effects of reducing TORC1 activity on the overgrowth of PTEN clones.
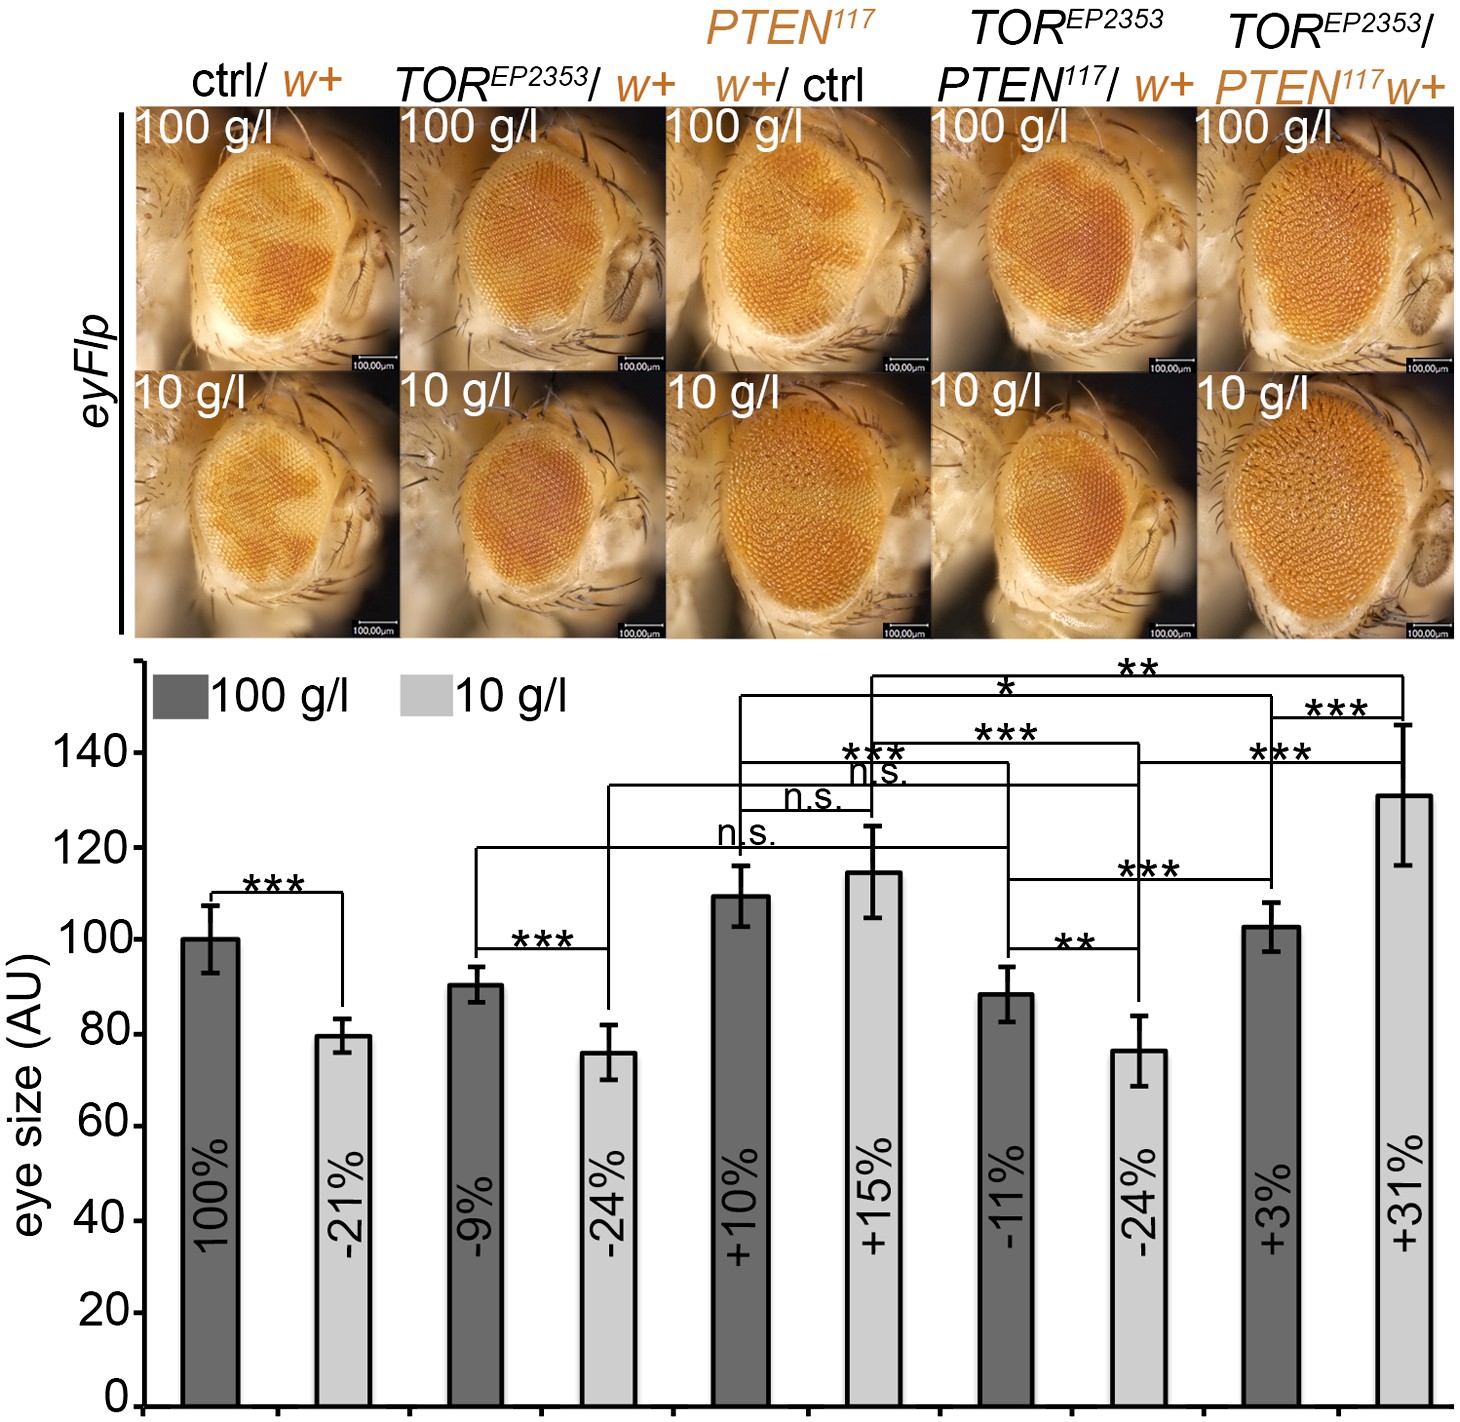
Reducing TORC1 signaling (using the hypomorphic allele TOREP2353) specifically in PTEN mutant cells suppresses their proliferative advantage and restores growth of the surrounding normal tissue on both 100 g/l and 10 g/l yeast food. Conversely, when neighboring with sister clones mutant for TOR, PTEN clones outcompete the surrounding tissue already at standard conditions and overgrow more under starvation. The different clones are marked as depicted with colors in the labeling (orange: containing red/orange pigmentation, black: lacking red/orange pigmentation). Below: Quantification of eye sizes.
Figure 7—figure supplement 3
PTEN mutant cells neighboring with TOR mutant twin clones acquire a proliferative advantage early in larval development.
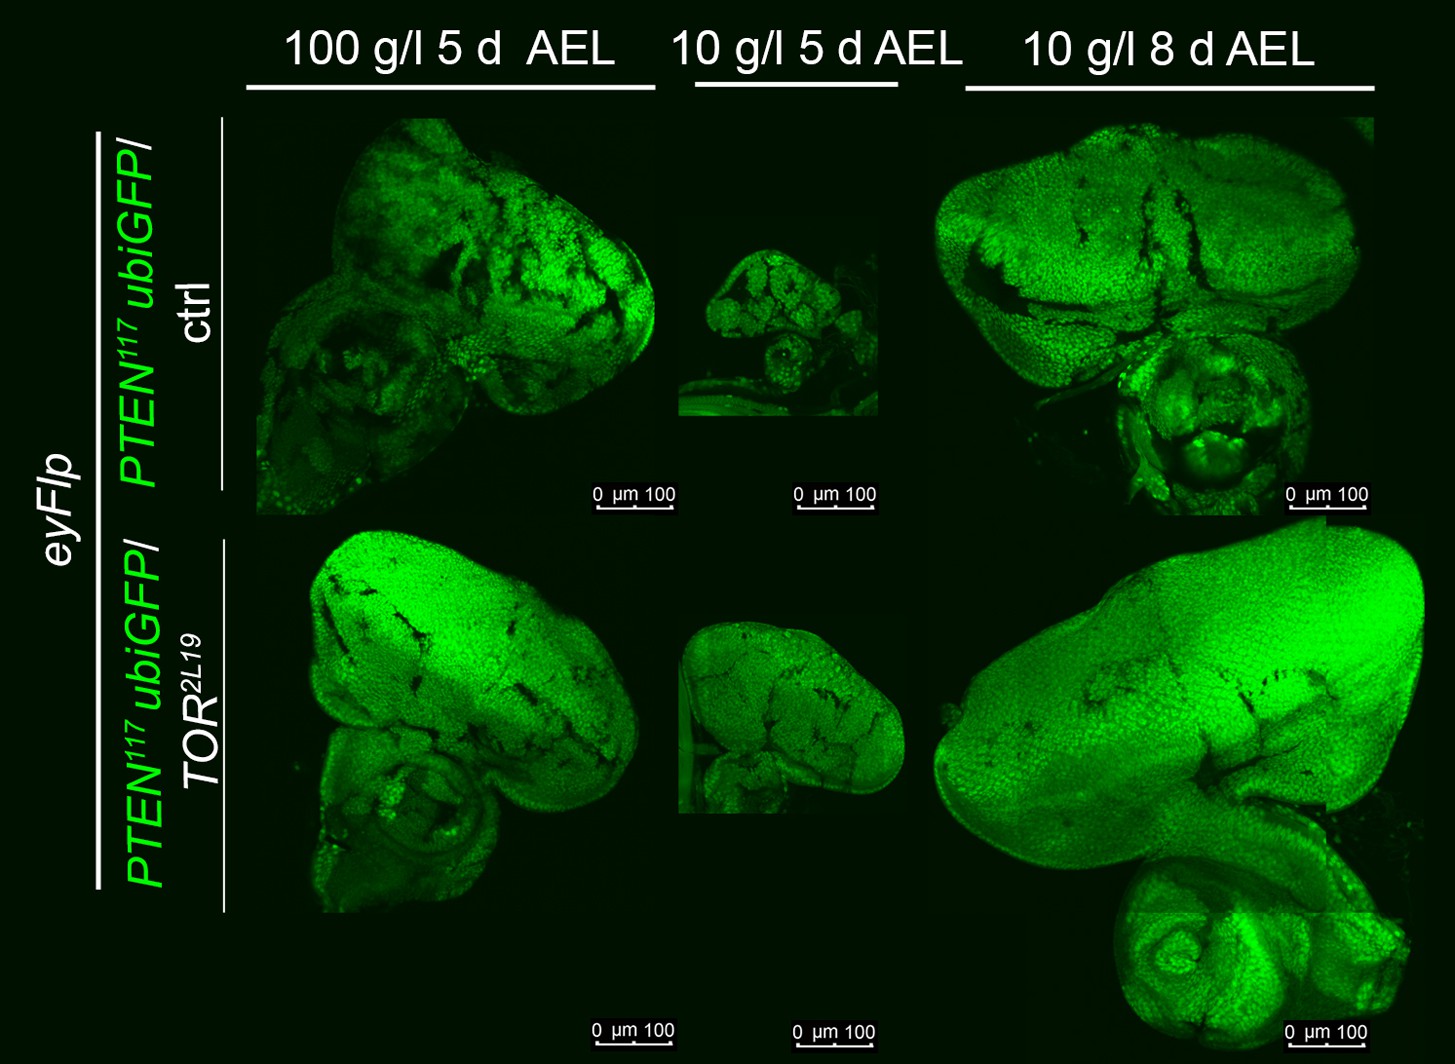
Eye discs with eyFlp/FRT PTEN and PTEN over TOR mutant clones (PTEN cells are positively marked by GFP), dissected at the indicated time points after egg deposition.
Figure 7—figure supplement 4
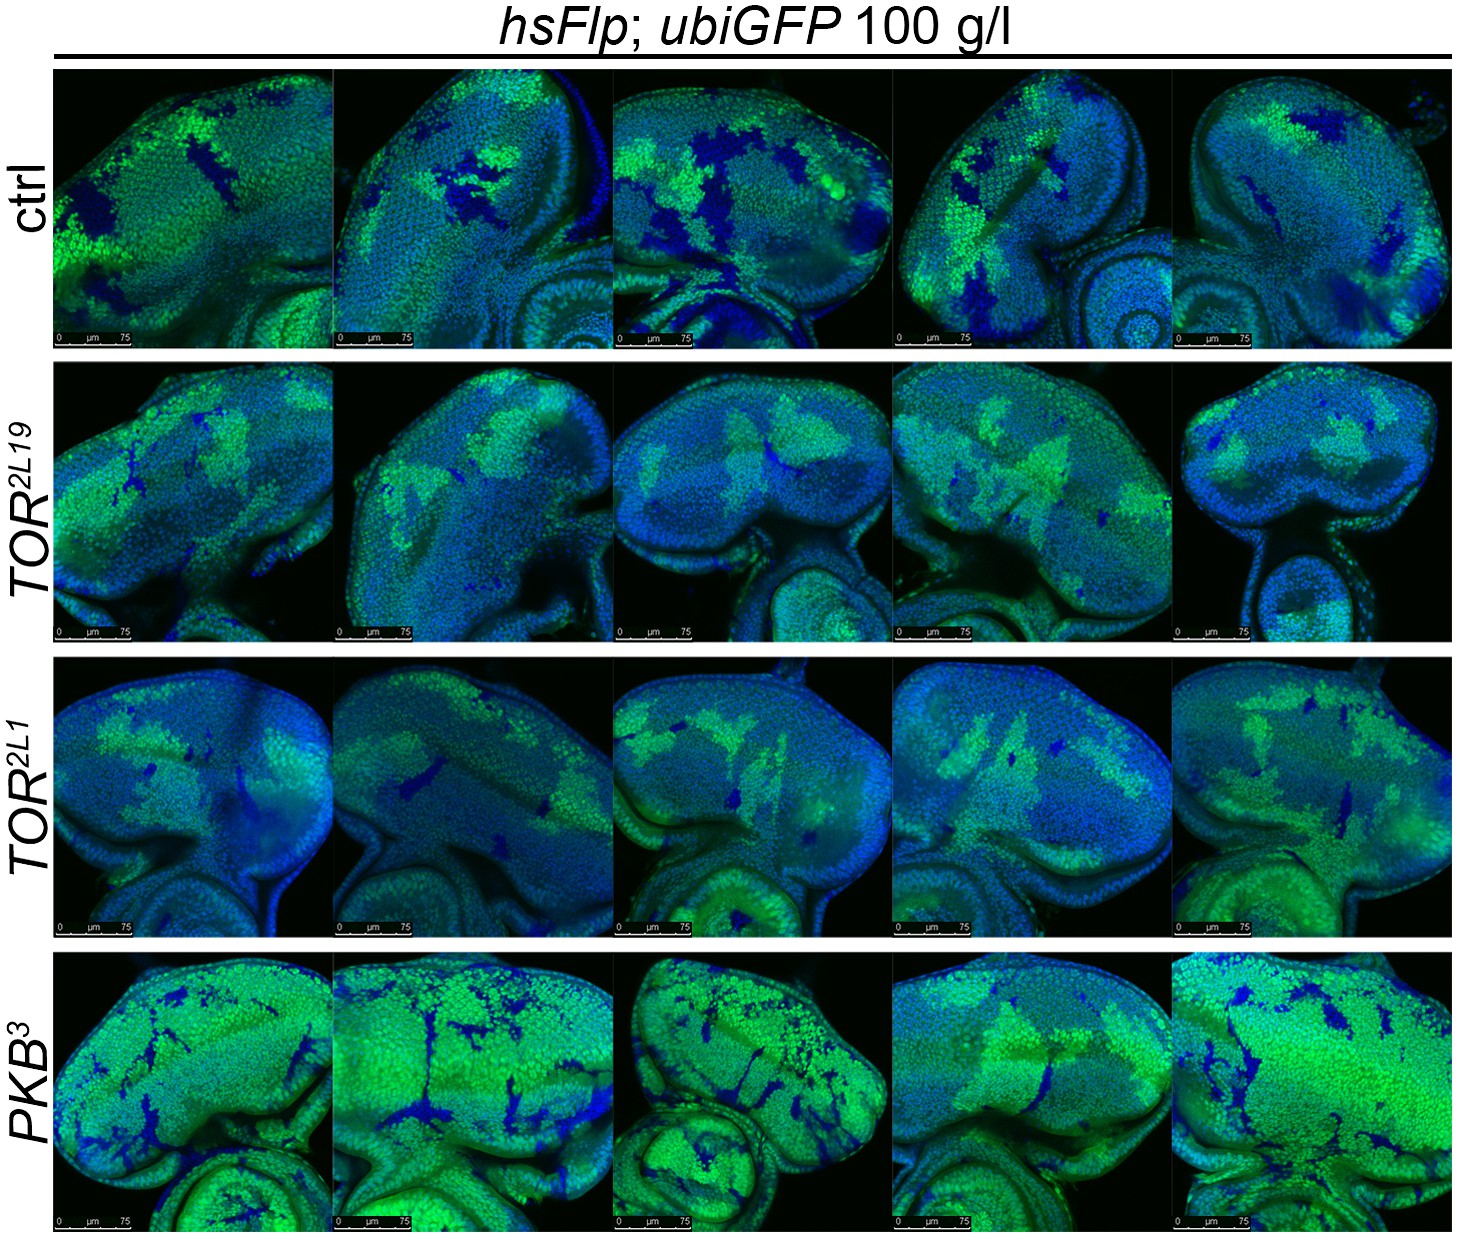
Wild-type cells neighboring with TOR or PKB mutant cells gain a growth advantage.
Eye discs with hsFlp/FRT TOR and PKB clones (marked by the absence of GFP). Note that the wild-type twin clones (bright green due to two copies of ubiGFP) are strongly overgrown.
Figure 7—figure supplement 5
PTEN mutant cells sense the growth reduction in their neighborhood and proliferate faster under starvation.
Scanning electron micrographs of eyes generated with the eyFlp/FRT ubiGFP system bearing TOR, PTEN, PTEN over TOR mutant or control clones of animals reared on 10 g/l yeast food. When neighboring with sister clones mutant for TOR, PTEN cells overgrow more under starvation exclusively due to an increase in cell number. On the rights side: Quantification of eye size, ommatidia number and ommatidia size.
Figure 7—figure supplement 6
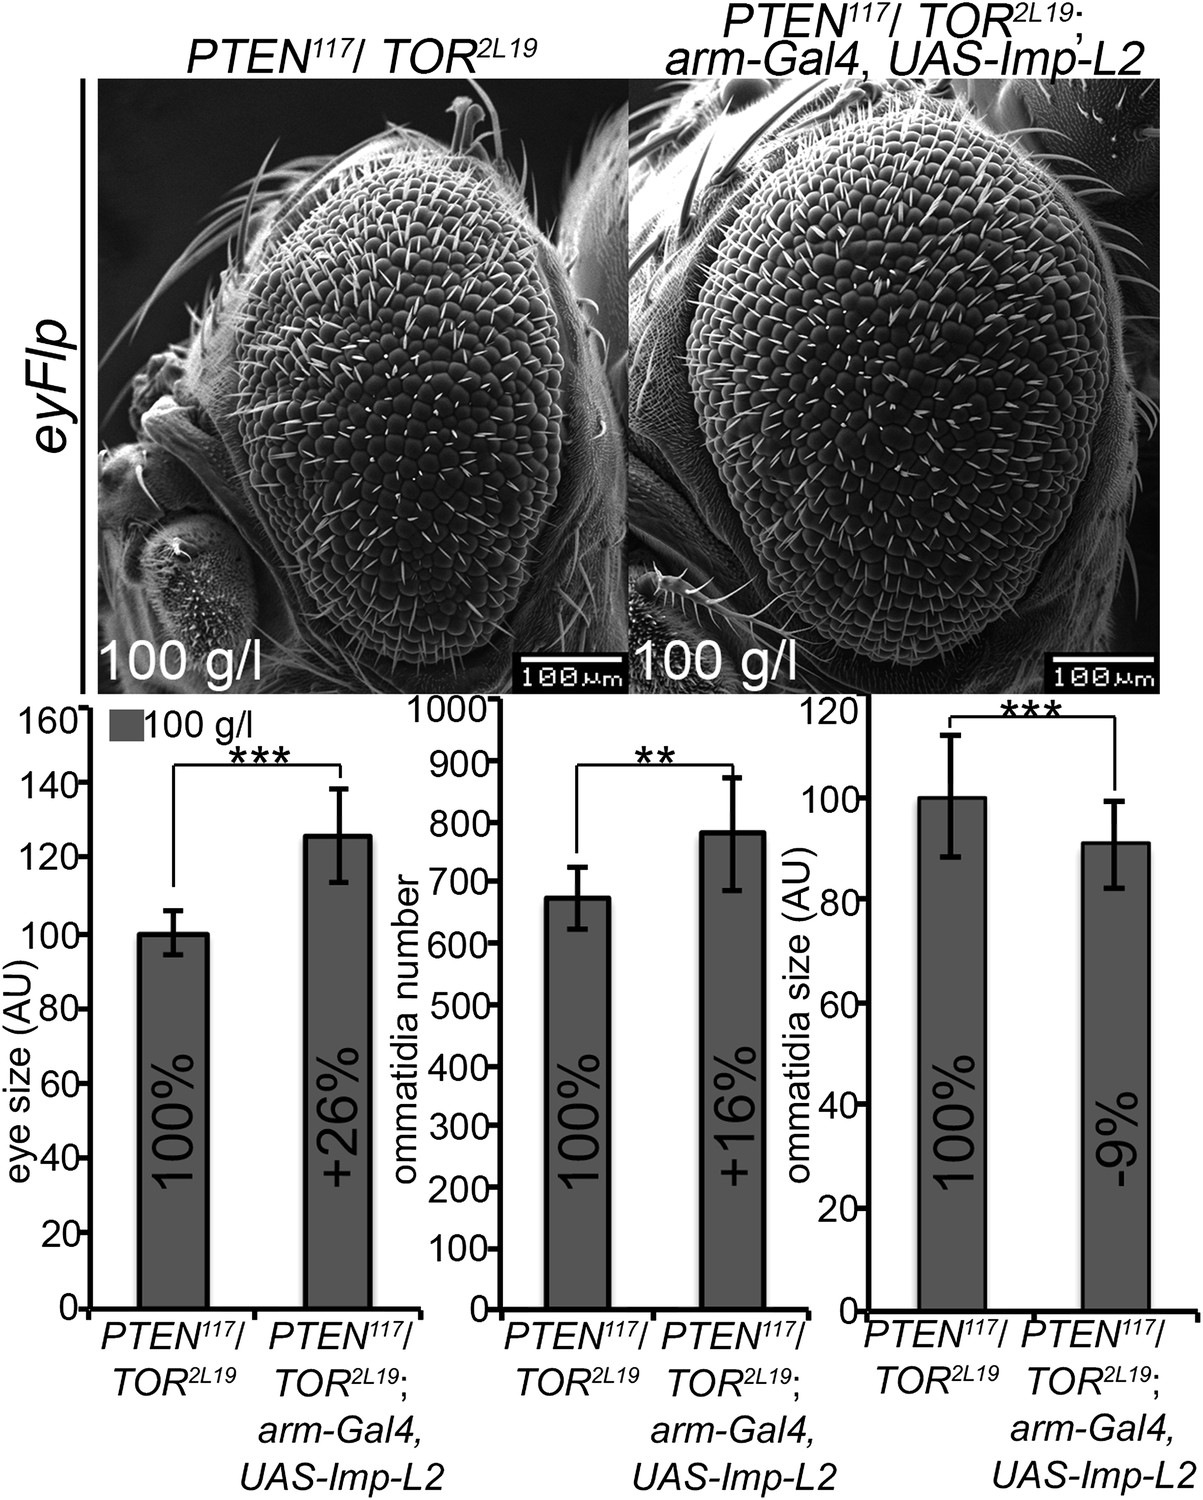
Systemic reduction of growth signaling induces a starvation-like response in PTEN mutant cells.
Systemic reduction of IIS (achieved by arm-Gal4 UAS-Imp-L2) enhances the overgrowth of PTEN clones that are neighboring with TOR mutant sister clones. The bigger eyes are composed of more but smaller ommatidia. Below: Quantification of eye size, ommatidia number and ommatidia size. Note that the increase in cell number in PTEN clones neighboring with TOR mutant cells is an underestimate because the reference eyes contain many very small (TOR mutant) ommatidia.
Figure 8
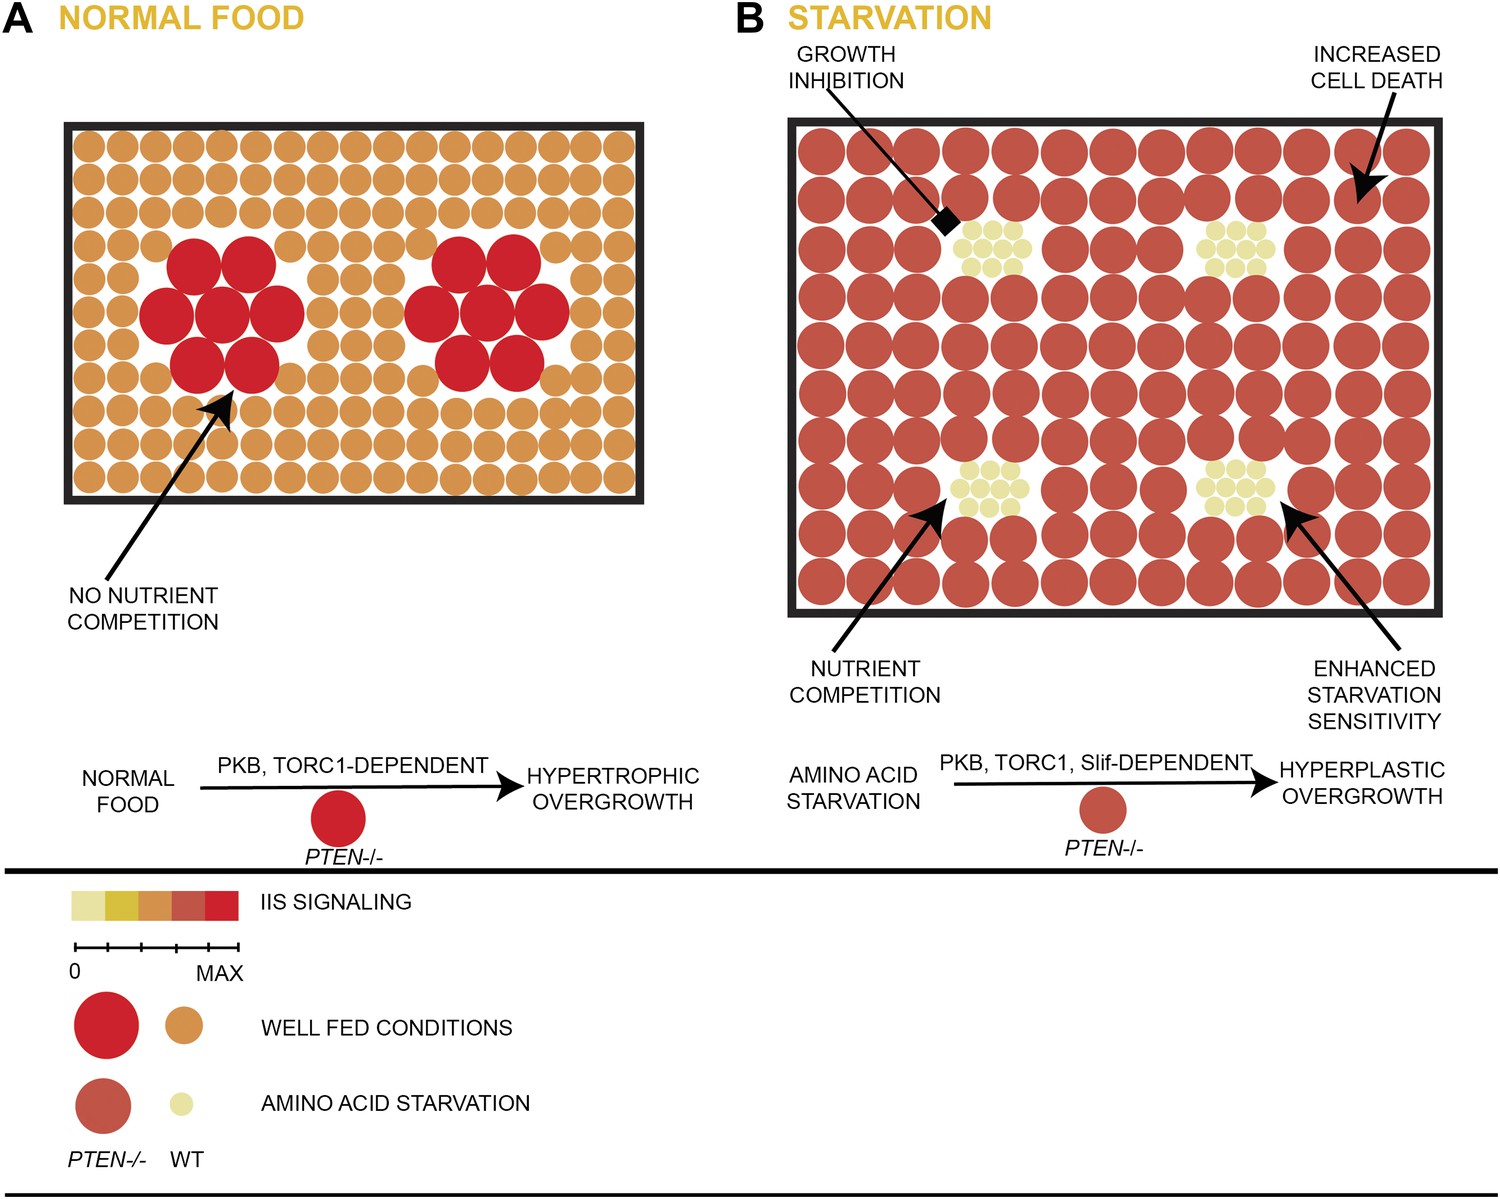
Model of hyperplastic overgrowth of PTEN mutant tissue under starvation.
(A) Under standard conditions (normal food), the PTEN mutant tissue overgrows in a hypertrophic manner. The tissue is enlarged because of larger PTEN mutant cells. (B) Under starvation conditions, the PTEN mutant tissue is metabolically more active and outcompetes the surrounding wild-type tissue, resulting in a hyperplastic overgrowth. The size of the tissue is further increased because of more PTEN mutant cells. The PTEN mutant tissue is susceptible to apoptosis, and it depends on the function of the amino acid transporter Slimfast. Under both conditions, the PTEN mutant tissue exhibits high insulin signaling activity and is dependent on the functions of PKB and TORC1.
Author response image 1
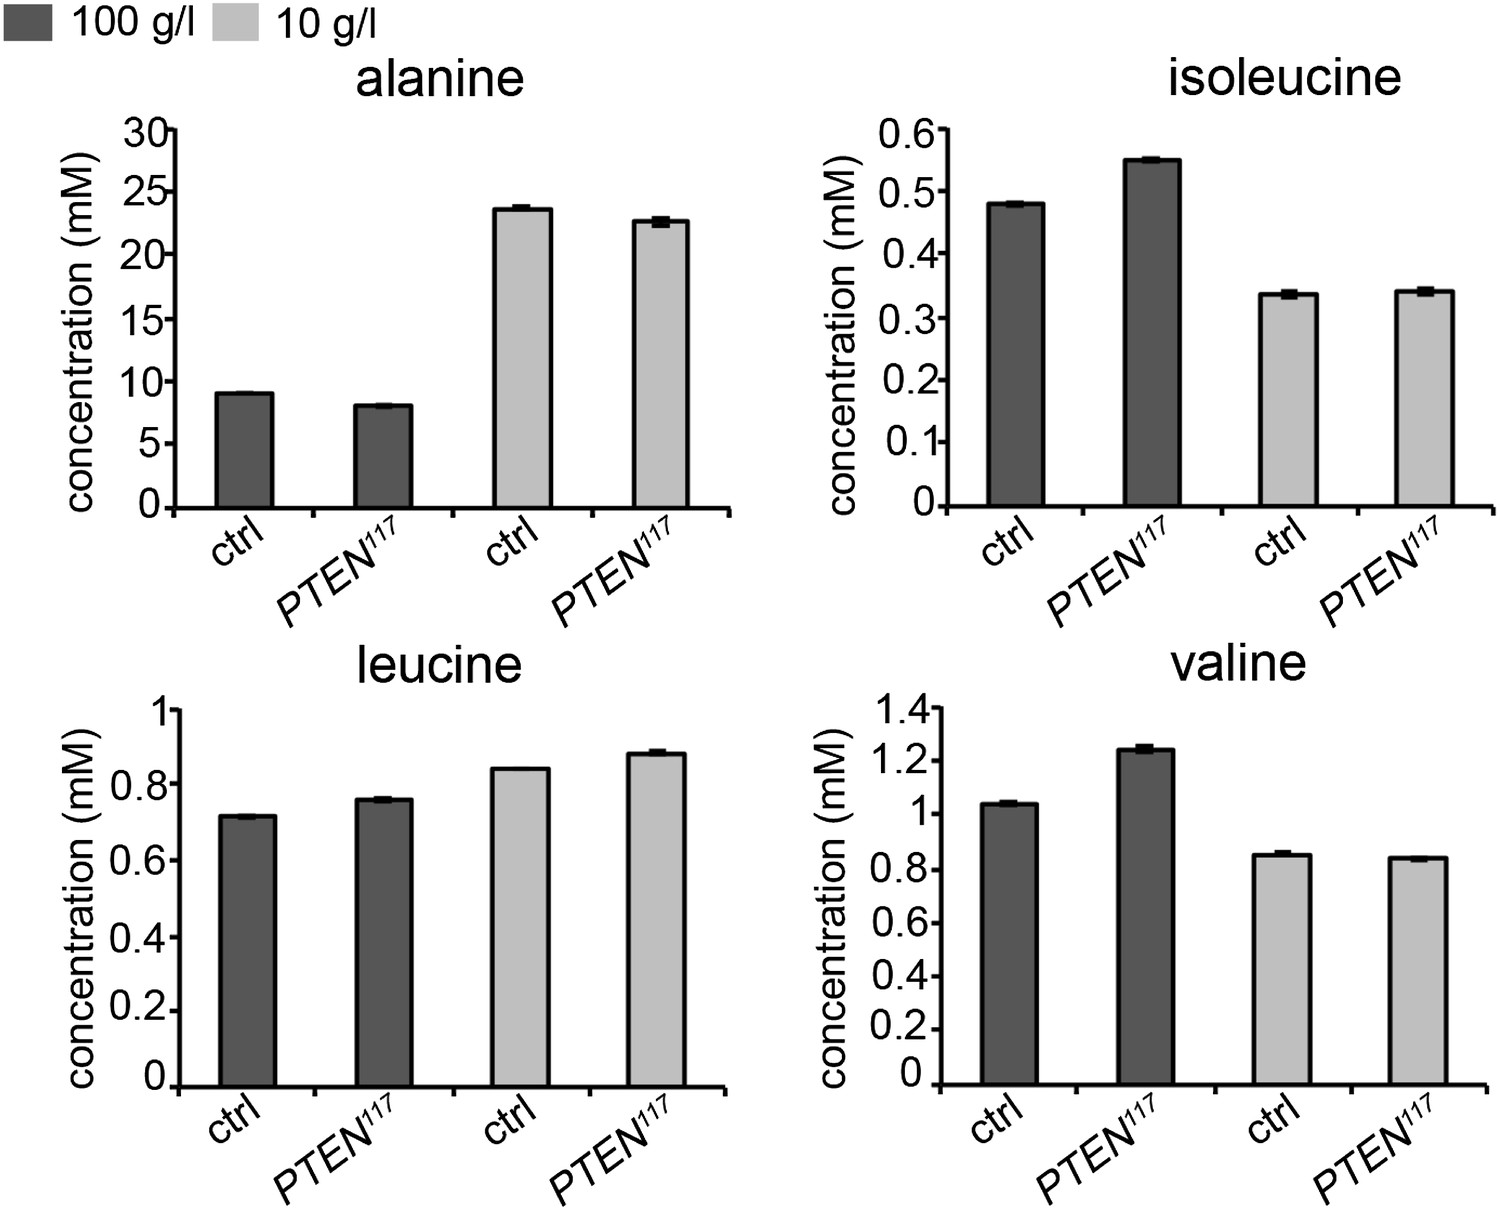
Concentrations of amino acids in the hemolymph of larvae bearing PTEN clones and control larvae under normal and starvation conditions.
Author response image 2
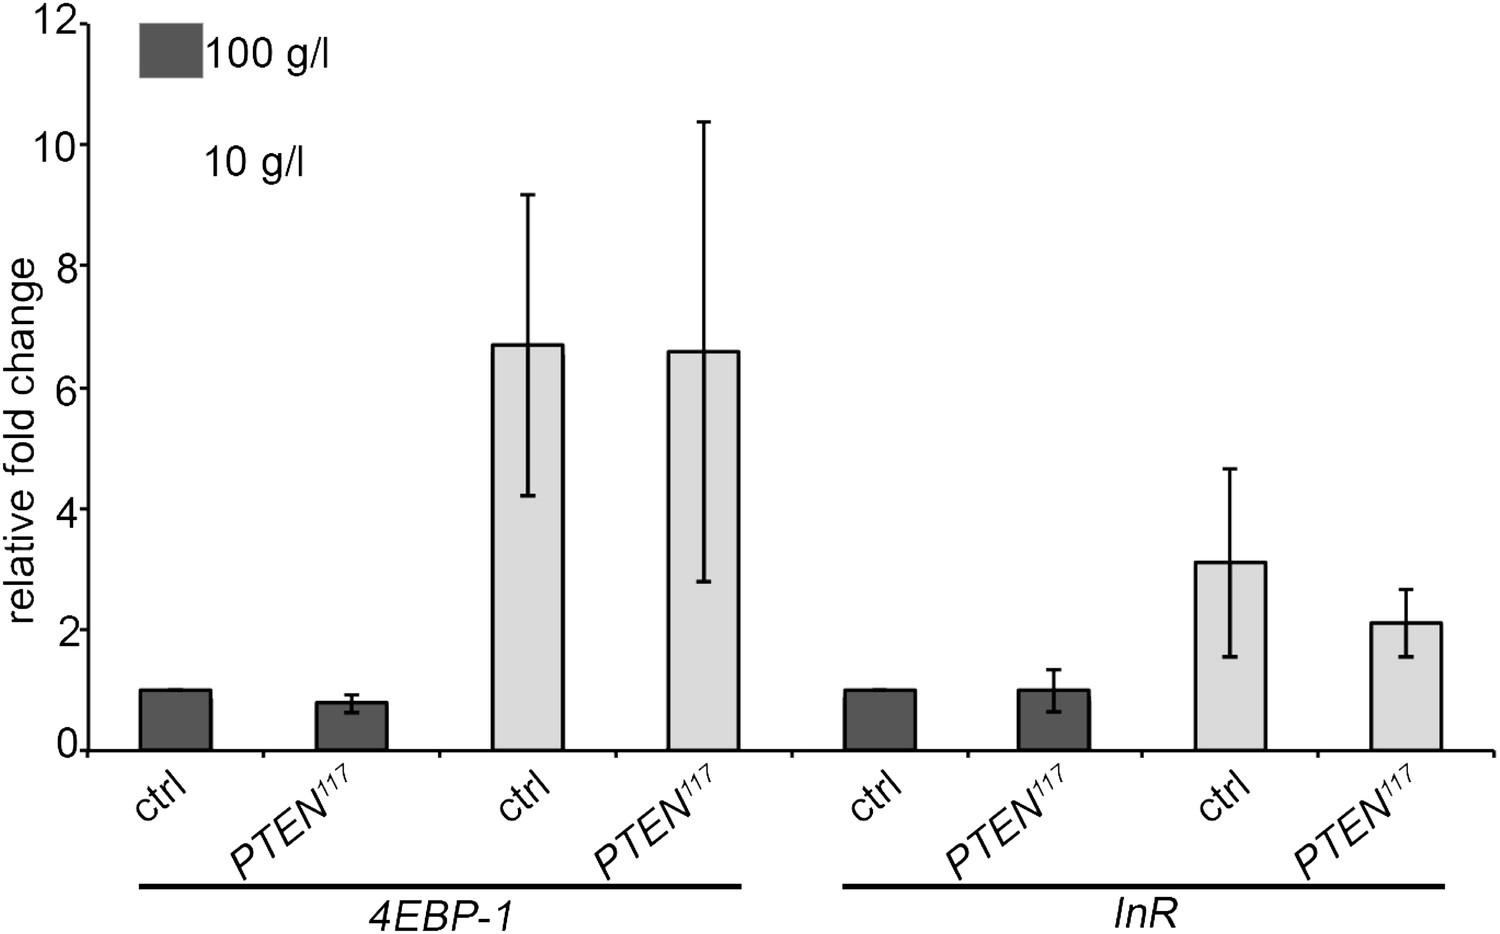
Expression levels of the starvation-induced genes InR and 4EBP-1 in the fat body of control larvae and larvae bearing PTEN clones (see text for explanations).
Author response image 3
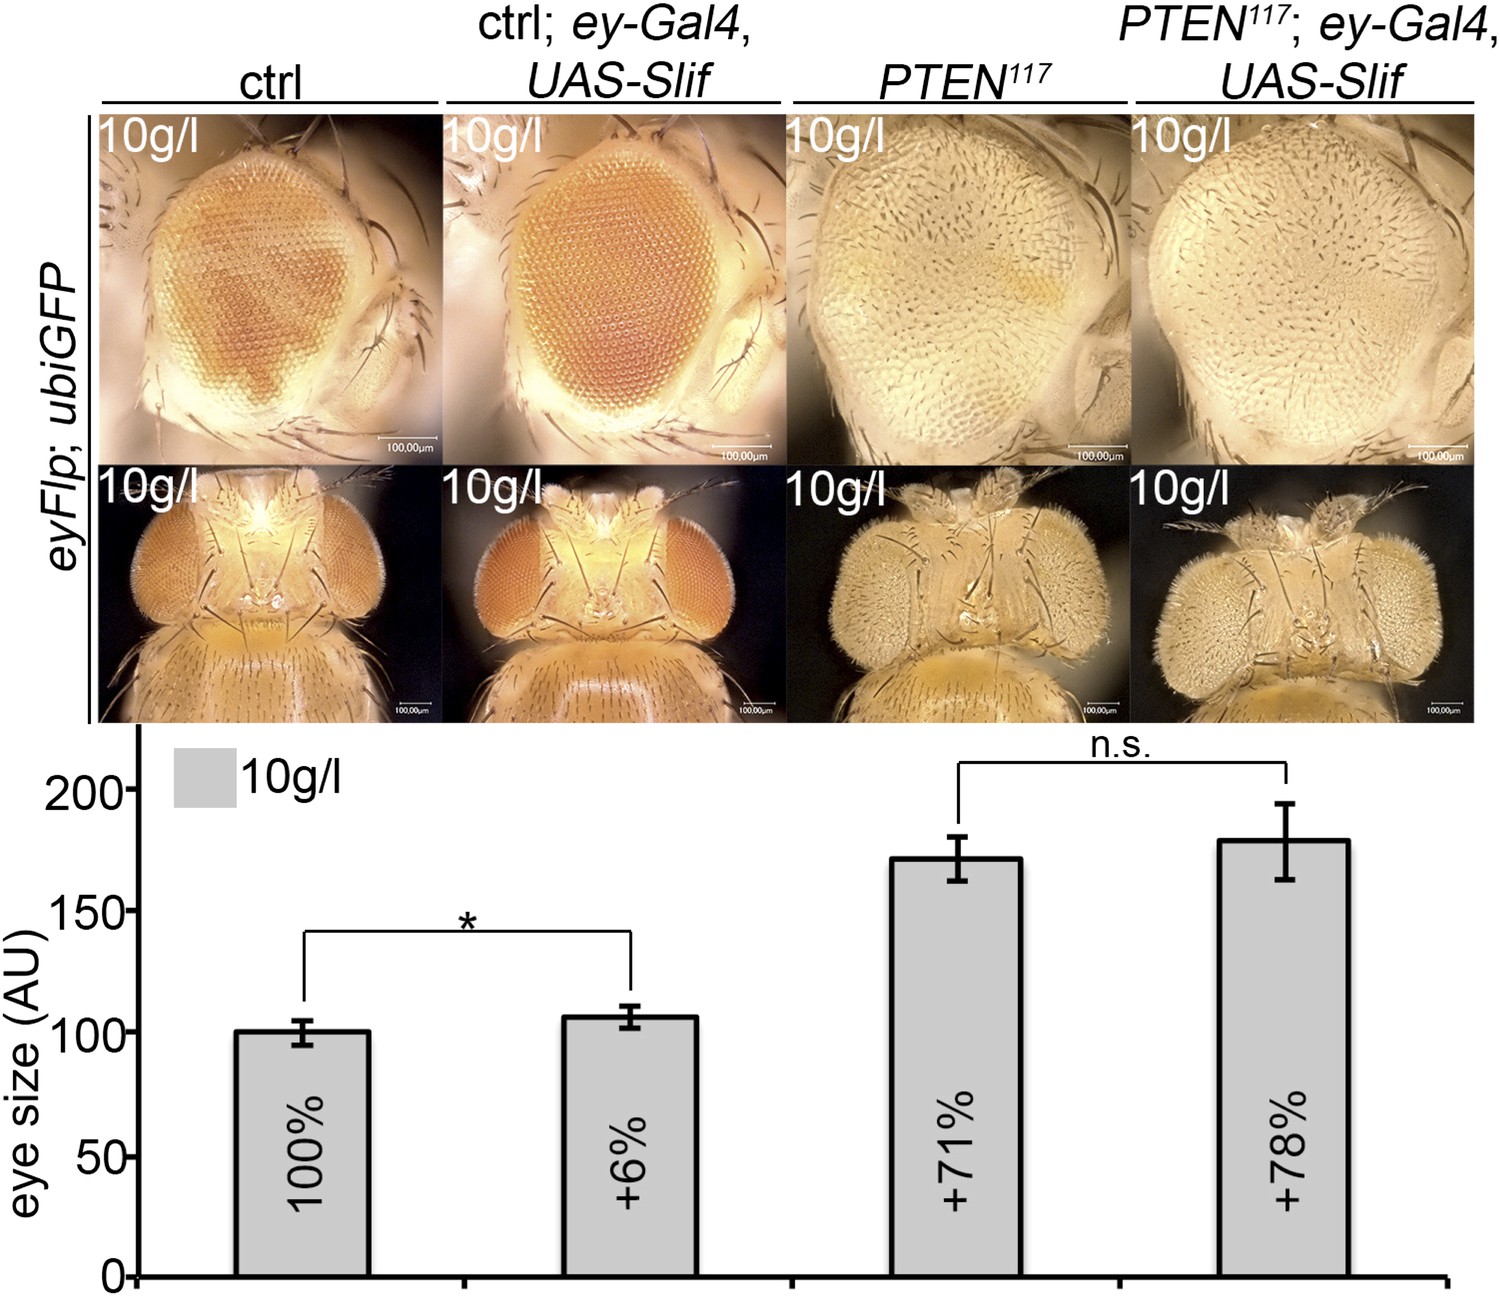
Overexpression of Slif does not rescue the growth of the tissue neighboring with PTEN clones.
Additional files
-
Supplementary file 1
Genotypes of experimental animals.
- https://doi.org/10.7554/eLife.00380.042
Download links
A two-part list of links to download the article, or parts of the article, in various formats.
Downloads (link to download the article as PDF)
Open citations (links to open the citations from this article in various online reference manager services)
Cite this article (links to download the citations from this article in formats compatible with various reference manager tools)
Nutrient restriction enhances the proliferative potential of cells lacking the tumor suppressor PTEN in mitotic tissues
eLife 2:e00380.
https://doi.org/10.7554/eLife.00380


