Usf1, a suppressor of the circadian Clock mutant, reveals the nature of the DNA-binding of the CLOCK:BMAL1 complex in mice
- Northwestern University, United States
- Howard Hughes Medical Institute, University of Texas Southwestern Medical Center, United States
- University of Texas Southwestern Medical Center, United States
- Northwestern University Feinberg School of Medicine, United States
- Genomics Institute of the Novartis Research Foundation, United States
- University of Pennsylvania, United States
Figures
Figure 1
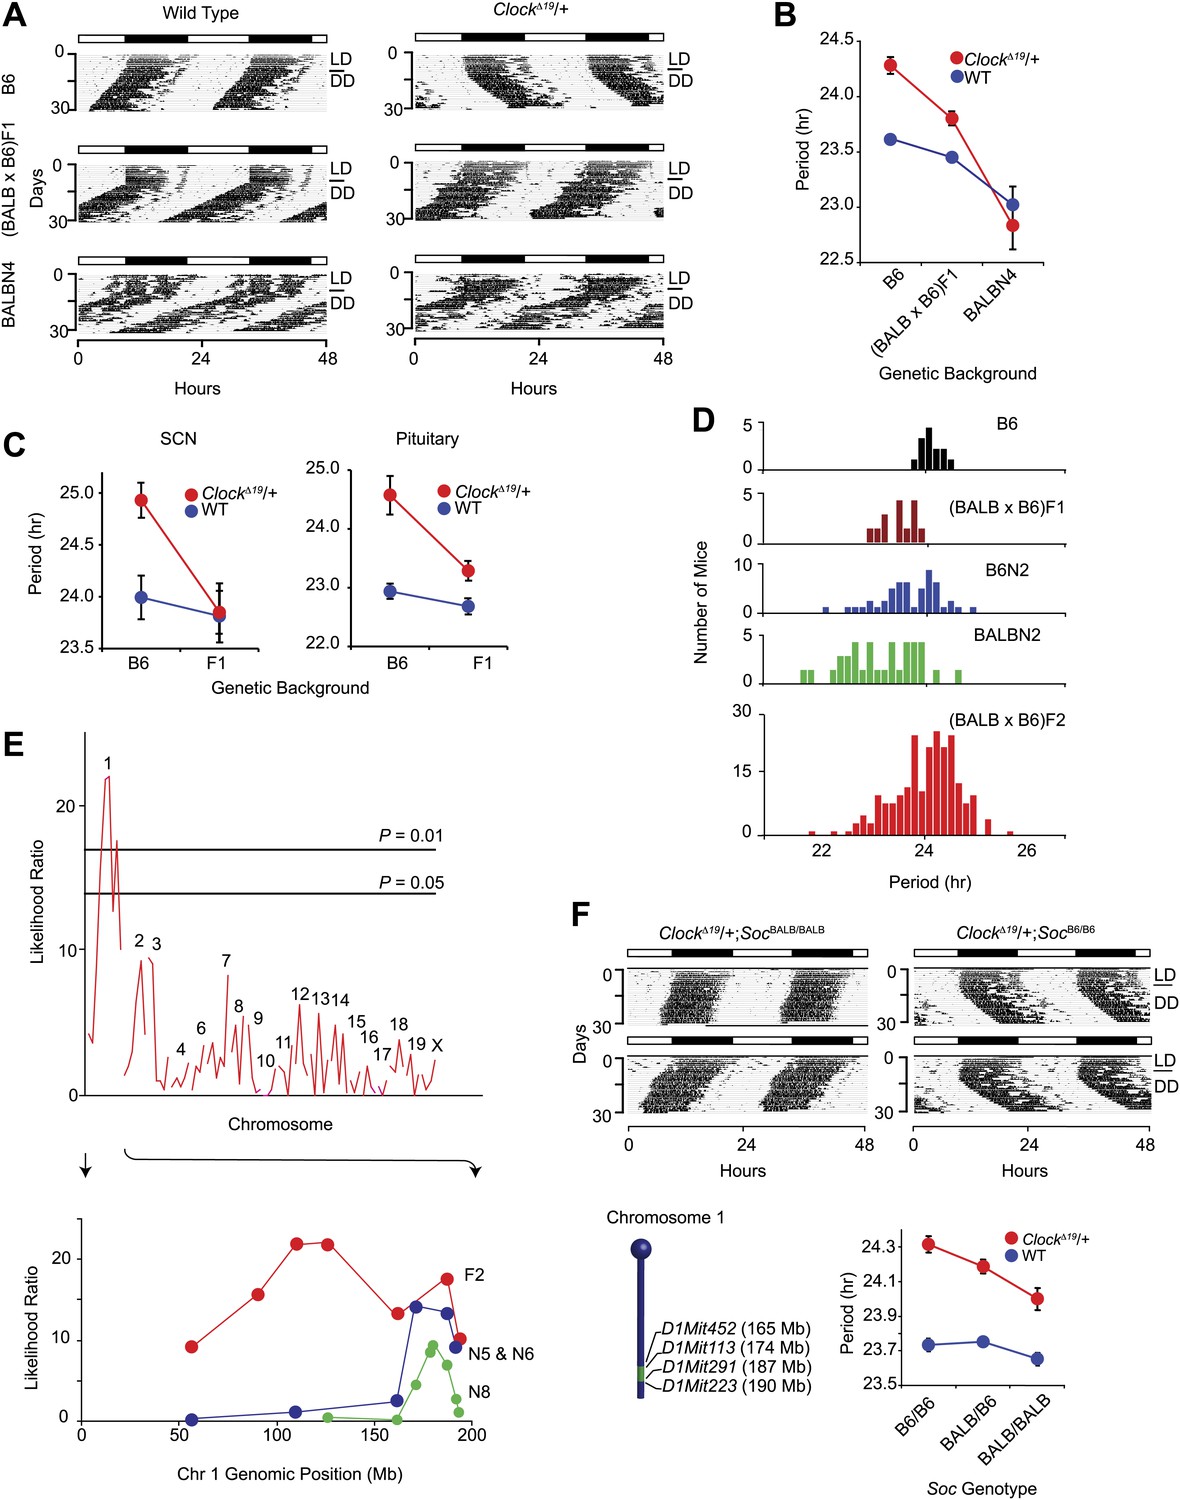
Suppression of ClockΔ19/+ circadian phenotype on the BALB genetic background.
(A) Representative locomotor activity records of wild-type (left) and ClockΔ19/+ (right) animals. The top two records are from B6 coisogenic mice, the middle two are from (BALB x B6)F1 hybrids, and the bottom two are from ([BALB x B6]F1 x BALB)N4 mice. (B) Effect of genetic background on the free-running period of the locomotor activity rhythm. A two-way ANOVA was highly significant for ClockΔ19 genotype (p<10−6), strain background (p<10−8) and their interaction (p<10−6). Each data point represents the mean ± SEM from 4–23 mice. (C) Effect of genetic background on the free-running period of PER2::LUC bioluminescence rhythms from ClockΔ19/+ SCN (left) and pituitary (right) explants. For SCN, a two-way ANOVA was significant for strain background (p<0.006) and interaction between ClockΔ19 genotype and strain background (p=0.02). The effect of ClockΔ19 genotype was not significant (p=0.11). For pituitary, a two-way ANOVA was significant for ClockΔ19 genotype (p<0.001), strain background (p<0.001), and their interaction (p=0.01). Each data point represents the mean ± SEM from 11–18 mice. (D) Analysis of circadian period in hybrid populations between B6 and BALB animals. Numbers of animals used for period distribution analysis in each population include: B6 (n = 13), (BALB x B6)F1 (n = 12), ([BALB x B6]F1 x B6)N2 (n = 45), ([BALB x B6]F1 x BALB)N2 (n = 31), and (BALB x B6)F2 (n = 222). (E) Mapping of the Soc locus. A significant association was detected with markers at the distal end of chromosome 1 in a (BALB x B6)F2 cross (n = 222). Horizontal lines indicate thresholds determined by 10,000 permutation tests. Higher resolution mapping of the Soc locus was accomplished by selecting nearly isogenic animals for phenotype and genotype (bottom). We performed association analysis with SSLP markers on chromosome 1 on the N5 and N6 combined (n = 41), and N8 (n = 193) generations. (F) Representative activity records of ClockΔ19/+ animals from congenic mouse strains (top panel). The two left panels show activity records from B6 ClockΔ19/+ mice carrying ∼25 Mb of BALB chromosome 1. The two right panels are from littermate controls which do not carry the BALB Soc region of chromosome 1. A diagram of the congenic region (green) on chromosome 1 is show in the left bottom panel. A two-way ANOVA was highly significant for the ClockΔ19 genotype (p<10−8) and congenic genotype (p=4.2 × 10⁻⁴). The interaction between the ClockΔ19 and congenic genotypes was not significant (p=0.057). Each data point represents the mean ± SEM from 11–29 mice.
Figure 2
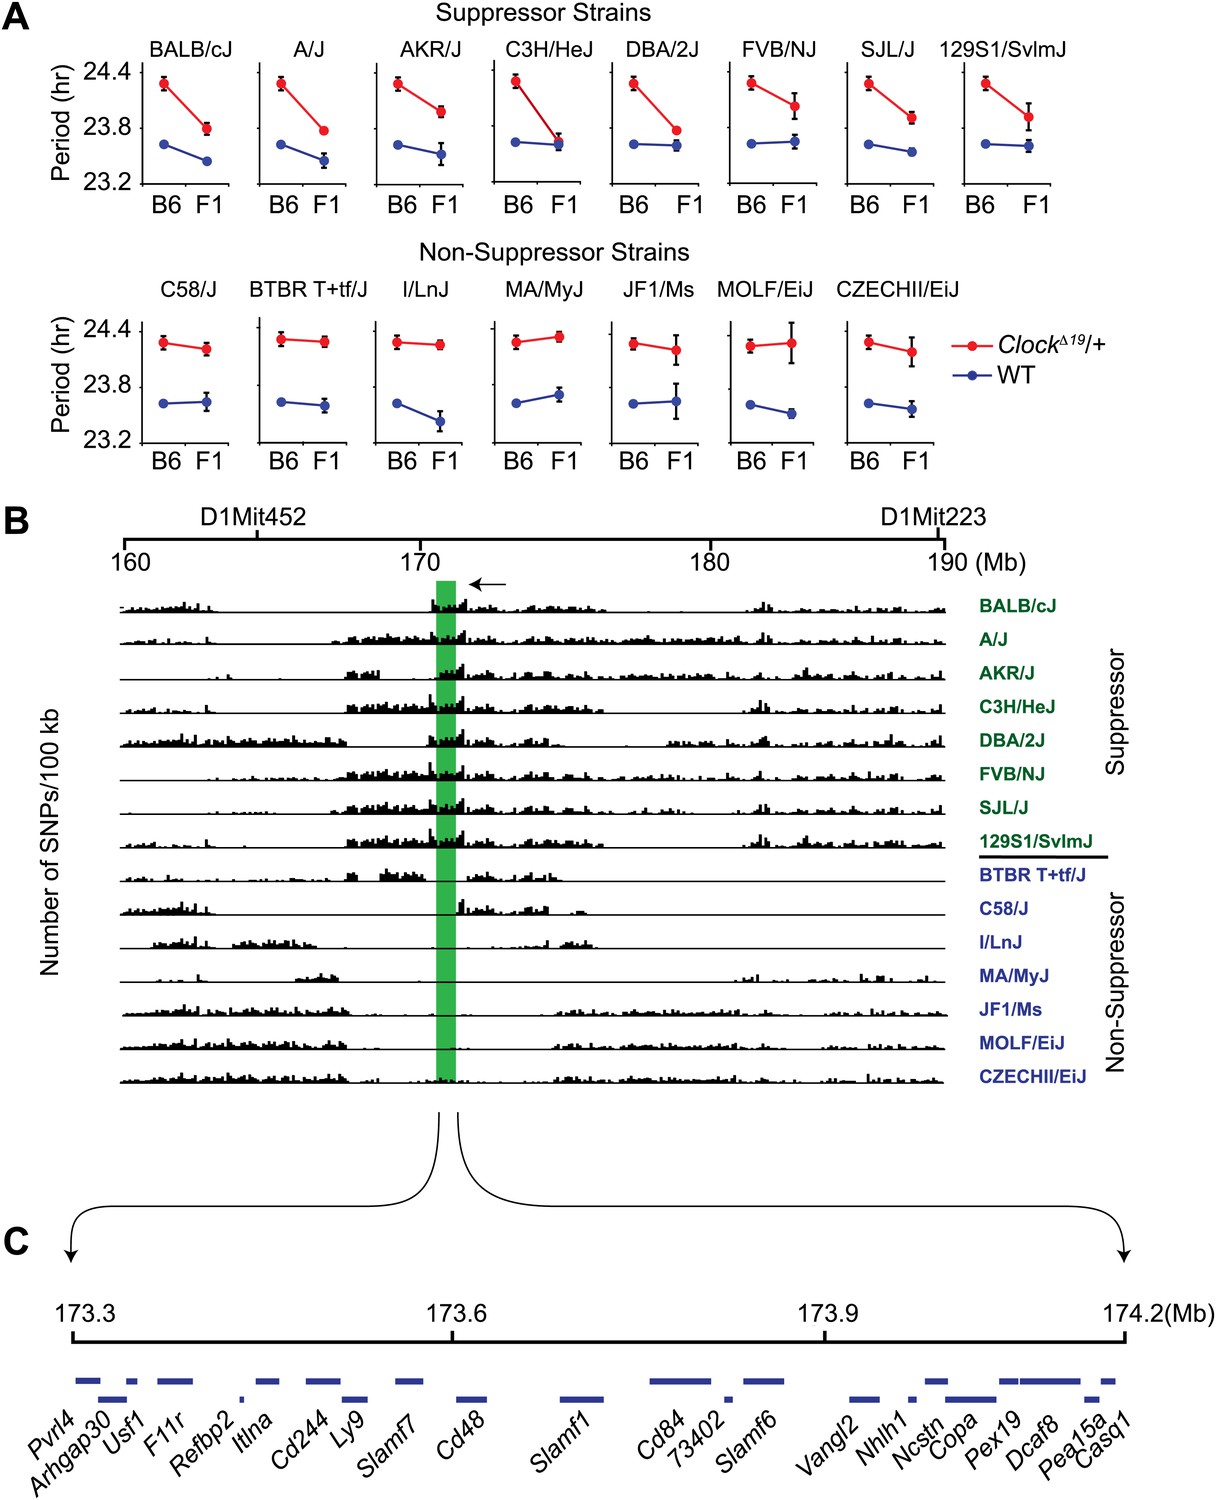
High-resolution mapping of the Soc locus using interval-specific SNP haplotype analysis.
(A) Identification of ClockΔ19 suppressor and non-suppressor strains. B6 ClockΔ19/+ mice were crossed to 15 different inbred mouse strains. We used a two-way ANOVA to distinguish the effects of the strain background (evident in the wild-type mice) from the effects of the strain background on the expression of the ClockΔ19 mutation (evident as a strain-by-genotype interaction effect). Of the 15 inbred strains tested, we identified seven additional suppressor (A/J, AKR/J, C3H/HeJ, DBA/2J, FVB/NJ, SJL/J and 129S1/SvlmJ) and seven non-suppressor (C58/J, BTBR T+tf/J, I/LnJ, MA/MyJ, JF1/Ms, MOLF/EiJ, and CZECHII/EiJ) strains. A summary of the two-way ANOVA is provided (Table 2). In each panel the blue and red lines represent wild-type and ClockΔ19/+ animals, respectively; F1 indicates an F1 hybrid between B6 and the specific inbred strain indicated. Each data point represents the mean ± SEM from 4–22 mice. (B) Pairwise sequence comparison between B6 and 15 other mouse strains in the 100-kb BALB interval. We used 2714 SNPs within the 160–190 Mb interval of mouse chromosome 1. Soc should be located in regions of high sequence variation in suppressor strains (green) and regions of low sequence variation in non-suppressor strains (blue), relative to B6. The only region satisfying this criterion is indicated (green bar). (C) Physical map of the Soc interval. Soc maps to a 900-kb interval of chromosome 1. Blue bars in the top panel represent the 22 candidate genes identified within the interval.
-
Figure 2—source data 1
Single nucleotide polymorphisms (SNP) in the Suppressor of Clock (Soc) candidate region among 16 mouse strains.
- https://doi.org/10.7554/eLife.00426.005
Figure 3

Usf1 is a candidate for the Soc locus.
(A) Gene expression profiling of 22 Soc candidates (gray and light blue) and nine clock genes (yellow) in 10 different tissues from Soc congenic ClockΔ19/+ mice. All tissues were collected at ZT6. The RNA copy number was calculated by a method described previously (Uno and Ueda, 2007). Copy number within all tissues for all analyzed genes was normalized (Z = mean/SD). We coded Z scores in seven different colors. Cluster analysis was performed using Systat Software. Only seven of the 22 Soc candidates (Vangl2, Usf1, Dcaf8, Copa, Pex19, Pea15 and Ncstn) show a similar expression profile with that of the clock genes within the 10 tissues examined. (B) USF1 activates Per1 and Per2 promoters. The seven Soc candidates were tested for Per1 and Per2 promoter activation (top left panels). Only USF1 activates both promoters. Each data point represents the mean ± SEM from three replicates. Activation of both Per1 and Per2 promoters by USF1 occurs in a dose-dependent manner (top right panels). USF1-mediated transcription is not inhibited by the CRY proteins. While there is strong negative inhibition by CRY of CLOCK:BMAL1-mediated transcription from the Per promoter, Per promoter activation by USF1 is not inhibited by either CRY1 or CRY2 (bottom panels). (C) Upregulation of Usf1 mRNA in liver tissue of ClockΔ19 suppressor background animals. Liver tissue was collected every 4 hr following 2 days of DD exposure. Among the seven Soc candidates tested, only Usf1 was increased in liver from F1 ClockΔ19/+ animals as determined by a two-way ANOVA (p=0.006). We did not detect an effect of time on Usf1 expression. In each panel, lines represent B6 ClockΔ19/+ (blue) and (BALB x B6)F1 ClockΔ19/+ (green) animals. Each data point represents the mean ± SEM from 2–4 mice. Asterisks indicate significant differences between ClockΔ19 suppressor and non-suppressor strain values at each time point (Tukey's post hoc, p<0.05). (D) Upregulation of USF1 protein in the liver nuclear extract from BALB/cJ genetic background. The left panel shows western blots for USF1 from B6, (BALB x B6)F1 and BALB male mouse liver samples. HDAC1 was used as a loading control. Mouse nuclear extract was prepared at ZT8. The right panel shows the normalized value for USF1 signal against HDAC1. Each bar represents the mean ± SEM from three replicates. A one-way ANOVA was significant for strain background (p=0.002). (E) Upregulation of E-box-containing circadian genes in liver from ClockΔ19 suppressor background animals. We quantified Per1, Per2, Cry1 and Cry2 mRNA levels in the same liver samples used in (C). By a two-way ANOVA, we detected significant upregulation in Per1 (p=1.5 × 10⁻⁵), Per2 (p<10−8), Cry1 (p=1.0 × 10⁻⁸) and Cry2 (p=6.6 × 10⁻³) transcripts. Asterisks indicate significant differences between ClockΔ19 suppressor and non-suppressor strain values at each time point (Tukey's post hoc, p<0.05).
Figure 4

Transgenic expression of Usf1 suppresses ClockΔ19/+ mice and mimics Soc.
(A) Representative locomotor activity records of Usf1 transgenic ClockΔ19/+ mice. Records on the left panel are from ClockΔ19/+ mice carrying a Usf1 transgene while those on the right are from ClockΔ19/+ controls. All mice are C57BL/6J isogenic. (B) Analysis of circadian behavior in Usf1 transgenic ClockΔ19/+ mice. Significant period shortening was detected in two Usf1 transgenic lines in ClockΔ19/+ (red), but not wild-type (blue) mice. Each bar represents 5–35 mice from the C57BL/6J isogenic background (left). The right panel shows level of Usf1 mRNA in hypothalamus at ZT6. Blue dots represent WT and red dots represent ClockΔ19/+. A two-way ANOVA was significant for transgene (Tg) genotype (p=0.006). The effect of Clock genotype was not significant (p=0.18). There was no significant interaction between Tg and Clock genotype (p=0.616). (C) Circadian activity rhythms in Usf1 knockout mice. Representative activity records of two wild type (left) and two Usf1 knockout (right) mice. (D) Circadian period was not different between WT and Usf1 KO mice. However, circadian amplitude and daily activity in constant darkness were significantly lower in Usf1 KO mice. Data represent the mean ± SEM from 26 WT and 11 Usf1 KO mice.
Figure 5
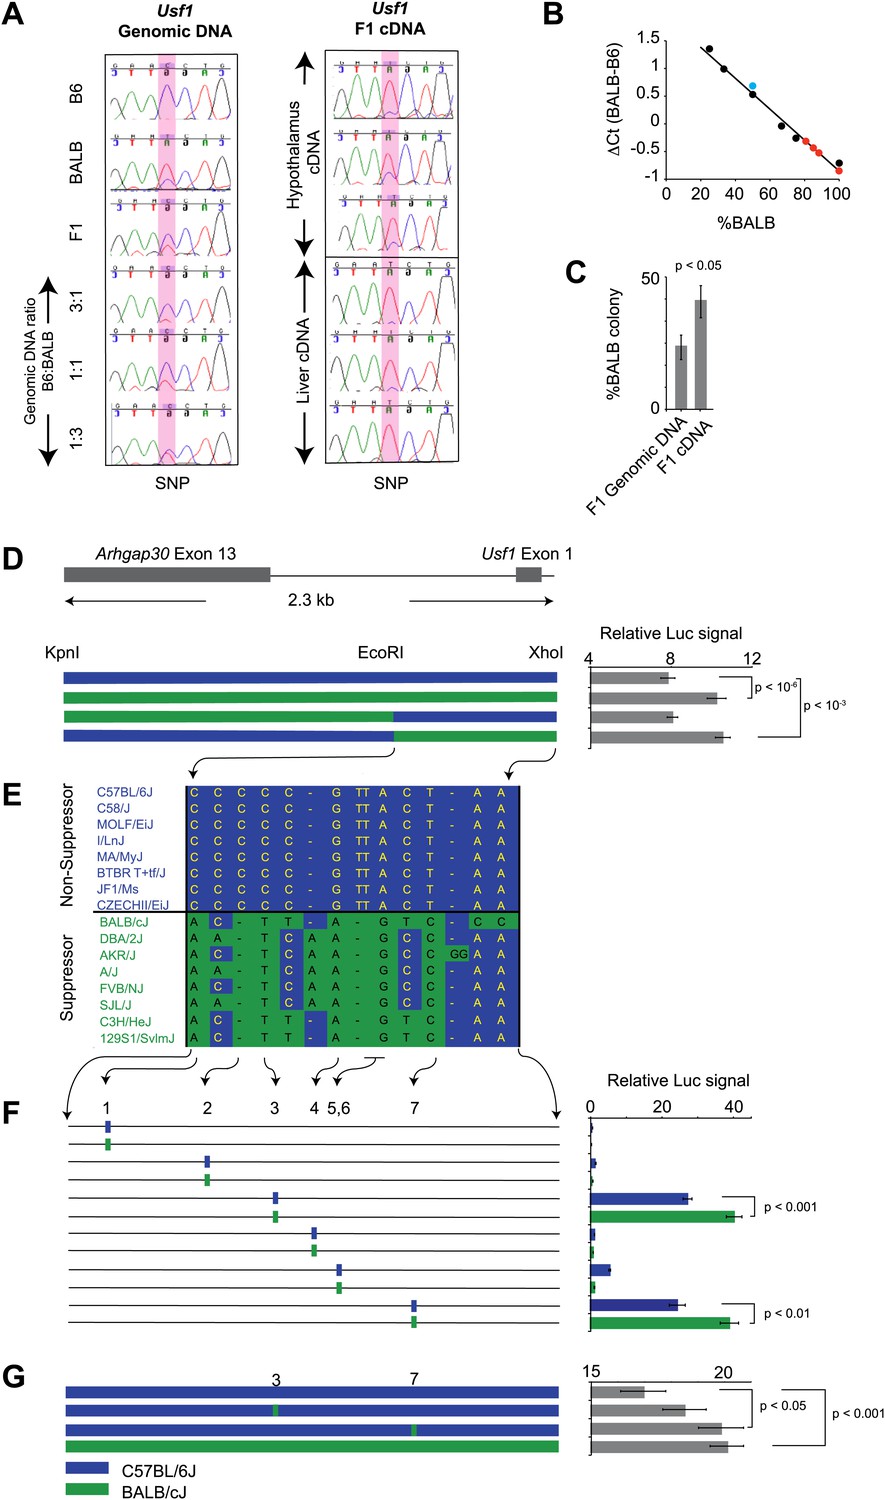
Usf1 promoter analysis.
(A) Allele-specific expression difference between B6 and BALB Usf1 mRNA revealed by DNA sequencing. We chose an SNP at the 3′-UTR of Usf1 as a marker to distinguish between the B6 and BALB alleles. The amplicon size from genomic DNA and cDNA are identical. We PCR-amplified the SNP-containing region in genomic DNA samples from B6, BALB, (B6 x BALB)F1 and three samples containing different mix ratios between B6 and BALB DNA (3:1, 1:1 and 1:3, respectively) as shown in the left panel. The panel on the right shows (B6 x BALB)F1 Usf1 cDNA sequence from hypothalamus (top three) and liver (lower three). The PCR products were sequenced by an ABI3700 machine to compare the fluorescent signal peak ratio at the SNP locus as an indicator of the copy number ratio of the two alleles. This clearly demonstrates that the expression difference of Usf1 between B6 and BALB is the result of polymorphisms in cis regulatory elements. (B) Analysis of allele-specific expression differences between B6 and BALB Usf1 mRNA by quantitative PCR. We amplified genomic DNA mixtures described in (A) with allele-specific PCR primers and created a standard curve for %BALB genomic DNA vs ΔCt (black data points). The blue data point is from F1 genomic DNA, which is naturally a 1:1 mixture of B6 and BALB. Red data points represent F1 cDNA from hypothalamus. Based on the standard curve generated from genomic DNA, 80% of the F1 cDNA contains the BALB Usf1 allele. (C) Analysis of allele-specific expression differences between B6 and BALB Usf1 mRNA by cloning PCR products. We amplified both F1 genomic DNA and cDNA using primers flanking an SNP in exon 10 (rs31093636) of Usf1. We generated four independent PCR products from a single F1 genomic DNA sample and four PCR products from four different F1 cDNA samples. The exon 10 SNP creates a restriction fragment length polymorphism such that only the BALB allele is cleaved by restriction enzyme TfiI. Each PCR product was cloned into a TA plasmid vector. From each transformation, we picked 24–48 colonies. We isolated 143 colonies containing F1 genomic DNA and 172 colonies containing F1 cDNA. This analysis, like that in (B), demonstrates that the F1 cDNA contains a higher percentage of the BALB Usf1 allele than expected. (D) Usf1 promoter analysis between B6 and BALB mouse strains. The putative Usf1 promoter sequence (∼2.3 kb upstream of exon 1) was cloned into the pGL4 luciferase reporter vector and 90 ng of either B6 or BALB construct was transfected into HEK293T cells. Promoter activity from the BALB clone is significantly higher than that from the B6 clone (p<10−6). Next, we swapped EcoRI-XhoI fragments between the B6 and BALB constructs. The B6 clone containing the BALB EcoRI-XhoI fragment has significantly higher activity than the original B6 clone (p<10−3). The activity is equivalent to the original BALB clone. On the other hand, the BALB clone containing the B6 EcoRI-XhoI fragment exhibits essentially similar activity as the B6 intact clone. The blue and green bars indicate B6 and BALB DNA fragments, respectively. Each data point represents mean ± SEM of 18–36 samples. (E) SNP distribution pattern among 16 mouse strains in the Usf1 promoter candidate region. We detected 14 polymorphisms among 16 mouse strains within the ∼1000 bp candidate region. The top eight strains are ClockΔ19 non-suppressor strains and the bottom eight are ClockΔ19 suppressor strains. There are only seven polymorphisms that perfectly match the phenotype distribution pattern. Blue indicates the B6 allele and green indicates the BALB allele. (F) Putative Usf1 promoter SNPs (containing ∼100 bp of flanking sequence of SNP1, SNP2, SNP3, SNP4, SNP5&6 and SNP7) from B6 and BALB were cloned into the pGL4 luciferase reporter vector. Only SNP3 and SNP7 show elevated promoter activity. In both cases, the BALB allele has significantly higher activity (p<0.001) than the B6 allele (p<0.01). In the NCBI RefSNP database, SNP3 corresponds to rs31538551 and SNP7 to rs31538547. Each data point represents the mean ± SEM of six samples. (G) We mutagenized the B6 promoter EcoRI-XhoI fragment to introduce the BALB allele at either SNP3 or SNP7. We observed a significant increase in the luciferase signal by SNP7 (p<0.05). Although we did not detect significant upregulation by the BALB allele at SNP3 (p=0.18), the level of luciferase was elevated with the BALB allele compared to the B6 allele. Each data point represents the mean ± SEM of 12 samples.
Figure 6
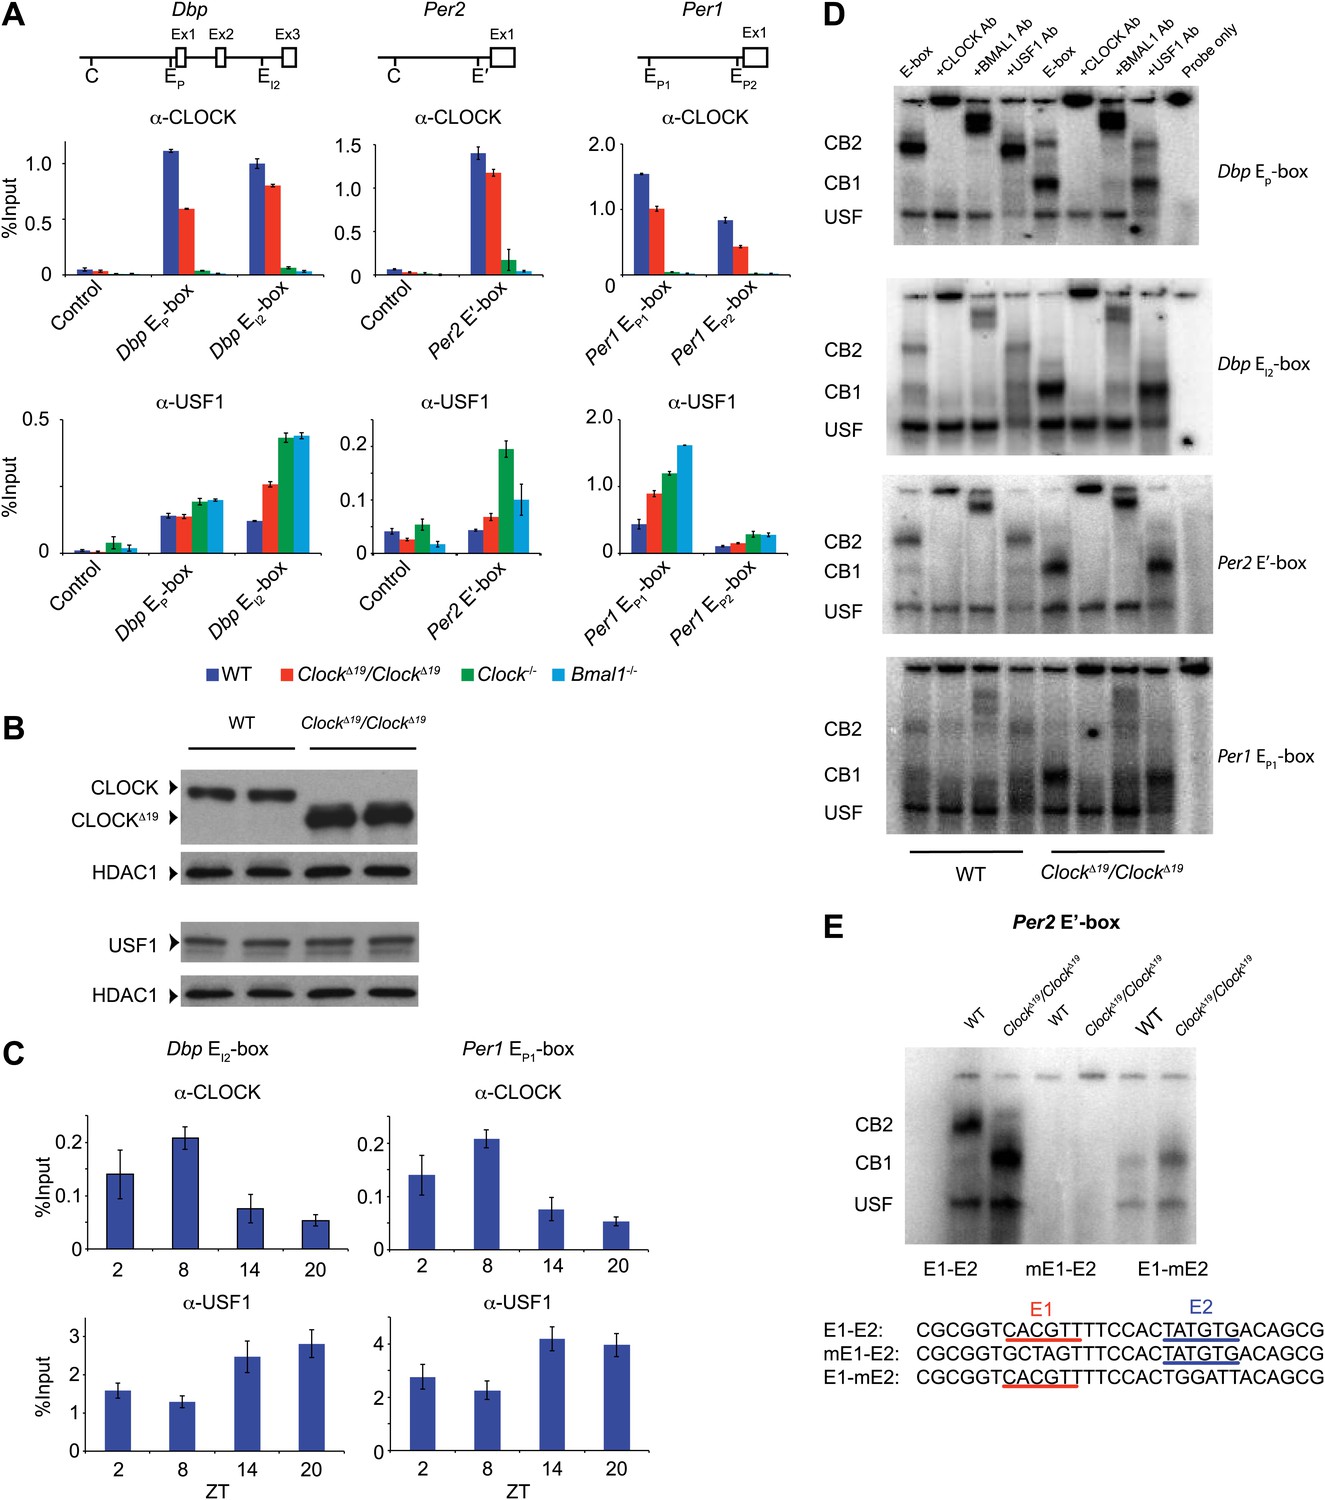
CLOCK:BMAL1 and USF1 binding to the E-box motif.
(A) CLOCK and USF1 binding at Dbp, Per2 and Per1 E-boxes revealed by ChIP-qPCR. E-box occupancy demonstrated by CLOCK (top panels) and USF1 (bottom panels) is shown. At all E-boxes examined, CLOCK binding is lower in ClockΔ19/ClockΔ19 animals compared to wild-type controls. In contrast, USF1 binding is elevated in ClockΔ19/ClockΔ19 mice compared to wild-type animals at the Dbp EI2, Per2 E′ and Per1 EP1 and EP2 E-boxes. USF1 binding is also elevated in Clock and Bmal1 knockout mice. (B) Western blot for CLOCK and USF1 in liver nuclear extracts from wild-type and ClockΔ19/ClockΔ19 C57BL/6J isogenic animals. Tissues were harvested at ZT8. HDAC1 was used as a loading control. (C) Reciprocal pattern of CLOCK and USF1 binding at Dbp and Per1 E-boxes with time of day using ChIP-qPCR. (D) Antibody validation of CLOCK:BMAL1 and USF1 complexes for EMSA experiments using tandem Dbp EP-box , Dbp EI2-box, Per2 E′-box and Per1 EP1-box, top to bottom, respectively, in liver nuclear extracts from wild-type and ClockΔ19/ClockΔ19 C57BL/6J isogenic animals at ZT8. CB2 (CLOCK:BMAL1 tandem heterodimeric complex); CB1 (CLOCK:BMAL1 heterodimer); USF (USF1 or USF2 homodimer or USF1:USF2 heterodimer). CB1 and CB2 complexes are completely abolished or shifted by CLOCK or BMAL1 antibodies, respectively. USF complexes are reduced significantly by USF1 antibody, with the remaining complex presumed to be USF2. (E) EMSA analysis of E1 and E2 mutants in the tandem Per2 E′-box. Mutation of the E1 site in the Per2 E′-box completely blocks CLOCK:BMAL1 and USF complex binding. Mutation of the E2 site blocks the formation of tandem heterodimeric CB2 complexes in WT liver nuclear extracts and only CB1 complexes are detected in both WT and mutant extracts. This confirms the critical role of the E1 site for binding as well as the requirement for the E2 site for tandem complex formation as reported (Rey et al., 2011).
Figure 7
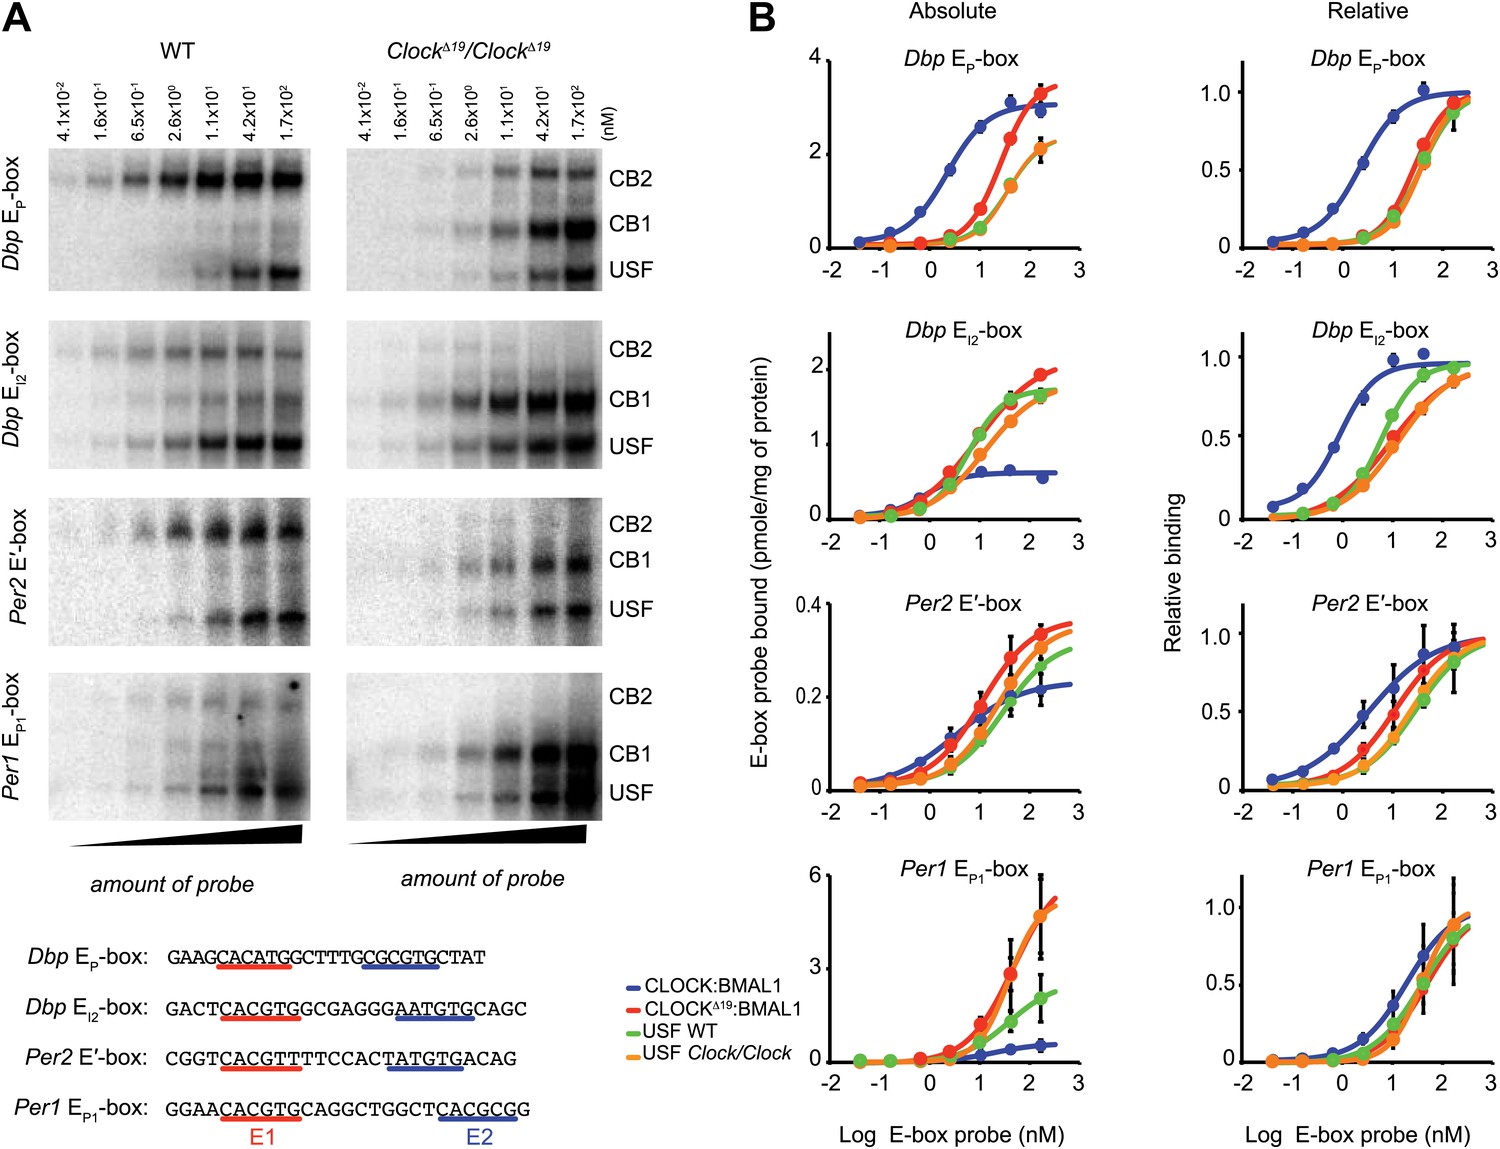
Native CLOCK:BMAL1 and USF1 binding affinity.
(A) Saturation binding kinetics of CLOCK:BMAL1 and USF at E-boxes. EMSA analysis for the Dbp EP, Dbp EI2, Per2 E′, and Per1 EP1 E-boxes, top to bottom, respectively, with different probe concentrations. The left panels are from wild-type and the right panels are from ClockΔ19/ClockΔ19 animals. CB2 (CLOCK:BMAL1 tandem heterodimeric complex); CB1 (CLOCK:BMAL1 heterodimer); USF (USF1:USF1 or perhaps USF1:USF2, USF1:USF2). Sequences for the tandem E-boxes examined are given (bottom; E1 sequence, red; E2 sequence, blue). (B) Analysis of saturation binding kinetics as a function of probe concentration. Left panels represent absolute binding and right panels show binding relative to the maximum. At all sites, CLOCKΔ19:BMAL1 binding affinity is lower than that for CLOCK:BMAL1 and similar to USF binding affinity. Each data point represents the mean ± SEM of three experiments.
Figure 8
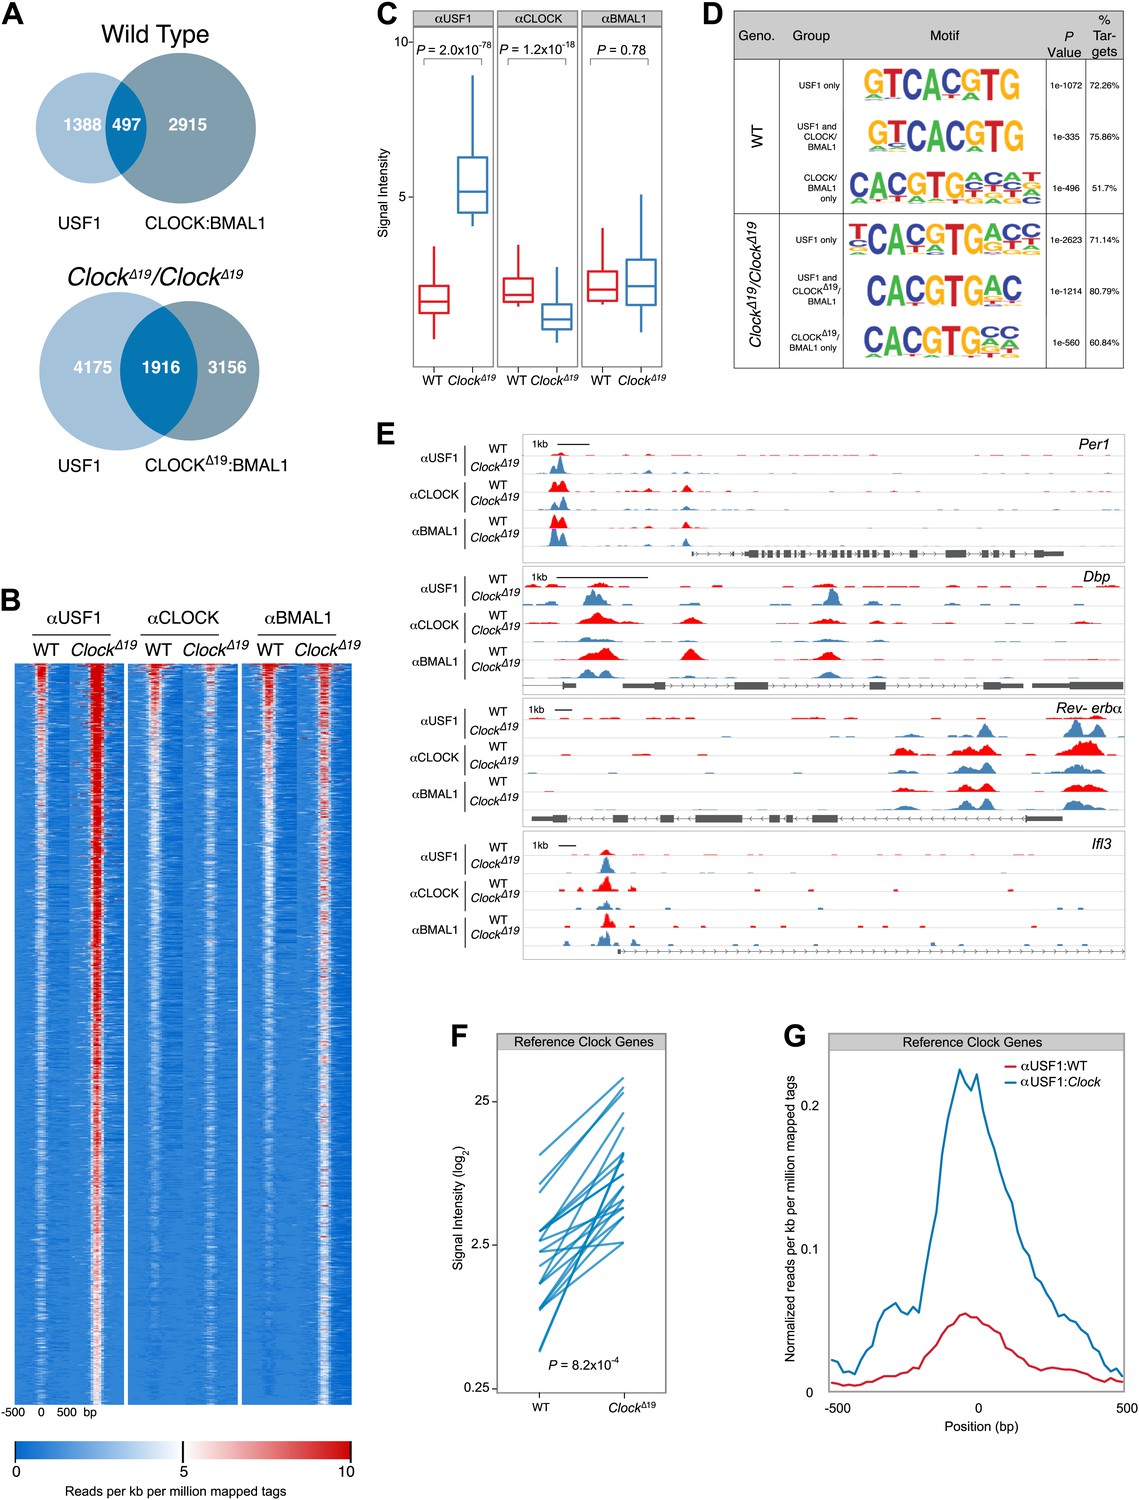
Genome-wide location analysis (Chip-Seq) reveals extensive overlap between USF1 and CLOCK or BMAL1 binding sites.
(A) Venn diagram showing a dramatic increase in sites bound by both USF1 and CLOCK:BMAL1 in ClockΔ19 mutant animals (bottom) as compared to wild-type animals (top). (B) Heat map analysis of the 1916 common sites between USF1 and CLOCK:BMAL1 reveals an increase in the number of USF1 binding sites as well as binding intensity at existing sites in ClockΔ19 mutant animals (left two heat maps). CLOCK binding decreases in ClockΔ19 mutant animals (middle two heat maps), while BMAL1 binding is largely unchanged (right two heat maps). (C) Quantification of the top 200 binding sites for each transcription factor is represented as box plots. Similar to the heat map analysis, USF1 binding increases (left panel), CLOCK binding decreases (middle panel), and BMAL1 binding is unaffected in ClockΔ19 mutant mice (right panel). (D) Motif analysis of each of the six groups of binding sites reveals a common canonical E-box CACGTG sequence. (E) UCSC browser view of binding peaks at four representative genes Per1, Dbp, Rev-erbα, and Ilf3. Each horizontal track represents the ChIP-seq binding signal as described previously (Koike et al., 2012) for either WT (red) or ClockΔ19 mutants (blue) for USF1, CLOCK or BMAL1 as indicated on the left. In each case, USF1 binding increases in ClockΔ19 mutants. (F) Binding signal of USF1 increases at most reference clock genes in ClockΔ19 mutant animals. (G) Averaged histogram view of reference clock genes 1 kb around peak of binding also shows increased binding in ClockΔ19 mutant mice. The ChIP-seq peak lists for USF1, CLOCK and BMAL1 are available in Figure 8—source data 1, 2 and 3 respectively.
-
Figure 8—source data 1
ChIP-seq peak list for USF1.
- https://doi.org/10.7554/eLife.00426.015
-
Figure 8—source data 2
ChIP-seq peak list for CLOCK.
- https://doi.org/10.7554/eLife.00426.016
-
Figure 8—source data 3
ChIP-seq peak list for BMAL1.
- https://doi.org/10.7554/eLife.00426.017
Figure 9
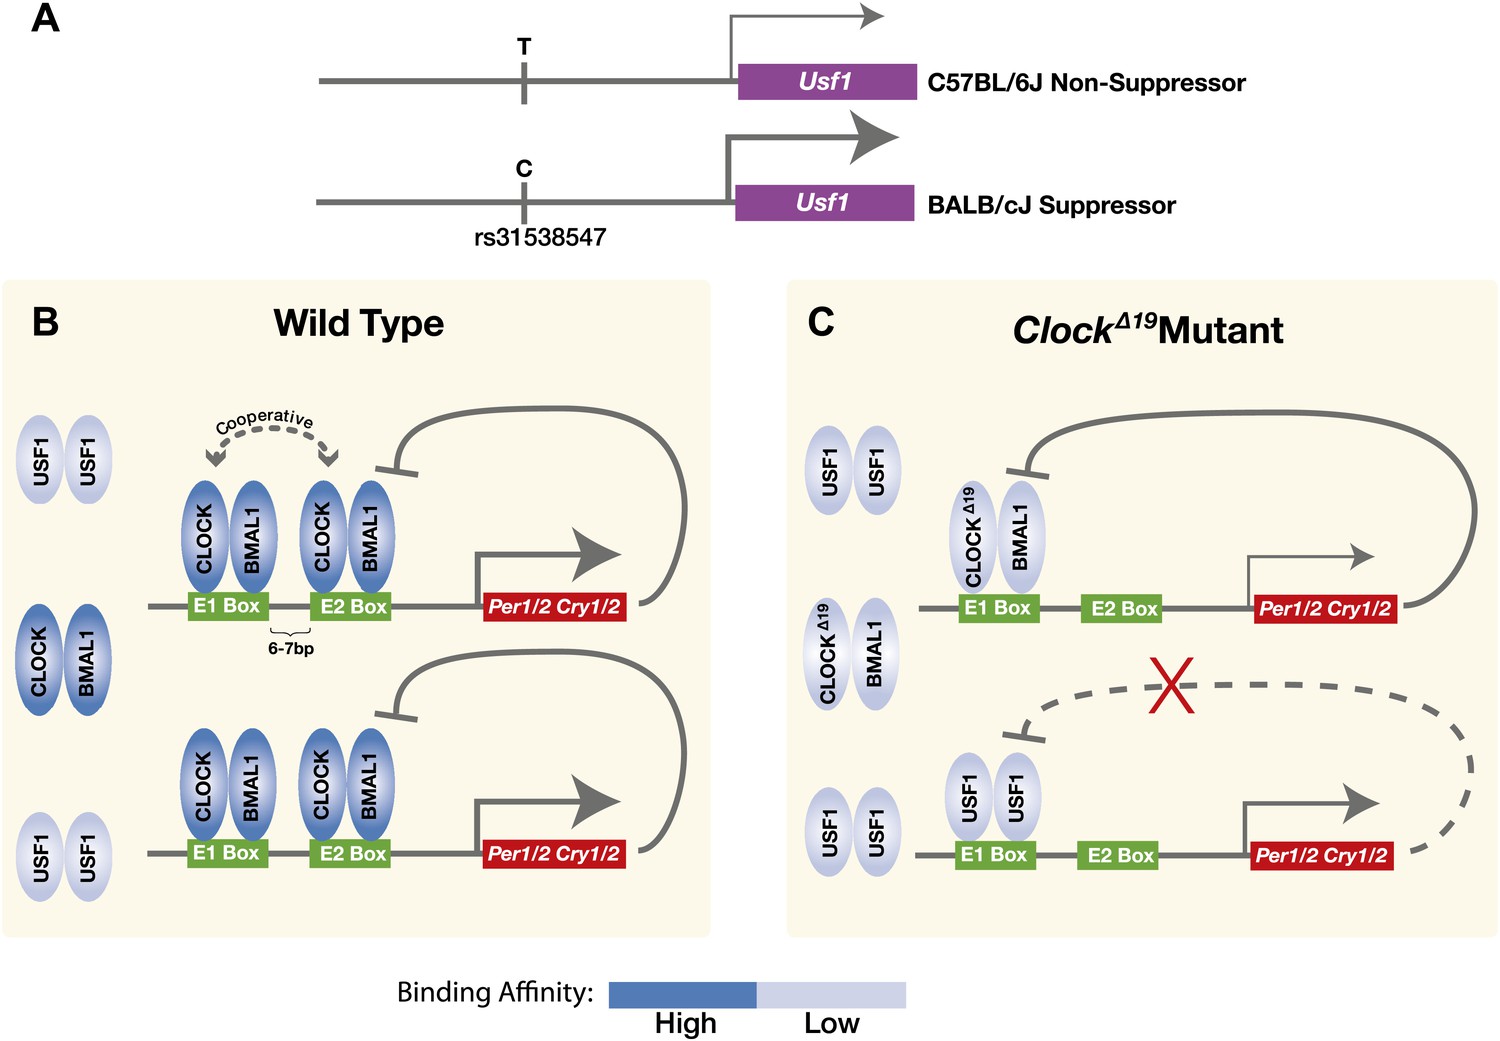
Model for the USF1 suppression of the ClockΔ19 mutation within the circadian clock mechanism.
(A) SNP polymorphisms between B6 and BALB in the Usf1 promoter lead to a cis-mediated increase in Usf1 expression levels in suppressor mouse strains. (B) In the wild-type state, CLOCK:BMAL1 tandem heterodimers bind to tandem E-box sites in the regulatory regions of the Per and Cry genes and interact cooperatively to enhance binding affinity which is much higher than USF1 affinity. Thus, most tandem E-box sites are preferentially bound by wild-type CLOCK:BMAL1 complex over USF1. (C) In contrast, in the ClockΔ19 mutant, the CLOCKΔ19:BMAL1 complex binds to the E1 site primarily as a single heterodimer with an affinity similar to that of USF1, yet lower than that of the wild-type CLOCK:BMAL1 tandem heterodimer complex. This allows USF1 to occupy CLOCK:BMAL1 sites more effectively in the mutant state and, as a consequence, drive transcription of CLOCK:BMAL1 target genes under conditions where mutant CLOCKΔ19:BMAL1 is not transcriptionally competent. Because USF1 is not repressed by CRY1 or CRY2 negative feedback, the transcriptional activation by USF1 may be more responsive than that of CLOCK:BMAL1. However, negative feedback can still occur via CLOCKΔ19:BMAL1 since circadian oscillations can persist in ClockΔ19 mutants.
Tables
Table 1
Two-way ANOVA for identification of Clock suppressor or non suppressor strains in Figure 2A
| Suppressor strain | |||
| Strain name | F-ratio (Clock × strain) | p value | df |
| BALB/cJ | 14.698 | <0.001 | df(1,61) |
| A/J | 13.13 | <0.001 | df(1,44) |
| AKR/J | 9.41 | 0.004 | df(1,44) |
| C3H/HeJ | 56.82 | <0.001 | df(1,52) |
| DBA/2J | 34.92 | <0.001 | df(1,46) |
| FVB/NJ | 7.24 | 0.010 | df(1,47) |
| SJL/J | 12.03 | 0.001 | df(1,55) |
| 129S1/SvImJ | 7.094 | 0.010 | df(1,67) |
| Non-suppressor strain | |||
| C58/J | 0.65 | 0.423 | df(1,46) |
| BTBR_T+_tf/J | 0.01 | 0.911 | df(1,53) |
| I/LnJ | 2.72 | 0.107 | df(1,40) |
| MA/MyJ | 0.02 | 0.891 | df(1,52) |
| JF1/Ms | 0.49 | 0.490 | df(1,37) |
| MOLF/EiJ | 0.90 | 0.348 | df(1,37) |
| CZECHII/EiJ | 0.08 | 0.780 | df(1,46) |
-
Only the F-ratio for interaction is shown. Two-way ANOVA analyses for circadian period were performed with four groups; C57BL/6J WT, F1 WT, C57BL/6J Clock/+ and F1 Clock/+. Suppressor strains show a significant interaction between Clock genotype and strain background (Clock × strain).
Table 2
Subspecific origin of the Soc region of mouse chromosome 1
| Strain | Chromosome | Start position (bp) | End position (bp) | Subspecies | Sup or non-sup |
| BALB/cJ | 1 | 173300000 | 174200000 | Dom | S |
| A/J | 1 | 173300000 | 174200000 | Dom | S |
| AKR/J | 1 | 173300000 | 173302142 | Mus * | S |
| AKR/J | 1 | 173302461 | 174200000 | Dom | S |
| C3H/HeJ | 1 | 173300000 | 174200000 | Dom | S |
| DBA/2J | 1 | 173300000 | 174200000 | Dom | S |
| FVB/NJ | 1 | 173300000 | 174200000 | Dom | S |
| SJL/J | 1 | 173300000 | 174200000 | Dom | S |
| 129S1SvlmJ | 1 | 173300000 | 174200000 | Dom | S |
| C57BL/6J | 1 | 173300000 | 174200000 | Mus | NS |
| C58/J | 1 | 173300000 | 174028368 | Mus | NS |
| C58/J | 1 | 174187607 | 174200000 | Dom* | NS |
| BTBR T<+>tf/J | 1 | 173300000 | 174200000 | Mus | NS |
| I/LnJ | 1 | 173300000 | 174200000 | Mus | NS |
| JF1/Ms | 1 | 173300000 | 174200000 | Mus | NS |
| MOLF/EiJ | 1 | 173300000 | 174200000 | Mus | NS |
| CZECHII/EiJ | 1 | 173300000 | 174200000 | Mus | NS |
-
From the Mouse Phylogeny Viewer (Yang et al., 2011): http://msub.csbio.unc.edu. The AKR/J and C58/J strains contain the proximal and distal breakpoints, respectively, for the Soc locus, and thus there are two entries for these two strains. Dom = M. domesticus, Mus = M. musculus, S = suppressor, NS = non-suppressor.
-
*
does not include Soc locus.
Table 3
Apparent binding affinity (Kd) and maximal binding (Bmax) for CLOCK:BMAL1 and USF at four different E-boxes in Figure 7
| CLOCK:BMAL1 | CLOCKΔ19:BMAL1 | USF1 WT | USF1 ClockΔ19/ClockΔ19 | |
| Dbp EP-box | ||||
| Bmax | 0.97 ± 0.02 | 1.25 ± 0.05 * | 0.83 ± 0.06 | 0.87 ± 0.04 |
| Kd | 2.01 ± 0.22* | 32.94 ± 3.92 | 42.8 ± 9.30 | 49.56 ± 6.20 |
| Dbp EI2-box | ||||
| Bmax | 0.79 ± 0.02* | 2.38 ± 0.05 | 2.25 ± 0.05 | 2.10 ± 0.05 |
| Kd | 0.71 ± 0.10* | 6.18 ± 0.54 | 6.10 ± 0.52 | 9.64 ± 0.96 |
| Per2 E′-box | ||||
| Bmax | 0.26 ± 0.02* | 0.43 ± 0.02 | 0.36 ± 0.03 | 0.41 ± 0.02 |
| Kd | 2.00 ± 0.64* | 8.05 ± 1.57 | 17.81 ± 5.08 | 16.71 ± 2.46 |
| Per1 EP1-box | ||||
| Bmax | 0.74 ± 0.12* | 7.38 ± 1.18 | 3.06 ± 0.64 | 7.96 ± 2.01 |
| Kd | 16.55 ± 9.49 | 43.69 ± 19.40 | 33.36 ± 20.99 | 58.62 ± 37.82 |
-
Values are the mean + SEM derived from four-parameter nonlinear curve-fitting.
-
*
indicates that the Bmax or Kd is significantly different from other groups, p<0.0001.
Additional files
-
Supplementary file 1
Oligonucleotide sequences.
- https://doi.org/10.7554/eLife.00426.019
Download links
A two-part list of links to download the article, or parts of the article, in various formats.
Downloads (link to download the article as PDF)
Open citations (links to open the citations from this article in various online reference manager services)
Cite this article (links to download the citations from this article in formats compatible with various reference manager tools)
Usf1, a suppressor of the circadian Clock mutant, reveals the nature of the DNA-binding of the CLOCK:BMAL1 complex in mice
eLife 2:e00426.
https://doi.org/10.7554/eLife.00426


