Imaging-based chemical screening reveals activity-dependent neural differentiation of pluripotent stem cells
- University of California, San Francisco, United States
- Howard Hughes Medical Institute, University of California, San Francisco, United States
- Fudan University School of Life Sciences, China
- Gladstone Institutes of Neurological Disease, United States
- Taube–Koret Center for Neurodegenerative Disease Research, United States
Figures
Figure 1
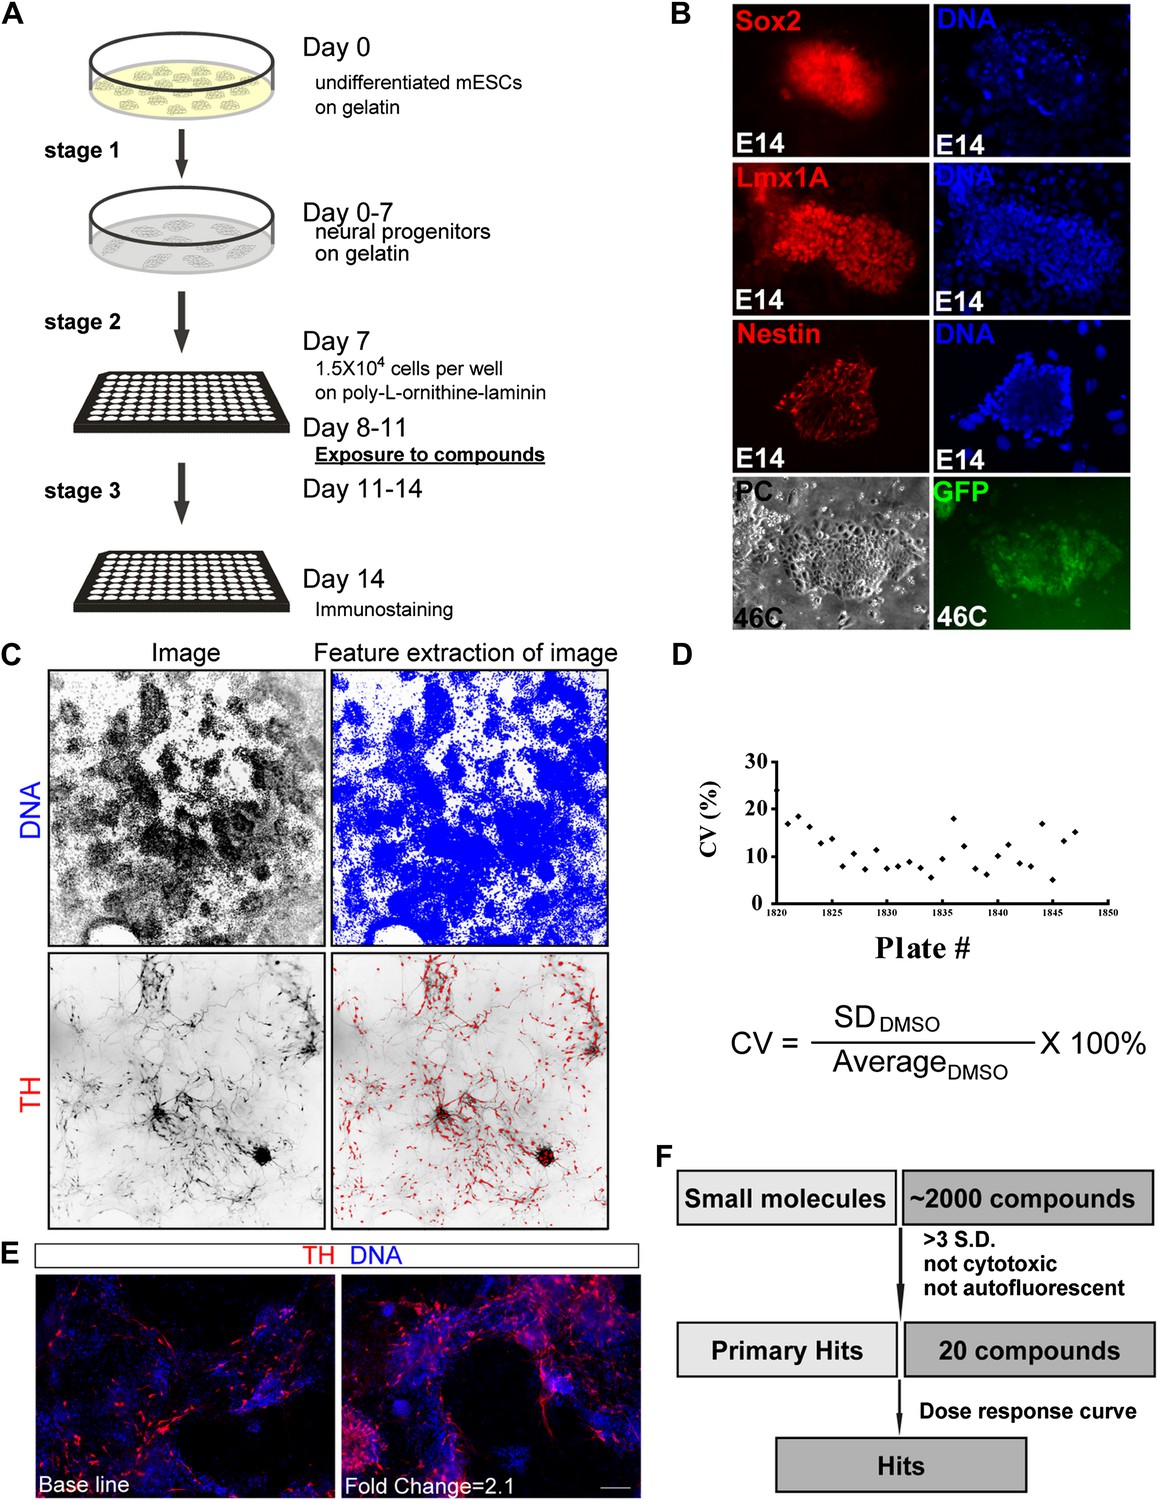
High-throughput screening.
(A) Scheme of the three-stage mESC neuronal differentiation-based chemical screening. (B) E14 mESC cultures express neural progenitor makers (Sox2, Lmx1A, and Nestin) after 7-day stage one culture. 46C mESC cultures, in which GFP is driven by the sox1 promoter, are GFP positive after 7-day stage one culture. (C) The quantification analysis of TH+ neurons among total cells using the INCell Developer software. (D) Summary of coefficient of variation (C.V.) of the DMSO control. (E) Representative images of immunostaining in control (left, treated with DMSO) and a hit compound (right). (F) A schematic summary of the chemical screen. Scale bar, 10 μm.
Figure 2
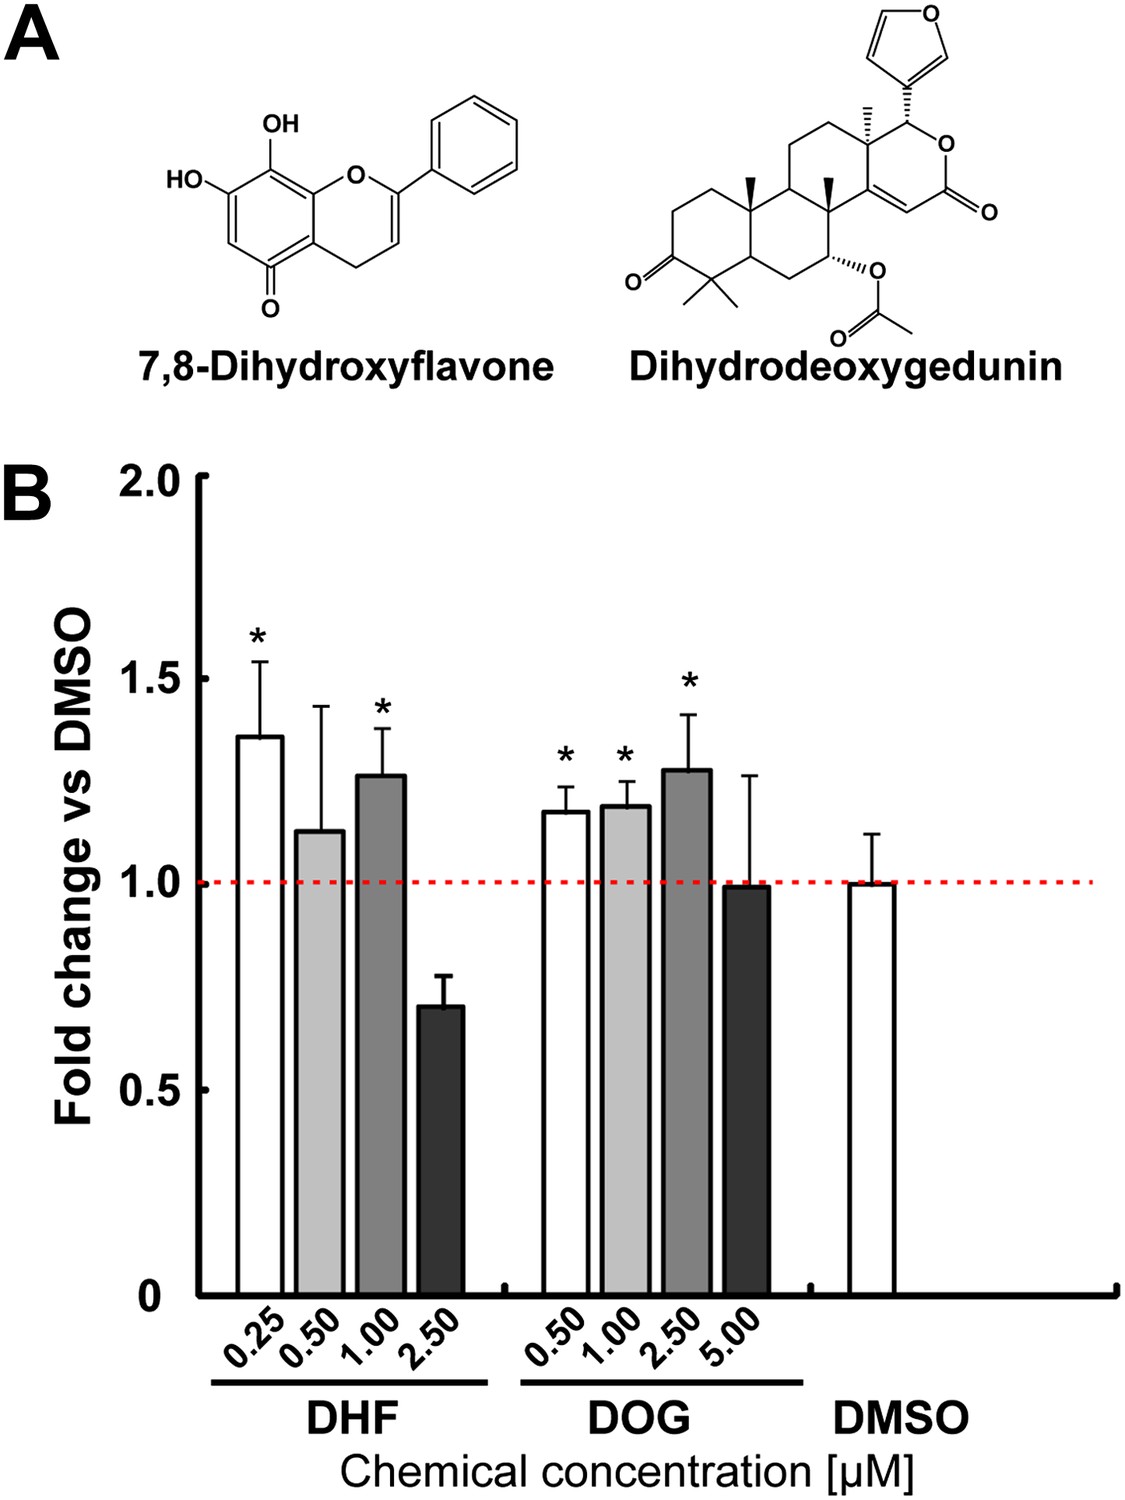
The neurotrophin receptor TrkB agonists [Dihydrodeoxygedunin (DOG) and 7,8-dihydroxyflavone (DHF)] increases TH+ cells in mESC cultures.
(A) Structure of DHF and DOG. (B) DHF and DOG increase TH% in mESCs (t test, p<0.05, n = 4).
Figure 3
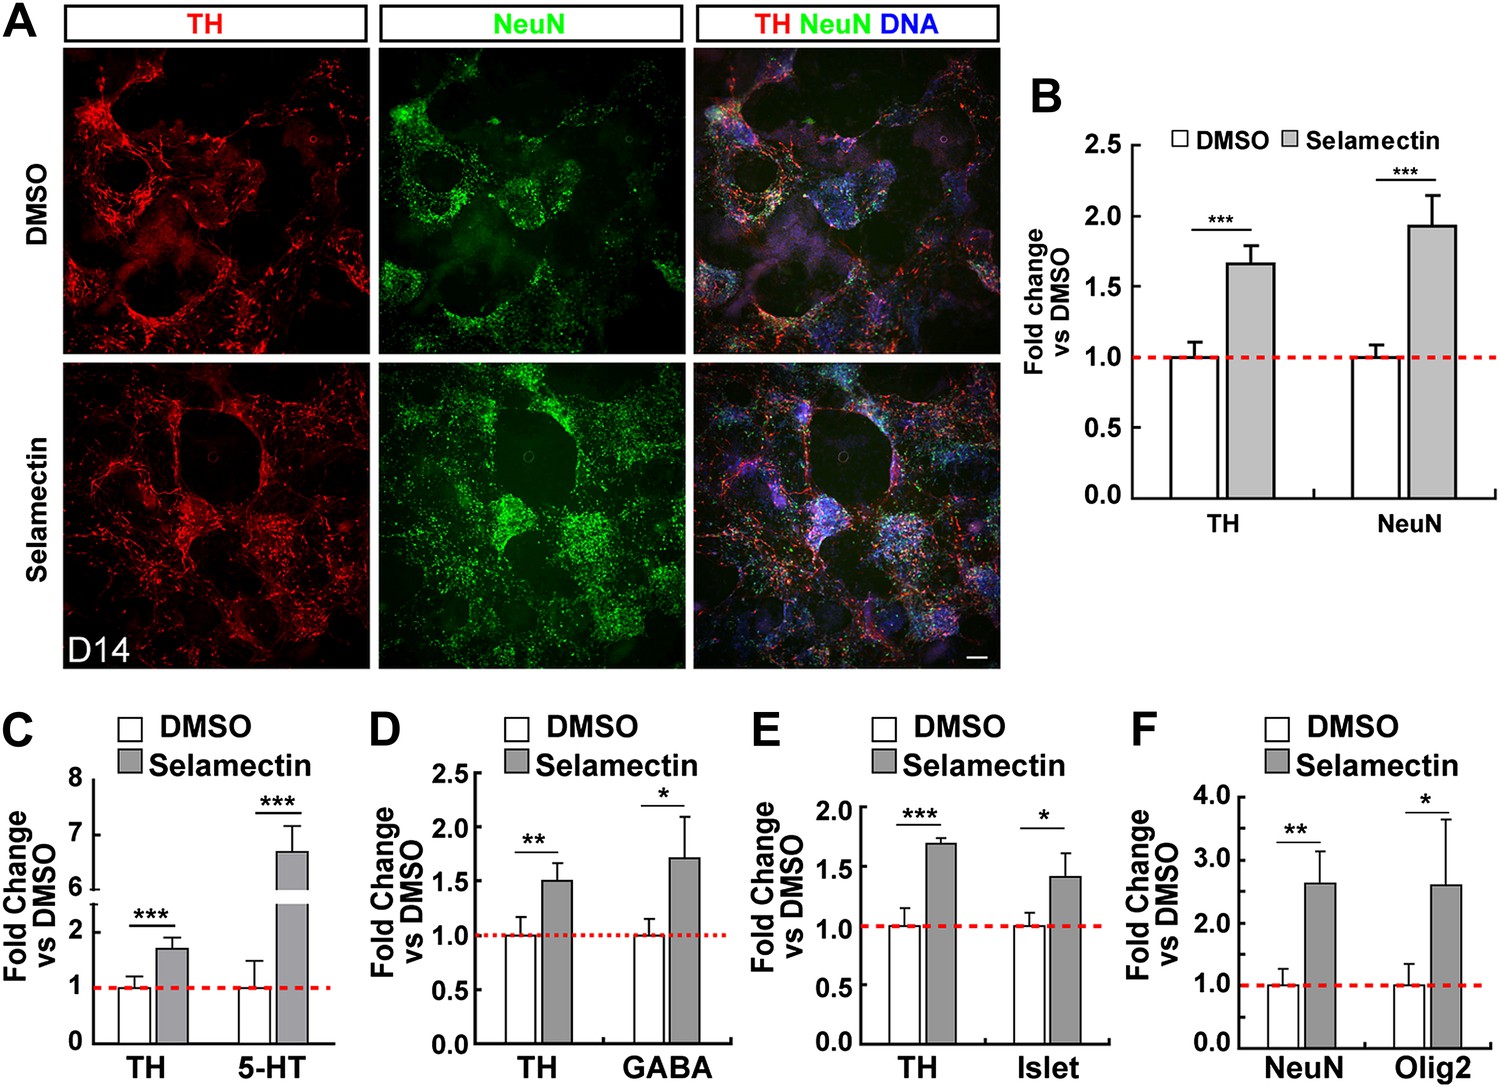
Selamectin increases mESC differentiation into multiple neural lineages.
(A) Representative images of TH and NeuN staining in control (DMSO) and selamectin-treated cultures. (B) Quantification shows increased production of both TH+ and total neurons by selamectin (t-test, n = 4, p<0.001). (C–F) Selamectin treatment also increases the production of 5-HT neurons (C), GABAergic neurons (D), islet+ motor neurons (E), and Olig2+ oligodendocyte precursors (F) (t-test, n = 4, *p<0.05, **p<0.01, ***p<0.001).
Figure 4
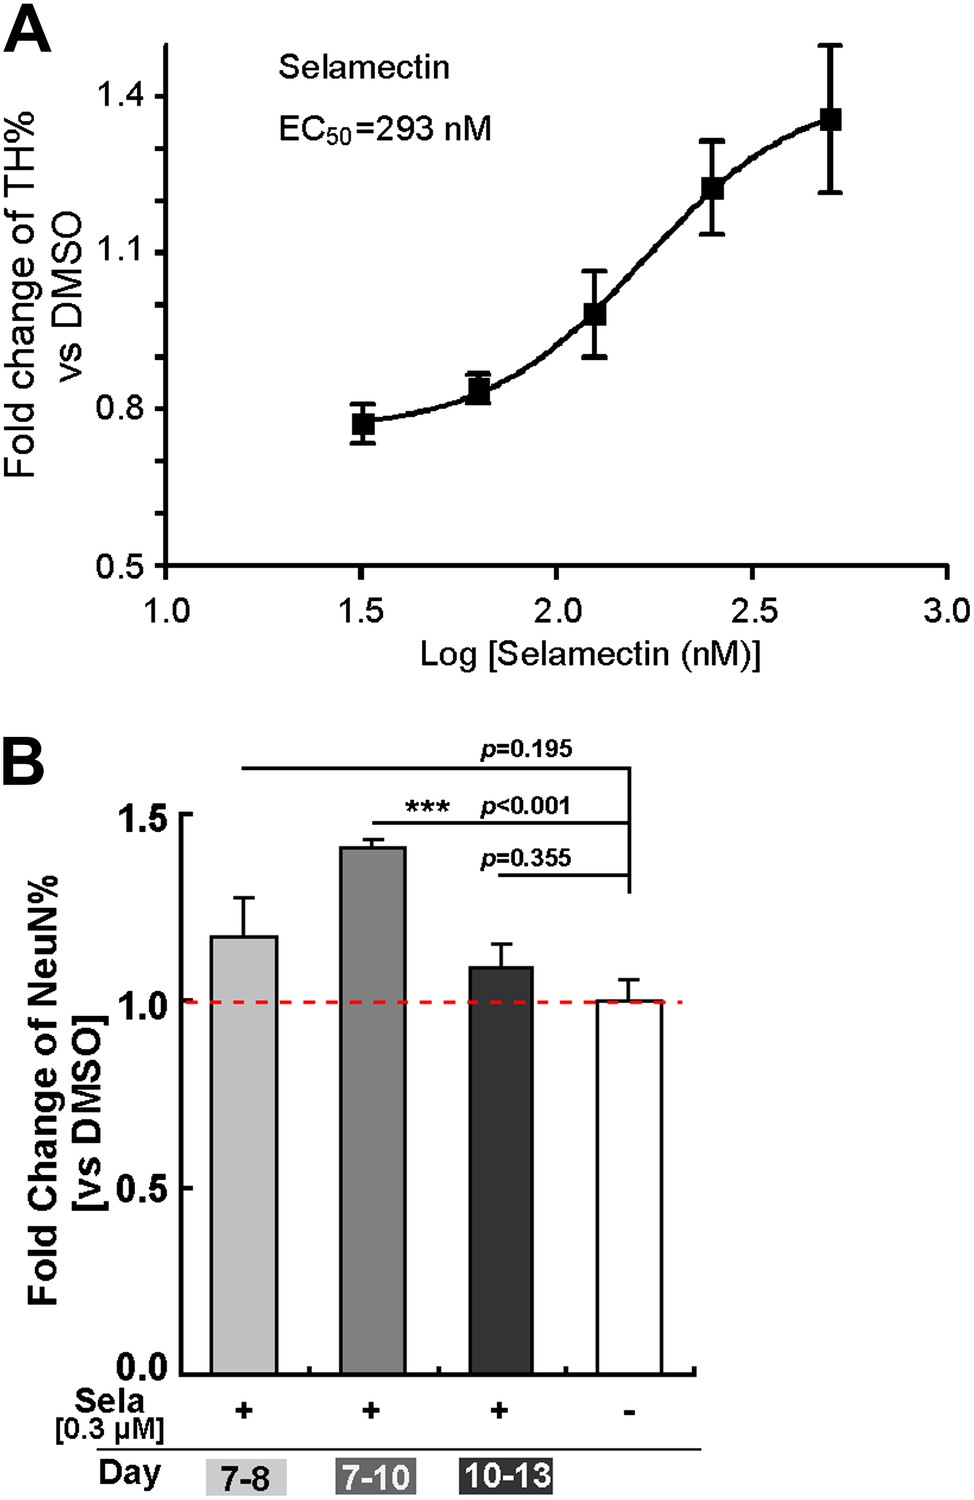
Dose response and time course of selamectin’s action in mESC cultures.
(A) Dose response curve of selamectin (based on TH immunostaining). Cells were treated from Day 8 to Day 11. Selamectin is toxic above 500 nM. The EC50 value and curve fitting were performed with GraphPad Prism using a Sigmoidal dose-response (variable slope). Data are presented as mean ± S.D., n = 4. (B) Time course of selamectin’s action. Only cells treated with selamectin from Day 7 to Day 10 show significant increase of TH+ neurons (t-test, n = 4).
Figure 5
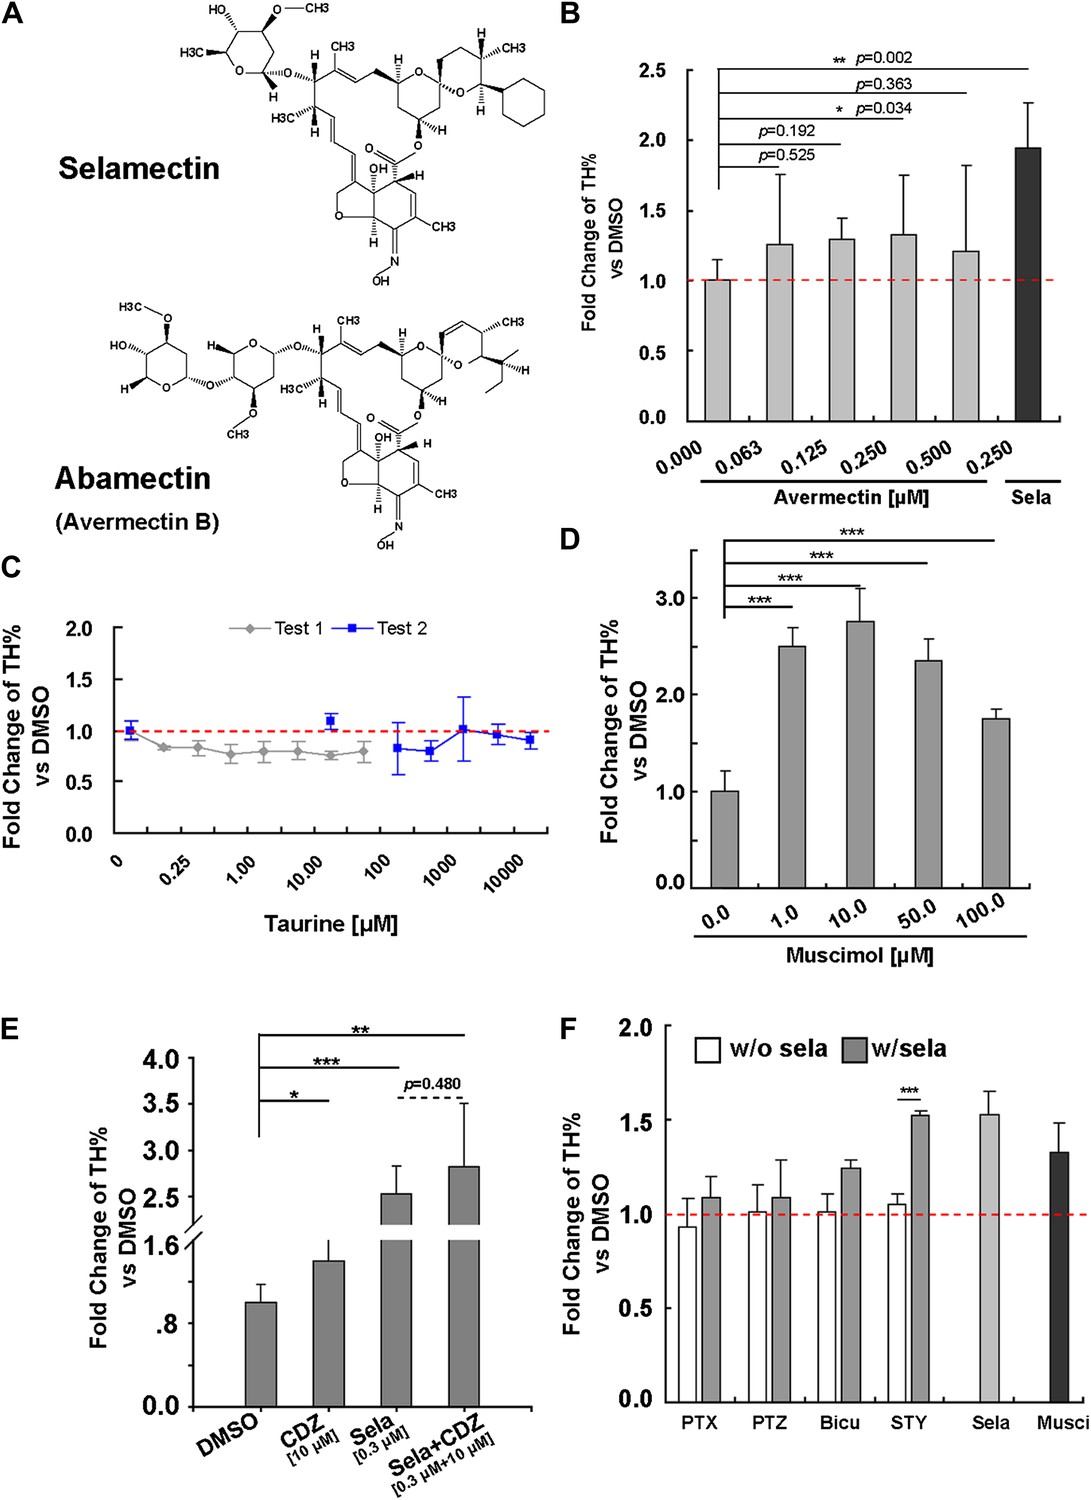
Pharmacological evidence indicates that selamectin’s proneurogenic activity is mediated by GABAA receptors.
(A) Selamectin and avermectin belong to a chemical family of macrocyclic lactones and have the same structural backbone. (B) Avermectin has less potent proneurogenic activity than selamectin. Only 250 nM avermectin shows a significant effect, which was much less potent compared to that of 250 nM selamectin (t-test, n = 4, p=0.034 for Avermetin vs p=0.002 for selamectin). (C) Taurine, the most abundant endogenous ligand for glycine receptors during neocortical development has no proneurogenic activity in mESC cultures. (D) Muscimol, a GABAA receptor agonist, has a significant proneurogenic activity (t-test, n = 4, p<0.001). (E) Chlordiazepoxide (CDZ), a positive allosteric modulator of GABAA receptor, also has a significant proneurogenic activity (t-test, p<0.05), but there was no obvious additive effect when cells were treated with both selamectin and CDZ (t-test, p=0.480). (F) The GABAA receptor antagonist bicucullin and non-competitive blockers picrotoxin and pentylenetetrazol alone had no effect on neuronal production (white columns, control group were normalized to fold change = 1, displayed as the red dot line). However, when tested together with selamectin, the effect of selamectin was blocked (gray columns). In contrast, the glycine receptor inhibitor strychnine does not block the effect of selamectin. Final concentration: Bicuculline (Bicu) = 100 μM; Picrotoxin (PTX) = 500 μM; Pentylenetetrazol (PTZ) = 5 mM; Strychnine (STY) = 100 μM; Selamectin (Sela) = 0.3 μM; Muscimol (Musci) = 10 μM (t-test, n = 4).
Figure 6
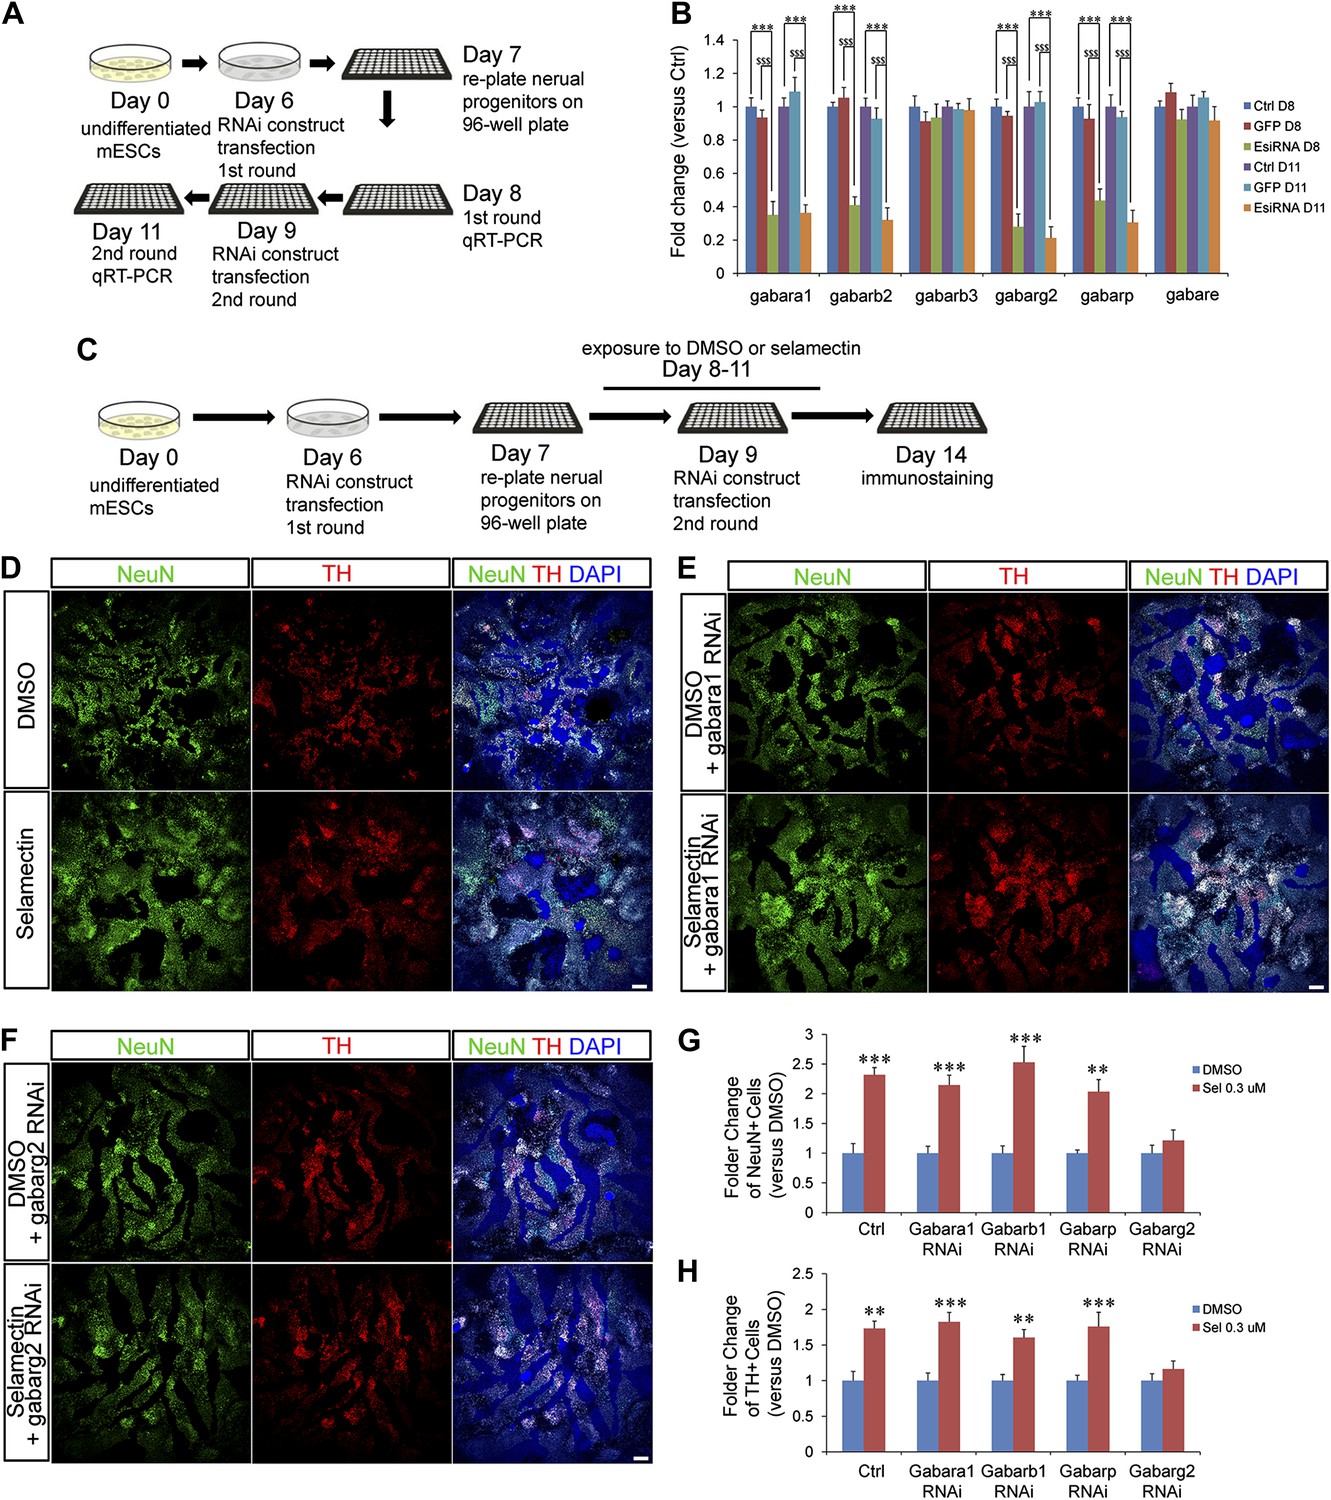
Genetic evidence indicates that selamectin’s proneurogenic activity is mediated by the γ2 subunit-containing GABAA receptor.
(A) Scheme of the EsiRNA transfection and cell harvest for qRT-PCR. (B) qRT-PCR shows fold change of the expression of different GABAA receptor subunits after EsiRNA transfection. ***p<0.001 vs non-transfection control, $$$p<0.001 vs GFP RNA transfection control. (C) Scheme of the EsiRNA knockdown experiment to identify the GABAA receptor subunit that mediates selamectin’s activity. (D–F) Representative images of NeuN and TH staining in DMSO and selamectin-treated cultures of non-transfected (D), α1 EsiRNA transfected (E), and γ2 EsiRNA transfected (F). (G) Quantification shows knockdown of γ2 subunit but not α1β1 and π subunits abolishes the effect of selamectin in increasing neurons (n = 4, **p<0.01, ***p<0.001 vs DMSO). (H) Quantification shows knockdown of γ2 subunit but not α1β1 and π subunits abolishes the effect of selamectin in increasing TH+ neurons neurons (n = 4, **p<0.01, ***p<0.001 vs DMSO). Scale bar, 100 μm.
Figure 7
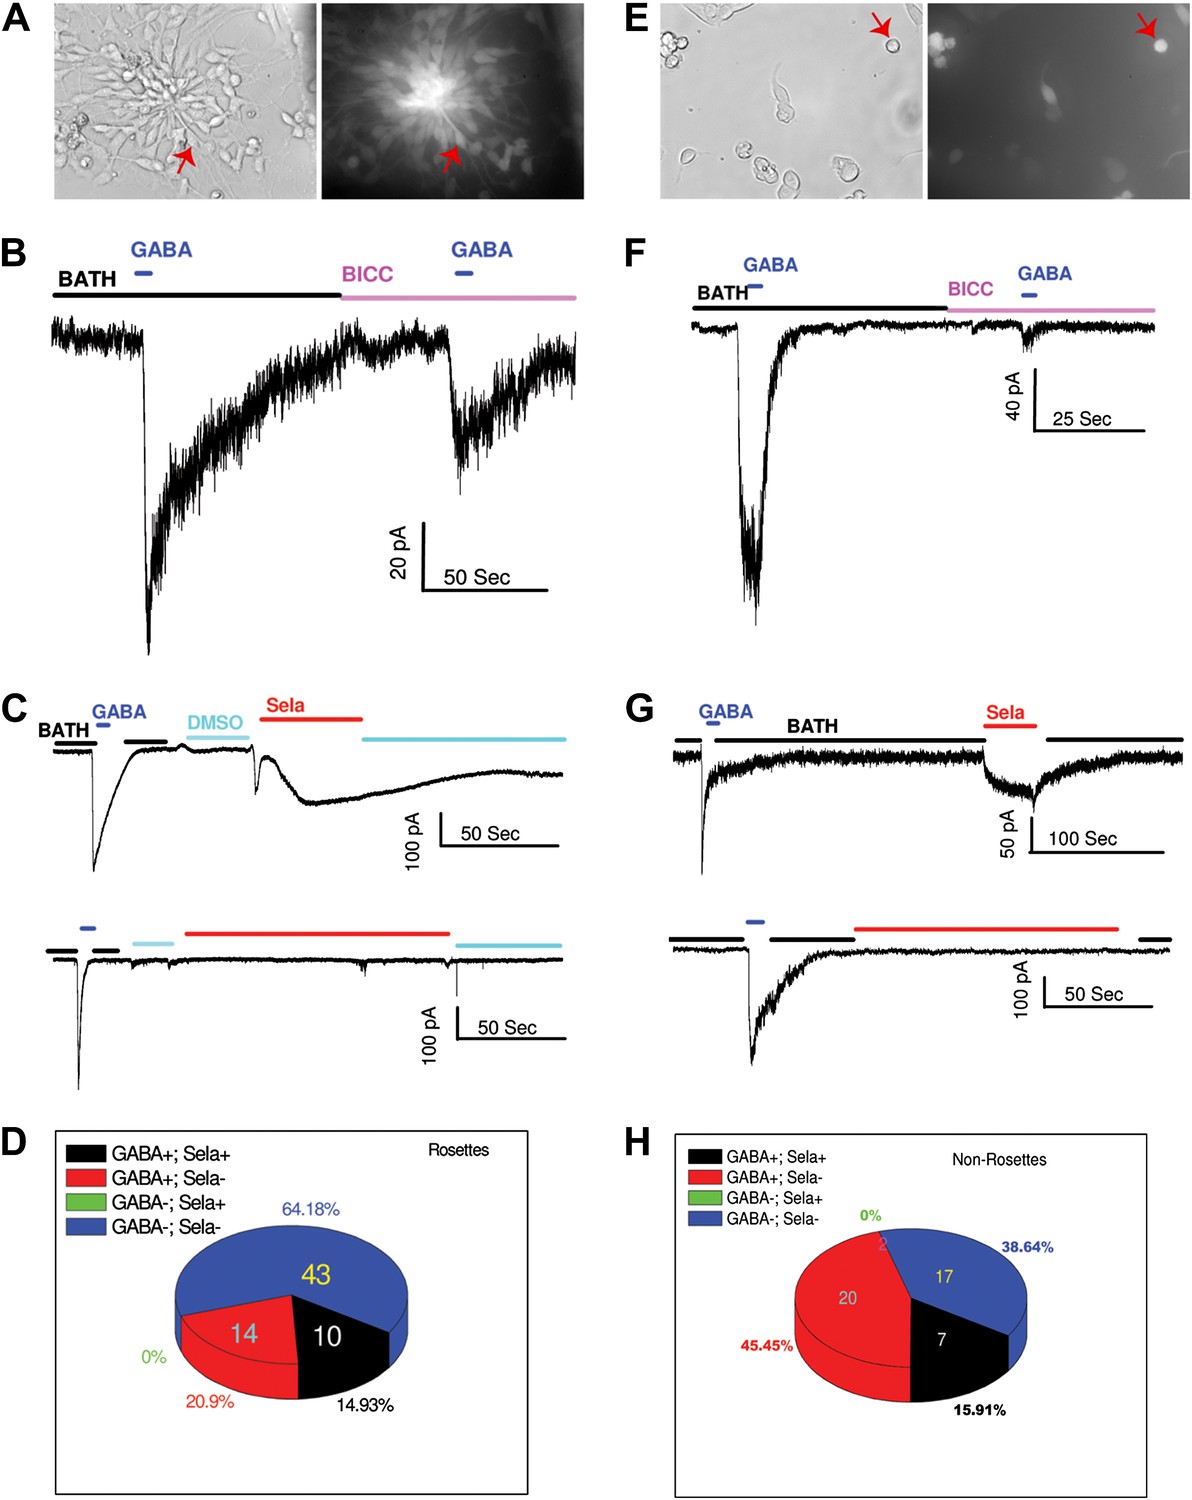
GABA and selamectin (Sela)-induced currents in neural rosettes and non-rosette cells.
(A) Bright field (BF) image (left) and green fluorescent protein (GFP) signal (right) of neural rosette cells. Majority of the cells in the view are neural rosette cells, and one of them with typical morphology is indicated by a red arrow. (B) An example of reduction of GABA (500 μM) induced currents by bicuculline (BICC, 200 μM). (C) Upper trace, an example of neural rosette cell displaying GABA (100 μM) induced currents that also displayed selamectin induced current. Lower trace, an example of neural rosette cell displaying GABA (100 μM) induced currents that did not display selamectin induced current. 16 μM Selamectin solution contains 0.4% DMSO, therefore 0.4% DMSO containing bath solution was used as the control solution as indicated in the figure. (D) A pie chart of the numbers of the four groups of neural rosette cell based on whether they displayed GABA and selamectin induced currents. The four groups are: 1) GABA+; Sela+, 2) GABA+; Sela−, 3) GABA−; Sela+, 4) GABA−; Sela−. The number of the cells in each group is indicated in the figure, except the group GABA−; Sela+, which is zero. (E) Bright field (BF) image (left) and green fluorescent protein (GFP) signal (right) of non-rosette cells. One cell with typical young neuron morphology is indicated by a red arrow. (F) Example of the inhibition of GABA (100 μM) induced currents by bicuculline (BICC, 100 μM). (G) Upper trace, an example of non-rosette cell displaying GABA (4 mM) induced current that also displayed salemectin (8 μM) induced current. Lower trace, an example of non-rosette cell displaying GABA (400 μM) responsive induced current that did not display salemectin (16 μM) induced current. (H) A pie chart of the numbers of four groups of non-rosette cells based on whether they displayed GABA and selamectin induced currents. The four groups are: 1) GABA+; Sela+, 2) GABA+; Sela−, 3) GABA−; Sela+, 4) GABA−; Sela−. The number of the cells in each group is indicated in the figure, except the group GABA−; Sela+, which is zero. The application time courses of the control solution (BATH), GABA, bicuculline (BICC) and selamectin (Sela) are indicated by horizontal bars in the figure. The membrane potential was holding at −70 mV in all recordings. The scales for time (horizontal) and currents (vertical) are indicated for each recording in the figure.
Figure 8
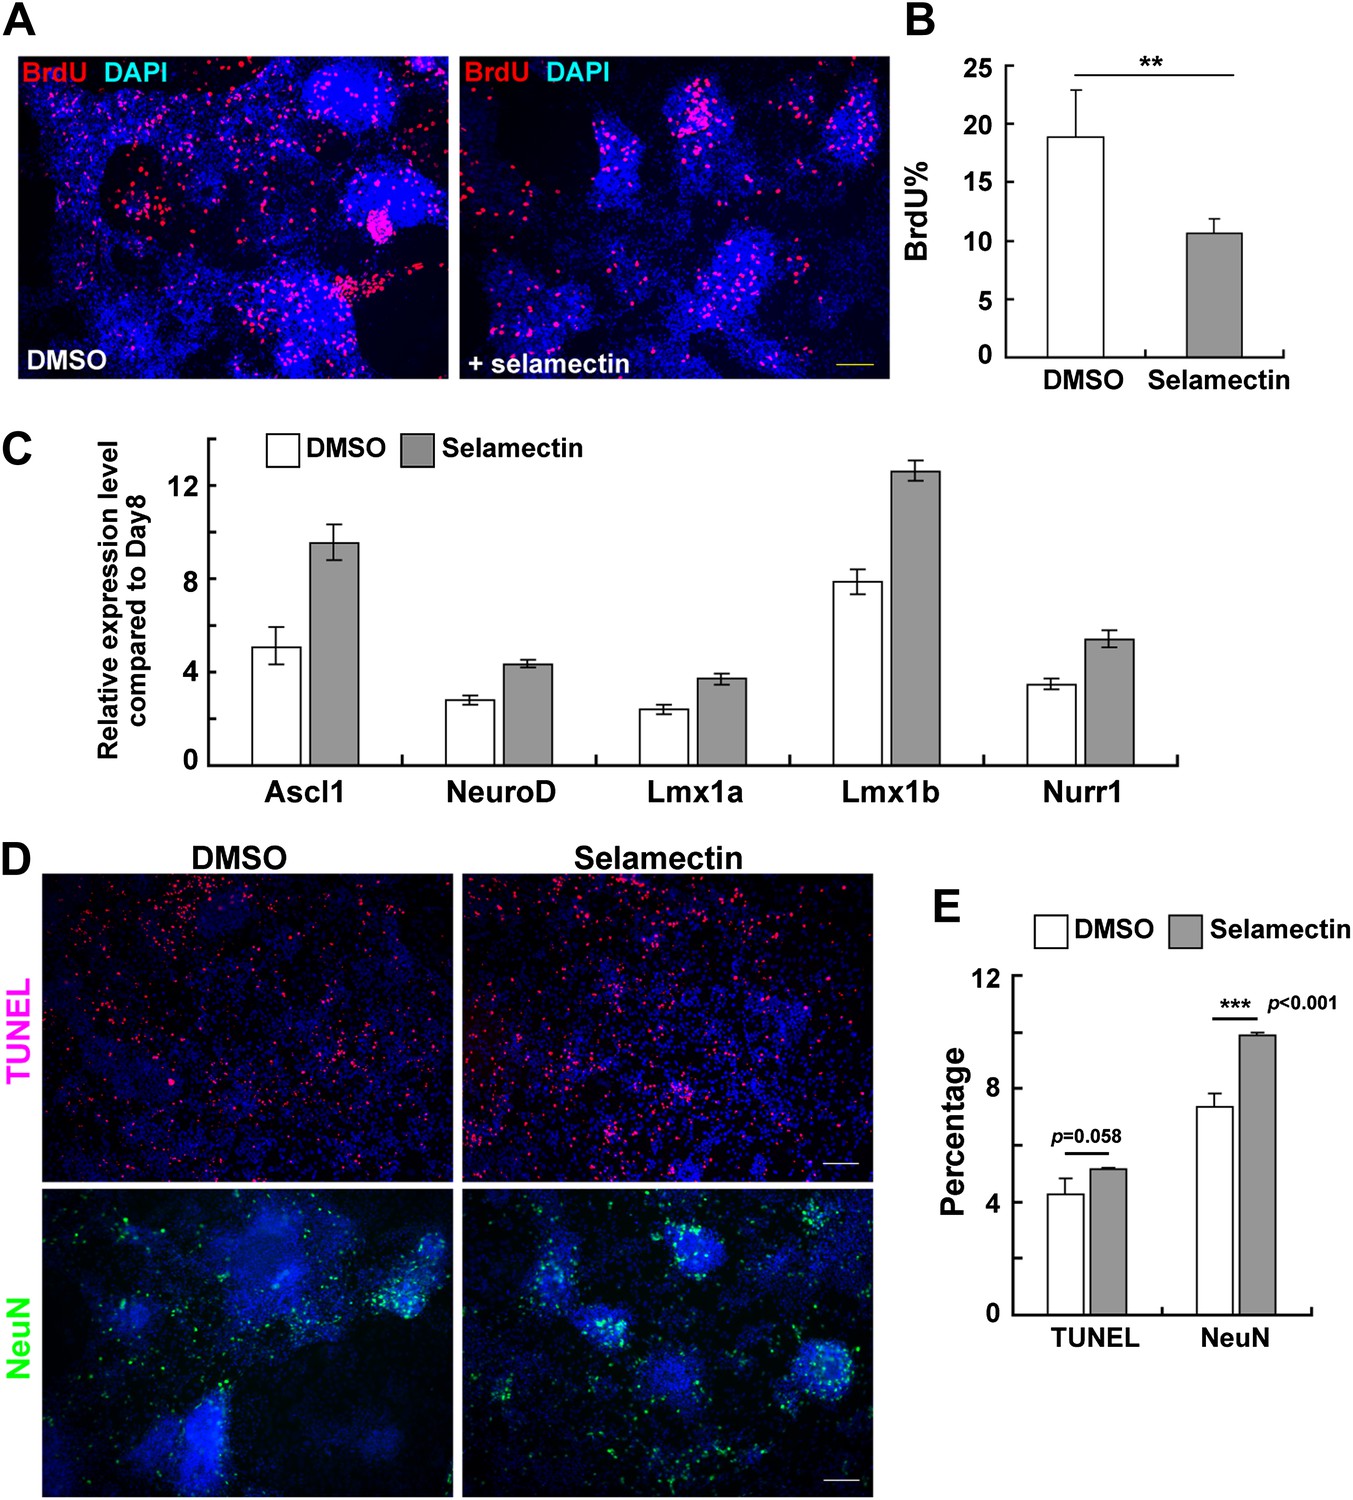
Selamectin decreases proliferation and increases the expression of proneural and lineage-associated transcription factors.
(A) Representative fields show the BrdU incorporation on Day 11 after cells were treated with selamectin (right panel) or DMSO (left panel) for 4 days. Significantly fewer BrdU+ cells were detected in the selamectin-treated group. (B) Quantification as the percentage of BrdU+ cells among total cells (t-test, n = 4, p=0.008). (C) qRT-PCR detects increased expression of proneural (Ascl1, NeurD) and lineage-associated transcription factors (Lmx1a, Lmx1b and Nurr1) in selamectin-treated group. β-actin was used as an input control and data was normalized to expression level on Day 8. (D) Representative fields show the TUNEL staining on Day 14 in cell cultures treated with DMSO or selamectin, with NeuN staining as a control to confirm selamectin efficacy in this experiment. (E) Quantification shows significant difference in NeuN% (p<0.001) and no significant difference in TUNEL% (p=0.058) (t-test, n = 4). Scale bar, 10 μm.
Figure 9
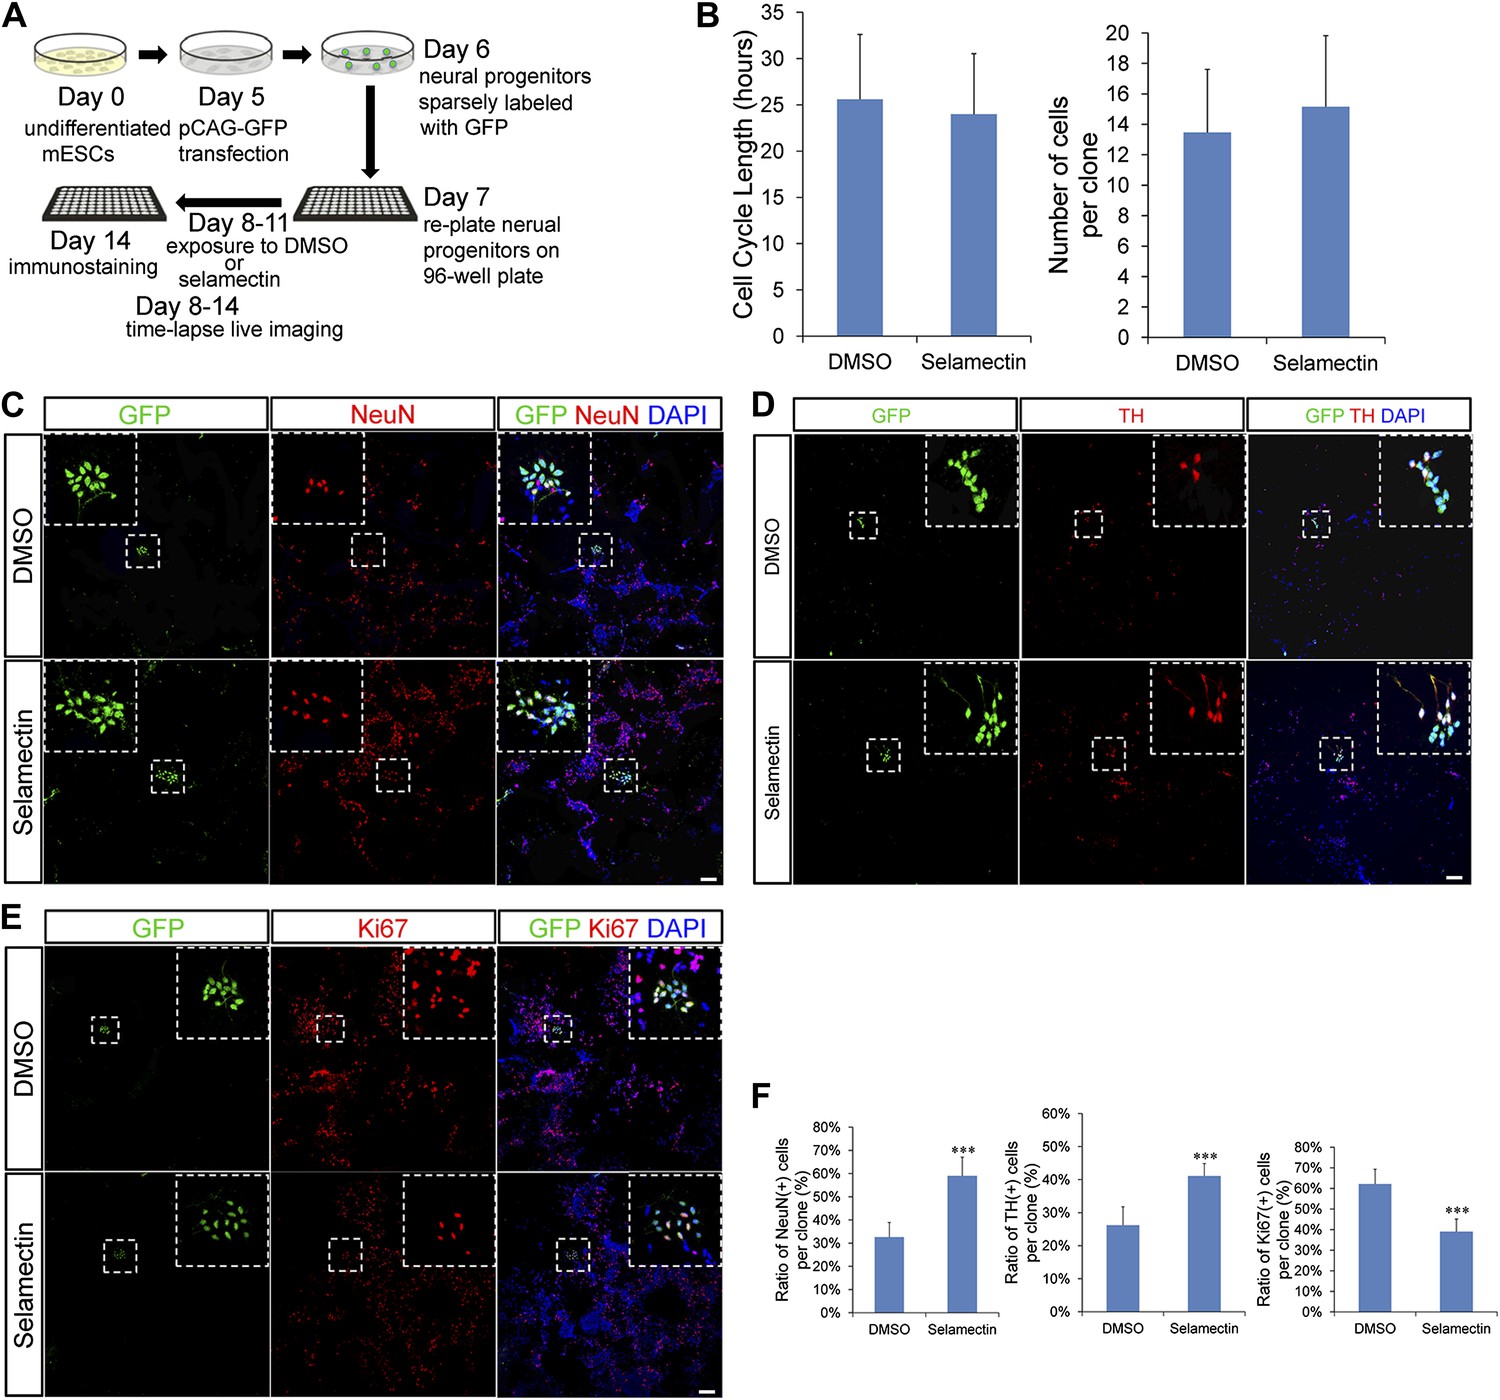
Clonal analysis reveals that selamectin promotes progenitor cell cycle exit toward terminal differentiation.
(A) Scheme of clonal culture analyses. (B) Quantification of cell cycle length and number of cells within single clones. (C–E) Representative images of double immunostaining of GFP with NeuN (C), TH (D), or the proliferation marker Ki67 (E) within single clones. (F) Quantification of the percentage of NeuN+ (left, DMSO n = 49, selamectin n = 51), TH+ (middle, DMSO n = 6, selamectin n = 7), and Ki67+ cells (right, DMSO n = 46, selamectin n = 41) within single clones. ***p<0.001 vs DMSO). Scale bar, 100 μm.
Figure 10

Selamectin increases the differentiation of multiple neuronal lineages from human pluripotent stem cells.
(A) Scheme of the three-stage neuronal differentiation protocol for H9 hESCs and hiPSCs. (B) Representative images of NeuN and TH staining in control (DMSO) and selamectin-treated cultures of H9 hESCs. (C) Quantification shows increased production of both TH+ and total neurons by selamectin in H9 hESCs. (n = 4, *p<0.05, **p<0.01, ***p<0.001 vs DMSO). (D) Representative images of NeuN and TH staining in control (DMSO) and selamectin-treated cultures of hiPSCs. (E) Quantification shows increased production of both TH+ and total neurons by selamectin in hiPSCs. (n = 4, *p<0.05, **p<0.01, ***p<0.001 vs DMSO). Scale bar, 100 μm.
Figure 11
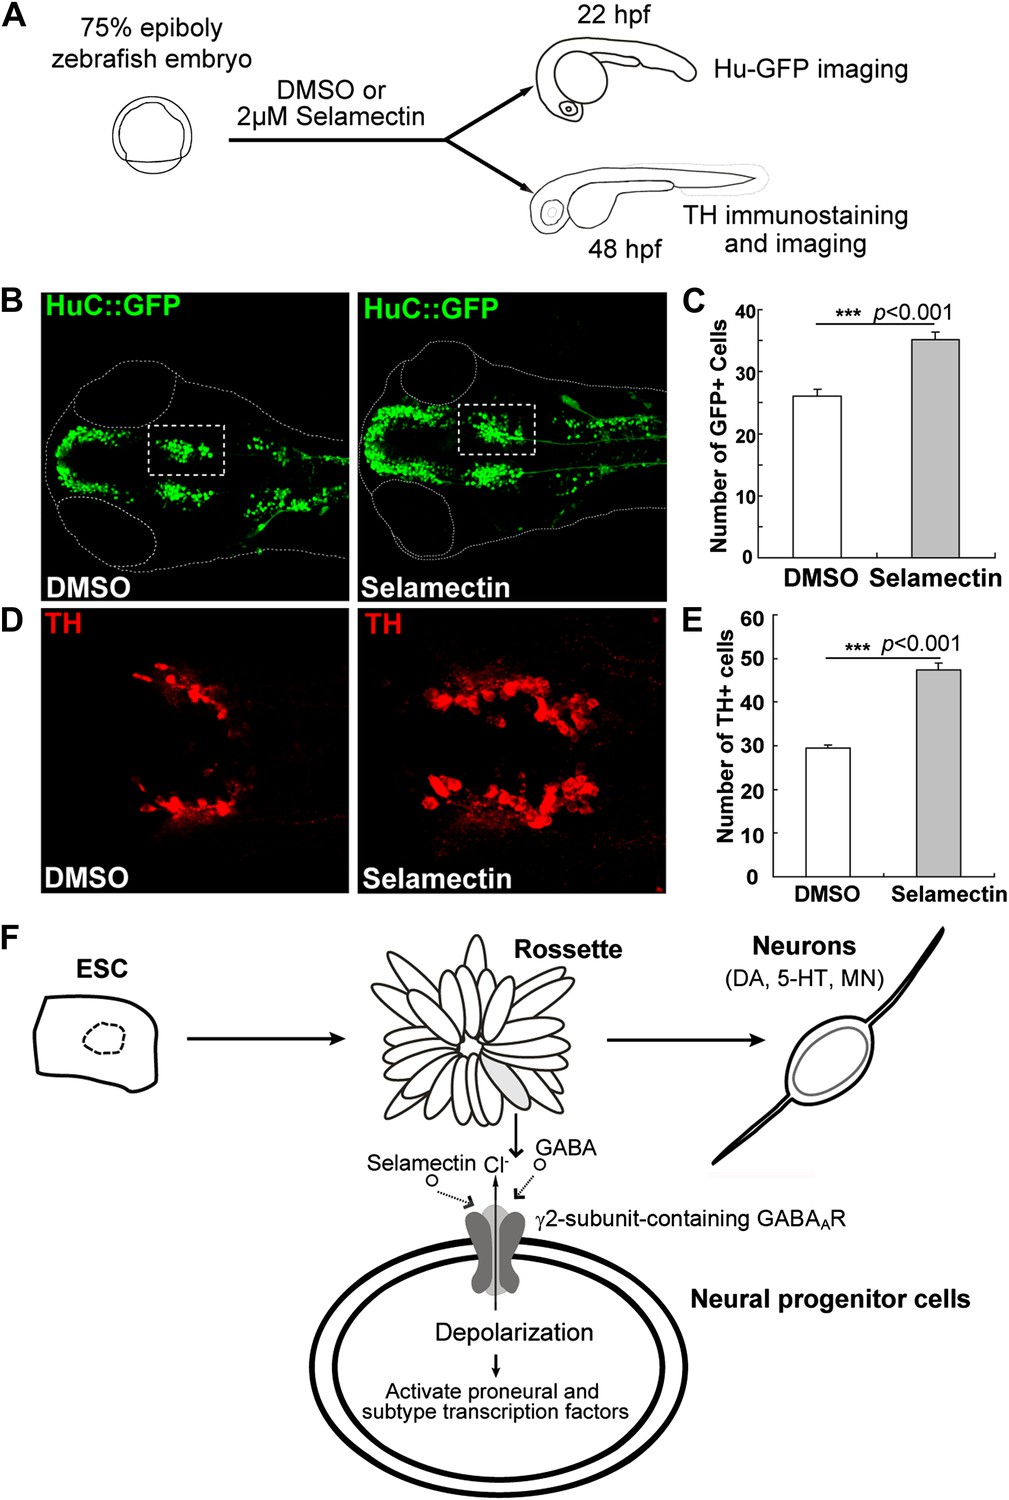
Selamectin promotes neurogenesis in vivo in the developing zebrafish brain.
(A) Scheme of the selamectin treatment on HuC:GFP transgenic zebrafish embryos. (B) Representative images show that selamectin (2 μM, 14 hr from 8 hpf to 22 hpf) increases Huc-GFP signal. (C) Quantification of the midbrain cluster (boxed) shows a significant difference between two groups (t-test, n = 20, p<0.001). (D) Representative images show increased DA neurons in selamectin-treated embryos (2 μM for 40 hr from 8 hpf to 48 hpf). (E) Quantification of the ventral forebrain DA neurons shows a significant difference between two groups (t-test, n = 10, p<0.001). (F) A schematic model shows the effect of selamectin on neuronal differentiation from mESCs.
Videos
Video 1
Time-lapse of a single GFP labeled neural progenitor derived from mESC. The progenitors were treated with DMSO from Day 8 to Day 11. The interval between each frame is 2 hr.
Video 2
Time-lapse of a single GFP labeled neural progenitor derived from mESC. The progenitors were treated with 0.3 μM Selamectin from Day 8 to Day 11. The interval between each frame is 2 hr.
Download links
A two-part list of links to download the article, or parts of the article, in various formats.
Downloads (link to download the article as PDF)
Open citations (links to open the citations from this article in various online reference manager services)
Cite this article (links to download the citations from this article in formats compatible with various reference manager tools)
Imaging-based chemical screening reveals activity-dependent neural differentiation of pluripotent stem cells
eLife 2:e00508.
https://doi.org/10.7554/eLife.00508


