Histone demethylase Lsd1 represses hematopoietic stem and progenitor cell signatures during blood cell maturation
- Boston Children's Hospital and Dana-Farber Cancer Institute, Harvard Medical School, United States
- Howard Hughes Medical Institute, Harvard Medical School, United States
Figures
Figure 1 with 1 supplement
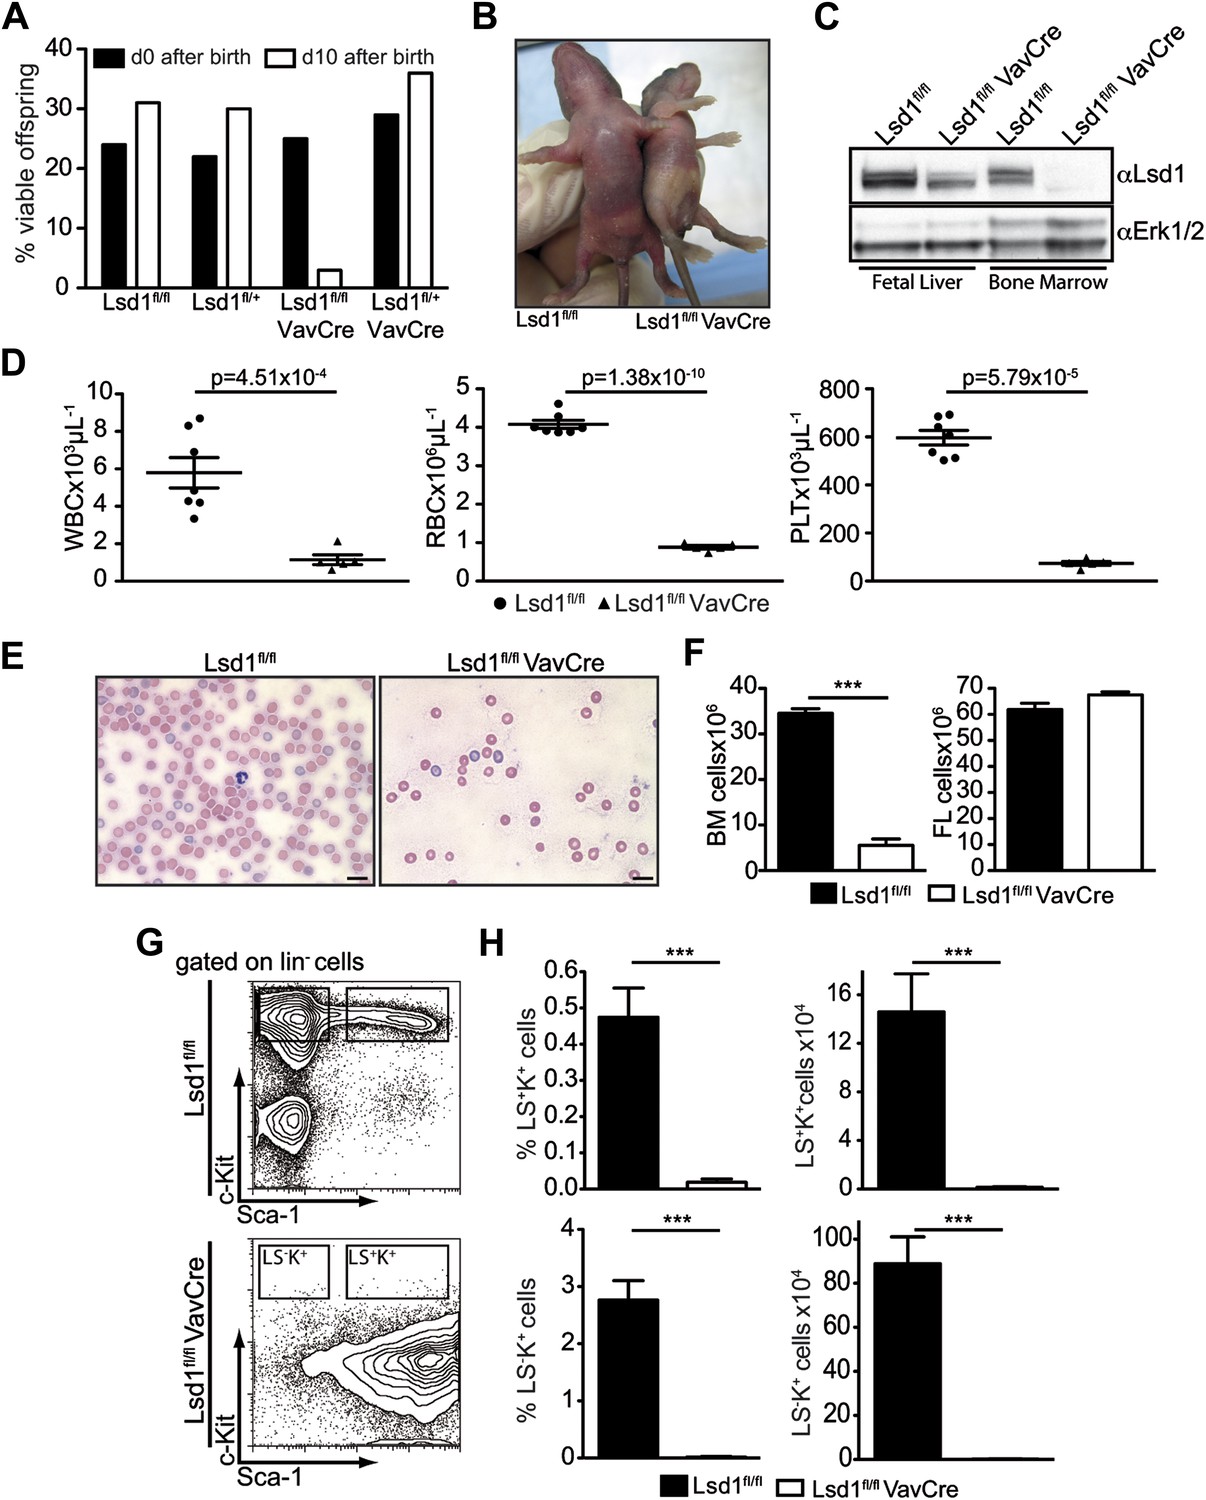
Deletion of Lsd1 results in pancytopenia.
(A) Lsd1fl/fl VavCre cohort statistics 0 and 10 days after birth (n = 146 pups). (B) Lsd1fl/fl and Lsd1fl/fl VavCre newborn pups. (C) Western blot analysis of E13.5 fetal liver and newborn bone marrow cells with indicated genotypes. (D) Differential PB counts of 5-day-old control and Lsd1fl/fl VavCre pups. Data are expressed as mean ± SEM; n ≥ 5 mice per group. (E) May Gruenwald Giemsa–stained blood smears of Lsd1fl/fl VavCre and control pups. (F) Cell counts of femurae and tibiae and E14.5 fetal livers of control and Lsd1fl/fl VavCre neonates and embryos, respectively. Data are expressed as mean ± SEM; n ≥ 8 per group for fetal livers and n ≥ 4 per group for bone marrow. (G) Immunophenotypic analysis of control and Lsd1fl/fl VavCre bone marrow hematopoietic stem and progenitor cells. (H) Frequency and absolute numbers of lin− Sca-1− c-Kit+ cells (LS−K+; containing CMP, GMP, and CMP populations) and lin− Sca-1+ c-Kit+ cells (LS+K+; containing HSC and MPP populations). Data are expressed as mean ± SEM; n ≥ 4 per group.
Figure 1—figure supplement 1
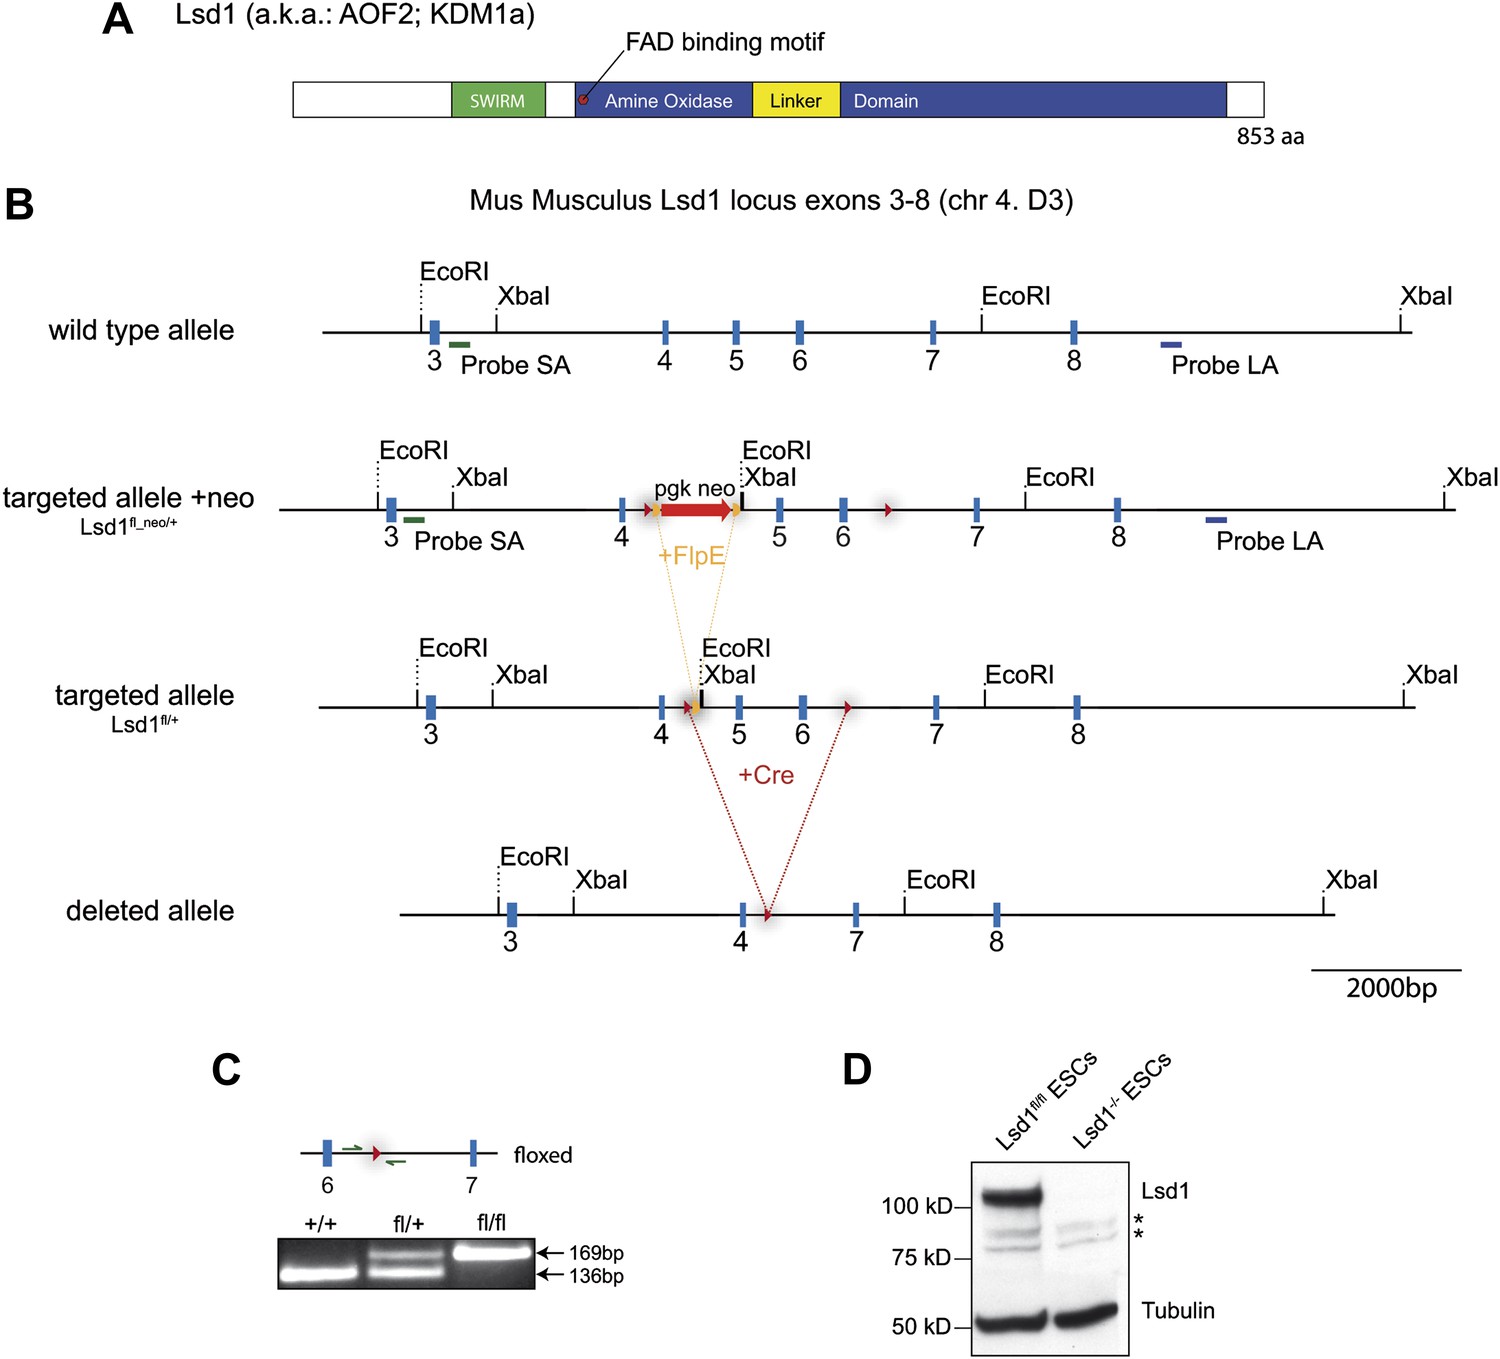
Lsd1 targeting strategy.
(A) Illustration of Lsd1 protein domain structure. (B) Mouse Lsd1 locus (Chr4. D3) drawn to scale; Untargeted wild-type allele (exons 3–8); targeted allele +neo (fl_neo/+): wild-type exons 5 and 6 have been replaced with a loxP sites flanked cassette carrying a frt site flanked neomycin resistance gene and exons 5 and 6; targeted allele −neo (fl/+): targeted allele after FlpE-mediated neomycin cassette deletion; deleted allele: Knockout allele after cre-mediated deletion of exons 5 and 6. (C) PCR genotyping of +/+; fl/+, and fl/fl allele. (D) Western blot analysis of Lsd1fl/fl and Lsd1−/− embryonic stem cell lysates.
Figure 2 with 2 supplements
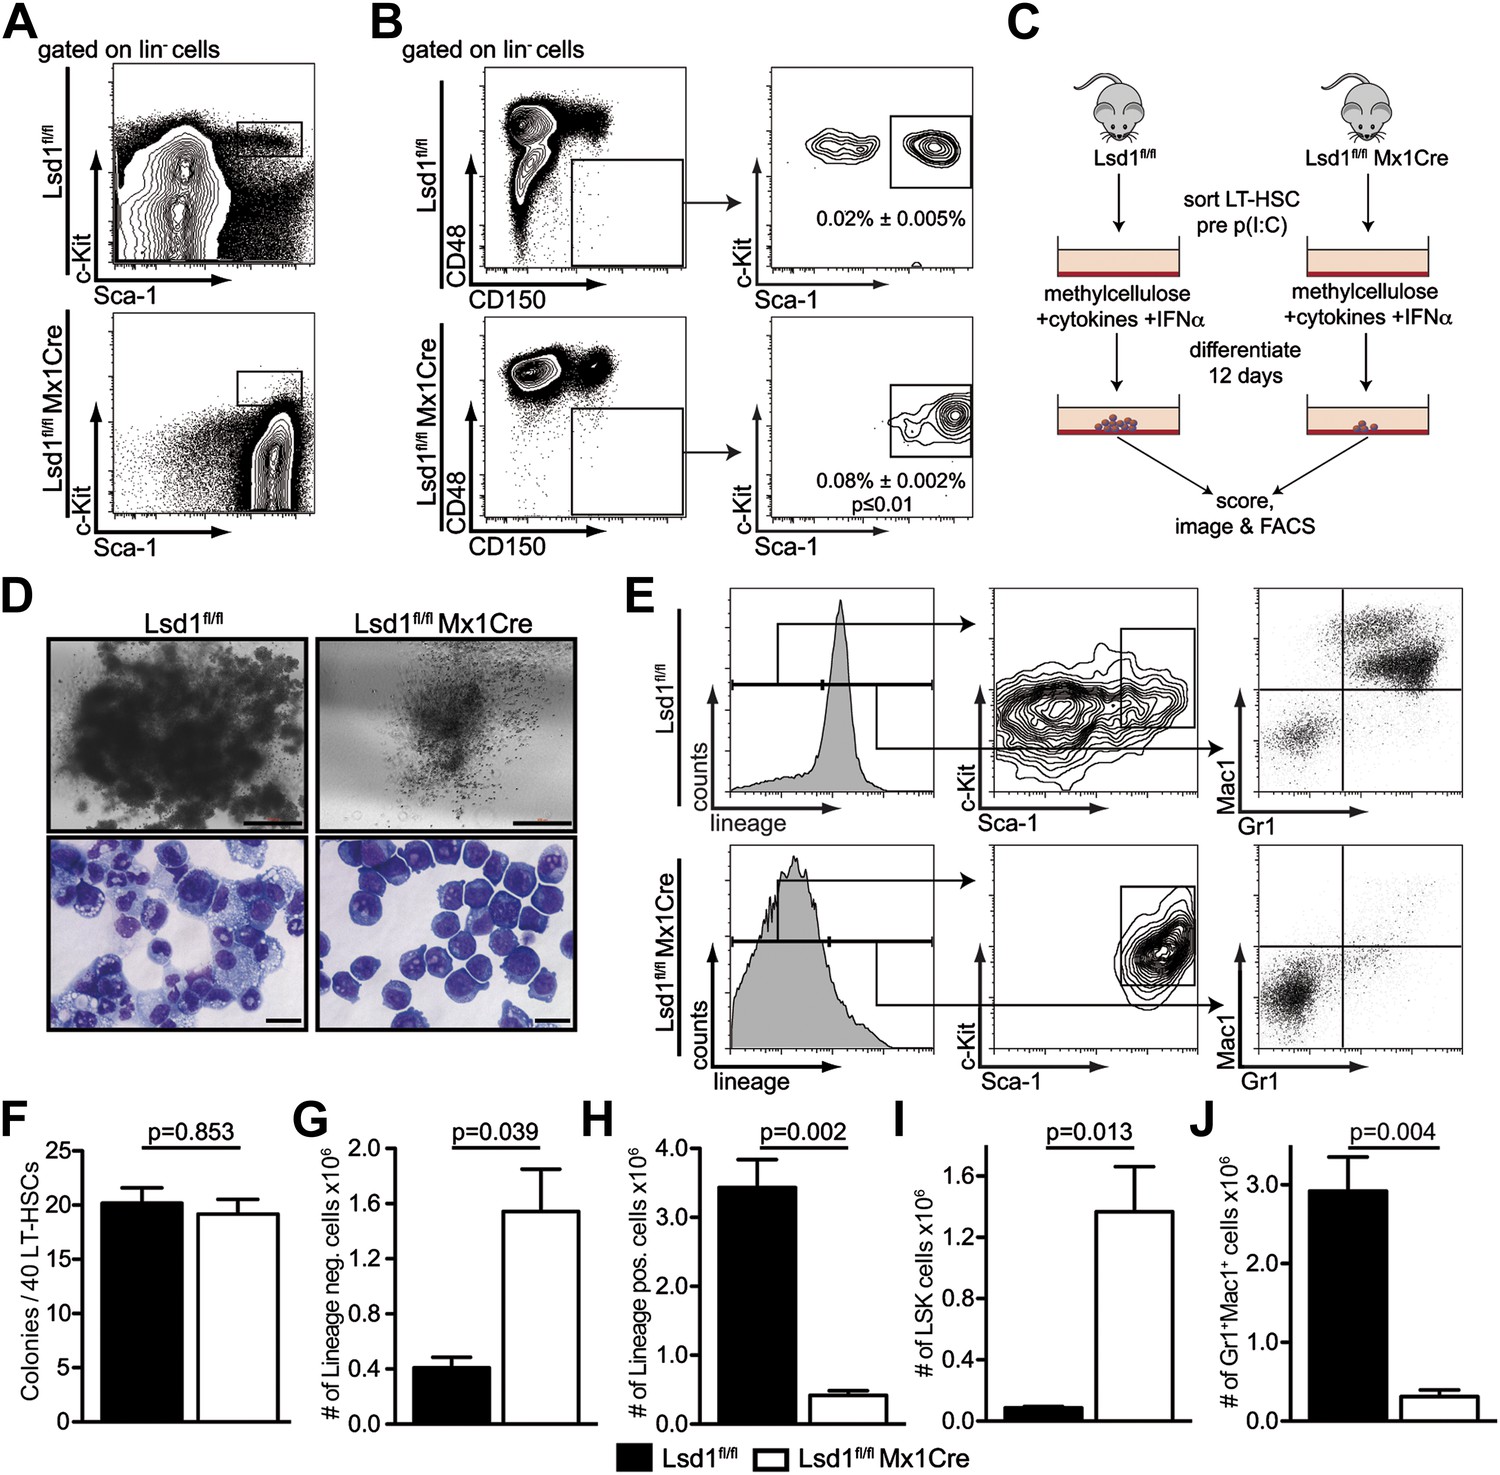
Lsd1 knockout HSCs fail to give rise to terminally differentiated cells.
(A) Immunophenotypic analysis of control and Lsd1fl/fl Mx1Cre hematopoietic stem and progenitor cells 1 week after final poly(I:C) dose. (B) Alternative gating logic for analysis of Lsd1fl/fl Mx1Cre and control hematopoietic stem cells: lin− CD150+ CD48− cells were gated first, followed by analysis of Sca-1+ c-Kit+ cells. Frequency of lin− CD150+ CD48− Sca-1+ c-Kit+ cells is presented as percentage of lineage-depleted bone marrow cells. Data are expressed as mean ± SEM; n ≥ 4 mice per group. (C) Experimental outline of LT-HSC colony-forming cell assays. Control and Lsd1fl/fl Mx1Cre CD150+CD48− LS+K+ cells were isolated by FACS prior to poly(I:C) treatment. Forty LT-HSCs were plated in methylcellulose containing 1000 U/ml IFNα, to induce Lsd1 deletion in vitro. (D) Colony morphology of LT-HSC colony-forming cell assays (top panel, scale bar: 500 µM) and May Gruenwald Giemsa–stained cytospin preparations from LT-HSC colony-forming cell assays (lower panel, scale bar: 40 µM). (E) Flow cytometric analysis with indicated antibodies of cells isolated from colony assays after 12 days of differentiation. (F) Number of colonies obtained after 12 days in colony-forming cell assay. Data are expressed as mean ± SEM; n ≥ 6 mice per group. (G) and (H) Absolute numbers of lineage-positive and lineage-negative cells per colony assay. Data are expressed as mean ± SEM; n ≥ 6 mice per group. (G and H) Absolute numbers of LS+K+ and Gr1+Mac1+ cells per colony assay. Data are expressed as mean ± SEM; n ≥ 6 mice per group.
-
Figure 2—source data 1
Source data for Figure 2—figure supplement 2. Background corrected CT values of FACS-sorted single cells analyzed by BIOMARK Fluidigm microfluidics qPCR.
- https://doi.org/10.7554/eLife.00633.006
Figure 2—figure supplement 1
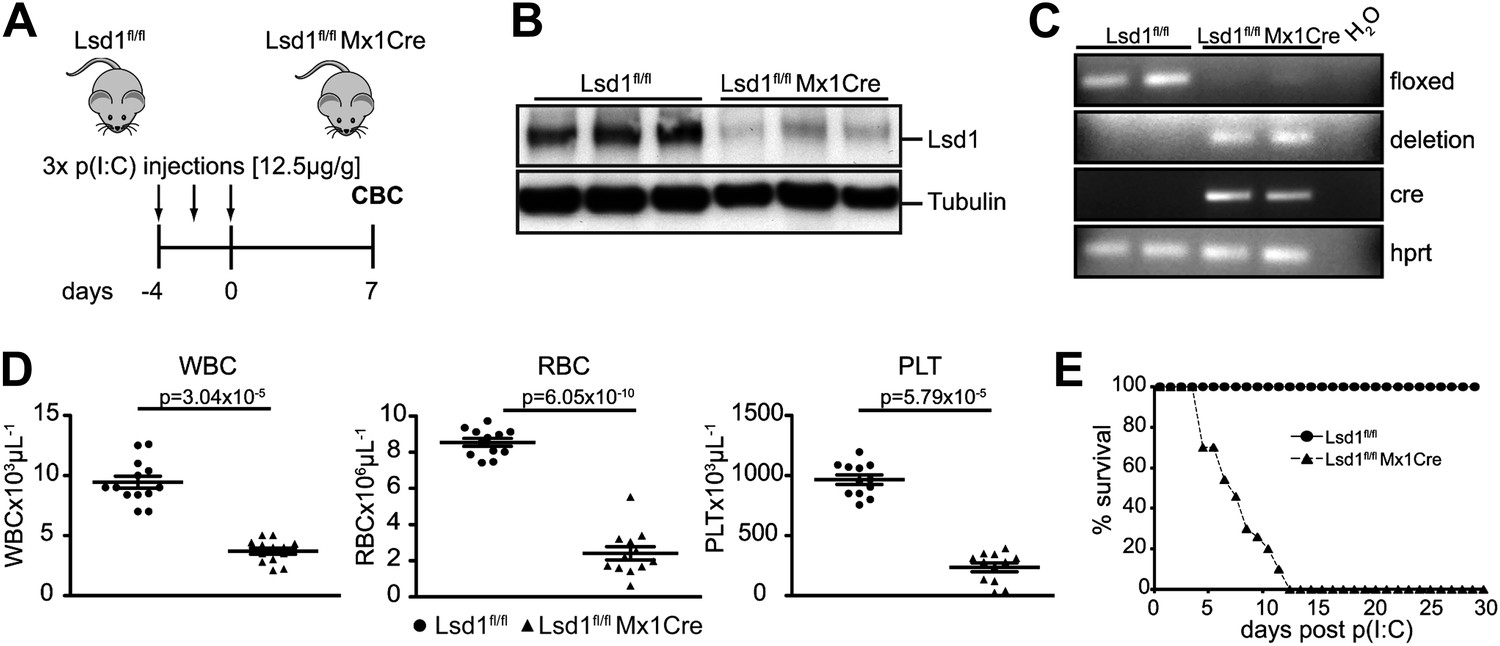
Mx1Cre-mediated deletion of Lsd1 results in pancytopenia.
(A) Experimental design. (B) Western Blot analysis of three control (Lsd1fl/fl) and three experimental (Lsd1fl/fl Mx1Cre) spleen lysates 1 week after p(I:C) injection. (C) Genomic PCR from control and Lsd1fl/fl Mx1Cre for Lsd1, Cre, and Hprt. (D) Differential PB counts of control and Lsd1fl/fl Mx1Cre mice. Data are expressed as the mean ± SEM; n ≥ 10 mice per group. (E) Kaplan–Meier plot of Lsd1fl/fl (n = 27) and Lsd1fl/fl Mx1Cre (n = 44) mice after final dose of p(I:C).
Figure 2—figure supplement 2
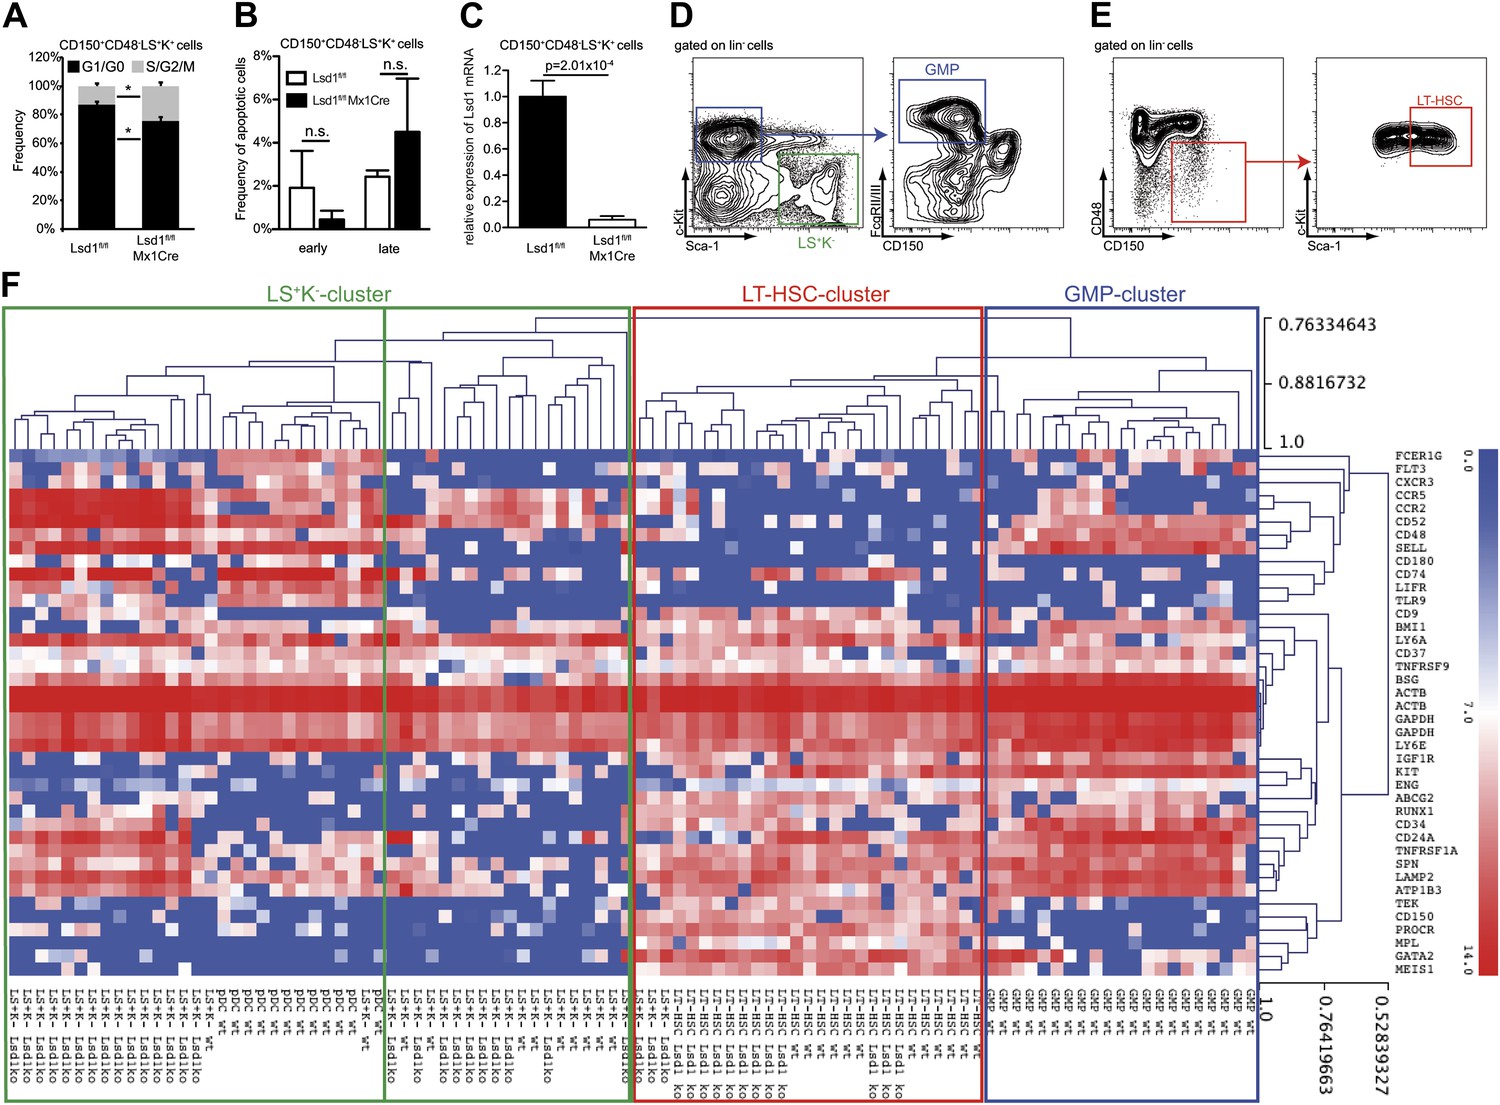
Hierarchical clustering of immunoprofiles derived from single sorted Lsd1 knockout CD150+ CD48− LS+K+ and LS+K− cells.
(A) Frequency of Lsd1fl/fl and Lsd1fl/fl Mx1Cre CD150+ CD48− LS+K+ LT-HSCs in G1/G0 vs S/G2/M cell cycle phases. Unfractionated bone marrow cells were incubated with Hoechst 33342, stained with indicated antibodies and analyzed by flow cytometry. Data are expressed as the mean ± SD; n = 3 mice per group. (B) Frequency of early (Annexin V+ Dapi−) and late (Annexin V+ Dapi+) apoptotic Lsd1fl/fl and Lsd1fl/fl Mx1Cre CD150+ CD48− LS+K+ LT-HSCs determined by flow cytometry. Data are expressed as the mean ± SD; n = 3 mice per group. (C) Lsd1 mRNA expression levels in Lsd1fl/fl and Lsd1fl/fl Mx1Cre CD150+ CD48− LS+K+ LT-HSCs determined by qPCR. Data are expressed as the mean ± SEM; n = 3 mice per group (D) FACS gating logic for isolation of LS−K+ and GMP cells. (E) Gating logic for CD150+ CD48− LS+K+ LT-HSCs. (F) Heatmap of single cell high throughput qPCR immunoprofiling. Cells were sorted into 96 wells, 1 week after the final p(I:C) injection. Extracted RNA was subjected to BIOMARK Fluidigm microfluidics qPCR. Biomarker expression values were clustered (average linkage method; Pearson correlation) using MeV (Multi Experiment Viewer 4.8; Saeed et al., 2006). Data are presented as normalized CT values. A total of 96 single cells were profiled (i.e., 12× Lsd1 knockout LT-HSCs; 28× Lsd1 knockout LS+K− cells; 12× wild-type LT-HSCs; 11× wild-type LS+K− cells; 12× plasmacytoid dendritic cells; 21× granulocyte/macrophage progenitor cells [GMPs]). *p<0.05; n.s.: not significant.
Figure 3
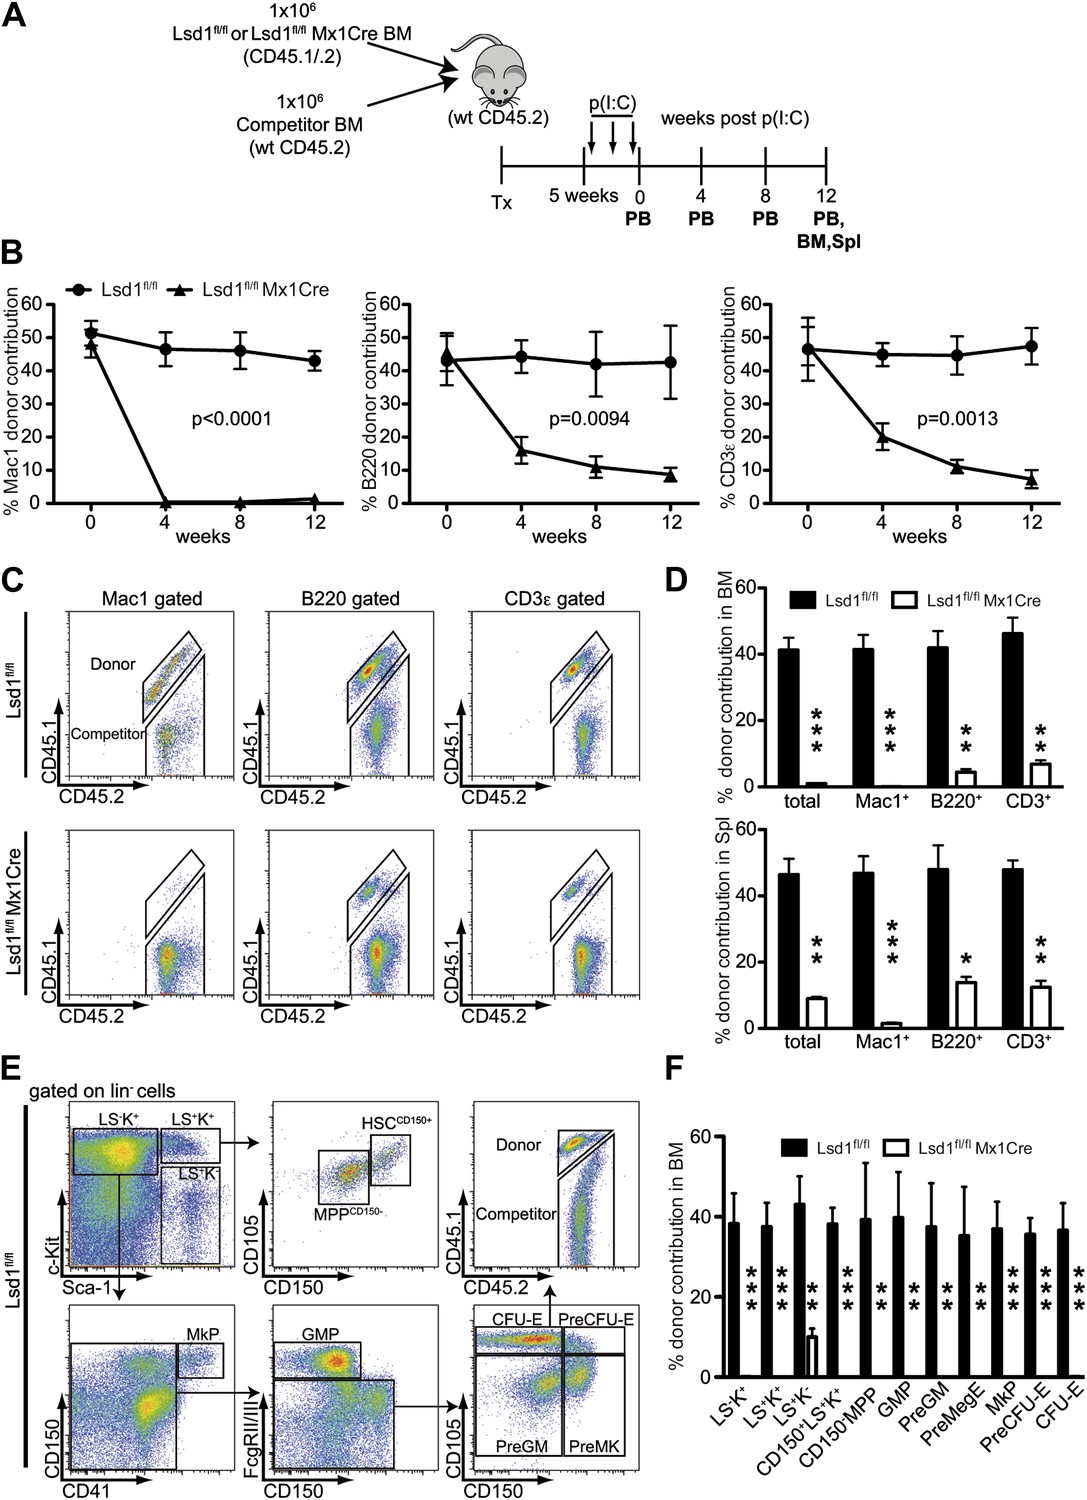
Lsd1 is essential for HSC self-renewal.
(A) Experimental outline for competitive transplantation experiment. Equal numbers of unfractionated CD45.2 competitor bone marrow cells were mixed with equal numbers of either CD45.1/.2 Lsd1fl/fl Mx1Cre or CD45.1/.2 Lsd1fl/fl donor unfractionated bone marrow cells. Bone marrow chimerism was established for 5 weeks prior to poly(I:C) injection. (B) Peripheral blood donor chimerism of myeloid, B, and T lymphocyte lineages 4, 8, and 12 weeks after poly(I:C) treatment. n = 5 for CD45.1/.2 Lsd1fl/fl; n = 12 for CD45.1/.2 Lsd1fl/fl Mx1Cre. p values were determined using a two-way ANOVA test. (C) Representative FACS plots for spleen donor chimerism of myeloid, B, and T lymphocyte lineages 12 weeks after poly(I:C) treatment. (D) Average BM and Spleen donor chimerism of control or Lsd1fl/fl Mx1Cre cells at 12 weeks after transplant. Data are expressed as mean ± SD; n = 4 recipients per group; **p<0.01; ***p<0.001. (E) Representative FACS plots displaying gating logic used to determine donor chimerism of CD150+ LS+K+ HSCs, CD150− LS+K+ multipotent progenitor cells and myeloid progenitor subpopulations (Pronk et al., 2007). (F) Average HSC and progenitor cell donor chimerism of control or Lsd1fl/fl Mx1Cre cells 12 weeks posttransplant. Data are expressed as mean ± SD; n = 4 recipients per group; **p<0.01; ***p<0.001.
Figure 4 with 1 supplement

Lsd1 is required for terminal granulocytic and erythroid differentiation.
(A) Flow cytometric analysis for indicated myeloid cell surface markers 1 week after poly(I:C). (B) Quantification and statistical analysis of Gr1/Mac1 and Neutr.7/4/F4/80 flow cytometric analysis. Data are expressed as mean ± SEM with n ≥ 5 mice per group. **p<0.01; ***p<0.001. (C) Cytospin of Gr1+ Mac1+ cells from control and Lsd1 knockout bone marrow stained with May Gruenwald Giemsa. Scale bar: 20 µM. (D) Erythroid maturation staging of Lsd1fl/fl EpoRCre and control fetal liver cells: Gates R1 and R2 contain primitive erythroid progenitor cells (CD71low Ter119low and CD71high Ter119low), R3 early and late basophilic erythroblasts (CD71high Ter119high), R4 chromatophilic and orthochromatophilic erythroblasts (CD71med Ter119high), and R5 late orthochromatophilic erythroblasts and reticulocytes (CD71low Ter119high). CD71+ c-Kit+ cells are proerythroblasts; and CD71+ c-Kit− cells contain early basophilic erythroblasts. (E) Quantification and statistical analysis of CD71/Ter119 and CD71/c-Kit flow cytometric analysis. Data are expressed as mean ± SEM; n ≥ 10 embryos per group. **p<0.01; ***p<0.001. (F) Embryonic day 13.5 Lsd1fl/fl EpoRCre and control embryos.
Figure 4—figure supplement 1
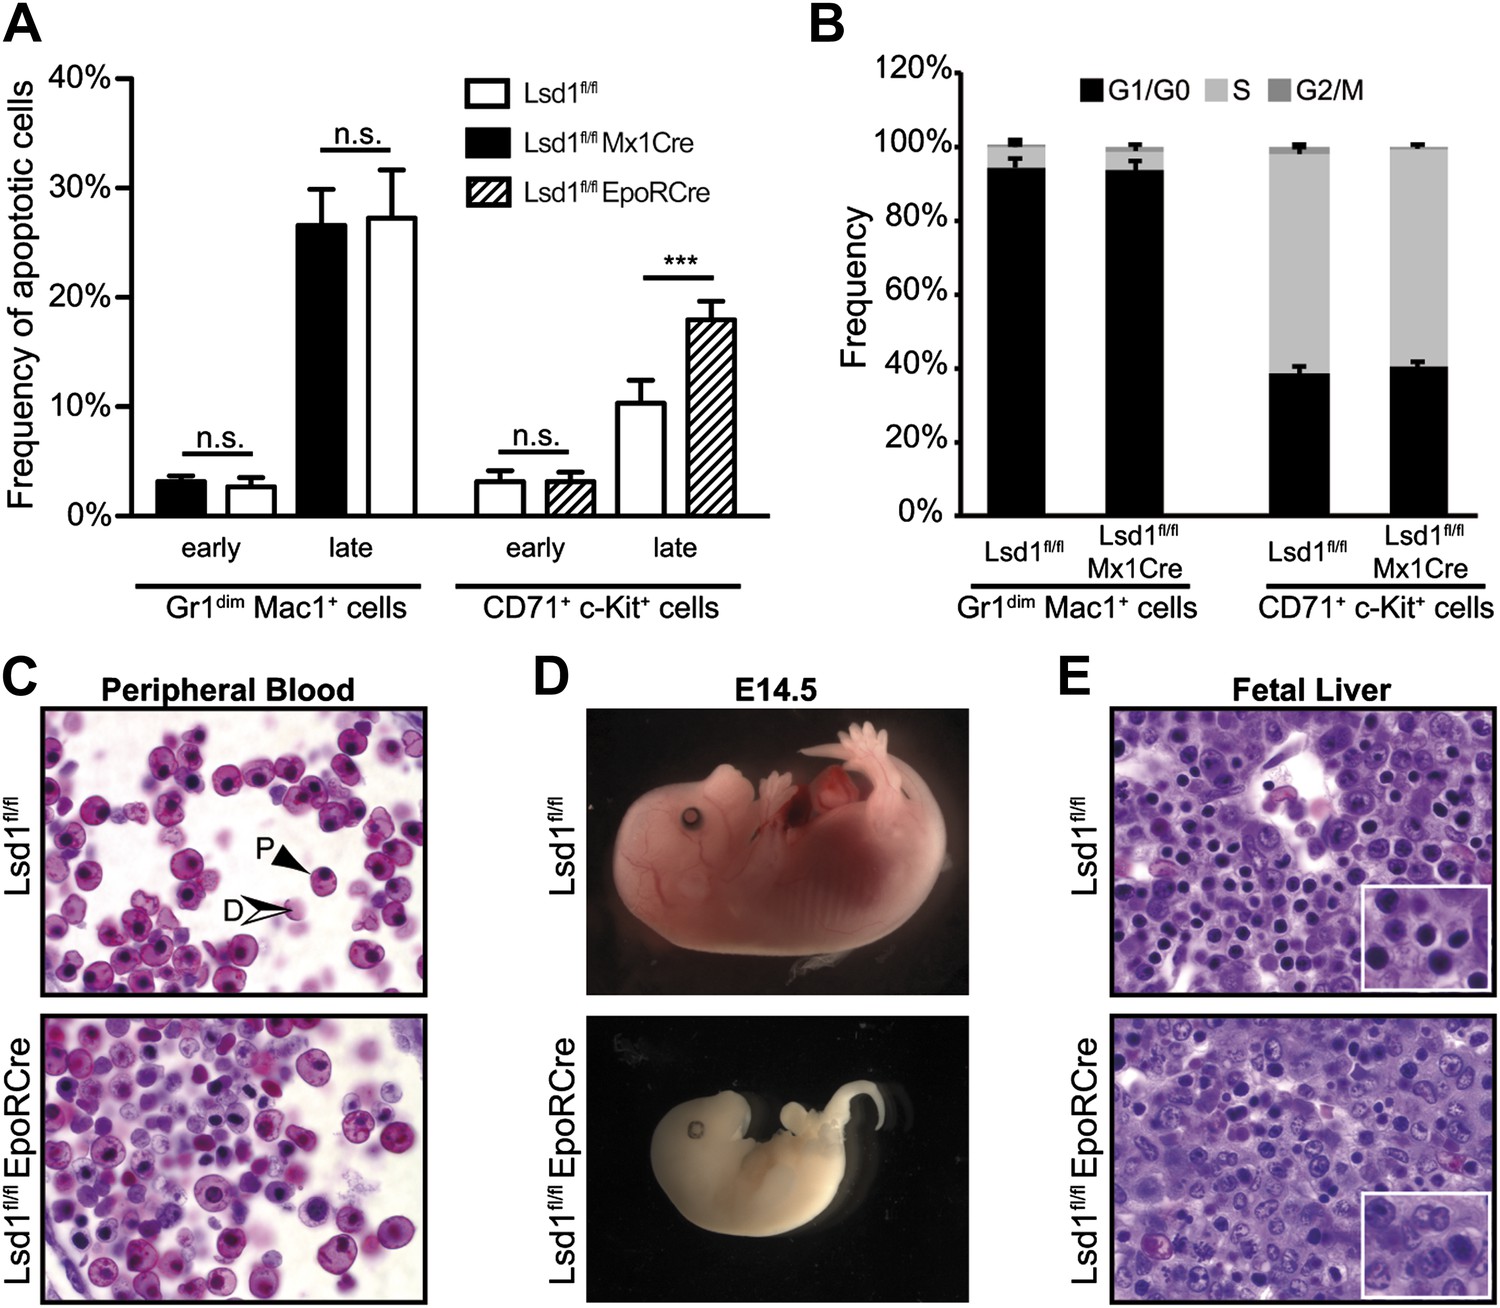
Lsd1fl/fl EpoRCre mice die in utero due to erythroid differentiation defects.
(A) Frequency of early (Annexin V+ 7-AAD−) and late (Annexin V+ 7-AAD+) apoptotic Lsd1fl/fl and Lsd1fl/fl Mx1Cre Gr1dim Mac1+ bone marrow cells (left), as well as, early (Annexin V+ 7-AAD−) and late (Annexin V+ 7-AAD+) apoptotic Lsd1fl/fl and Lsd1fl/fl EpoRCre CD71+c-Kit+ fetal liver cells determined by flow cytometry. Data are expressed as the mean ± SD; n ≥ 5 mice per group. n.s.: not significant, ***p<0.001 (B) Frequency of Lsd1fl/fl and Lsd1fl/fl Mx1Cre bone marrow cells, as wells as Lsd1fl/fl and Lsd1fl/fl EpoRCre CD71+c-Kit+ fetal liver cells in G1/G0, S, and G2/M cell cycle phases. Unfractionated bone marrow/fetal liver cells were incubated with Hoechst 33342, stained with indicated antibodies and analyzed by flow cytometry. Data are expressed as the mean ± SD; n ≥ 3 mice per group. (C) Peripheral blood cells of E13.5 Lsd1fl/fl EpoRCre and control embryos. Solid black arrow: primitive erythrocyte; black/white arrow: definitive erythrocyte. (D) E14.5 Lsd1fl/fl EpoRCre and control embryos. (E) Fetal liver sections of E13.5 Lsd1fl/fl EpoRCre and control embryos.
Figure 5 with 1 supplement
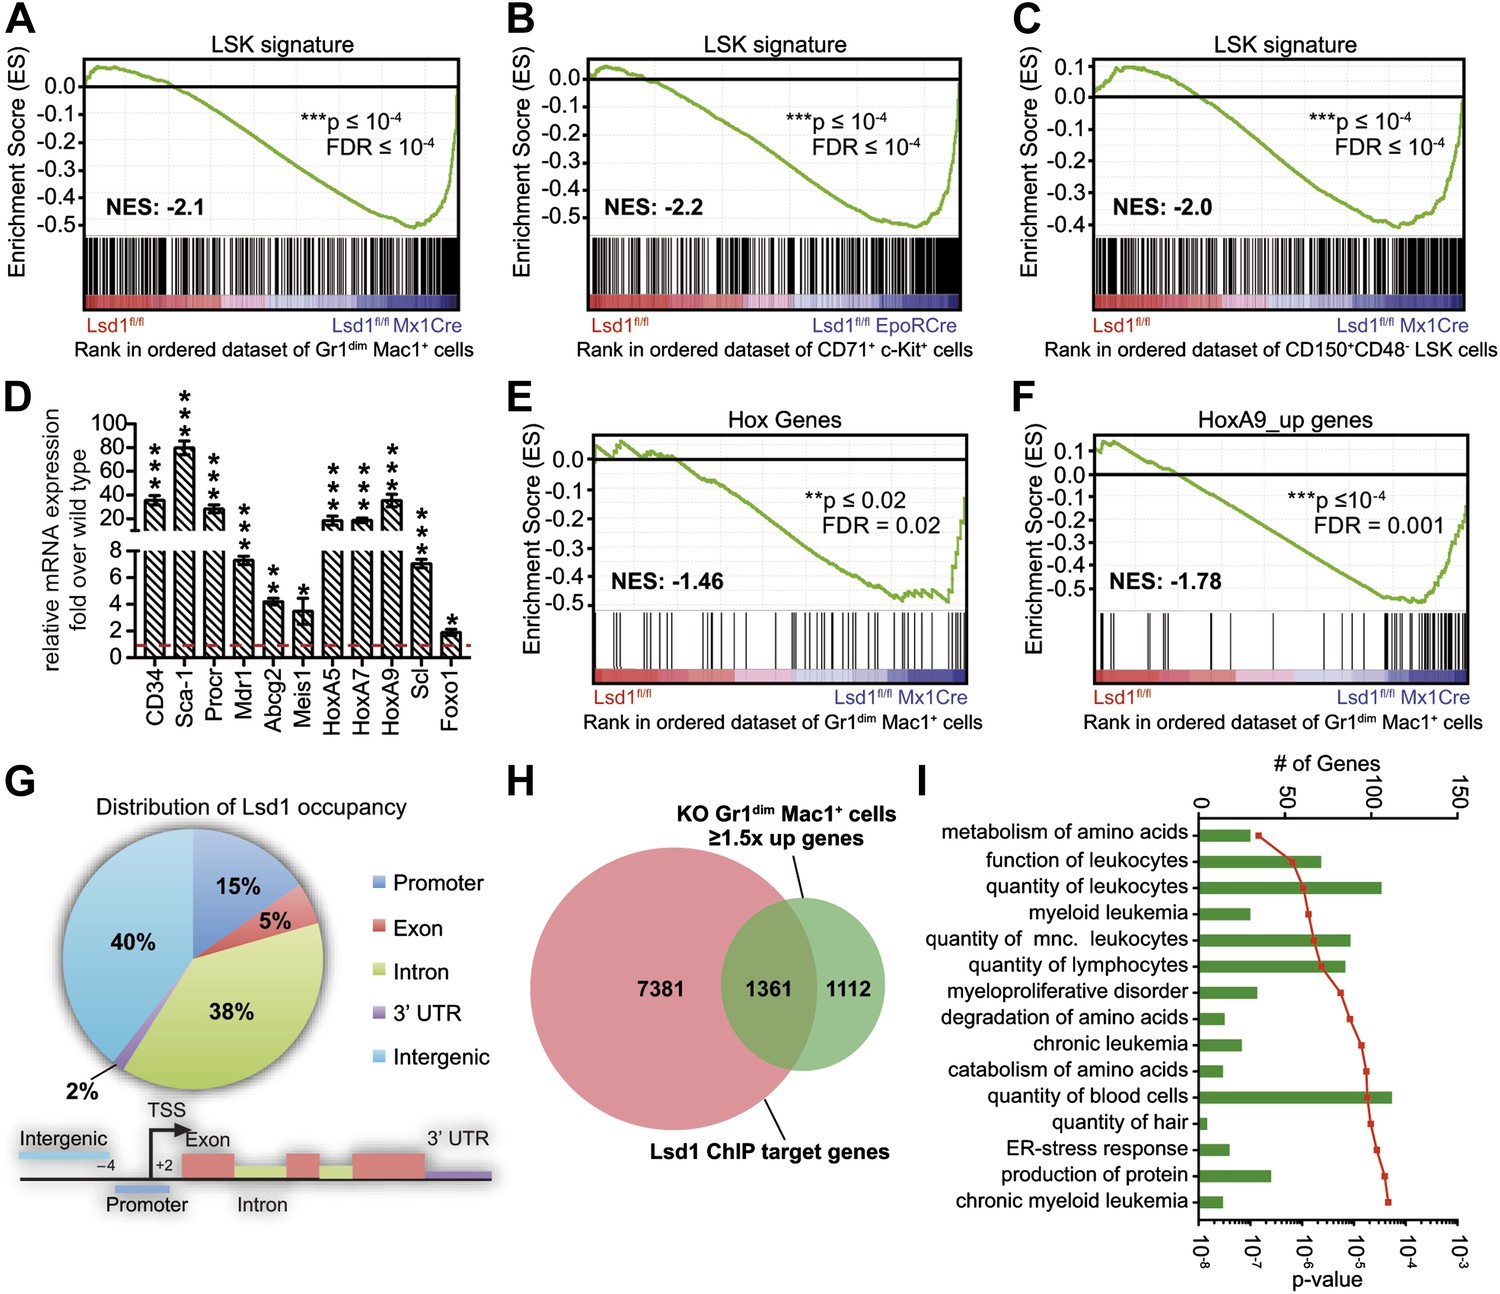
Loss of Lsd1 results in derepression of stem and progenitor cell genes.
(A)–(C) Gene set enrichment analyses showing upregulation of LSK signature genes in Lsd1fl/fl Mx1Cre Gr1dim Mac1+ myeloid cells (A), Lsd1fl/fl EpoRCre CD71+ c-Kit+ erythroid cells (B), and Lsd1fl/fl Mx1Cre CD150+ CD48− LSK cells (C, see Figure 5—source data 1 for gene set). (D) Relative mRNA expression levels of stem/progenitor cell marker genes measured by real-time PCR. Mean ± SEM values are from four biological replicates of Lsd1fl/fl Mx1Cre Gr1dim Mac1+ cells normalized to expression in control cells (dashed line). (E) and (F) GSEA analyses showing derepression of hematopoiesis related Hox genes and HoxA9 target genes in Lsd1fl/fl Mx1Cre Gr1dim Mac1+ myeloid cells (see Figure 5—source data 1 for gene sets). (G) Genome-wide distribution of Lsd1 binding sites in granulocytic progenitor cells (32D). (H) Venn diagram of overlap between Lsd1 target genes and genes upregulated in Lsd1fl/fl Mx1Cre Gr1dim Mac1+ cells (≥1.5-fold, p≤0.05). (I) IPA functional category analysis of direct Lsd1 target genes as defined in (H). *p<0.05; **p<0.01; ***p<0.001; n.s.: not significant.
-
Figure 5—source data 1
Gene sets used for GSEA analyses.
- https://doi.org/10.7554/eLife.00633.013
-
Figure 5—source data 2
Normalized enrichment scores (NES) and false discovery rates (FDR) of GSEA analyses with stem/progenitor gene sets.
- https://doi.org/10.7554/eLife.00633.014
-
Figure 5—source data 3
Lsd1 occupancy peak position in 32D cells.
- https://doi.org/10.7554/eLife.00633.015
Figure 5—figure supplement 1
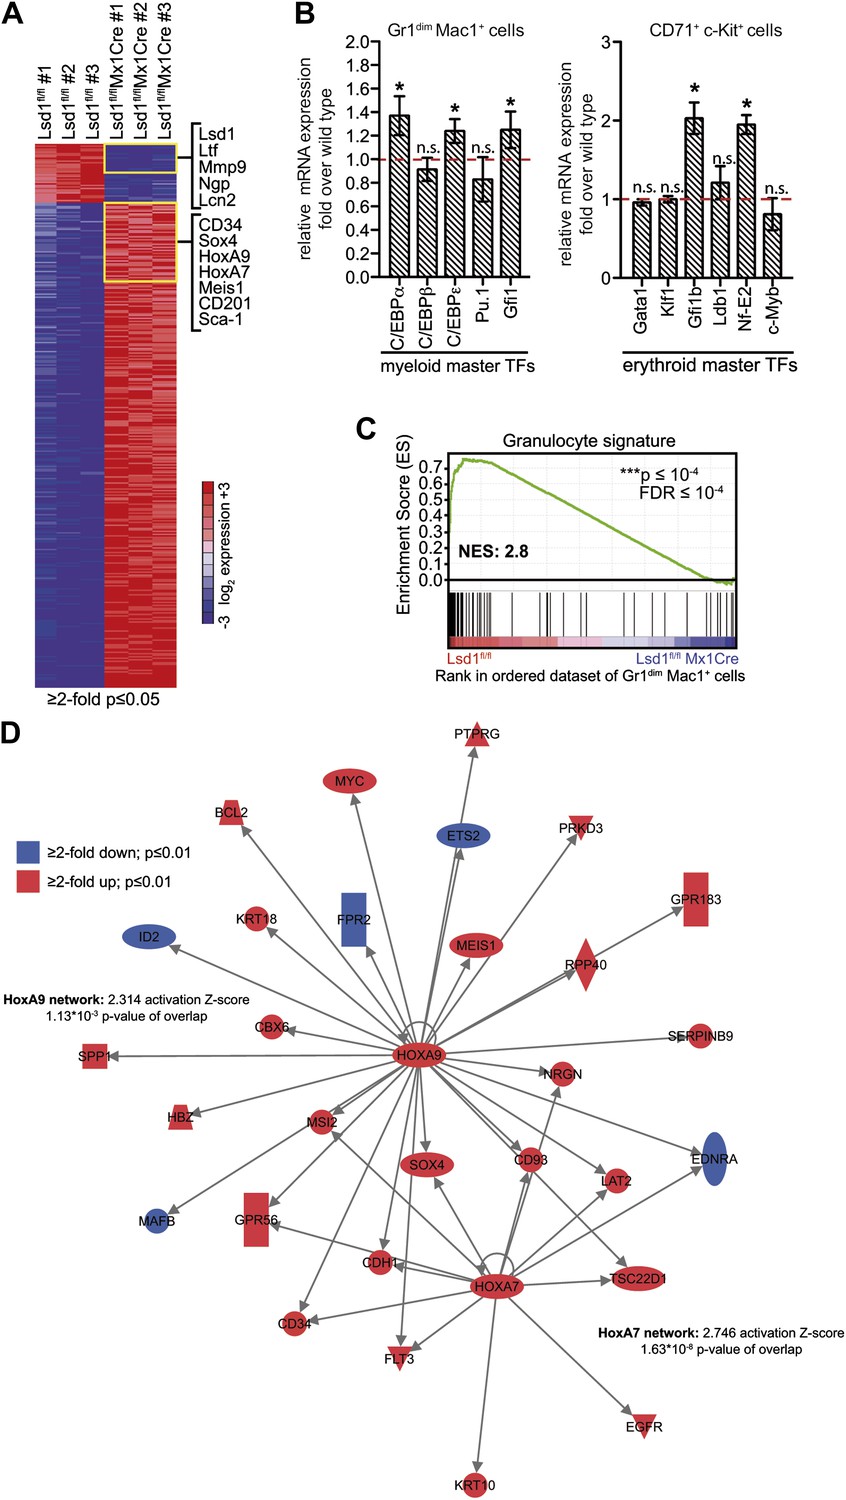
Deletion of Lsd1 results in upregulation of stem and progenitor cell genes.
(A) Heatmap of normalized log2 expression values of control and Lsd1fl/fl Mx1Cre Gr1dim Mac1+ cells (twofold or less changes; p≤0.05). (B) Relative mRNA expression levels of myeloid and erythroid transcription factors measured by real-time PCR. Mean ± SEM values are from four biological replicates of Lsd1fl/fl Mx1Cre Gr1dim Mac1+ granulocytic progenitor cells or Lsd1fl/fl EpoRCre CD71+ c-Kit+ proerythroblasts normalized to expression in respective control cells (dashed line). (C) GSEA plot showing the downregulation of mature granulocytic signature genes Lsd1fl/fl Mx1Cre Gr1dim Mac1+ cells vs controls. (For gene sets see Figure 5—source data 1.) (D) Cartoon of HoxA7 and HoxA9 network. Genes colored in red are at least twofold upregulated (p≤0.01) and genes colored in blue at least twofold downregulated (p≤0.01) in Lsd1fl/fl Mx1Cre Gr1dim Mac1+ granulocytic progenitor cells. *p<0.05; **p<0.01; ***p<0.001; n.s.: not significant (related to Figures 4 and 5).
Figure 6 with 2 supplements
Lsd1 occupies enhancers and promoters of stem and progenitor cell genes and loss of Lsd1 is associated with increased levels of H3K4me1 and H3K4me2 on enhancers and promoters of HSPC genes.
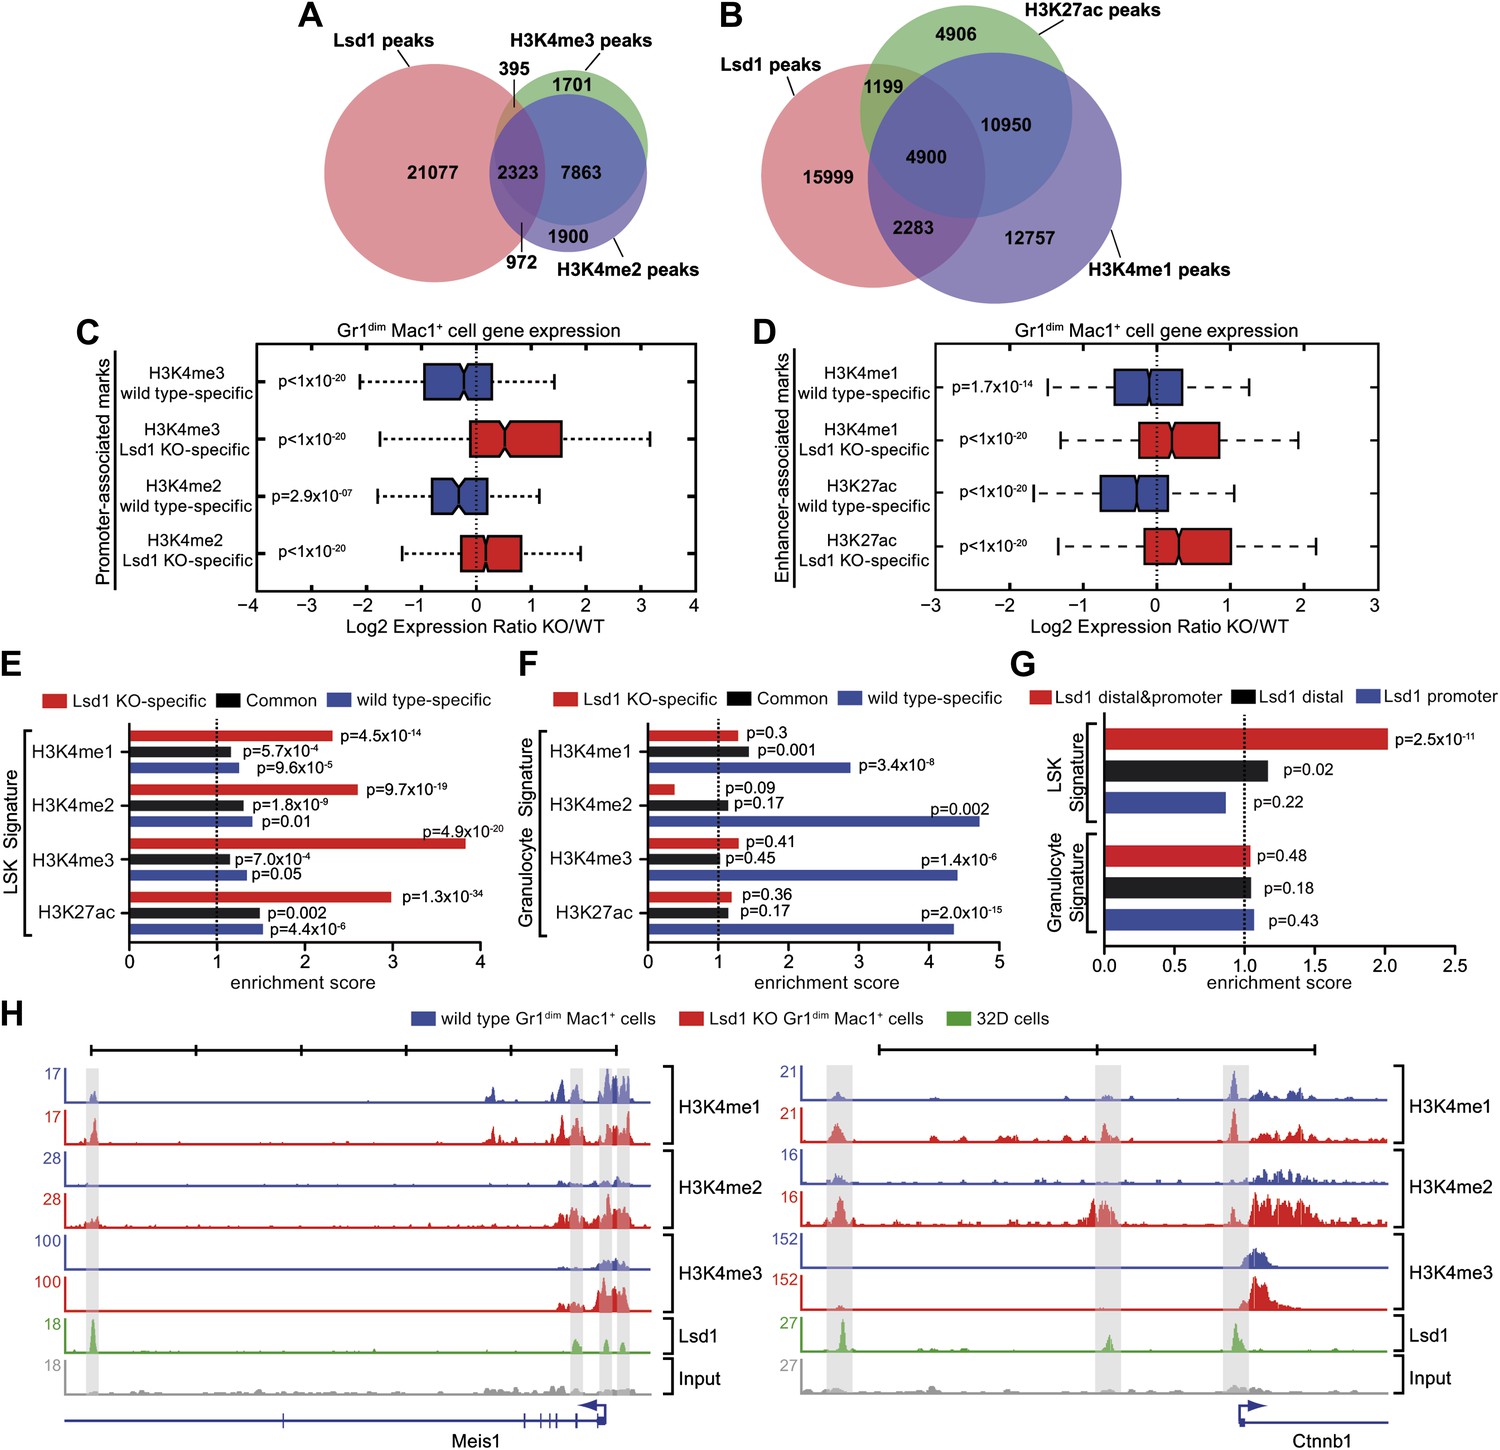
(A) Venn diagram of the overlap between Lsd1 and promoter-associated H3K4me2 and H3K4me3 peaks in wild-type Gr1dim Mac1+ cells. (B) Venn diagram of overlap between Lsd1 with enhancer-associated H3K4me1 and H3K27ac peaks in wild-type Gr1dim Mac1+ cells. (C) and (D) Box plots displaying log2 expression ratios of Lsd1 knockout over wild-type Gr1dim Mac1+ cells at KO-specific (red bars) and wild type–specific (blue bars) H3K4me1/me2/me3 and H3K27ac target genes. (E) and (F) Enrichment scores for KO-specific (red bars), common (black bars), and wt-specific (blue bars) H3K4me1/me2/me3 and H3K27ac peak associated target genes within LSK and granulocyte gene signatures, respectively. Enrichment scores were calculated as the ratio of overlap between H3K4me1/me2/me3 and H3K27ac target genes and LSK or granulocyte signature genes, compared to expected overlap at random. p values were determined using Fisher’s exact test. (G) Analyses of Lsd1 occupied genes within LSK and granulocyte signatures, respectively. Lsd1 target genes were classified into gene lists according to differential Lsd1 occupancy (i.e., Lsd1 binding at distal and promoter regions [red bars]; Lsd1 binding at distal regions only [black bars]; Lsd1 binding promoter regions only [blue bars]). Enrichment scores were calculated as the ratio of overlap between Lsd1 target genes with LSK or granulocyte signature genes, compared to expected overlap at random. p values were determined using Fisher’s exact test. (H) Representative ChIP-Seq tracks for LSK signature genes (i.e., Meis1 and Ctnnb1 [β-catenin]), which have Lsd1 bound at distal regulatory and promoter regions. Scale bar ticks represent 10 kb.
-
Figure 6—source data 1
Target genes of Lsd1 KO-specific and wt-specific histone modification peaks in Gr1dim Mac1+ cells.
- https://doi.org/10.7554/eLife.00633.018
-
Figure 6—source data 2
Target genes of Lsd1 in 32D cells (distal; promoter; distal, and promoter).
- https://doi.org/10.7554/eLife.00633.019
Figure 6—figure supplement 1

Validation of Lsd1 ChIP-Seq and normalization of histone ChIP-Seq data using ‘MAnorm’.
(A) In vivo chromatin occupancy was examined by ChIP-qPCR in primary murine Gr1dim Mac1+ myeloid cells. ChIP-qPCR validation for Lsd1 binding on LSK genes compared to rabbit IgG and negative control regions (i.e., Gnai1 TSS and Chr. 5 Gene Desert region). Data are plotted as means ± SD of two independent ChIP experiments. Primer sequences are available upon request. (B) Histone acid extracts from control and Lsd1fl/fl Mx1Cre whole bone marrow cells from two experimental animals per group were subjected to Western blot analysis with indicated antibodies. (C) and (D) Representative MA plots for H3K4me1 and H3K27ac from Lsd1fl/fl (wild type) and Lsd1fl/fl Mx1Cre (Lsd1 KO) FACS-sorted Gr1dim Mac1+ cells before and after ‘MAnorm’ normalization. The same normalization was also carried out for H3K4me2 and H3K4me3 (not shown). The log2 ratio of peak read density (M) in Lsd1 KO ChIP-Seq samples vs it in the corresponding wild-type samples was plotted against the average log2 read density (A) for all peaks, and robust linear regression was applied to fit the global dependence between the M-A values of common peaks. Finally, the derived linear model was used as a reference for normalization and extrapolated to all peaks. The normalized M value was then used as a quantitative measure of differential binding in each peak region between Lsd1 KO and wild type, with peak regions associated with larger absolute M values exhibiting greater differences in binding.
Figure 6—figure supplement 2
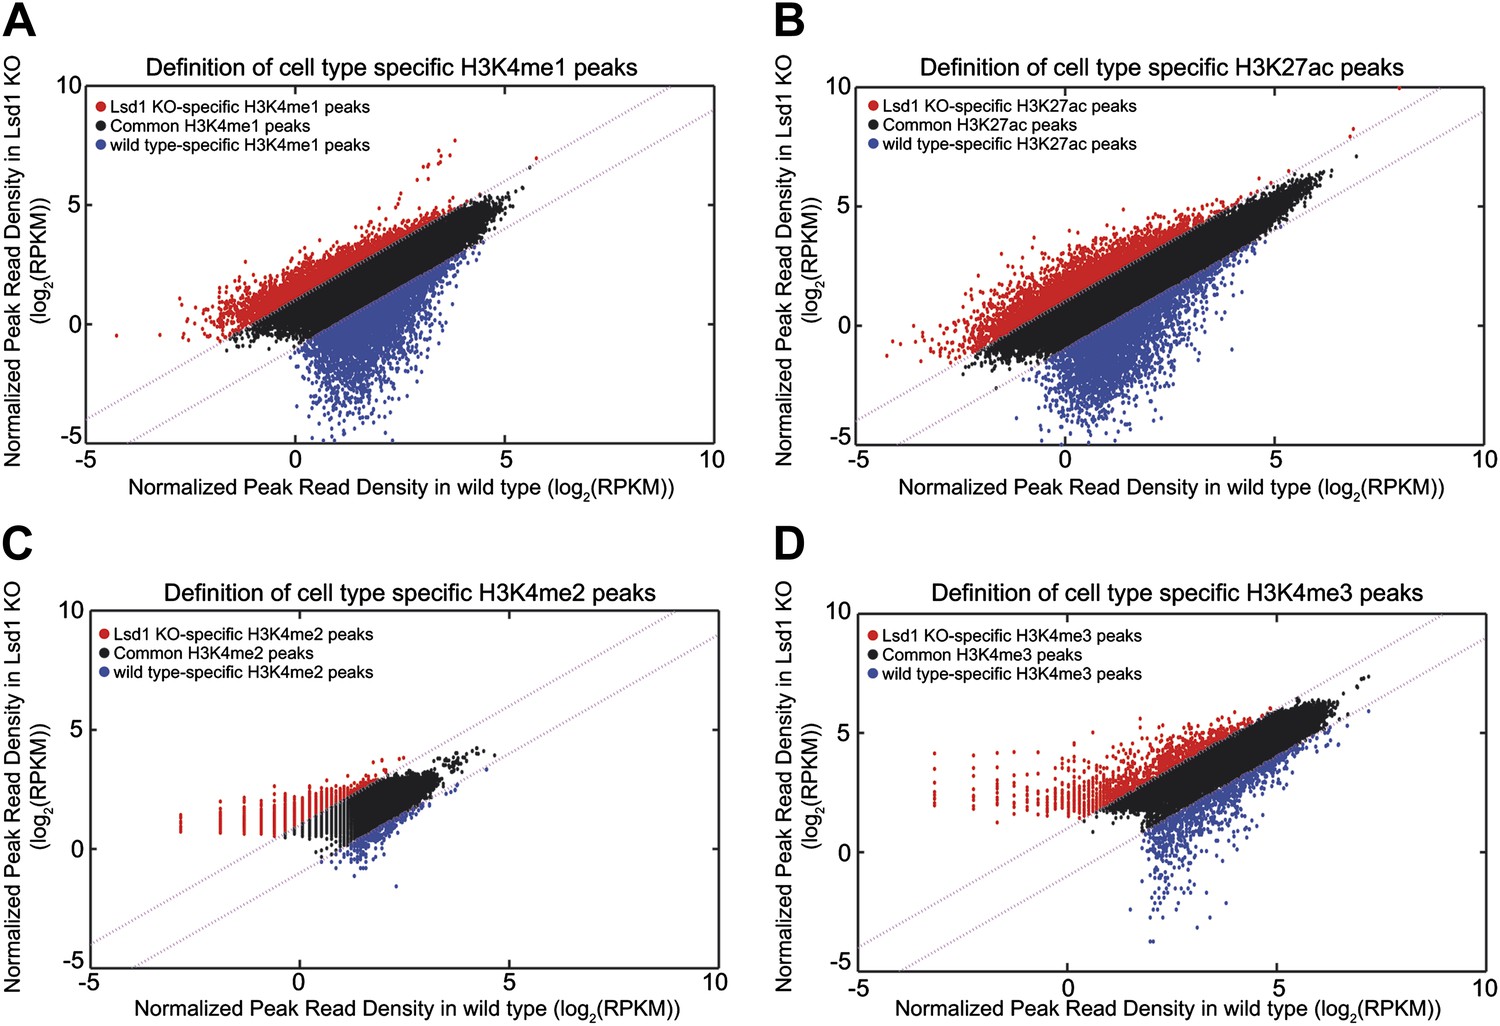
Definition of Lsd1 knockout unique histone methylation peaks.
(A)–(D) Histone modification peaks (i.e., H3K4me1, H3K4me2, H3K4me3, and H3K27ac) derived from Lsd1fl/fl (wild type) and Lsd1fl/fl Mx1Cre (Lsd1 KO) Gr1dim Mac1+ cell ChIP-Seq experiments were normalized using ‘MAnorm’. The resulting normalized log2 peak read densities of Lsd1 KO and wild-type peaks were plotted against each other. Lsd1 KO peaks that exhibited ≥2-fold higher normalized log2 peak read density over wild-type normalized log2 peak read density (the corresponding M value >1) were defined as Lsd1 KO-specific (red circles) and wild-type peaks that displayed a ≥2-fold higher normalized log2 peak read density over Lsd1 KO normalized log2 peak read density (the corresponding M-value <−1) were defined as wild type–specific (blue circles).
Figure 7

Cellular and molecular effects of Lsd1 loss during hematopoietic differentiation.
(A) Characterization of the stem/progenitor cell compartment of Lsd1 knockout mice demonstrated the presence LT-HSCs (CD150+ CD48− LSK), while having lost all LS−K+ myeloid progenitor cells (i.e., CMP, GMP, and MEP) in the bone marrow. In line with this, Lsd1-deficient bone marrow cells could not contribute to multilineage hematopoiesis in competitive transplantation assays. Accordingly, Lsd1-deficient HSCs maintained an immature cellular morphology, an LS+K+ immunophenotype, and were incapable of giving rise to mature cells, in colony formation cell assays, which we used to directly test LT-HSC differentiation capability. Gene expression profiling of Lsd1-deficient CD150+ CD48− LSK cells demonstrated upregulation of hematopoietic stem and progenitor cell signature genes. Collectively, our data suggested that the inability to silence HSPC genes keeps Lsd1 knockout LT-HSCs from differentiating into myeloid progenitor cells and lineage commitment. (B) Lsd1 deficiency in granulocytic and erythroid cells resulted in erroneous derepression of stem and progenitor cell gene sets, which resulted in stark maturation defects in the mature erythroid and granulocytic cell lineages. These findings suggested that Lsd1 is required to maintain appropriate expression levels of HSPC genes during early, as well as late hematopoietic differentiation and that the failure to so, is incompatible with terminal differentiation.
Download links
A two-part list of links to download the article, or parts of the article, in various formats.
Downloads (link to download the article as PDF)
Open citations (links to open the citations from this article in various online reference manager services)
Cite this article (links to download the citations from this article in formats compatible with various reference manager tools)
Histone demethylase Lsd1 represses hematopoietic stem and progenitor cell signatures during blood cell maturation
eLife 2:e00633.
https://doi.org/10.7554/eLife.00633


