miR-124 controls male reproductive success in Drosophila
- Institute for Molecular and Cell Biology, Singapore
- National University of Singapore, Singapore
- Temasek Life Sciences Laboratory, Singapore
Figures
Figure 1 with 1 supplement
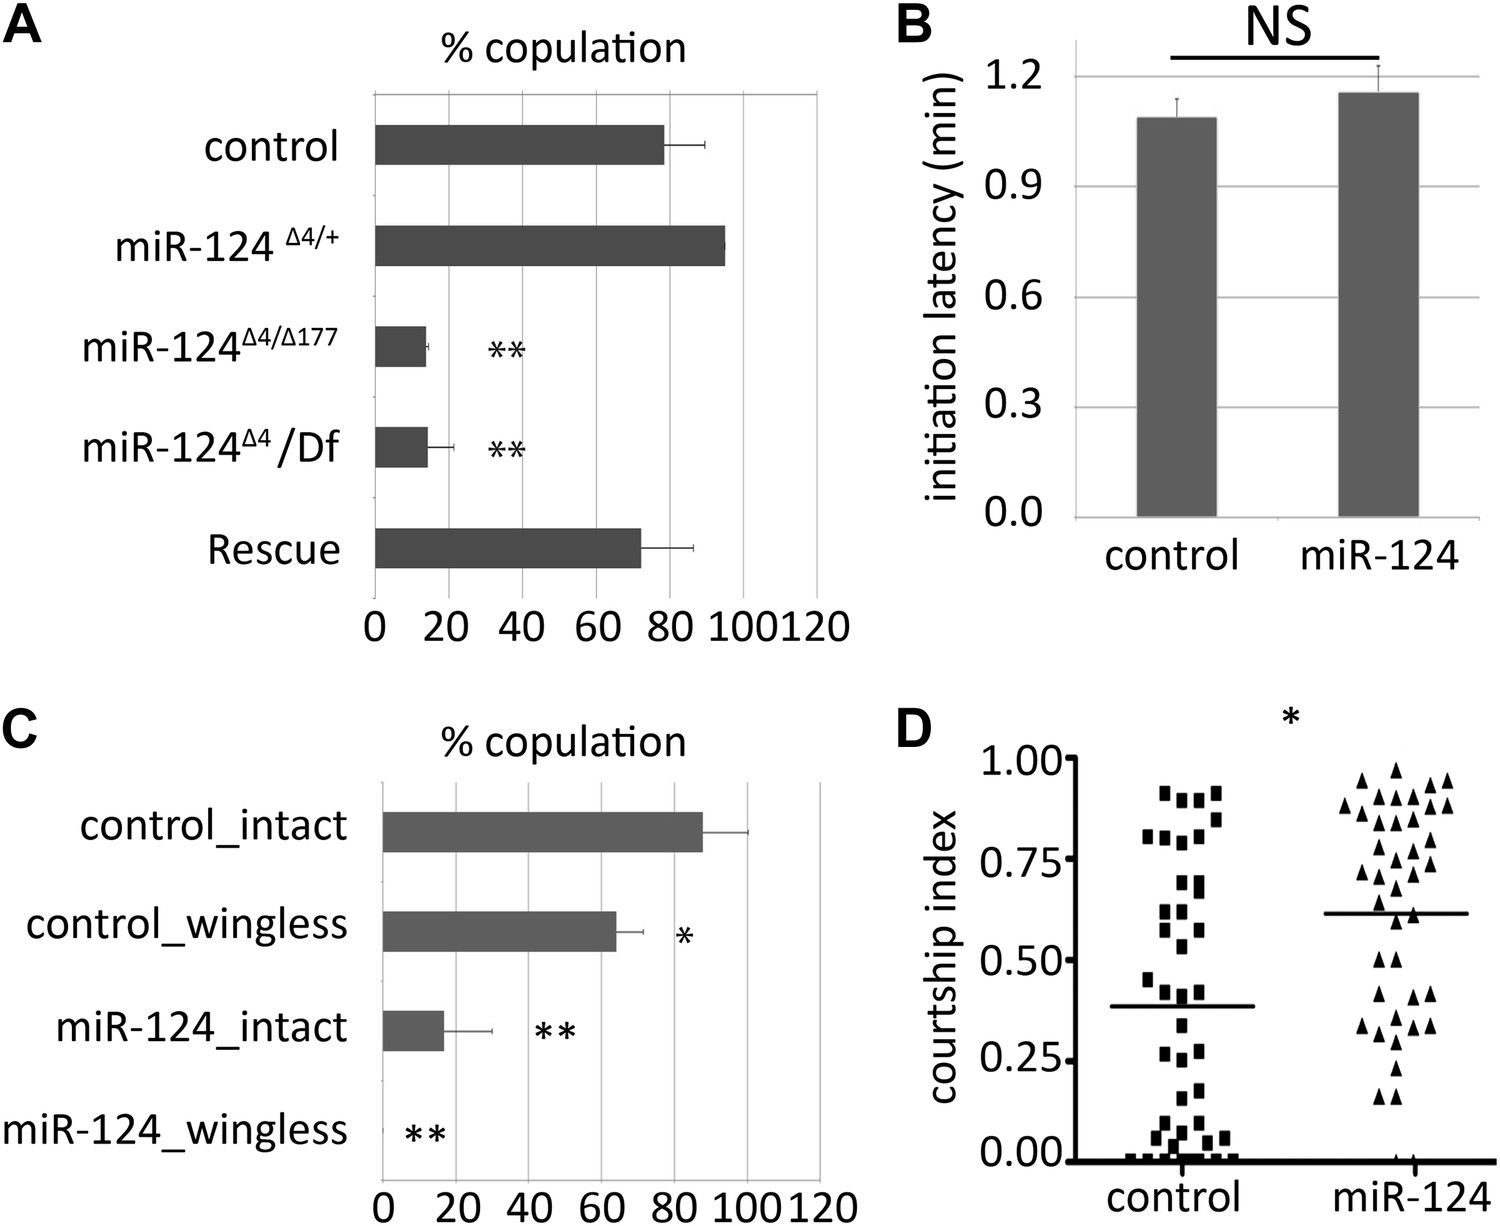
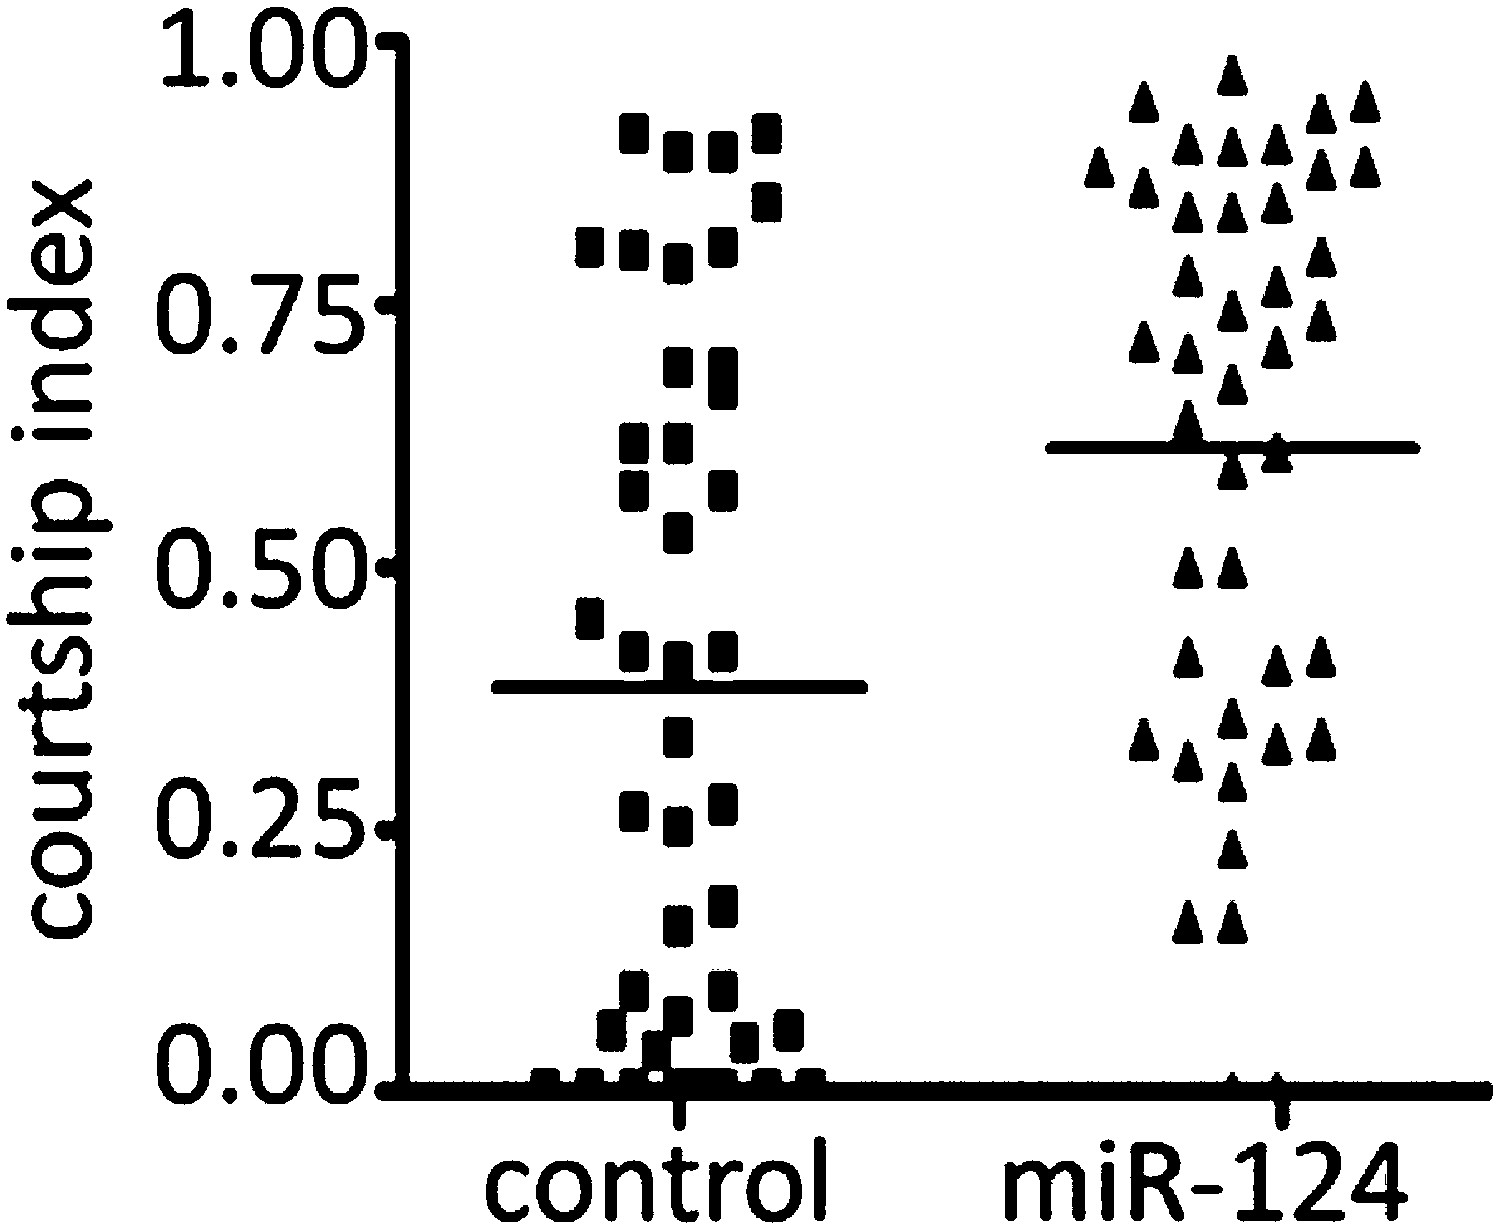
Male courtship behavior.
(A) Percentage of males achieving copulation in a 30-min observation period. Genotypes as indicated. Control males were CS. Rescue indicates the miR-124 RMCE allele with miR-124 reintegrated at the endogenous locus (34). Data represent the average of five independent experiments ± SEM. (B) Courtship initiation latency measures time (in minutes) to initiate courtship for CS control and miR-124 flies. Data represent the average of four independent experiments ± SEM. ns: no significant difference. (C) Percentage of males achieving copulation in 30 min, comparing CS control and miR-124 mutant flies before and after removal of the wings. Data represent the mean of more than 20 movies per genotype ± SD. (D) Courtship index compares the proportion of the measurement period males spent courting. CS control and miR-124 mutant males were tested using decapitated CS females as targets. Data represent 56 trials conducted in 4 batches of 14 pairs each. The horizontal line represents the median. Although the variance was high, the difference in the medians was borderline significant (p=0.042 comparing for the 56 pairs). However, when the data were analyzed as the average of four independent experiments (n = 14 in each experiment) the difference in the means was not significant. In all figures: *p<0.05, **p<0.01, ***p<0.001, ns: not statistically significant.
Figure 1—figure supplement 1
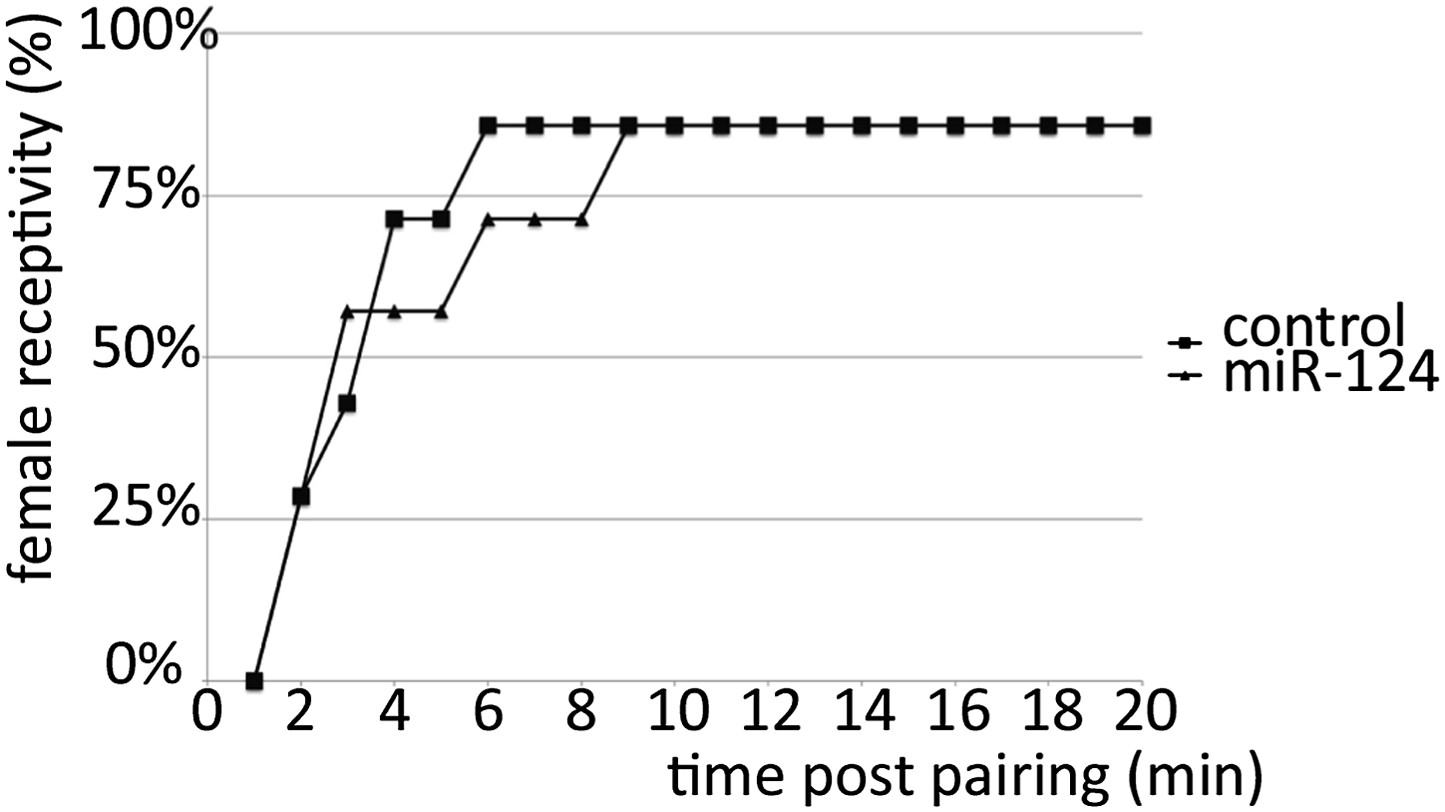
Receptivity of miR-124 mutant females.
5-day-old socially naive CS males were paired individually with 5-day-old CS or miR-124 virgin females and the number of females that accepted copulation over an observation period of 20 min was scored. No significant difference was observed in receptivity of 5-day-old control (CS) or miR-124 virgin females towards 5-day-old socially naïve CS males.
Figure 2
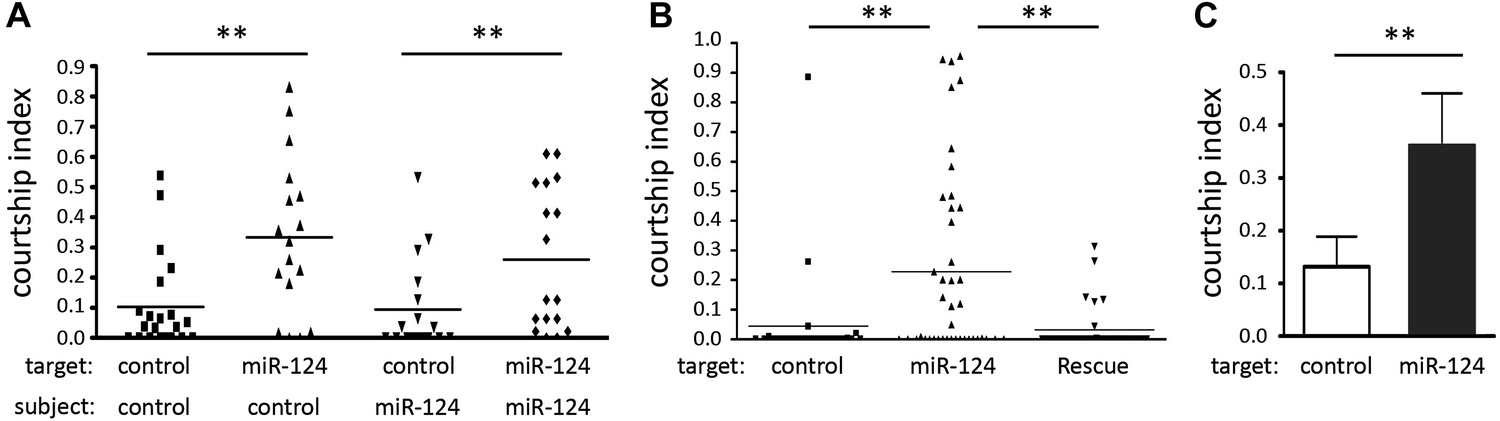
Male–male courtship.
(A) Courtship index comparing CS control and miR-124 mutant flies using decapitated CS or miR-124 mutant males as targets. The number of animals used for each sample is indicated (n:). Scores for many control flies were very close to zero, overlapping the X axis, and so are not visible as individual data points in the scatter plot. Data represent one of four independent trials performed with comparable results. (B) Courtship index for CS control males toward decapitated targets. The target genotypes used are CS control, miR-124 mutant and rescued mutant. Data represent one of four independent trials performed with comparable results. (C) Courtship choice assay comparing the time CS control males courted decapitated CS control and miR-124 mutant targets, when presented together. Data represent the mean of more than 20 movies per genotype ± SD.
Figure 3 with 1 supplement

Aberrant pheromone production by miR-124 mutant males.
(A) Normalized cVA level measured by GC-MS in extracts from control, miR-124 mutant, and rescued mutant males. Data represent the average of six independent preparations ± SEM. n = 15 in each preparation. (B) Normalized 9-pentacosene level measured by GC-MS from control, miR-124 mutant, and rescued mutant males. Data represent the average of six independent preparations ± SEM. n = 15 in each preparation. (C) Percentage of males achieving copulation in 30 min, comparing miR-124 mutant flies with or without cVA perfuming. Hexane perfuming was used as a control. Data represent the mean of >20 movies per genotype ± SD. (D) Courtship index (CI) using CS test males and miR-124 mutant target males perfumed with hexane solvent alone as a control, or with hexane containing cVA. No significant difference was observed between CI of CS males towards miR-124 target males perfumed with hexane (average CI = 0.320) or with cVA (average CI = 0.315). n = 30 in each experiment.
Figure 3—figure supplement 1
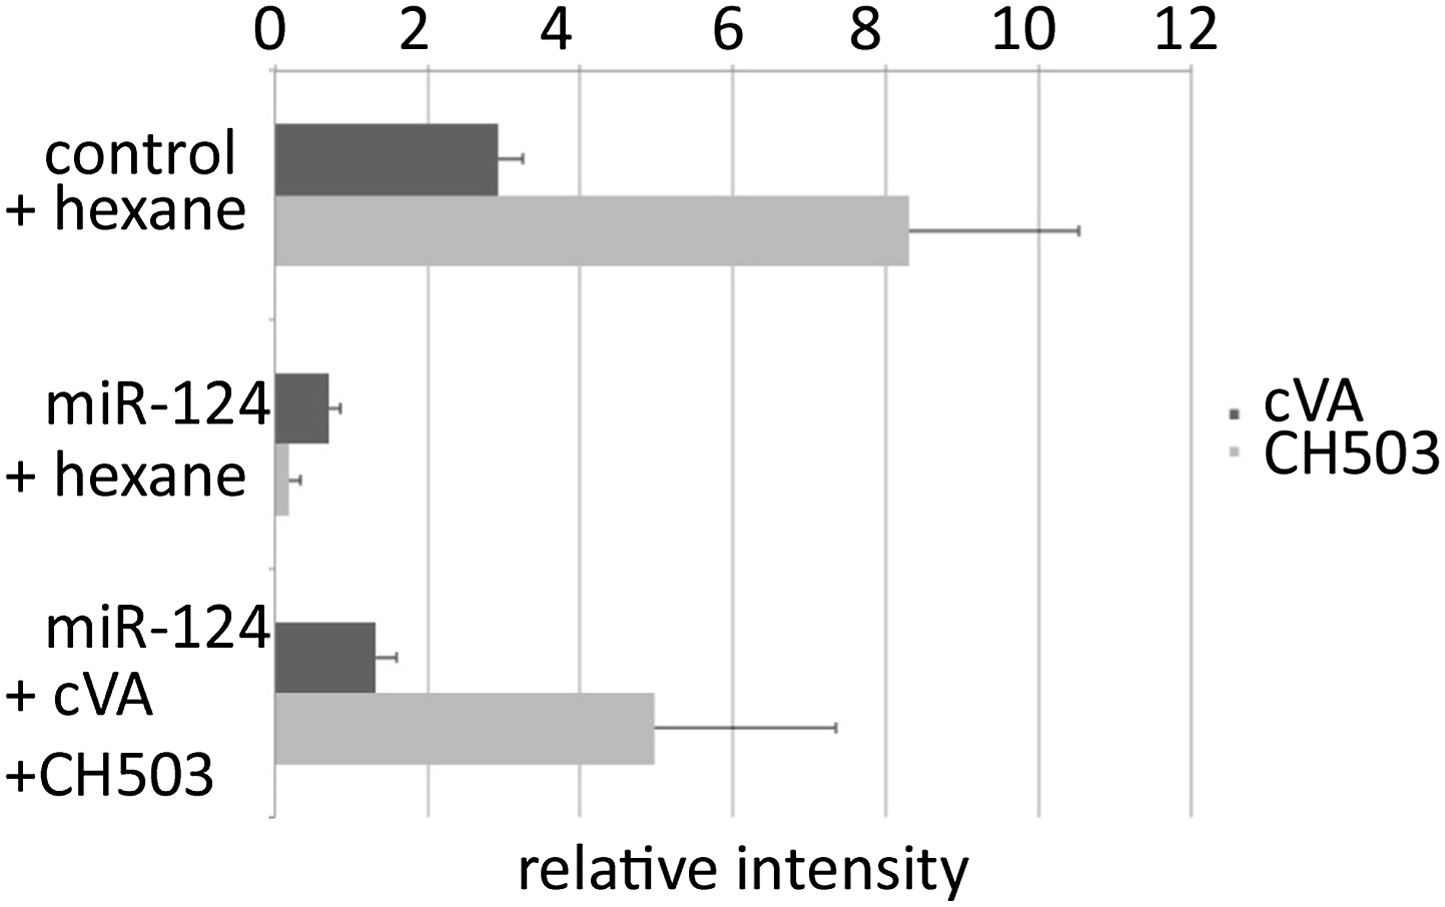
Abundance of cVA on perfumed flies.
DART mass spectrometry was used to assess the efficiency of the perfuming method. miR-124 mutant males perfumed with cVA exhibited more cVA than solvent-perfumed miR-124 mutant males and approximately 50% the amount of cVA found on control flies.
Figure 4 with 1 supplement
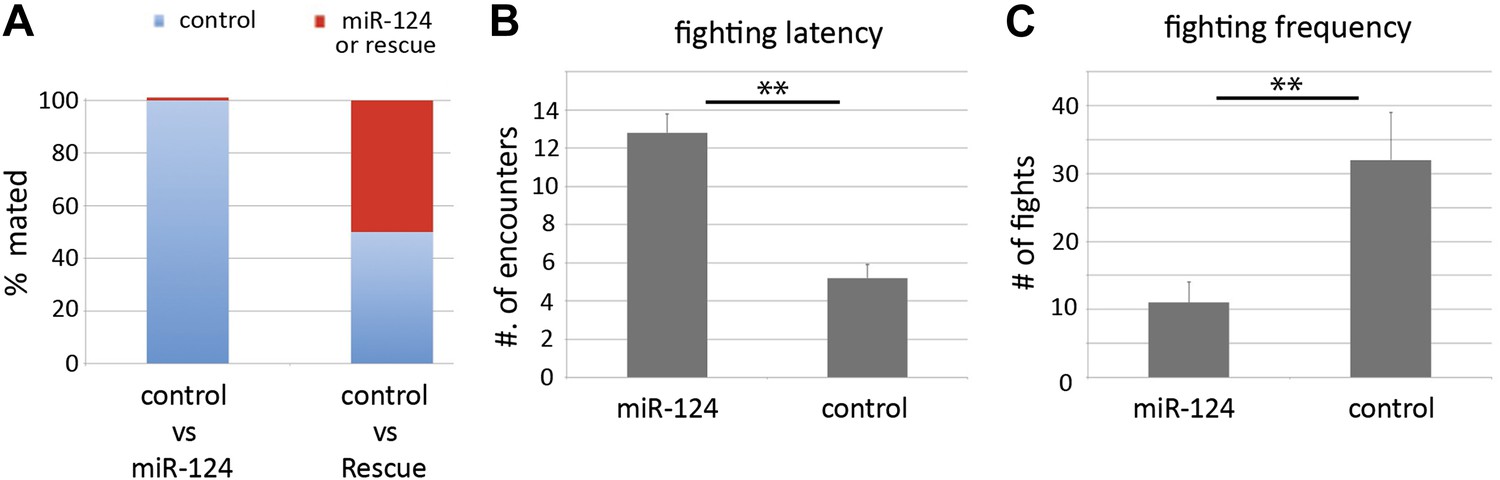
Comparison of other social behaviors.
(A) Female mate choice was monitored by videotaping in chambers containing single females and two males of the indicated genotypes. The genotype of the male that succeeded in copulating was recorded. More than 95% of control male achieved copulation, in the presence of miR-124 mutant males (left bar) compared with ∼50% in the presence of rescued mutant males (right bar). (B) Fighting latency was monitored by videotaping encounters between pairs of males in chambers containing a patch of food. Latency is the number of encounters that do not elicit aggressive behavior prior to the first fight. Data represent the mean of more than 16 movies per genotype ± SD. (C) Fighting frequency was monitored by videotaping encounters between pairs of males in chambers containing a patch of food. Frequency records the number of aggressive encounters in 30 min. Data represent the mean of more than 16 movies per genotype ± SD.
Figure 4—figure supplement 1
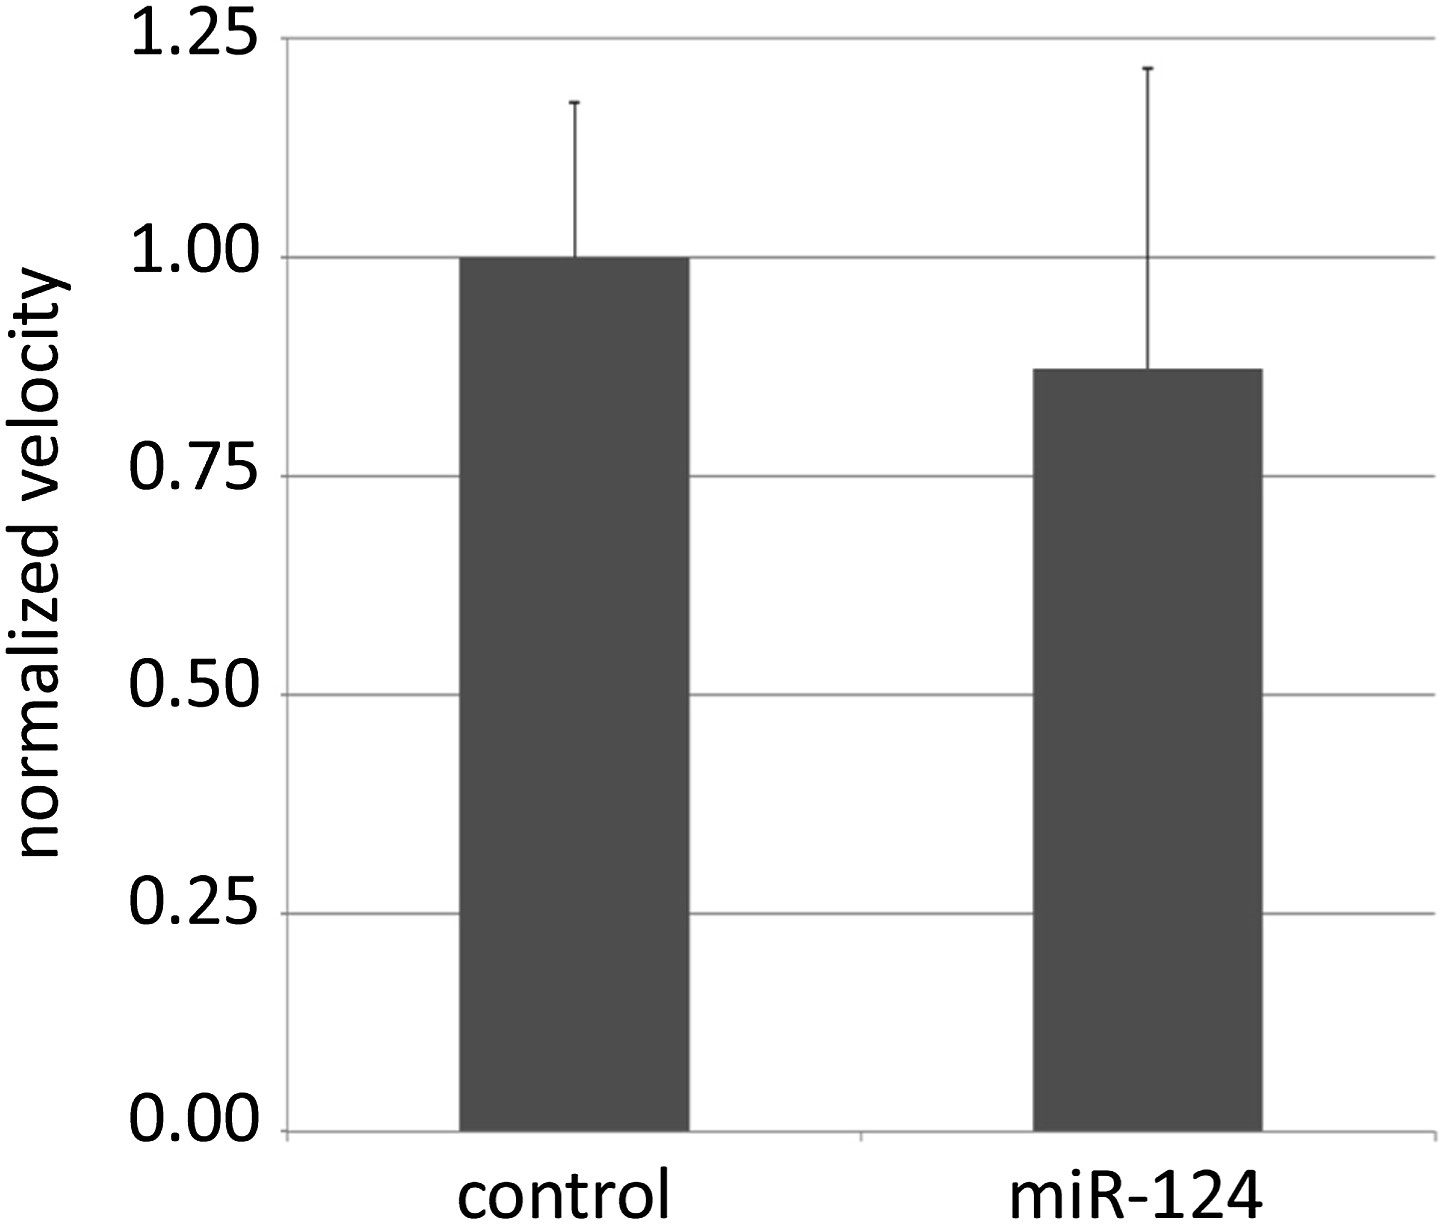
Locomotion assay.
The total distance travelled by single 5-day-old males of the indicated genotypes in a 10 mm courtship chamber was traced and measured for 10 min. The velocity of each genotype was calculated and normalized to control level. 14 flies were recorded per genotype. There was no significant difference between the control and mutant flies.
Figure 5
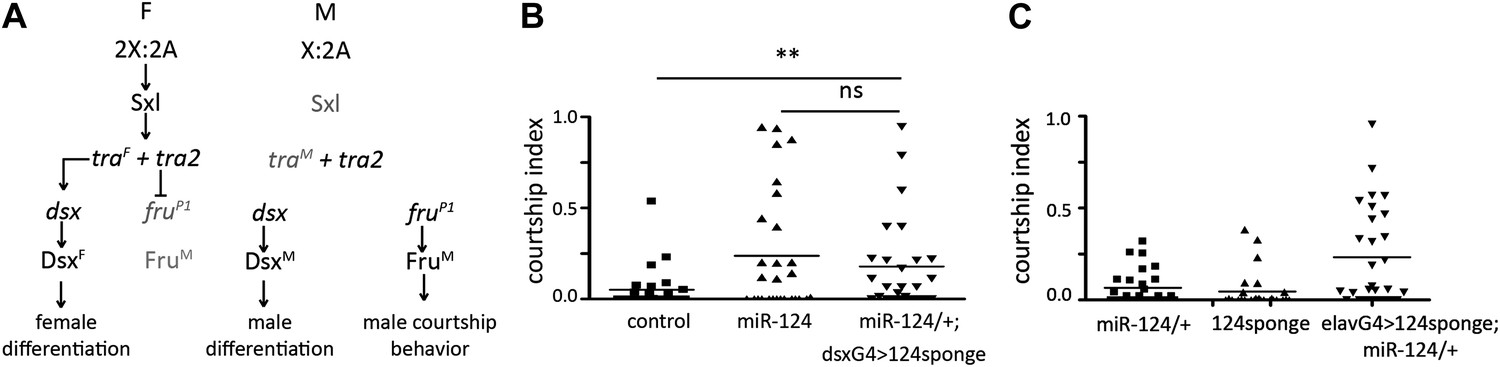
miR-124 acts in the sex differentiation pathway.
(A) Key components of the sexual differentiation system. (B) Courtship index comparing miR-124 mutants and flies expressing a miR-124 sponge under dsx-Gal4 control in males lacking one copy of the endogenous miR-124 gene with CS controls. n: number of animals per sample. Data represent one of four independent trials performed, with comparable results. The horizontal lines represent the median for each data set. (C) Courtship index comparing proportion of time CS control males spent courting decapitated male flies that had expressed the UAS-miR-124 sponge under elav-Gal4 control vs flies that carried the UAS-miR-124 sponge transgene without Gal4 and vs miR-124 heterozygous control males. n: number of animals per sample. Data represent one of four independent trials performed, with comparable results.
Figure 6
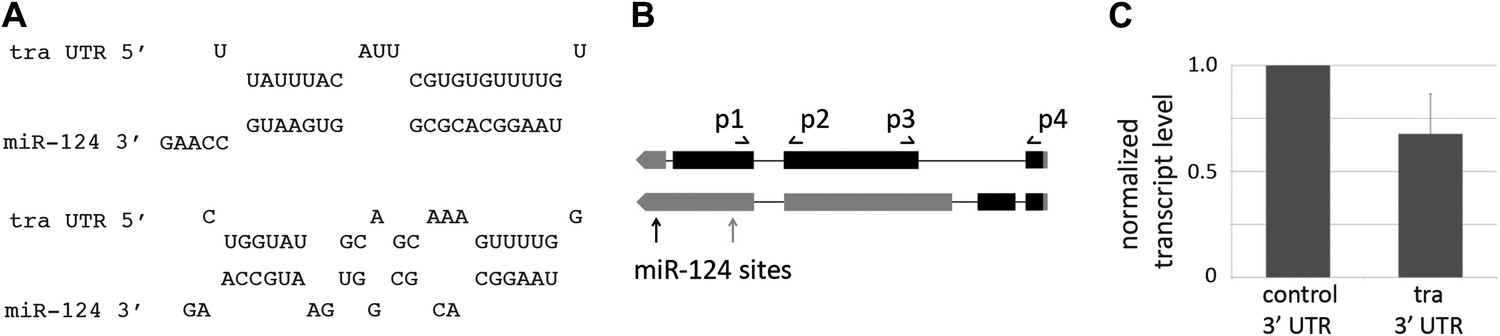
miR-124 targets transformer.
(A) Predicted pairing of miR-124 to two sites in the traF transcript. (B) Sex-specific splicing results in the formation of a female-specific traF isoform. A non-sex-specific isoform is produced in males and females, traC. Exons are represented by black boxes, 5′ UTR and 3′ UTR by grey boxes. Sites for the primer-pairs used for detection of both isoforms, p1 and p2, span an intron in both splice forms. The PCR product from the spliced mRNA is 87 bp (unspliced primary transcript would produce a product of 154 bp). Primers p3 and p4 span the first intron of traF. Note that the positions of the primer pairs are approximate. The positions of the 2 miR-124 target sites are indicated. (C) Luciferase reporter assays. S2 cells were transfected to express a tra 3′UTR luciferase reporter or a control reporter with the SV40 3′UTR. Cells were co-transfected to express miR-124 or with a vector-only control, and a Renilla luciferase reporter as a control for transfection efficiency. Data show the mean ratio of firefly to Renilla luciferase activity based on three independent replicates. Error bars represent SEM. p<0.05 using two-tailed unpaired Student’s t-test.
Figure 7 with 1 supplement

miR-124 acts through regulation of transformer.
(A) Elevated expression of traF transcript measured by quantitative real-time PCR using RNA isolated from male flies of the indicated genotypes (primer pair p3 and p4). actin 42A was used as an internal control for normalization. Data represent the average of five independent experiments ± SEM. Although traF transcript levels are low in control males, they were detected by quantitative real-time PCR (traces are shown in Figure 6). (B) Percentage of males achieving copulation with CS females in 30 min. Data represent the mean of more than 20 movies per genotype ± SD. Genotypes: CS: canton S control; miR-124 refers to the trans-heterozygous mutant combination miR-124Δ4/miR-124 Δ177; 124>traRNAi refers to the trans-heterozygous mutant combination miR-124Δ4/miR-124 Δ177 carrying the miR-124-promoter Gal4 transgene and UAS-tra RNAi. Depletion of tra significantly improved performance of the miR-124 mutant males. (C) Courtship index comparing proportion of time CS control males spent courting decapitated males of the indicated genotypes. n: number of animals per sample. Data represent one of three independent trials performed, with comparable results. Depletion of tra significantly reduced the attractiveness of the miR-124 mutant males to normal levels. (D) Quantification of cVA levels in males of the indicated genotypes by GC-MS. Knocking down of tra in using miR-124Gal4 driver significantly rescued the changes cVA levels in miR-124 mutant males. Data represent the average of two (for miR-124 > traRNAi) or three replicates (CS and miR-124) ±SEM. n = 15 in each replicate. (E) Quantification of 9-pentacosene levels in males of the indicated genotypes by GC-MS. Depletion of tra lowered 9-pentacosene levels to within control levels. Data represent the average of two (for miR-124 > traRNAi) or three replicates (CS and miR-124) ±SEM. n = 15 in each replicate. (F) Courtship index comparing proportion of time CS control males spent courting decapitated males of the indicated genotypes. N = 28 animals per sample. Data represent one of three independent trials performed, with comparable results.
Figure 7—figure supplement 1
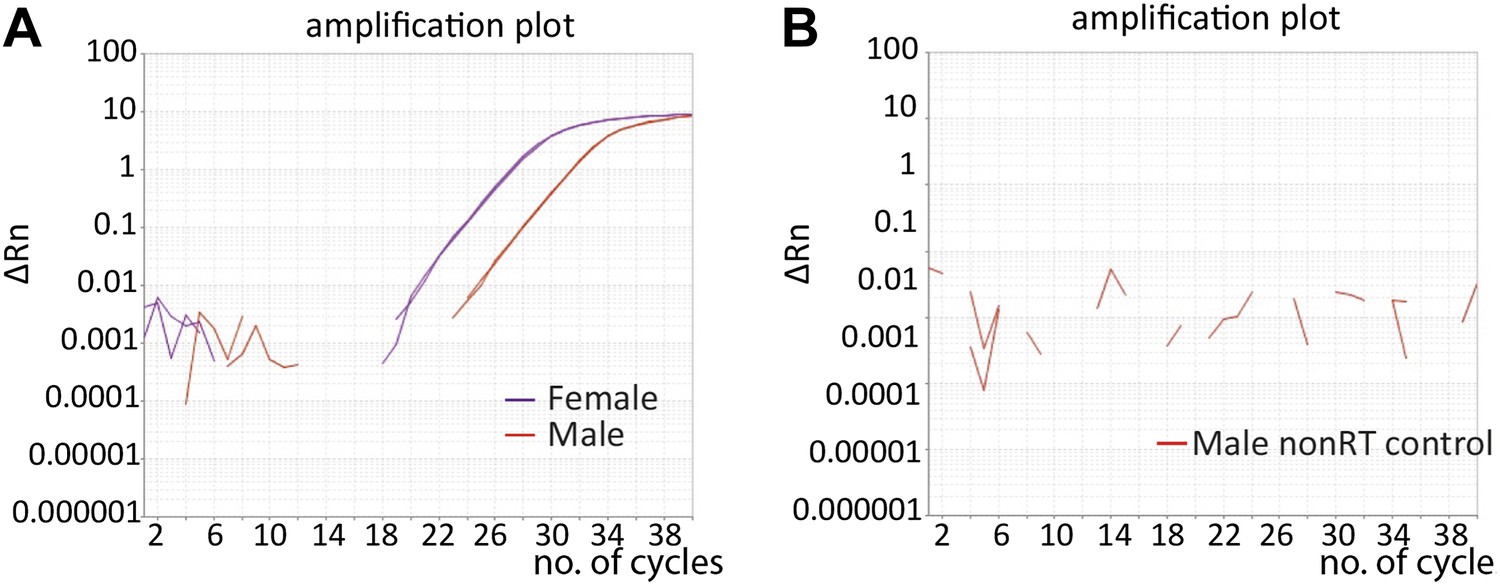
Amplification of traF shown by quantitative real-time RT-PCR.
(A) Detection of traF transcript in heads from 5-day-old control females (purple line) and 5-day-old males (orange line) was shown by the amplification curves from real-time quantitative RT-PCR experiments. The difference was ∼4 cycles, or 32-fold. (B) No amplification was observed in controls not treated with reverse transcriptase (nonRT).
Figure 8
Transcript level of dsxM, but not dsxF, is affected by miR-124 loss-of-function.
Expression of dsxM (A) dsxF (B) transcripts measured by quantitative real-time PCR using RNA isolated from male flies of the indicated genotypes. actin 42A was used as an internal control for normalization. Data represent the average of four independent experiments ± SEM. **p<0.05, NS: not significant.
Figure 9
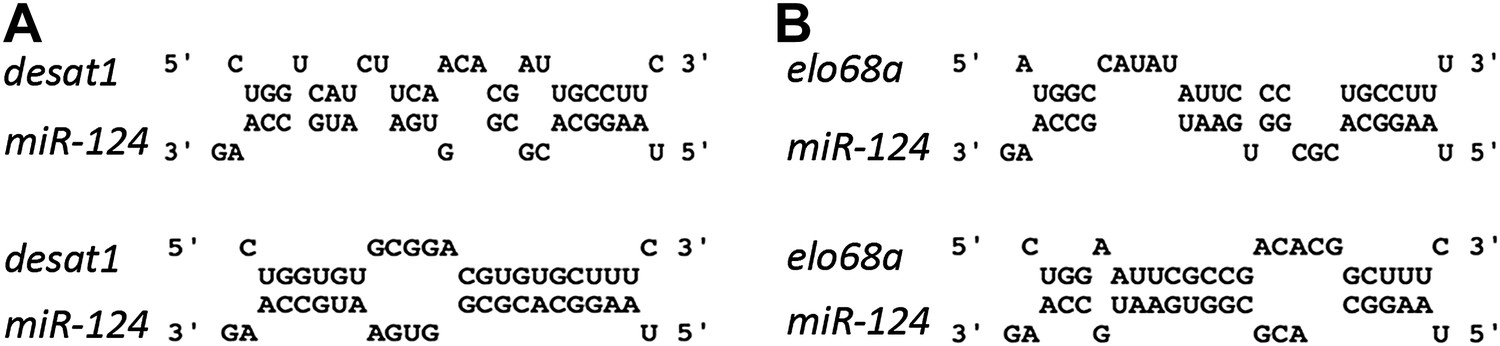
miR-124 sites on desat1 and elo68α transcripts.
Left: sequences of two potential miR-124 sites in desat1 transcript. Top: a 6-mer site in the coding sequence common to all the isoforms; Bottom: an unconventional site with 2 GU base pairs in the 5′UTR of desat1-RC isoform. Right: sequences of two potential miR-124 sites on elo68α transcript. Seed pairing in both sites are weak. All of these sites are unconventional and it is uncertain whether they would show regulation by miR-124. Their function has not been tested experimentally.
Author response image 1
Author response image 2
Tables
Table 1
GC-MS analysis of cuticular hydrocarbon extracts from control, mir-124 mutant, and rescued mutant males
| Compound and elemental composition* | Control† (n = 6) | mir-124 mutant† (n = 6) | Rescued mutant† (n = 6) |
|---|---|---|---|
| C21:0 (nC21) | 0.46 ± 0.08 | 0.32 ± 0.05 | 0.76 ± 0.11 |
| C22:1 | 0.24 ± 0.01 | 0.27 ± 0.02 | 0.35 ± 0.02 |
| cVA (cis-vaccenyl acetate) | 9.36 ± 3.40 | 1.75 ± 0.57*** | 6.60 ± 2.17*** |
| C22:0 | 0.74 ± 0.06 | 0.62 ± 0.02 | 0.95 ± 0.05 |
| 7,11-C23:2 | 0.13 ± 0.01 | 0.07 ± 0.001 | 0.12 ± 0.02 |
| 9-C23:1 (9-tricosene) | 1.39 ± 0.13 | 1.76 ± 0.25 | 1.84 ± 0.14 |
| 7-C23:1 (7-tricosene) | 23.52 ± 1.17 | 24.92 ± 1.74 | 32.80 ± 2.03*** |
| 5-C23:1 (5-tricosene) | 2.71 ± 0.11 | 3.06 ± 0.20 | 3.01 ± 0.18 |
| C23:0 (nC23) | 10.57 ± 0.40 | 11.21 ± 0.25 | 12.66 ± 0.63** |
| C24:1 | 0.32 ± 0.11 | 0.37 ± 0.09 | 0.30 ± 0.07 |
| C24:0 | 0.36 ± 0.02 | 0.43 ± 0.04 | 0.35 ± 0.03 |
| 2-MeC24 | 1.44 ± 0.08 | 1.58 ± 0.15 | 2.03 ± 0.12 |
| C25:2 | 0.52 ± 0.06 | 0.71 ± 0.07 | 0.70 ± 0.04 |
| 9-C25:1 (9-pentacosene) | 4.80 ± 0.61 | 6.33 ± 0.65* | 4.11 ± 0.74 |
| 7-C25:1 (7-pentacosene) | 22.99 ± 1.55 | 25.62 ± 0.63*** | 11.61 ± 1.16*** |
| 5-C25:1 (5-pentacosene) | 1.10 ± 0.33 | 0.79 ± 0.02 | 2.38 ± 0.01 |
| C25:0 (nc25) | 2.34 ± 0.15 | 3.13 ± 0.03 | 2.52 ± 0.15 |
| 2-MeC26 | 6.75 ± 0.49 | 5.37 ± 0.08 | 6.55 ± 0.13 |
| 9-C27:1 | 0.16 ± 0.02 | 0.19 ± 0.03 | 0.12 ± 0.04 |
| 7-C27:1 | 0.97 ± 0.10 | 0.77 ± 0.07 | 0.29 ± 0.06** |
| C27:0 (nC27) | 1.66 ± 0.33 | 2.42 ± 0.60 | 1.86 ± 0.39 |
| 2-MeC28 | 5.90 ± 0.81 | 5.95 ± 0.71 | 6.18 ± 0.77 |
| C29:0 | 0.37 ± 0.11 | 0.78 ± 0.26 | 0.54 ± 0.17 |
| 2-MeC30 | 0.64 ± 0.16 | 0.99 ± 0.27 | 0.87 ± 0.25 |
-
*
The elemental composition is listed as the carbon chain length followed by the number of double bonds; 2-Me indicates the position of methyl branched compounds.
-
†
The normalized signal intensity for each compound and SEM is indicated; *p<0.05, **p<0.01, ***p<0.001 when compared to control (ANOVA followed by post-hoc Tukey HSD test).
Table 2
GC-MS analysis of cuticular hydrocarbon extracts from control, miR-124 mutant, rescued mutants, and miR-124>tra-RNAi males
| Compound and elemental composition* | Control† (n = 3) | mir-124 mutant† (n = 3) | Rescued mutant† (n = 3) | mir-124> tra-RNAi† (n = 2) |
|---|---|---|---|---|
| C21:0 (nC21) | 0.28 ± 0.1 | 0.21 ± 0.01 | 0.51 ± 0.03 | 0.35 ± 0.04 |
| C22:1 | 0.22 ± 0.02 | 0.24 ± 0.01 | 0.31 ± 0.02 | 0.34 ± 0.03 |
| cVA (cis-vaccenyl acetate) | 3.86 ± 0.43 | 0.48 ± 0.04*** | 2.57 ± 0.47* | 2.09 ± 0.23* |
| C22:0 | 0.61 ± 0.03 | 0.60 ± 0.01 | 0.87 ± 0.05 | 0.70 ± 0.05 |
| 7,11-C23:2 | 0.14 ± 0.01 | 0.07 ± 0.001 | 0.17 ± 0.02 | 0.11 ± 0.02 |
| 9-C23:1 (9-tricosene) | 1.10 ± 0.05 | 1.20 ± 0.02 | 1.57 ± 0.12 | 1.94 ± 0.07 |
| 7-C23:1 (7-tricosene) | 21.68 ± 1.14 | 21.04 ± 0.29 | 29.07 ± 2.12*** | 28.95 ± 2.20*** |
| 5-C23:1 (5-tricosene) | 2.56 ± 0.05 | 2.62 ± 0.05 | 2.71 ± 0.25 | 3.11 ± 0.40 |
| C23:0 (nC23) | 9.84 ± 0.15 | 10.66 ± 0.06 | 11.33 ± 0.2* | 10.35 ± 0.33 |
| C24:1 | 0.09 ± 0.05 | 0.19 ± 0.01 | 0.16 ± 0.02 | 0.22 ± 0.01 |
| C24:0 | 0.41 ± 0.01 | 0.52 ± 0.01 | 0.40 ± 0.03 | 0.44 ± 0.01 |
| 2-MeC24 | 1.52 ± 0.13 | 1.24 ± 0.02 | 1.81 ± 0.15 | 1.78 ± 0.09 |
| C25:2 | 0.41 ± 0.02 | 0.54 ± 0.02 | 0.74 ± 0.01 | 0.76 ± 0.06 |
| 9-C25:1 (9-pentacosene) | 6.13 ± 0.12 | 7.78 ± 0.05** | 5.74 ± 0.21 | 6.86 ± 1.02 |
| 7-C25:1 (7-pentacosene) | 26.01 ± 0.69 | 26.97 ± 0.25 | 14.09 ± 0.46*** | 23.23 ± 1.15*** |
| 5-C25:1 (5-pentacosene) | 1.41 ± 0.68 | 0.75 ± 0.01 | 023 ± 0.02 | 0.59 ± 0.03 |
| C25:0 (nc25) | 2.65 ± 0.06 | 3.79±0.05 | 2.85 ± 0.07 | 2.68 ± 0.26 |
| 2-MeC26 | 7.72 ± 0.28 | 5.22 ± 0.01*** | 6.64 ± 0.27 | 5.23 ± 0.21*** |
| 9-C27:1 | 0.20 ± 0.01 | 0.25 ± 0.01 | 0.20 ± 0.02 | 0.18 ± 0.05 |
| 7-C27:1 | 1.15 ± 0.09 | 0.92 ± 0.02 | 0.41 ± 0.01 | 0.60 ± 0.08 |
| C27:0 (nC27) | 2.38 ± 0.12 | 3.77 ± 0.08* | 2.72 ± 0.16 | 1.92 ± 0.21 |
| 2-MeC28 | 7.66 ± 0.13 | 7.53 ± 0.05 | 7.85 ± 0.37 | 5.76 ± 0.33** |
| C29:0 | 0.62 ± 0.06 | 1.37 ± 0.01 | 0.92 ± 0.1 | 0.52 ± 0.05 |
| 2-MeC30 | 0.98 ± 0.06 | 1.59 ± 0.03 | 1.41 ± 0.13 | 0.66 ± 0.02 |
-
*
The elemental composition is listed as the carbon chain length followed by the number of double bonds; 2-Me indicates the position of methyl branched compounds.
-
†
The normalized signal intensity for each compound and SEM is indicated; *p<0.05, **p<0.01, ***p<0.001 when compared to control (ANOVA followed by post-hoc Tukey HSD test).
Download links
A two-part list of links to download the article, or parts of the article, in various formats.
Downloads (link to download the article as PDF)
Open citations (links to open the citations from this article in various online reference manager services)
Cite this article (links to download the citations from this article in formats compatible with various reference manager tools)
miR-124 controls male reproductive success in Drosophila
eLife 2:e00640.
https://doi.org/10.7554/eLife.00640


