TRiC’s tricks inhibit huntingtin aggregation
- Baylor College of Medicine, United States
- Stanford University, United States
Figures
Figure 1
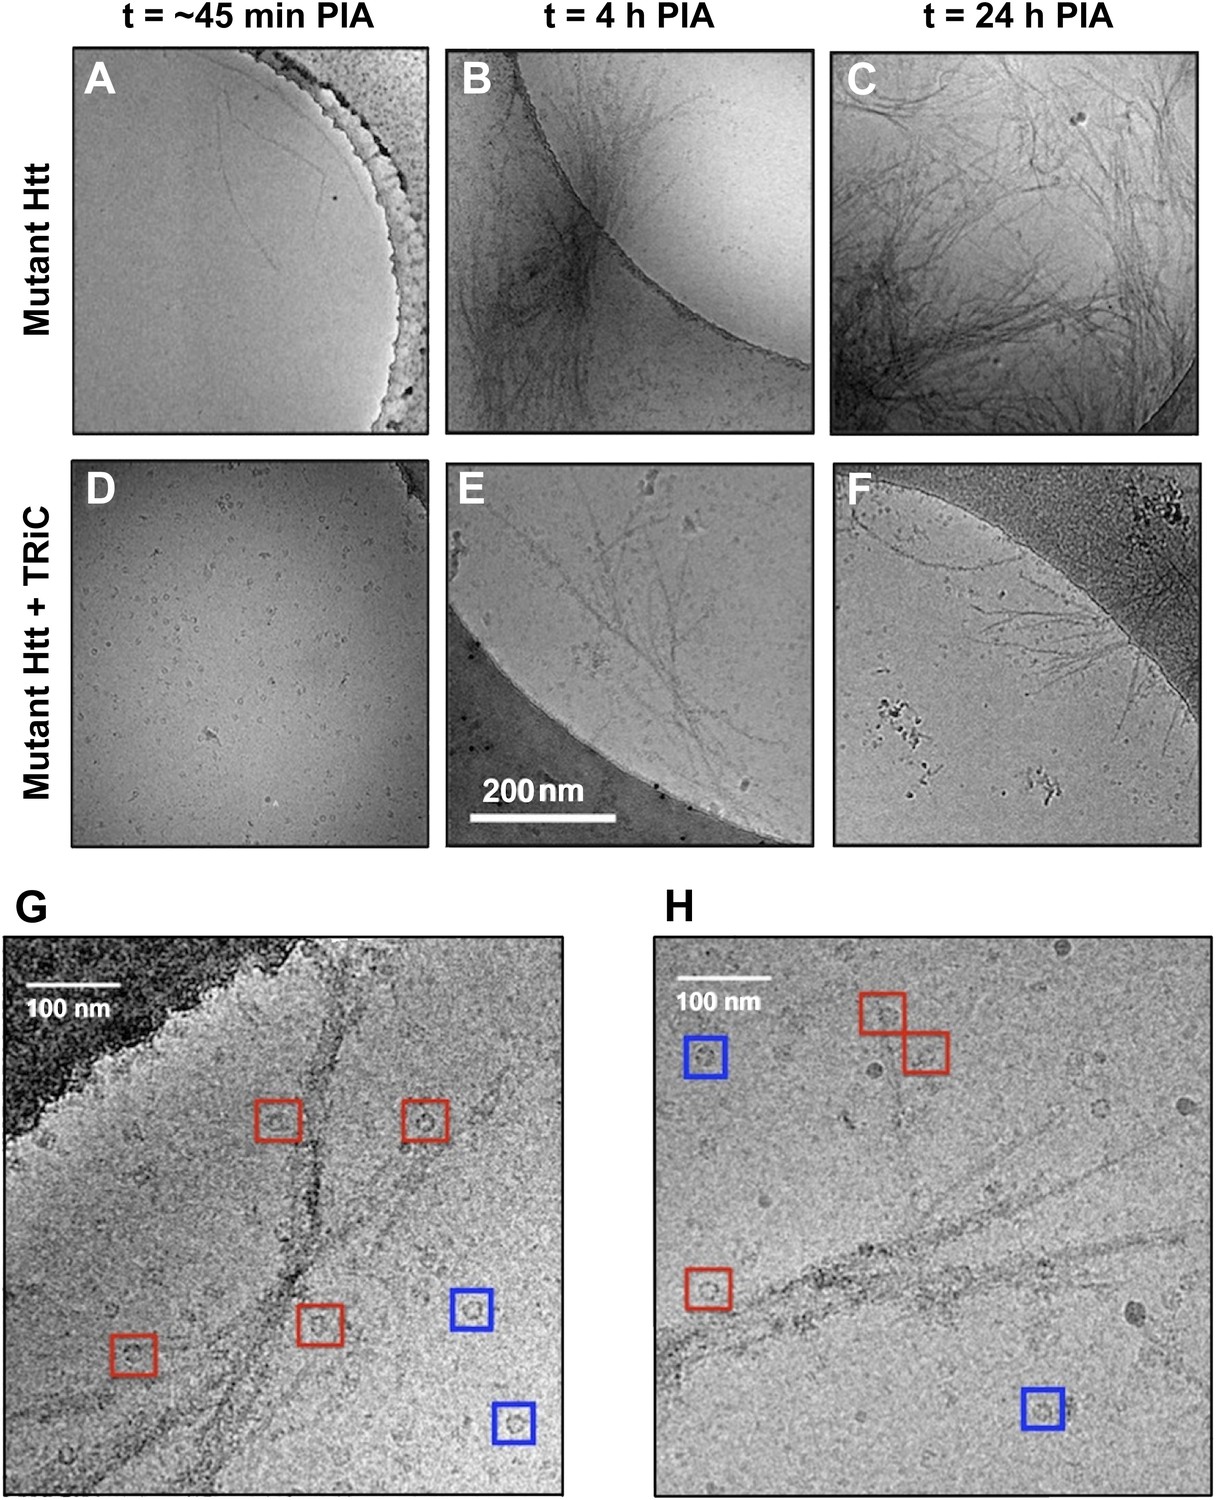
The presence of TRiC inhibits the progression of mhttQ51 aggregation.
2-D cryoEM images of (A) mhttQ51 at 45 min, (B) 4 hr, and (C) 24 hr post-initiation of aggregation (PIA), and of mhttQ51 incubated with TRiC and imaged at (D) 45 min (E) 4 hr and (F) 24 hr PIA. (G, H) Higher magnification images of mhttQ51 + TRiC at 4 hr PIA. Some TRiCs are seemingly attached to mhtt fibrils (red boxes), while others are seemingly freestanding (blue boxes).
Figure 2
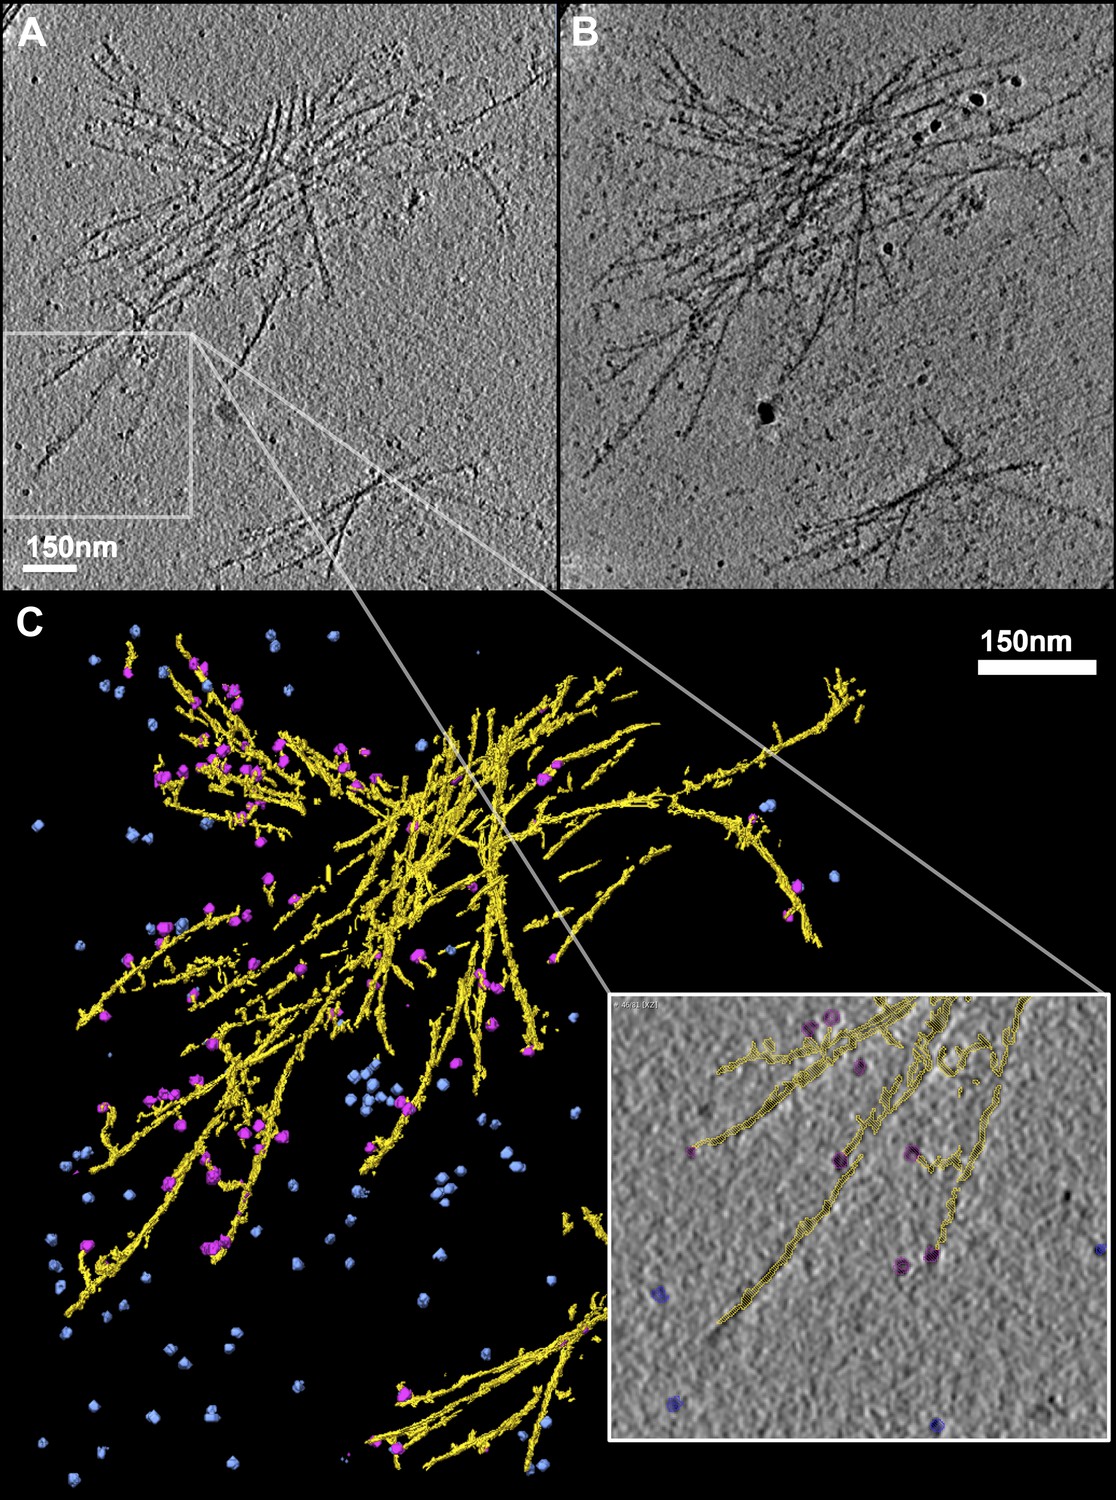
TRiC caps the tips of mhttQ51 fibrils.
(A) 2-D slice through a tomogram of TRiC incubated with mhttQ51 imaged at 4 hr post initiation of aggregation. (B) 2-D reprojection of the entire tomogram and (C) 3-D annotation of its features, showing mhtt fibrils in yellow, freestanding TRiCs in blue, and fibril-bound TRiCs in magenta. Zoomed-in field shows fibril-bound TRiC localizing mostly to discernible tips of mhtt fibrils (seemingly detached magenta TRiC is attached to a fibril on another z-slice of the tomogram).
Figure 3
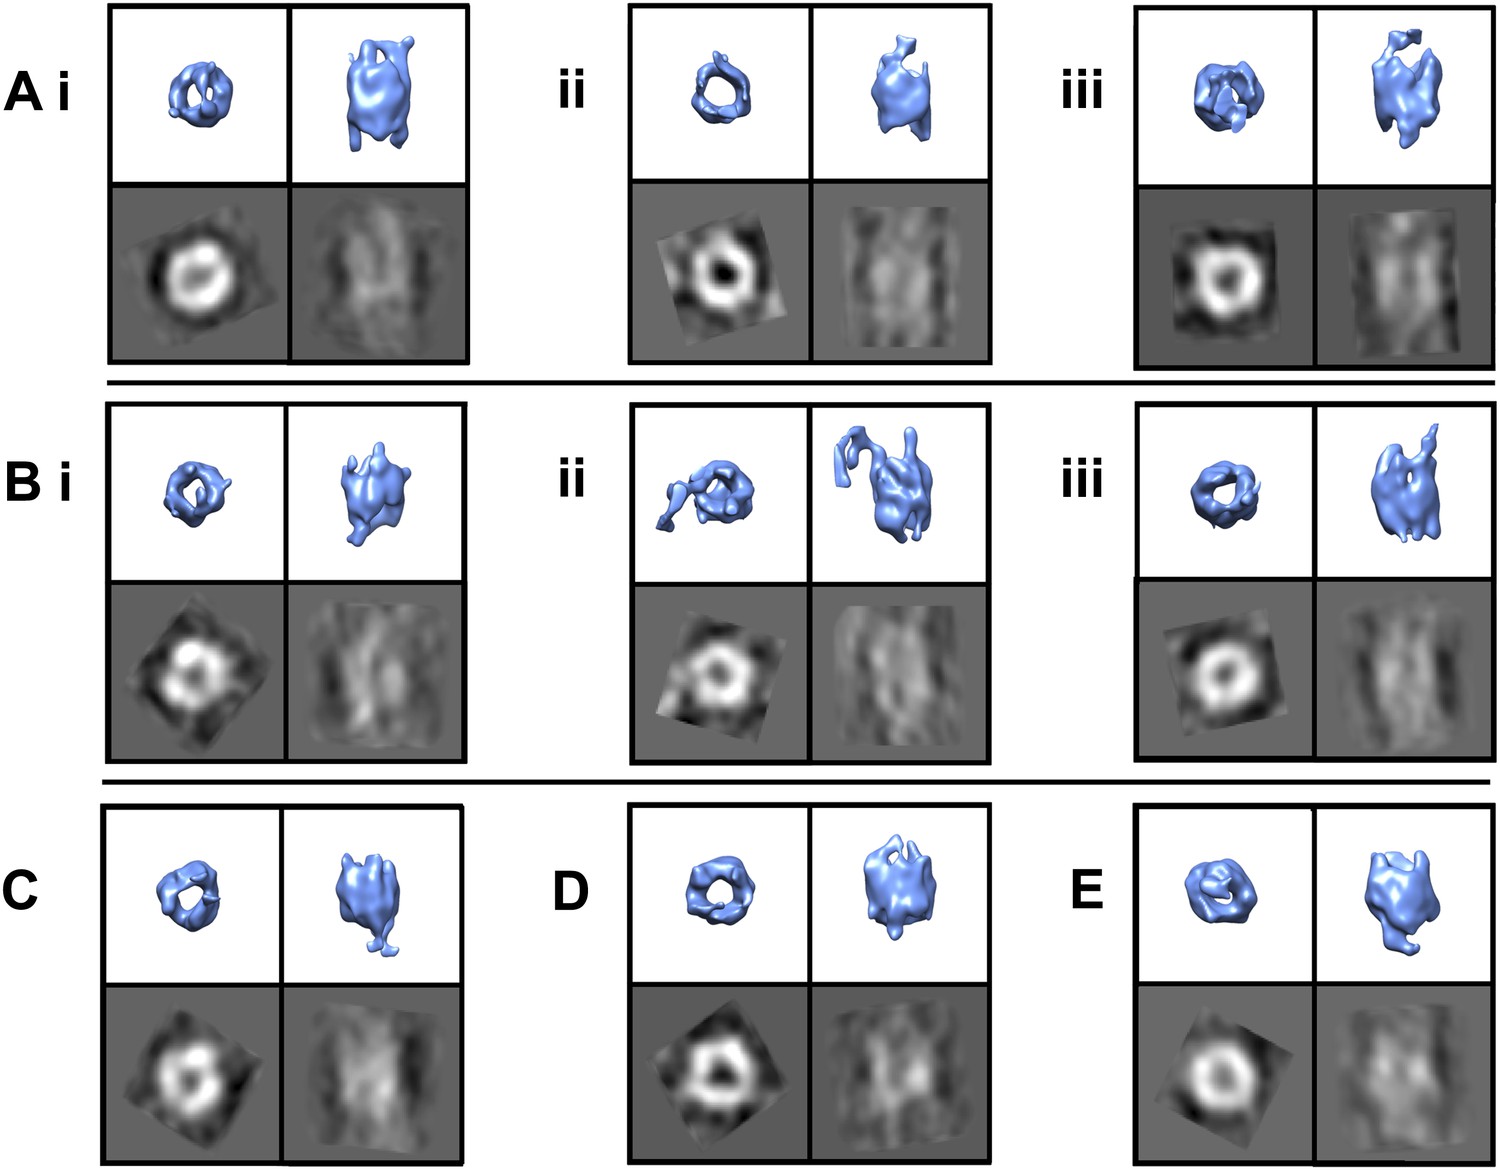
TRiC’s apical tips bind mhtt-fibrils.
SPT symmetry-free and model-free averages of fibril-bound TRiC reveal extra density at the chaperonin’s apical tips. Each panel shows an end-on and a side view isosurface for a 3-D average of TRiC in complex with mhttQ51 fibrils, and corresponding 2-D projections (black/white). Independent sets from single tomograms are labeled A, B, C, D and E. Within each, the numbering (i, ii and iii) indicates mutually exclusive averages. The numbers of subvolumes contributing to each average are (A.i.) 7, (A.ii.) 10, (A.iii.) 13, (B.i.) 7, (B.ii.) 10, (B.iii.) 5, (C) 12, (D) 8 and (E) 12. All the averages show overall TRiC-like morphology with extra densities protruding beyond the apical domains of the chaperonin.
Figure 4
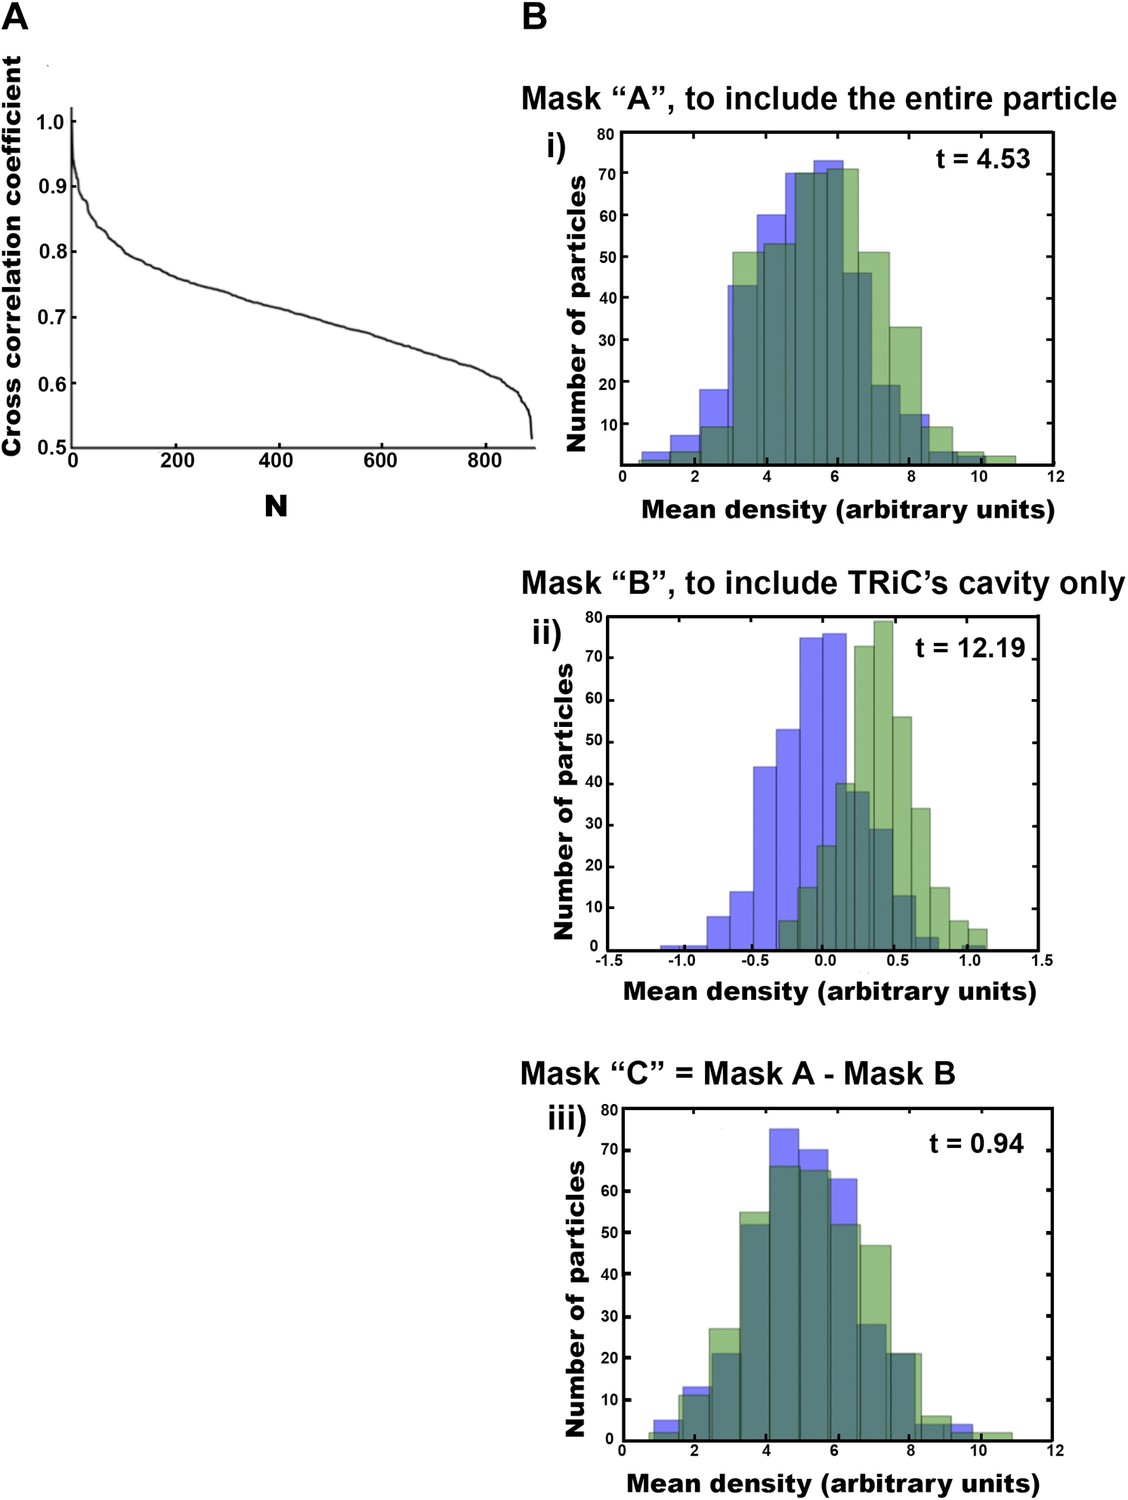
Freestanding TRiCs are classifiable into cavity-empty and cavity-occupied.
(A) Ranked correlation scores for freestanding TRiCs against a hollow TRiC reference yield a continuous fast-decaying plot, suggesting structural heterogeneity. (B) Mean-density distributions for cavity-empty TRiC (blue) and cavity-occupied TRiC (green) sets, masking the particles to (i) include all the density in each particle, (ii) include the cavity of each molecule only, and (iii) include TRiC density but exclude the cavity. Corresponding t-scores for the difference (or shift) between the blue and green distributions are shown for each masking condition.
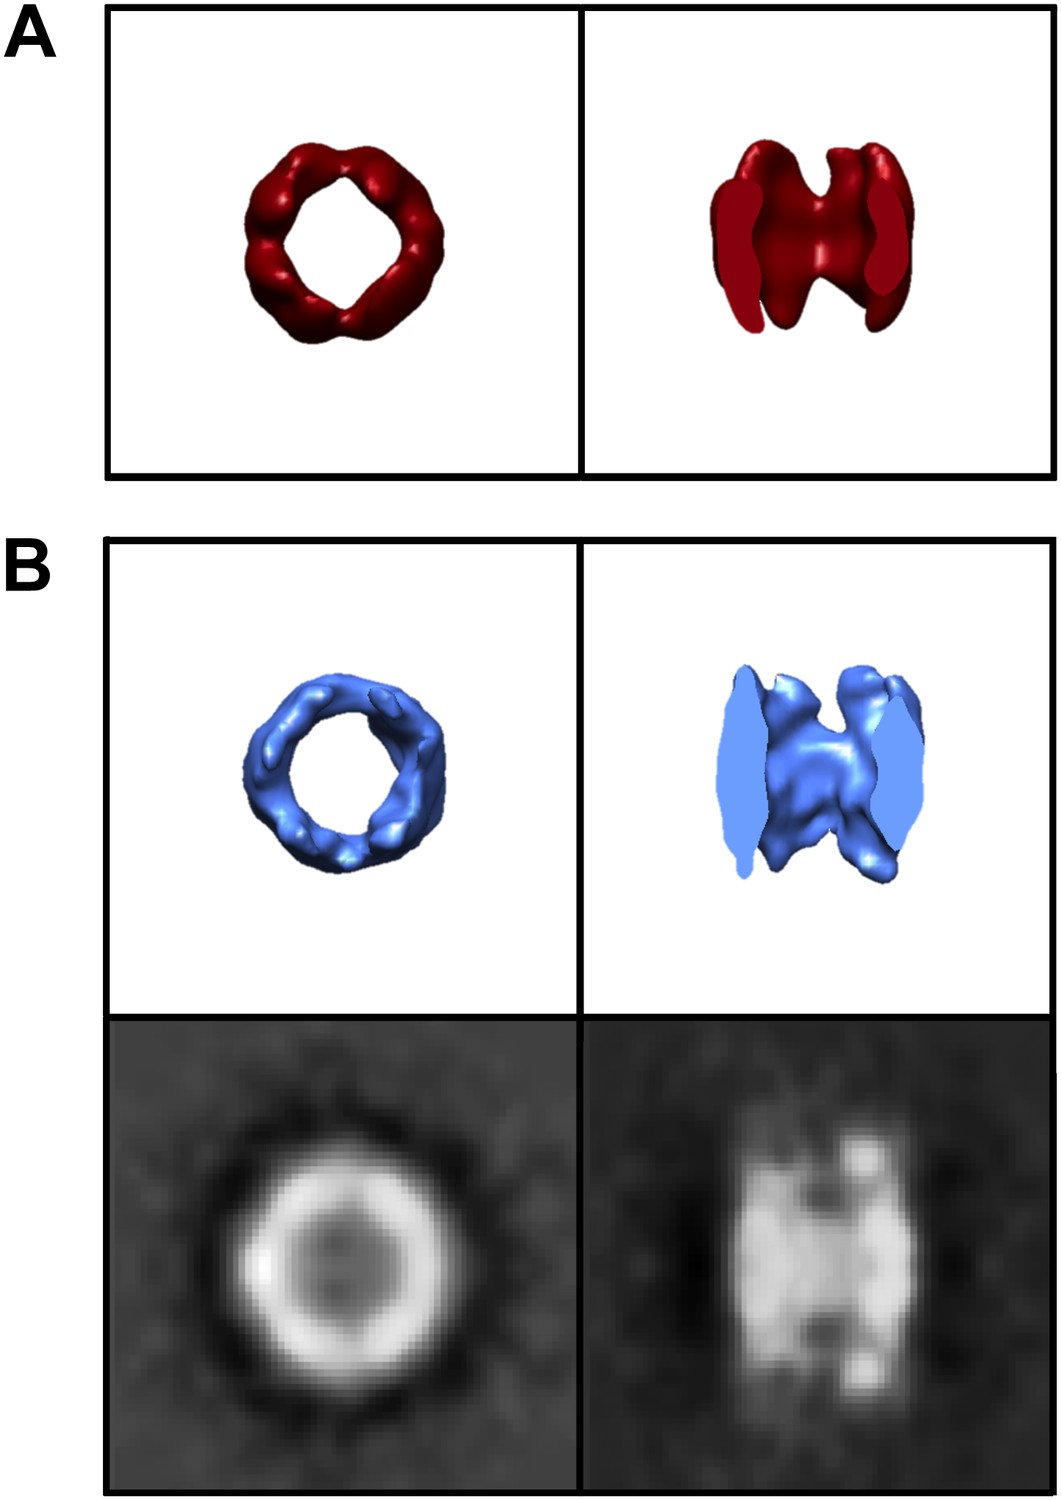
Figure 5

A subpopulation of freestanding TRiC contains intra-cavity extra density.
SPT symmetry-free and template-free processing of freestanding TRiC demonstrates pseudo-eightfold symmetry in an average of (A) 356 cavity-empty TRiCs and (B) 356 cavity-occupied TRiCs. 2-D projections for each average are shown in black/white. The plots show volumetric rotational correlation analyses to test for C8 (blue) and D8 (green) symmetry in each average. The cavity size in B is significantly reduced, due to internalized density.
Figure 6
Control TRiC in the absence of mhtt.
End-on and cut-away views for (A) the published cryoEM structure of apo-TRiC (EMDB 1960), low-pass filtered to match the resolution of freestanding TRiCs, and (B) model-free SPT TRiC average of 208 subvolumes from TRiC-only tomograms or ‘control TRiC’ (no mhtt added). Corresponding projections for the control are shown.
Figure 7
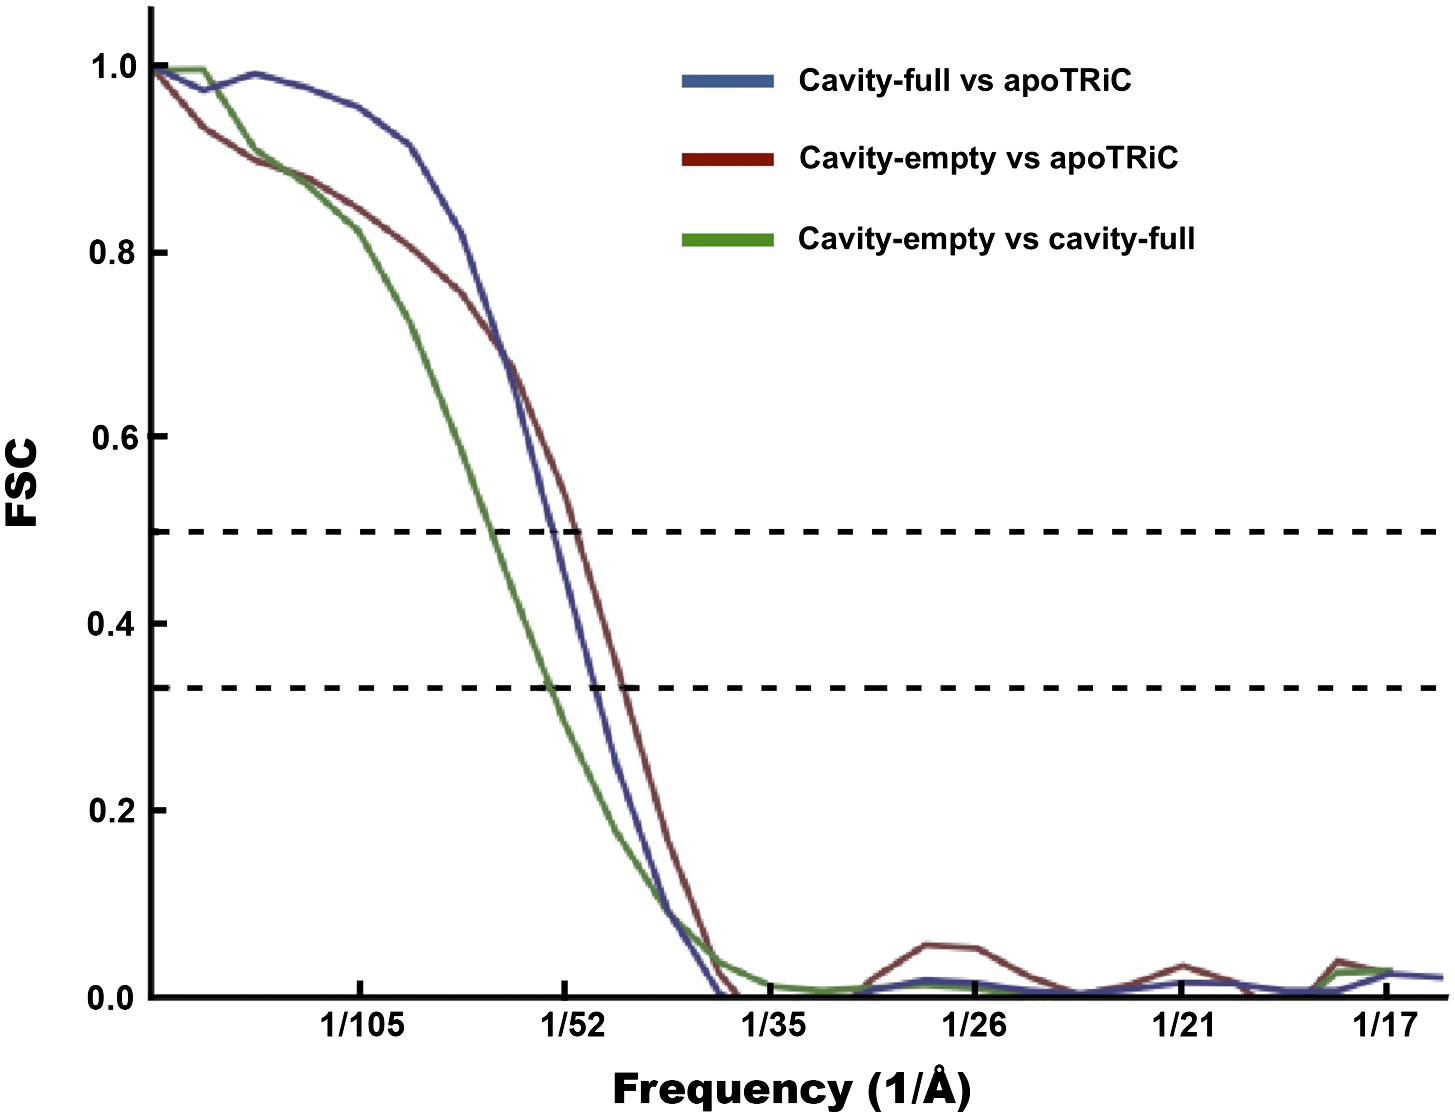
FSC curves for freestanding TRiC averages.
FSC of cavity-empty TRiC (maroon) and cavity-occupied TRiC (blue) with the published structure of apo-TRiC. The FSC of cavity-empty TRiC with cavity-occupied TRiC is shown in green.
Figure 8
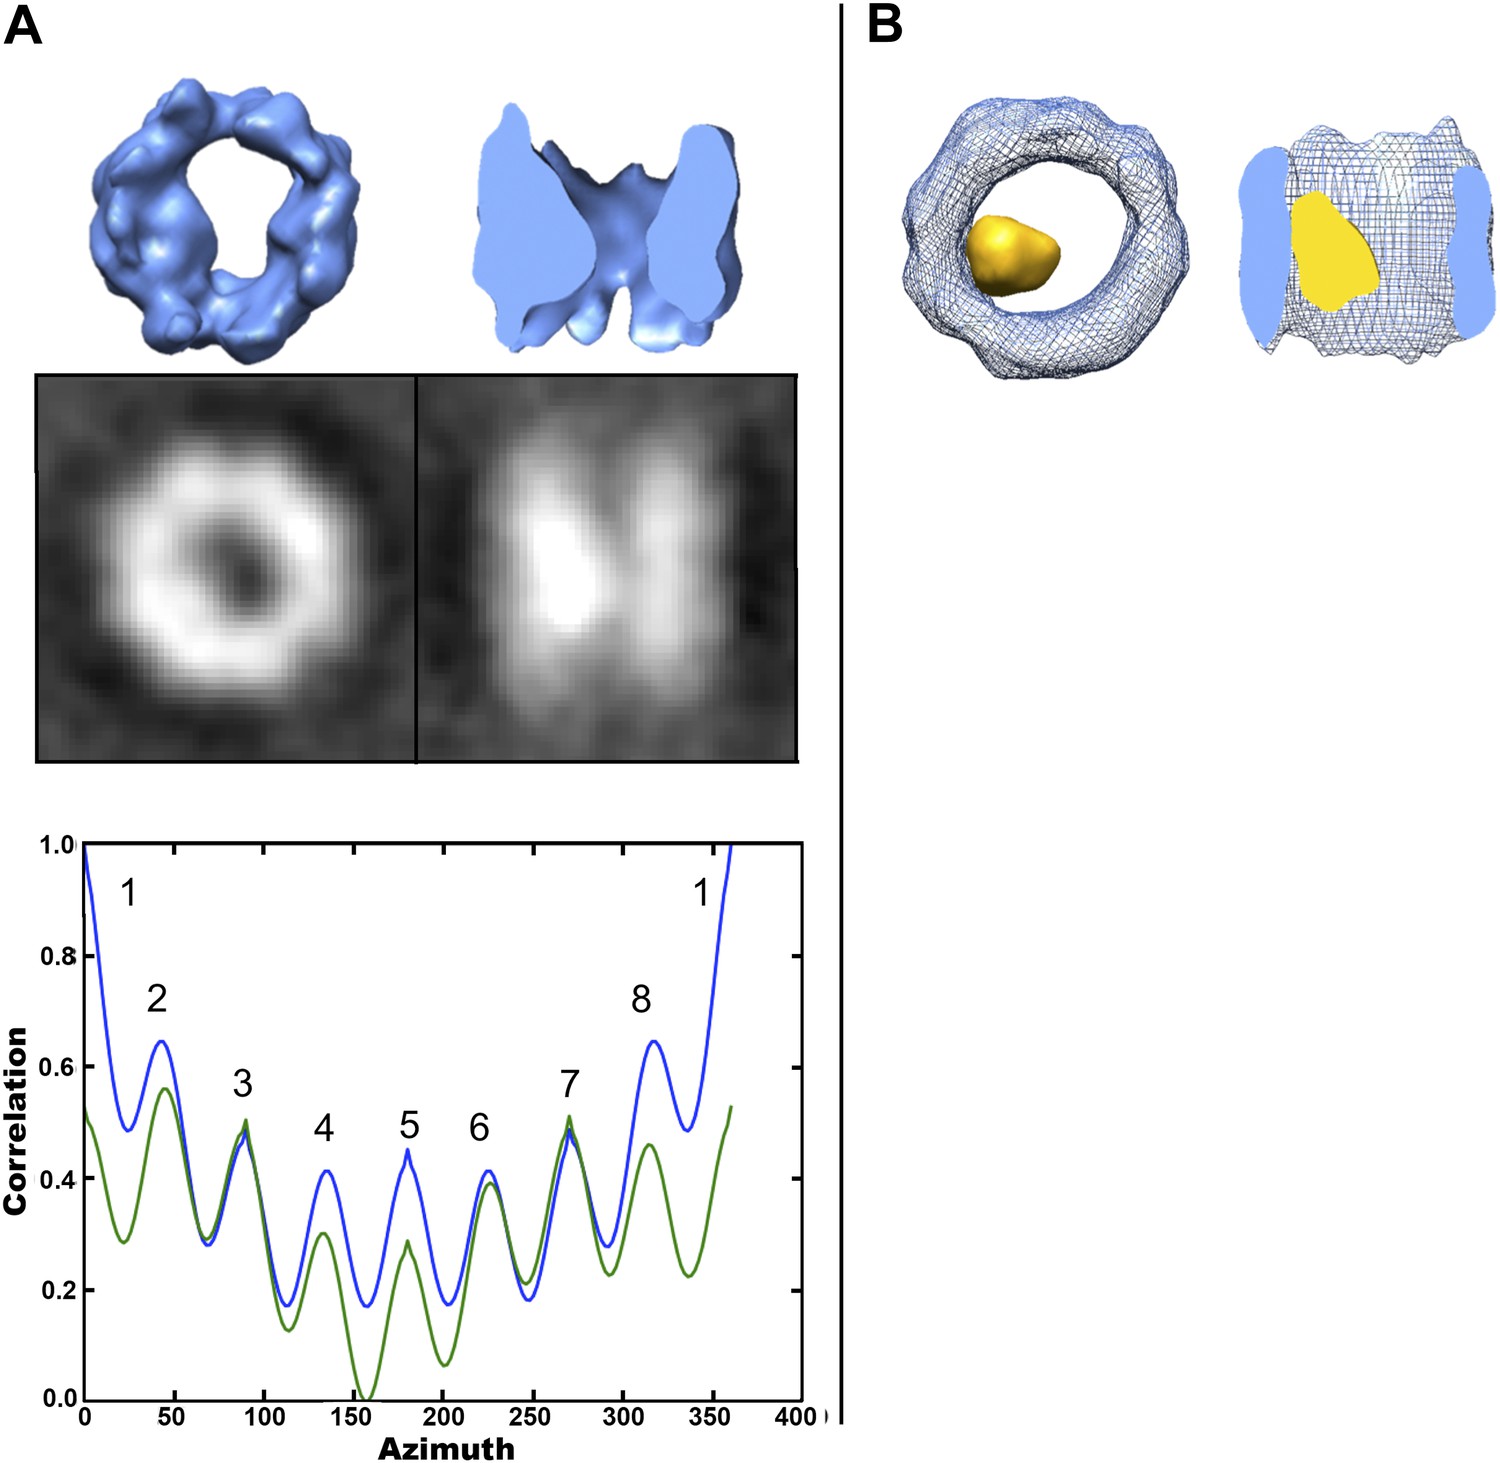
Localized intra-cavity extra density within TRiC.
(A) Hollow-template-guided average of 356 cavity-occupied TRiCs, 2-D projections (black/white) and rotational correlation analysis to test for C8 (blue) and D8 (green) symmetry, showing a ‘dip’ in self-correlation at azimuth equal to 180° due to the presence of localized inner mass. (B) End-on (left) and cut-away side (right) views of the superimposition of the cavity-empty TRiC average (blue wire) from Figure 5A, and the difference map (yellow) between it and the cavity-occupied average in (A).
Figure 9
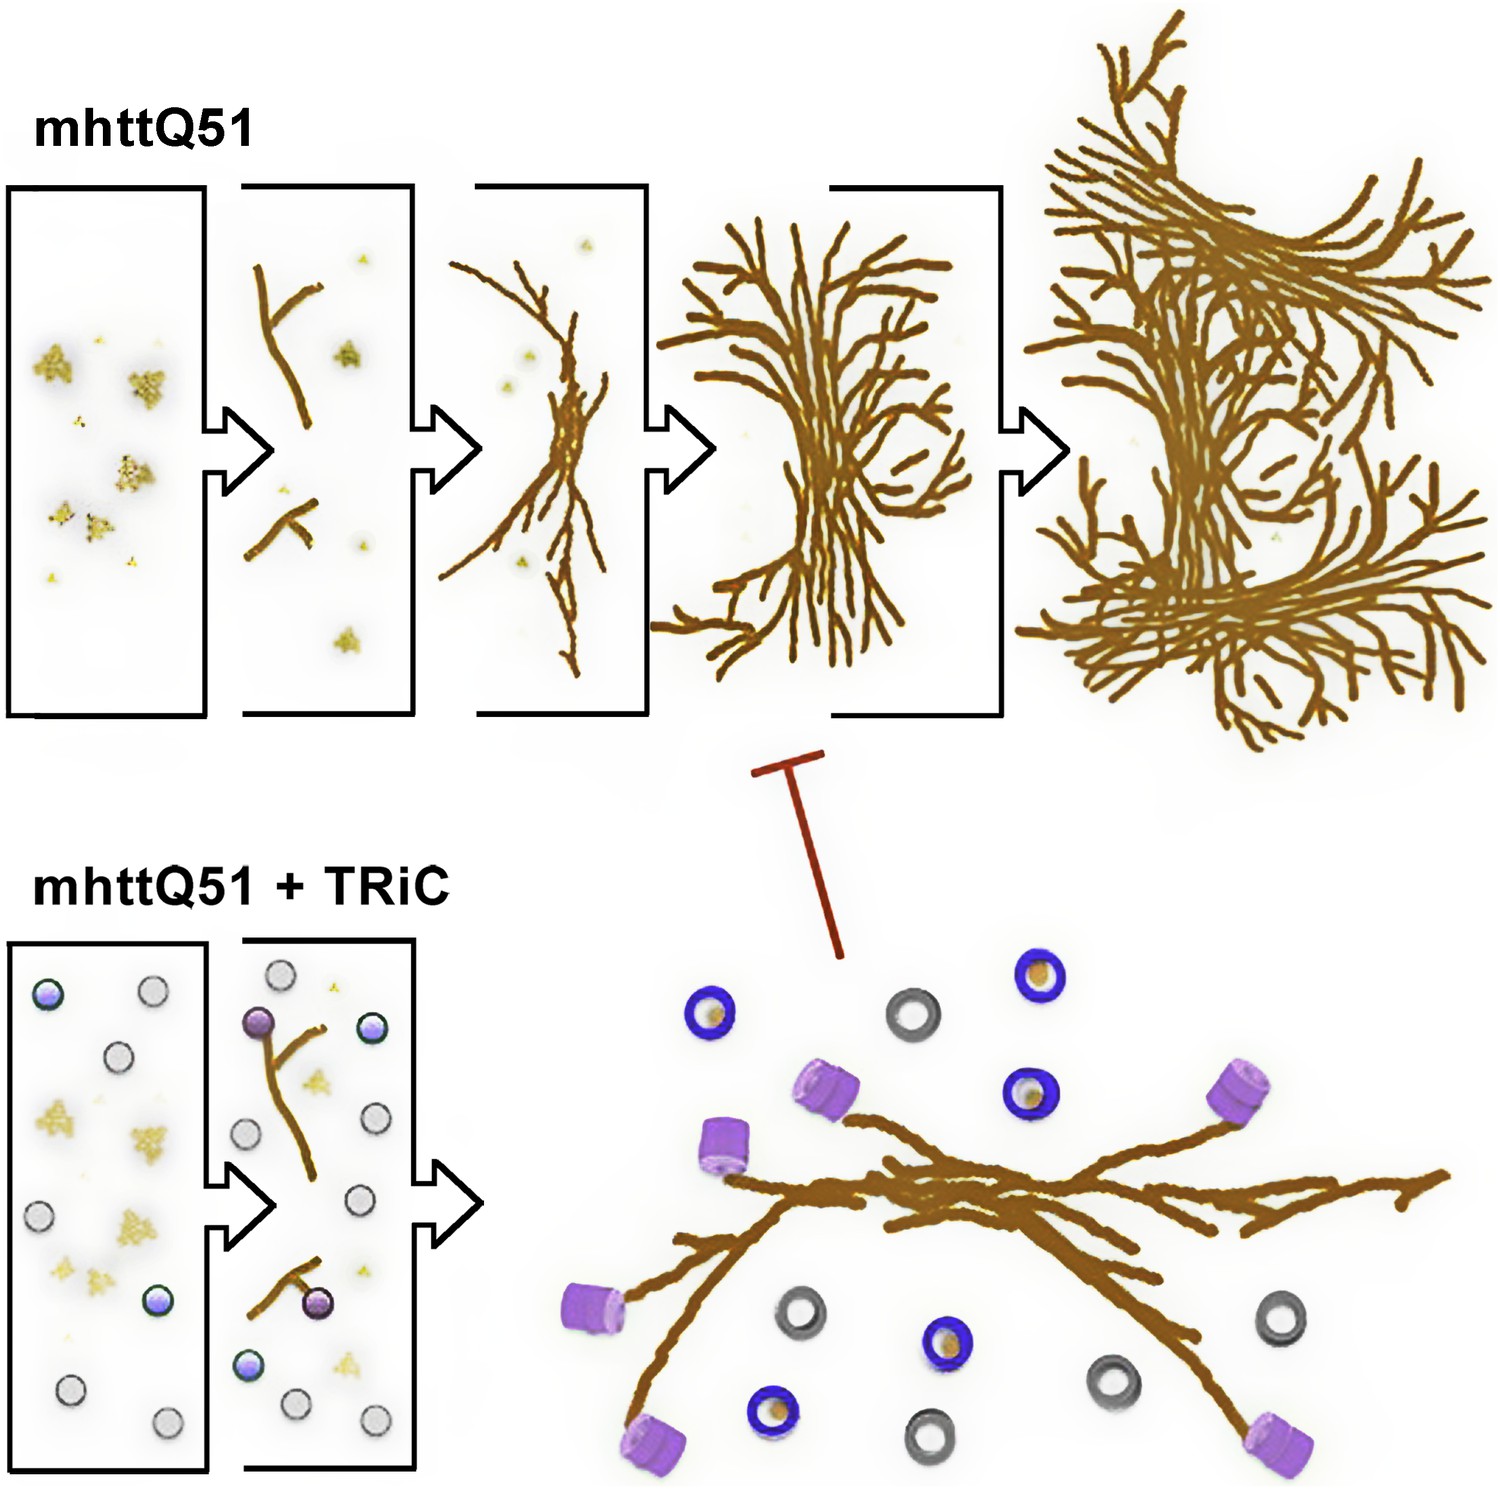
Model for the progression of mhttQ51 aggregation in the absence and presence of TRiC.
In the absence of TRiC (top row), mhttQ51 (orange) aggregation progresses from monomers and oligomers into fibrils and large sheaves. On the other hand, the presence of TRiC (bottom row) prevents the progression of mhtt fibrils into the large bundled ‘sheaf’ form by capping (purple) fibril tips and encapsulating (blue) mhtt oligomers. TRiCs that are not bound to mhtt are shown in gray.
Videos
Video 1
Annotation of 3-D tomogram of mhtt aggregate in the presence of TRiC.
https://doi.org/10.7554/eLife.00710.005Download links
A two-part list of links to download the article, or parts of the article, in various formats.
Downloads (link to download the article as PDF)
Open citations (links to open the citations from this article in various online reference manager services)
Cite this article (links to download the citations from this article in formats compatible with various reference manager tools)
TRiC’s tricks inhibit huntingtin aggregation
eLife 2:e00710.
https://doi.org/10.7554/eLife.00710


