DNA methylation presents distinct binding sites for human transcription factors
- Johns Hopkins University School of Medicine, United States
- Hugo W Moser Research Institute at Kennedy Krieger, Johns Hopkins University School of Medicine, United States
- Chinese Academy of Sciences, China
Figures
Figure 1 with 8 supplements
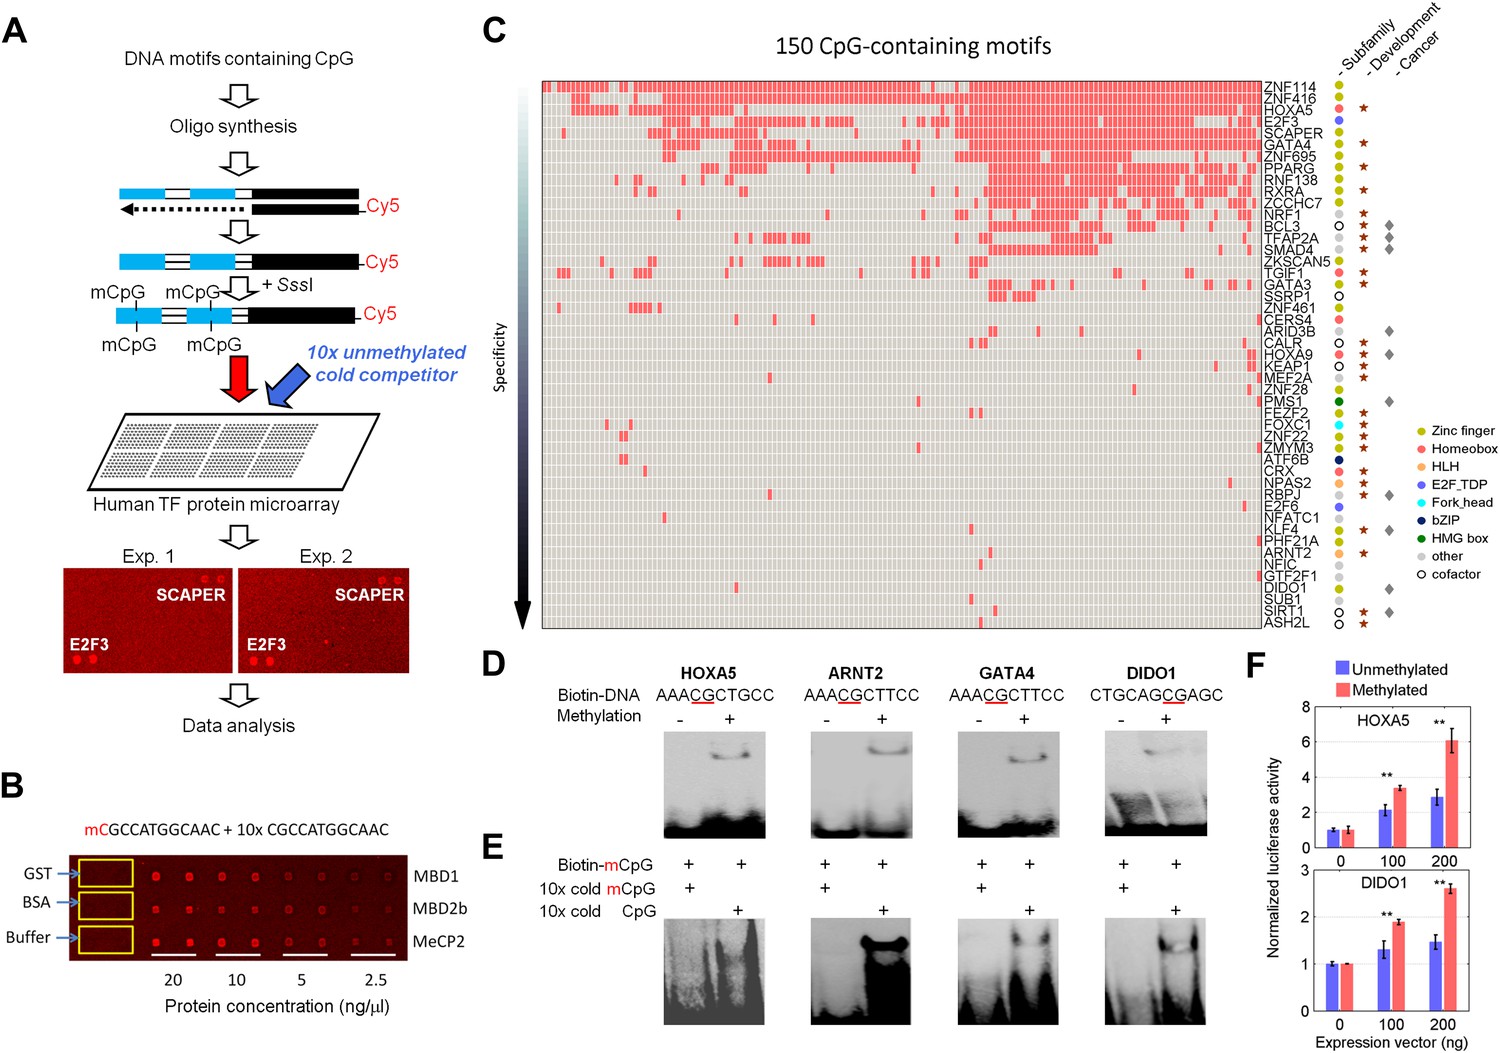
Protein microarray-based approach identified mCpG-dependent DNA-binding activity among human TFs and cofactors.
(A) A competition assay was used to identify proteins that preferentially bind to methylated DNA motifs. SCAPER (S-phase cyclin A-associated protein in the ER) and E2F3 (E2F transcription factor 3) were shown here as two examples of methylated DNA-binding proteins. (B) A proof-of-principle assay was conducted using known methylated DNA-binding proteins on a pilot protein microarray. (C) Binding profiles of 41 TFs and 6 co-factors against 150 of the 154 tested methylated DNA motifs are summarized in the interaction map. TFs are color-coded based on the subfamilies. (D) EMSA assays validated DNA-binding activity for four selected TF candidates. Representative images from three independent experiments with similar results are shown. (E) Competition EMSA assays confirmed mCpG-dependent DNA-binding activities. As expected, 10-fold unlabeled, methylated DNA motif readily abolished the protein–DNA complex formation of the tested TFs with the biotinylated and methylated DNA motifs (Lane 1 in each image). However, 10-fold cold unmethylated DNA counterparts could not compete off methylated DNA binding, consistent with the protein microarray results. (F) HOXA5 and DIDO1 showed mCpG-dependent activation of luciferase activity in GT1-7 cells. Values represent mean ± SD (n = 3; **: p<0.01; t-test).
Figure 1—figure supplement 1
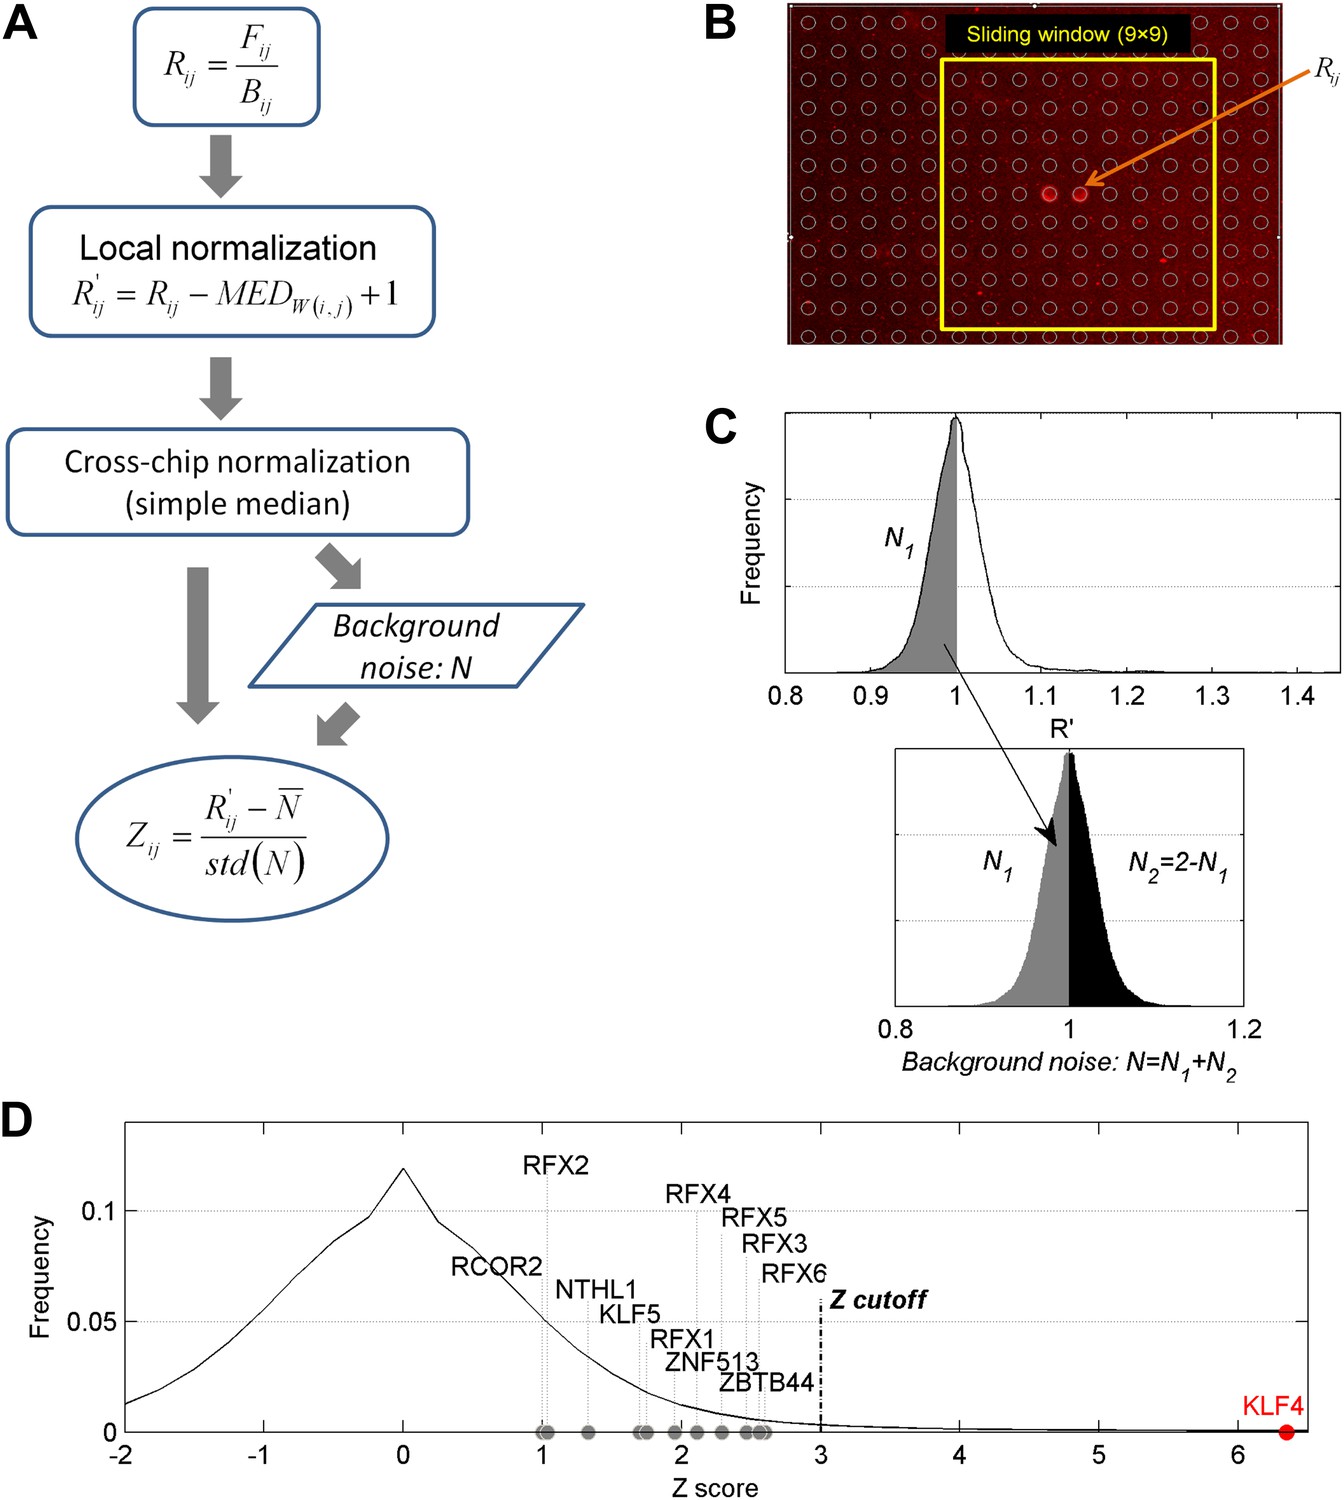
Data analysis of the protein microarray assays.
(A) Workflow of data normalization. (B) Local normalization (window size 9 × 9). (C) Extrapolation of background noise distribution. Noise distribution of N2 is mirrored from distribution of N1. Standard deviation (SD) was calculated based on distribution N (Lower panel). (D) Distribution of Z scores of all proteins on a microarray. Z = 3 was selected as the cutoff in our study to identify the positives. The Z scores of some methylated DNA-binding proteins identified previously (Spruijt et al., 2013) are below our cutoff, while KLF4's Z score for one DNA motif is >6.
Figure 1—figure supplement 2

Reproducibility of protein microarray data.
Left panel: signal comparison between a duplicated binding-assay with motif M303 shows a high correlation, confirming the reproducibility of the assay. Right panel: comparison between two random binding assays exhibited non-correlation between motifs M303 and M259.
Figure 1—figure supplement 3
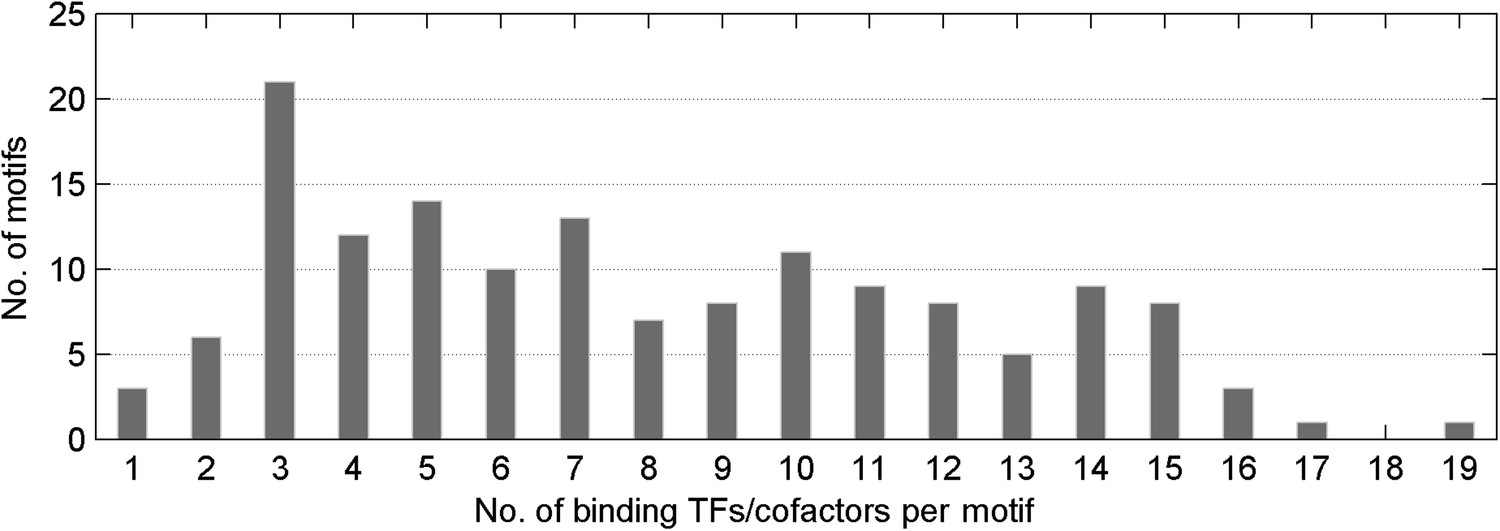
Distribution of number of mCpG-binding TFs/co-factors in a given motif-bind assay.
The median value of TFs/cofactors binding to one methylated CpG-containing motif is 8.
Figure 1—figure supplement 4
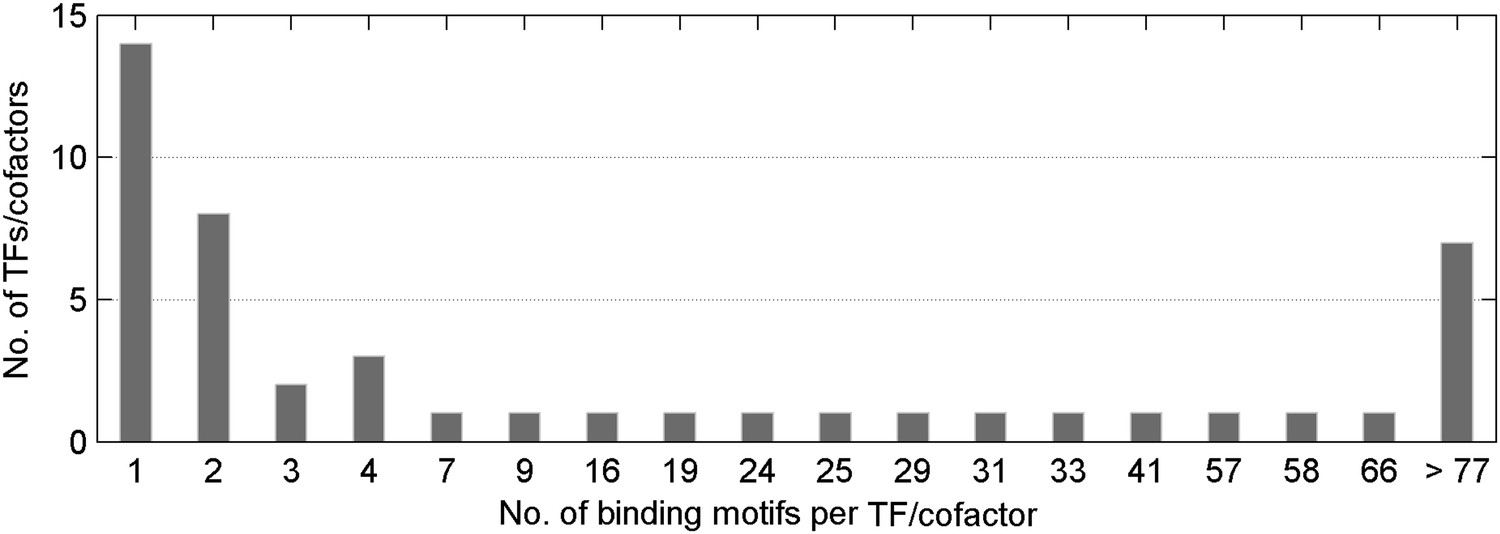
Distribution of number of methylated motifs recognized by a given TF/co-factor.
Most TFs/cofactors bind to very few methylated DNA motif(s); whereas 7 TFs bind to more than 77 of the 154 motifs tested in this study.
Figure 1—figure supplement 5
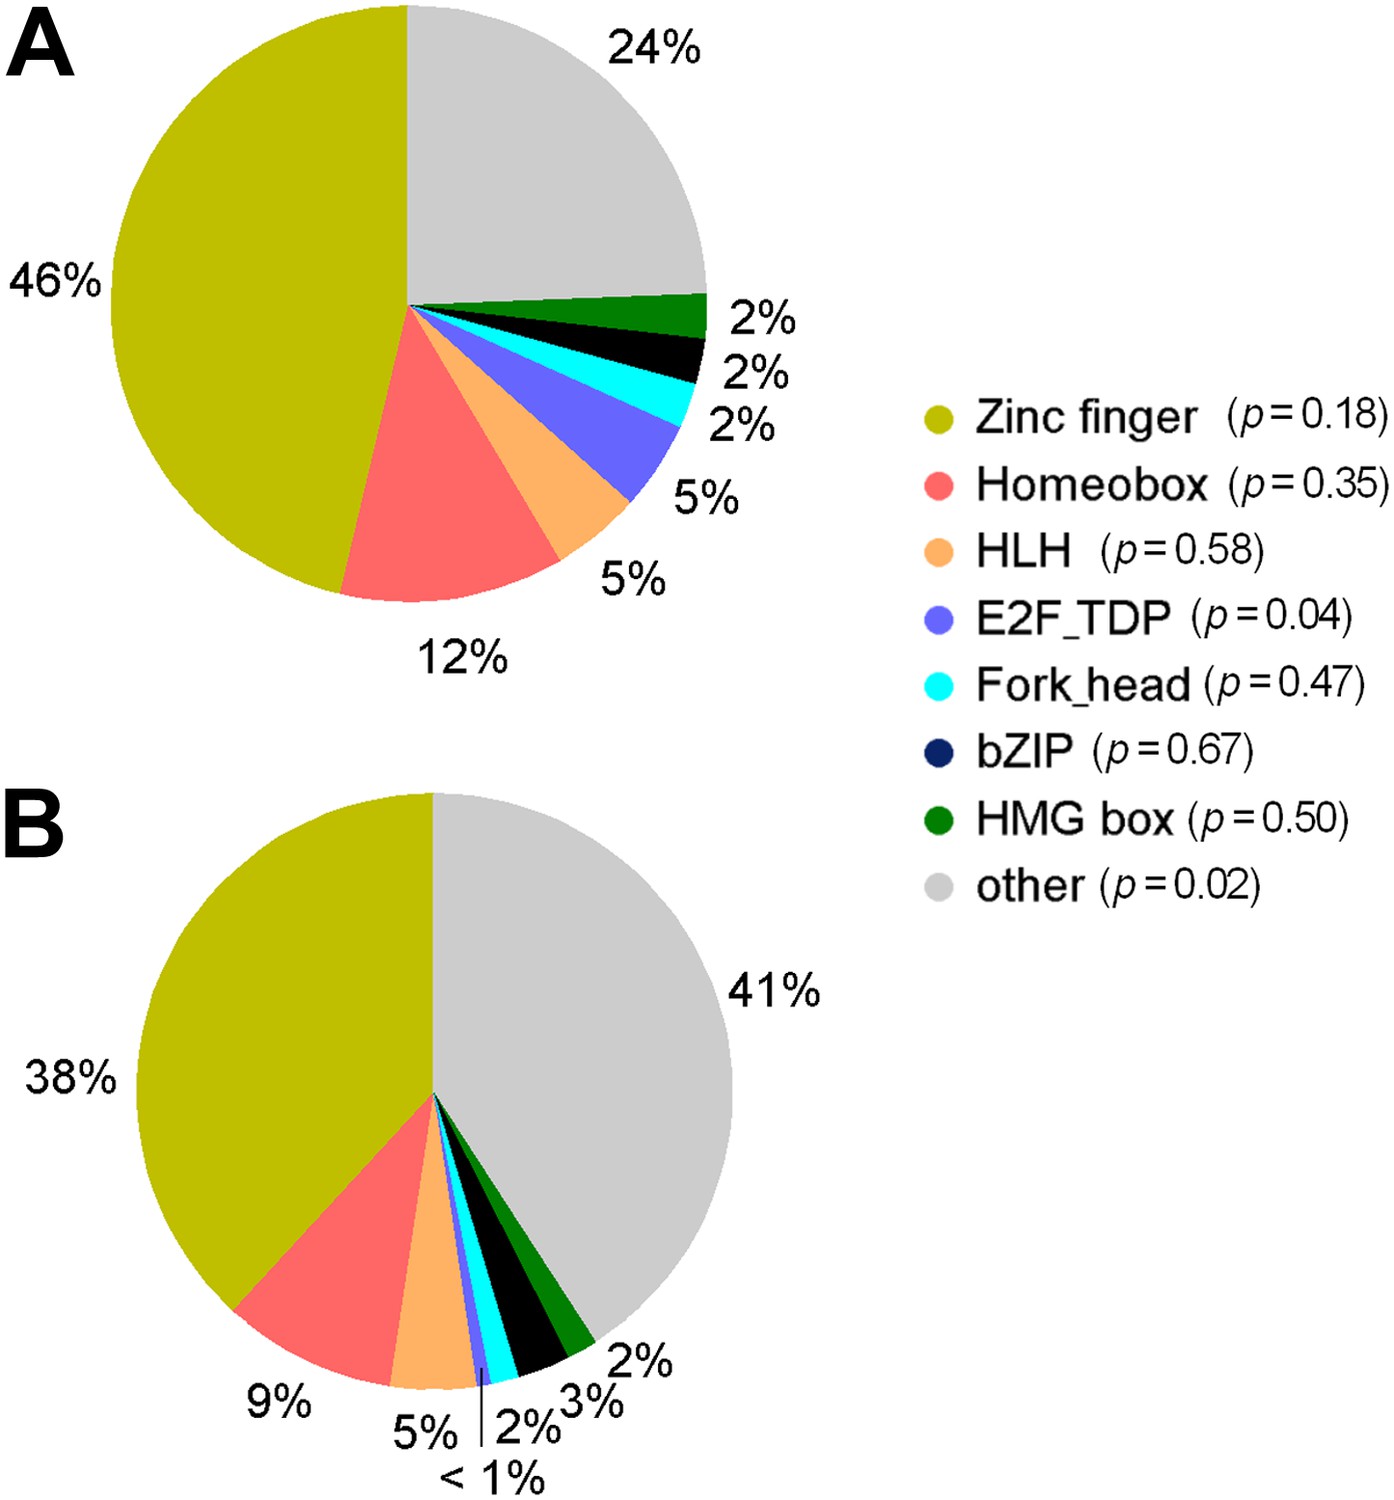
Distribution of TF subfamily members.
(A) Distribution of TF subfamily members that showed mCpG-binding activity. (B) Distribution of all annotated TF subfamily members presented on the TF protein microarrays. Statistic analysis showed that none of the TF subfamilies was significantly enriched (p<0.01) for methylated motif-binding activities.
Figure 1—figure supplement 6

Four additional EMSA assays (A) and competition EMSA assays (B).
The results confirmed specificity of mCpG-dependent DNA-binding activities.
Figure 1—figure supplement 7
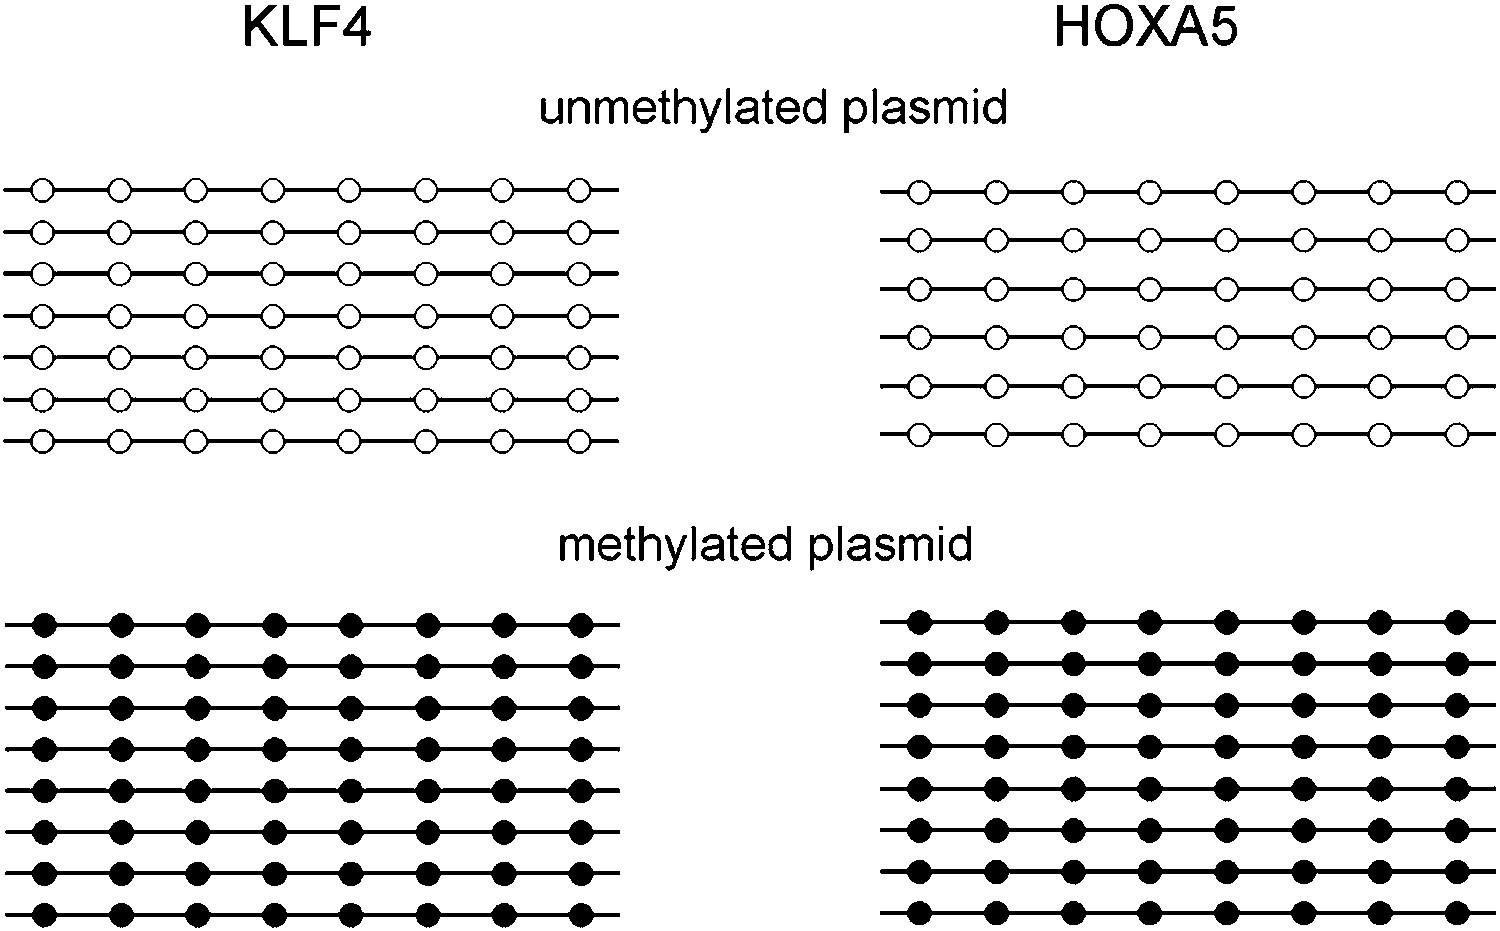
Methylation level of the KLF4 and HOXA5 luciferase reporter constructs.
Eight units of KLF4 (TCCCGCCCA) and HOXA5 (AAACGCTGCC) binding motifs were separately cloned into the promoter region of a CpG-free luciferase reporter vector, and methylated with SssI before transfected into GT1-7 cells. Bisulfite sequencing confirmed that the CpG methylation levels of both motifs reached ∼100% after SssI treatment.
Figure 1—figure supplement 8
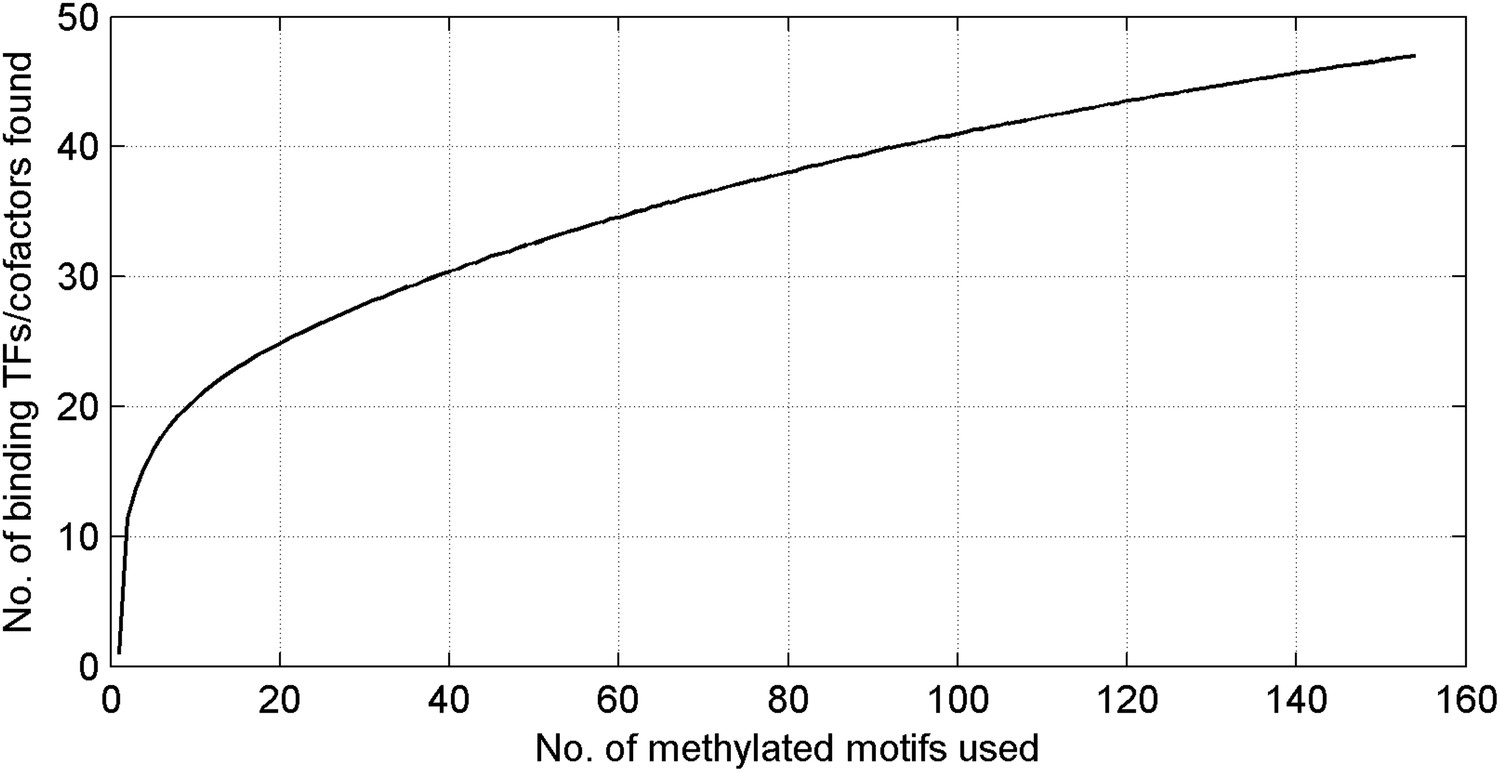
Number of unique mCpG-binding TFs/co-factors in function of number of tested methylated DNA motifs.
The curve is far from saturation, suggesting that more such TFs/co-factors remain to be discovered.
Figure 2 with 4 supplements
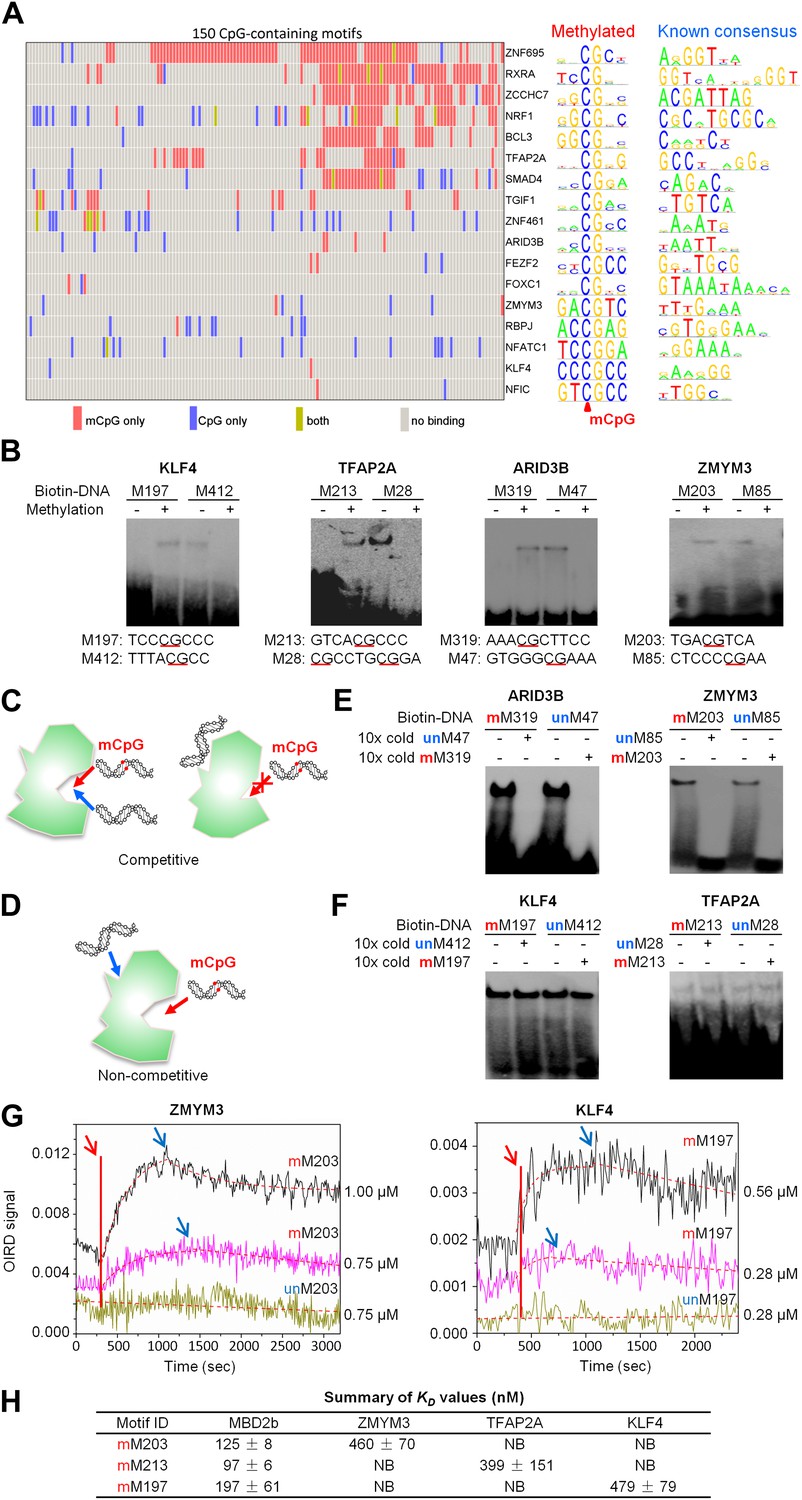
A group of 17 TFs can bind to both methylated and unmethylated motifs of distinct sequences.
(A) Our previous PDI dataset was compiled with the dataset in this study to generate binding preference of the 17 TFs. Methylated consensus motifs of the 17 TFs identified based on the protein microarray results are compared with their known consensus motifs. (B) EMSA assays confirmed that four TFs could specifically interact with both methylated and unmethylated motifs of distinct sequences. Representative images from three independent experiments with similar results are shown. (C) and (D) Two possible scenarios are proposed to distinguish the mode of interactions between these TFs and their corresponding motifs. (E) and (F) Competition EMSA assays showed that both scenarios are possible. Representative images from two independent experiments with similar results are shown in each panel. (G) OIRD sensorgrams for ZMYM3 and KLF4 binding to methylated motifs M203 and M197, and their unmethylated counterparts, respectively. The OIRD measurements were performed at two concentrations of each protein. Solid lines represent the OIRD signals. Dashed lines are fitted On- and Off-curves. Red arrows indicate the starting point when a TF protein was introduced to the OIRD reaction chamber. Blue arrows indicate the time points when wash buffer was added. (H) Summary of average KD values measured at two concentrations of each protein. ‘NB’ indicates no observed binding signals.
Figure 2—figure supplement 1
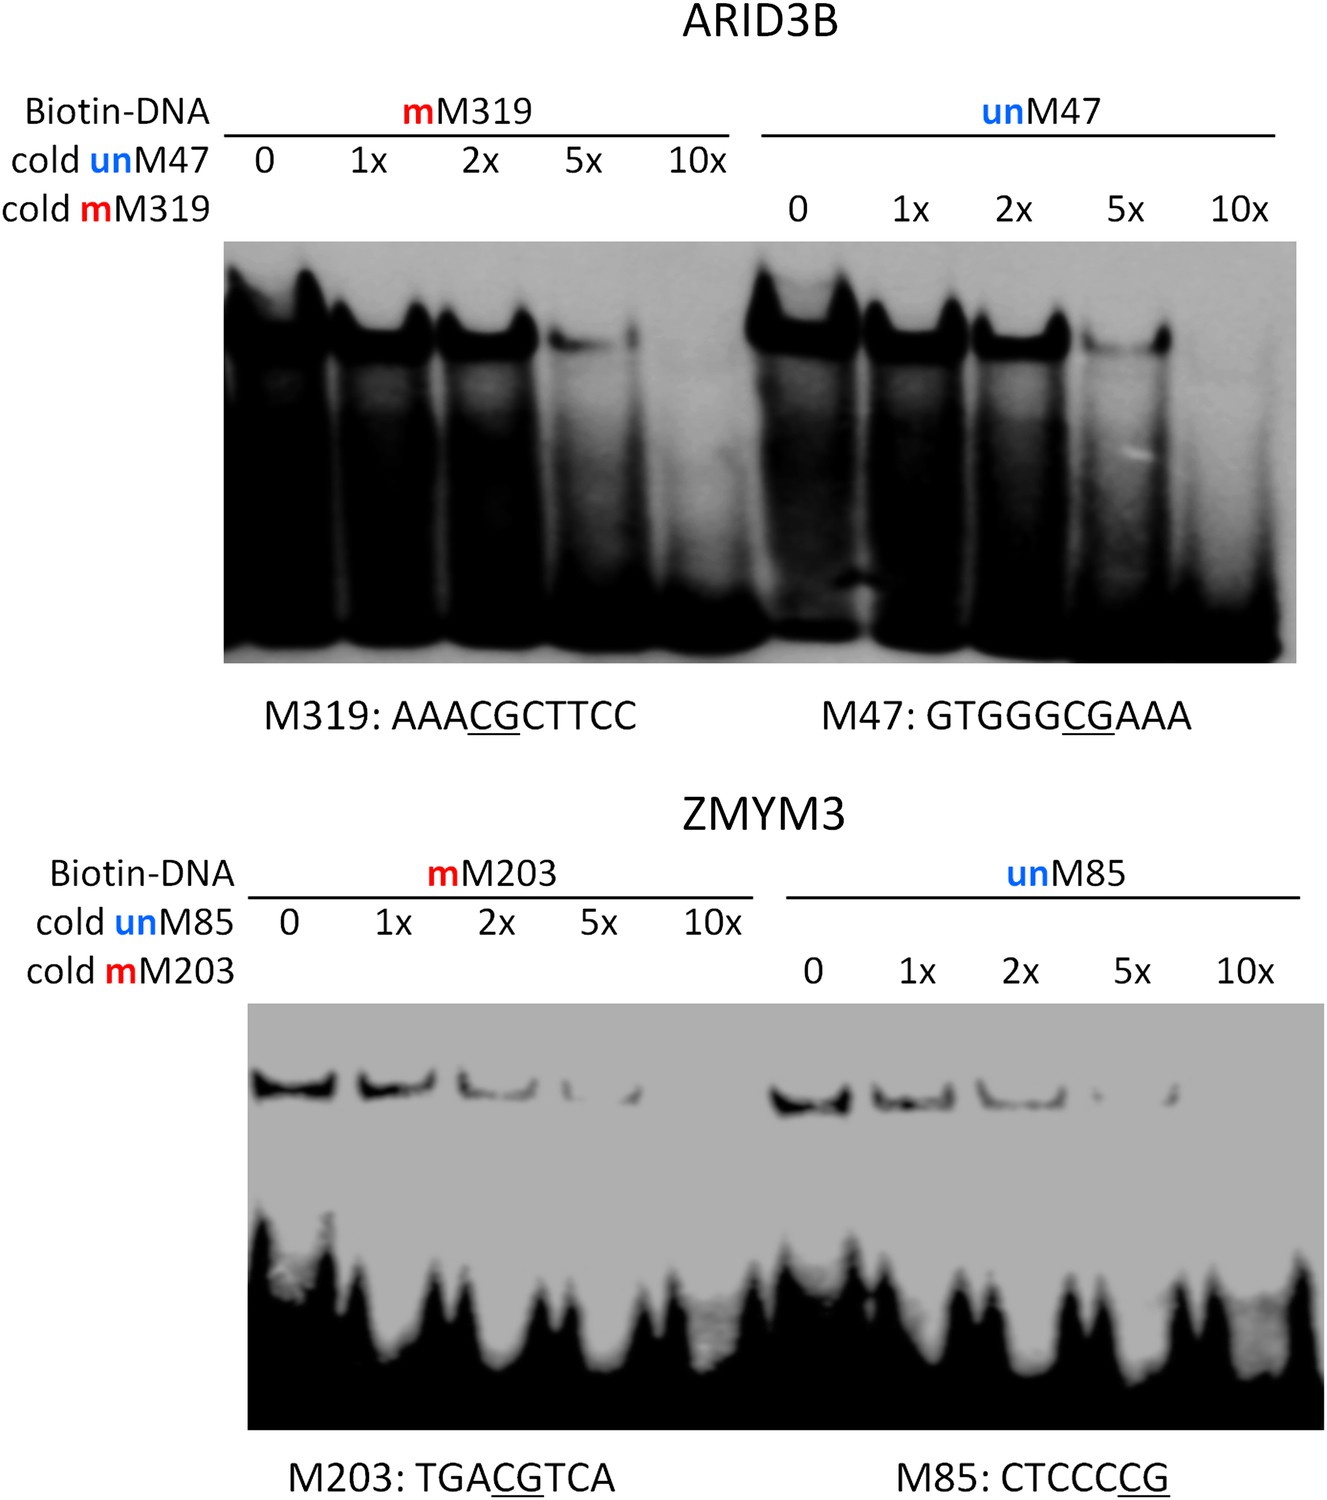
Competition EMSA assays for ARID3B and ZMYM3.
As expected, unlabeled and methylated motif M319 showed dose-dependent competition against the labeled, methylated motif M319; whereas unlabeled and unmethylated motif M47 could readily compete off the binding signals. Same results were observed for ZMYM3.
Figure 2—figure supplement 2
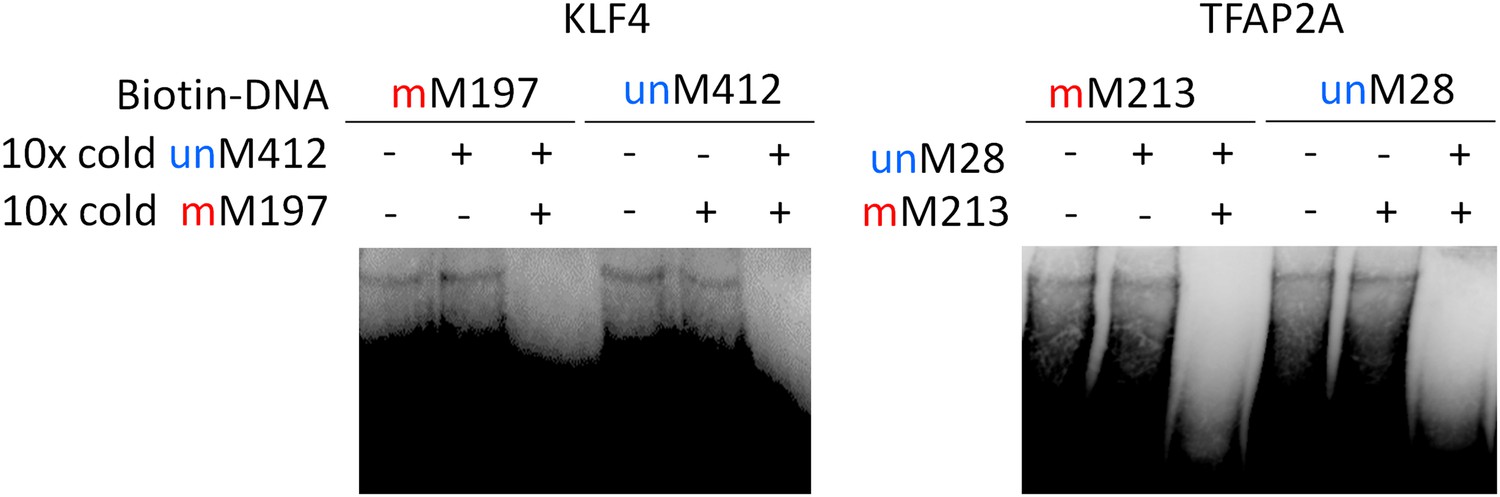
Competition EMSA assays for KLF4 and TFAP2A.
Complex formation between KLF4 and methylated mM197 and between KLF4 and unmethylated umM412 is not affected by either umM412 or mM917, respectively. However, when both methylated and non-methylated competitor DNA was added, the complex formation was abolished.
Figure 2—figure supplement 3

Summary of KLF4’s dual-specificity.
Competition EMSA assays confirm KLF4's binding specificity to methylated motif M197 (mM197) and unmethylated motif M412 (umM412).
Figure 2—figure supplement 4
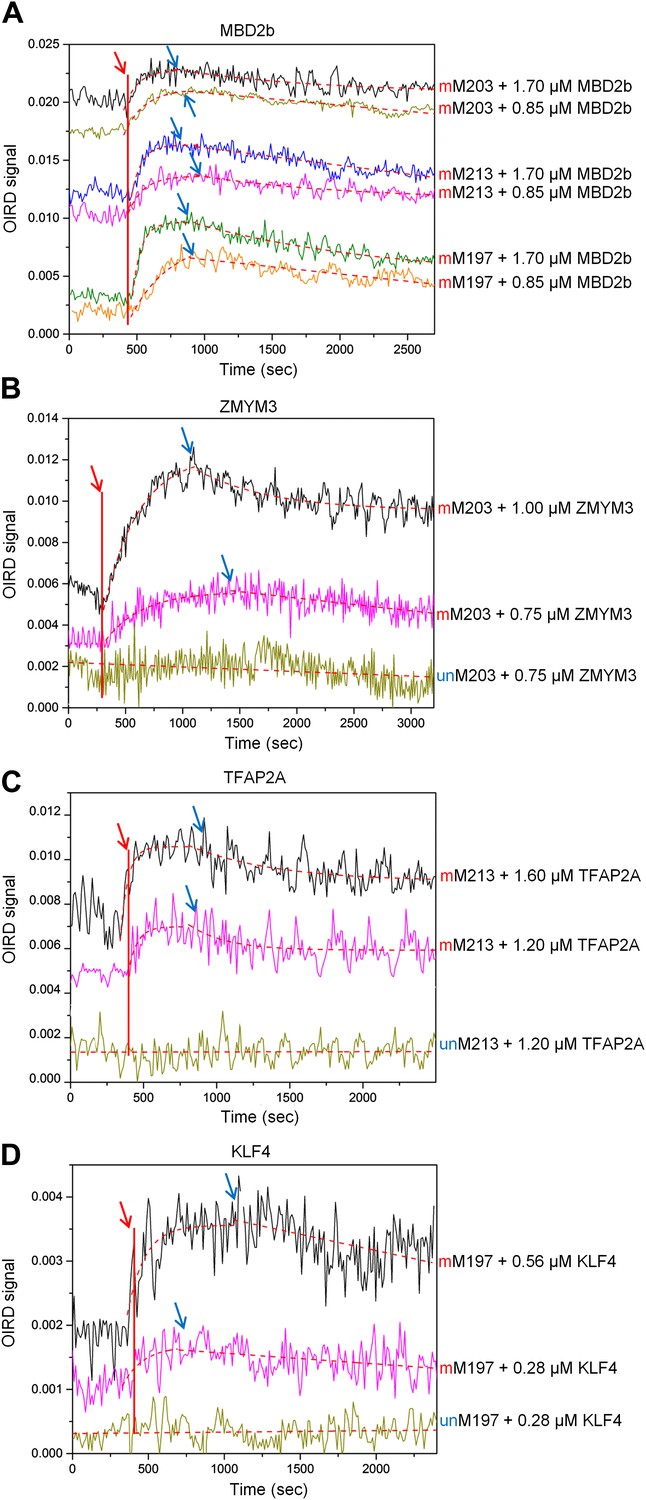
OIRD sensorgrams for three TFs and MBD2b binding to three methylated DNA motifs.
(A) MBD2b with a reported KD value of 330 nM was used as a benchmark in the OIRD system, showing the sensorgrams of MBD2b binding to methylated M203, M213 and M197. (B)–(D) OIRD sensorgrams for ZMYM3, TFAP2A and KLF4 binding to methylated motifs M203, M213 and M197, and their unmethylated counterparts, respectively. The OIRD measurements were performed at two concentrations of each protein. Solid lines represent OIRD signals. Dashed lines are fitted On- and Off-curves. Red arrows indicate the starting point when a TF protein was introduced to the OIRD reaction chamber. Blue arrows indicate the time points when wash buffer was added.
Figure 3 with 4 supplements
KLF4’s mCpG-dependent binding activity is decoupled from its binding activity to unmethylated motifs.
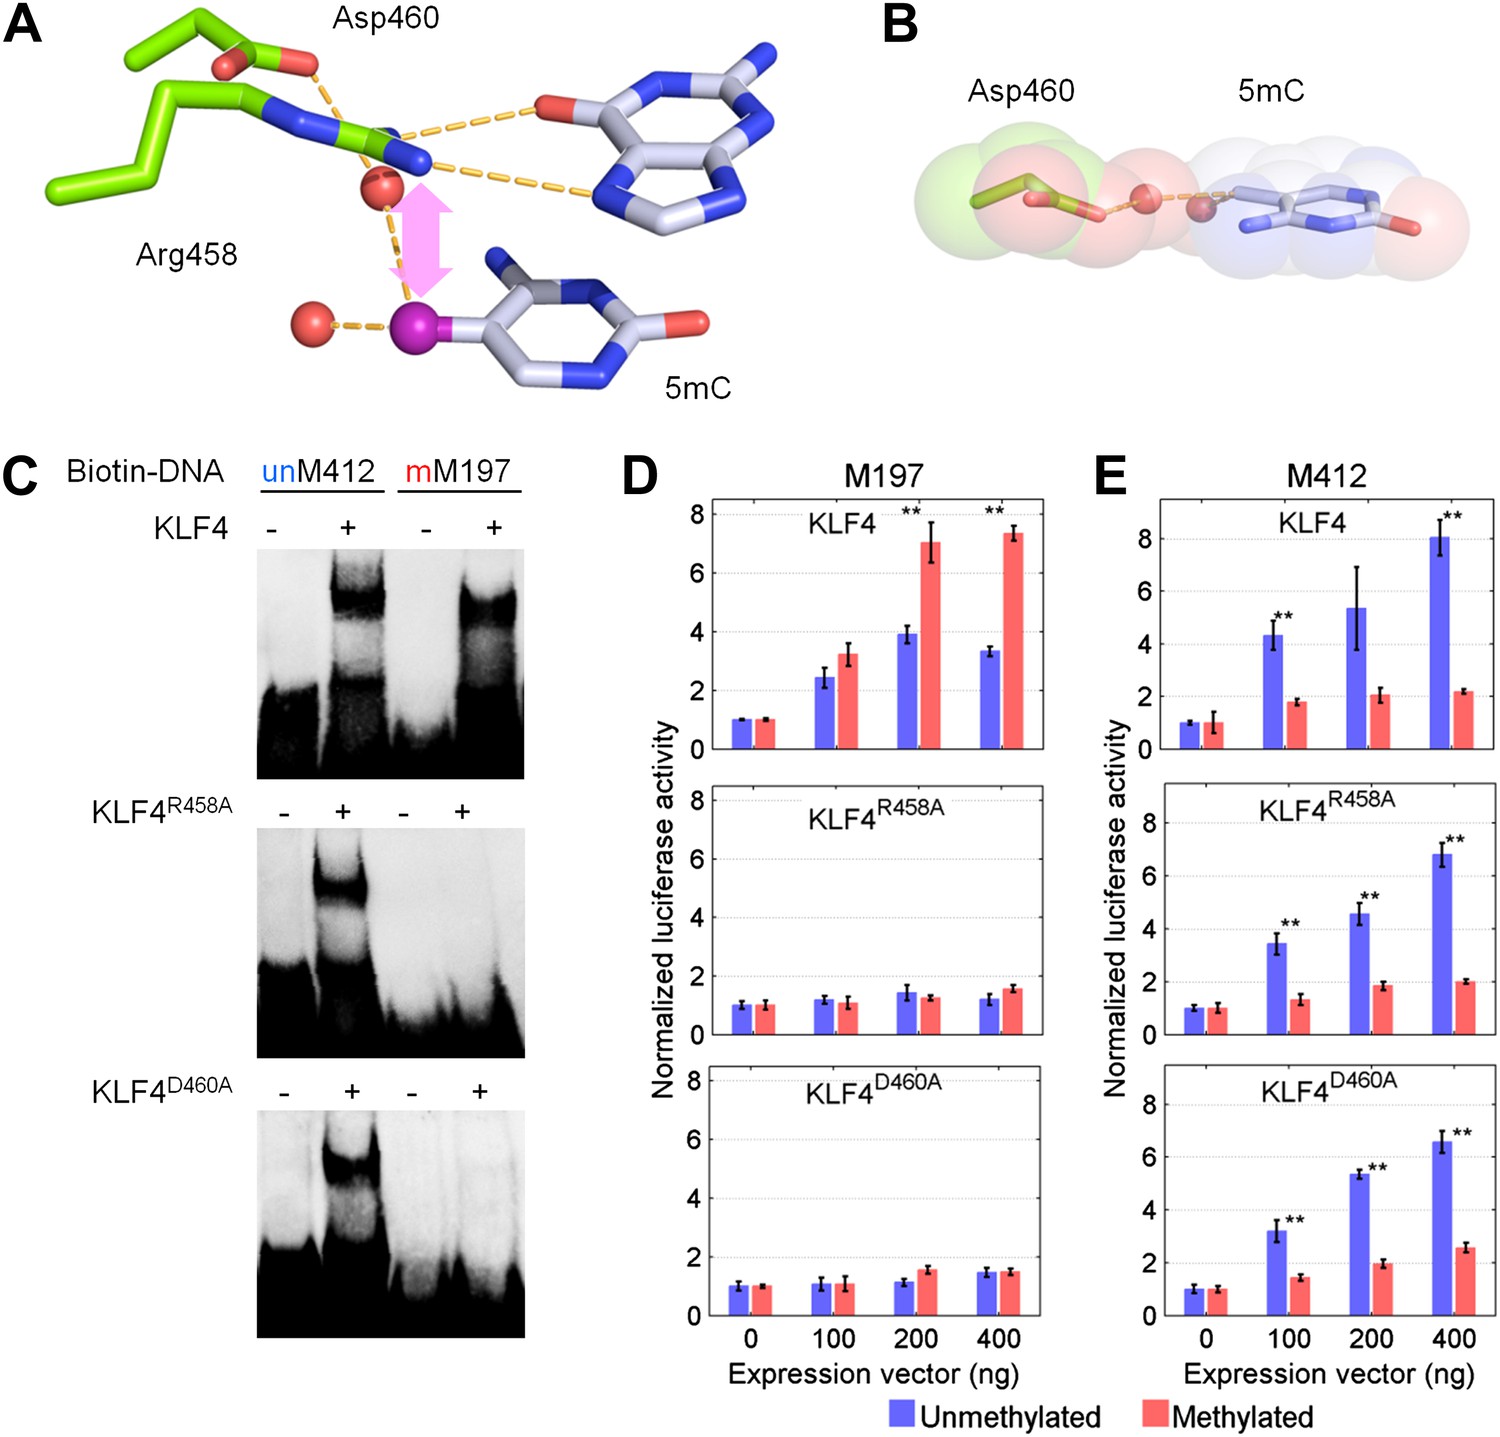
(A) Simulation of KLF4–DNA interactions predicted that two residues, Arg458 and Asp460, are involved in the interactions with methylated cytosine. Double arrow indicates van der Waals interactions between Arg458 and methyl group on the cytosine in one strand (5mCA). Red balls represent water molecules. (B) Asp460 further stabilizes binding to 5 mC on the other strand (5mCB) via a CH•••O (H2O—5mC) H-bond contact. (C) EMSA assays using KLF4 mutated proteins demonstrated that both R458 and D460 are crucial for mCpG-dependent binding activity. Representative images from three independent experiments with similar results are shown. (D) In cell-based luciferase assays for M197, WT KLF4 showed mCpG-dependent activation of downstream gene expression (red bars in the upper panel), while both R458A and D460A mutations abolished this activity (red bars in the middle and lower panels). (E) In cell-based luciferase assays with M412 (blue bars), both WT and mutants can activate the expression of unmethylated M412 (blue bars), but have no effect on methylated M412 (red bars). In (D) and (E), values represent mean ± SD (n = 3; **: p<0.01; t-test)
Figure 3—figure supplement 1

Architecture of KLF4 DNA-binding domain.
KLF4 encodes two and half zinc finger DNA-binding domains at its C-terminus. Residues R458 and D460, which were predicted to interact with the 5-methyl group in the cytosine, are located in the zf-H2C2 domain. D432 indicates where a truncated KLF4 construct ends.
Figure 3—figure supplement 2
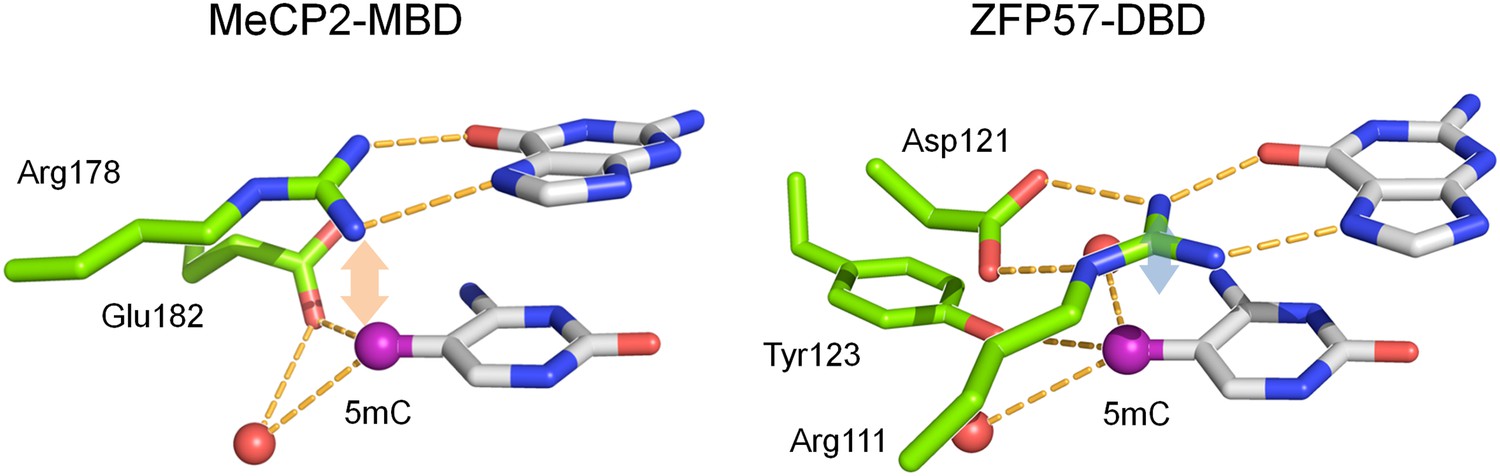
Known crystal structures of MeCP2 and ZFP57 in complex with methylated DNA.
The pink and blue double arrows represent van der Waals force between the arginine and methyl groups. Red balls are water molecules.
Figure 3—figure supplement 3

EMSA assays to evaluate impacts of KLF4 R458K, R458A::D460A mutations, and Δ432 truncation on its binding activity to motifs M412 and M197.
These results clearly demonstrated that both the single- and double-mutations, as well as the truncation, abolished KLF4's ability to form a complex with methylated motif M197, while neither showed detectable impact on complex formation with unmethylated motif M412.
Figure 3—figure supplement 4

Western blot analysis of overexpression of KLF4WT, KLF4R458A and KLF4D460A proteins in GT1-7 cells.
Using GAPDH as a control, these results demonstrated equal transfection efficiency of the constructs.
Figure 4 with 3 supplements

Endogenous KLF4 binds to methylated loci in human embryonic stem cells (H1) in vivo.
(A) Bioinformatics analysis to derive methylated DNA motif logo binding to KLF4 by integrating of KLF4 ChIP-Seq and methylome data in H1 cells. Based on the distribution of methylation level at the KLF4 binding sites, a top methylated consensus motif boxed in red was discovered in the highly methylated sites. As a comparison, M197 sequence recognized by KLF4 in the protein microarray assays is shown below. (B) Experimental procedure of KLF4 ChIP-bisulfite sequencing to confirm that KLF4 preferentially interacts with hyper-methylated motifs in H1 cells. (C) The gel images of KLF4 ChIP’ed loci (L1: chr1: 559311-559516; L2: chr5: 44424678-44424792; L3: chr16: 4681299-4681481; L4: chr2: 132747088-132747377; L5: chr12: 81828301-81828506) demonstrate specific and direct binding of KLF4 to its target regions. Negative controls were performed in the absence of the anti-KLF4 monoclonal antibodies. (D) Analysis of KLF4-ChIP against the five loci using the quantitative real-time PCR (qPCR) method. Fold change at each locus was obtained by taking the ratio of KLF4-ChIP qPCR signals over the negative control signals. Statistics analysis was based on three technical replicates. (E) Sanger bisulfite sequencing reads of input and KLF4-ChIP’ed DNA. Filled and blank circles indicate methylated and unmethylated CpG sites, respectively. Blue and red arrows indicate CpGs in the context of motifs M412 and M917, respectively. (F) For relatively lower methylation input, KLF4 methylated binding sites tend to have a higher methylation level after KLF4 ChIP. The lower panel in (F) shows the methylation differences at each CpG site between the input and KLF4 ChIP’ed DNA. p values were determined by binominal probability density function.
Figure 4—figure supplement 1
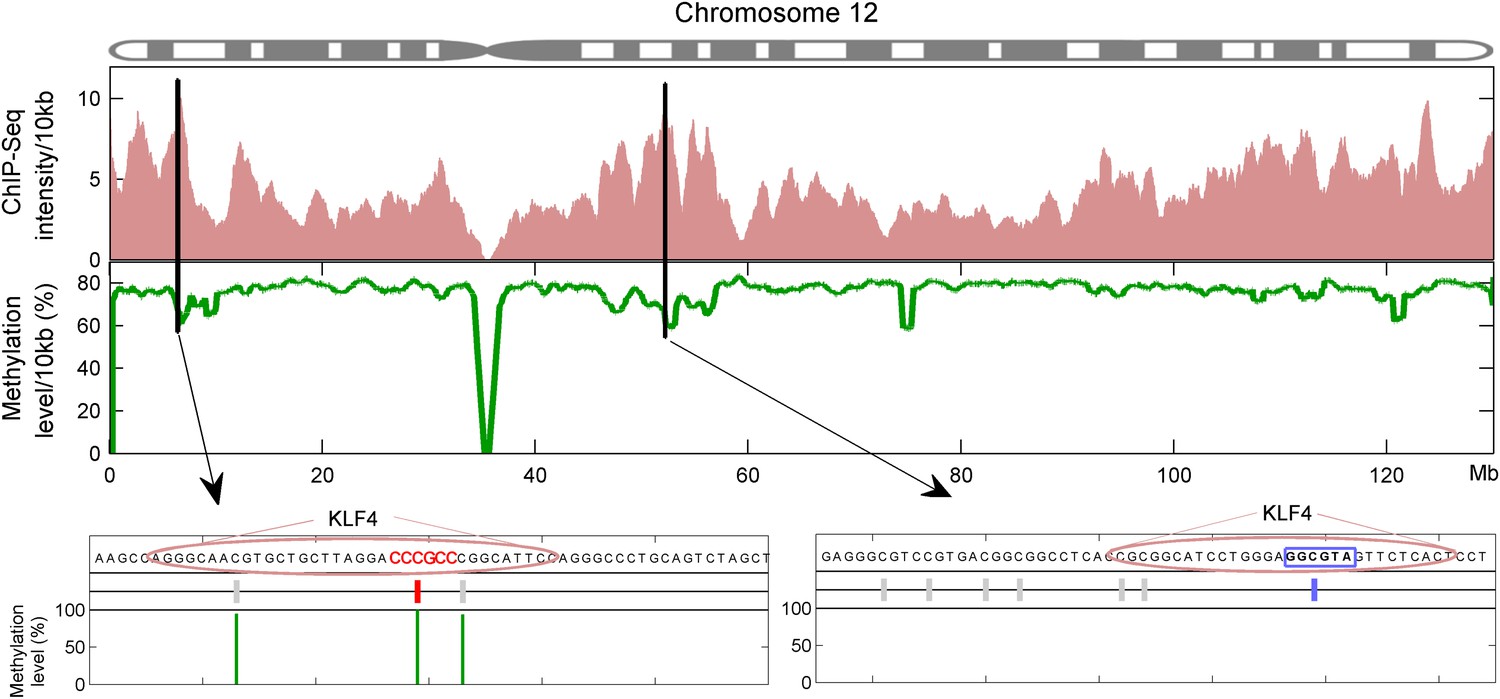
Integration of KLF4 ChIP-seq and methylome data in H1 cell.
KLF4 ChIP-Seq and methylome data in H1 were compiled to assign the methylation levels in KLF4 ChIP'ed segments (upper panel). Lower panel was schematic plot for KLF4 binding summits. The pink ovals indicate KLF4 binding summits as determined in the KLF4 ChIP-seq experiments. The short vertical lines in red and blue indicate the CpG sites in the contexts of motif M197 and M421, respectively. Other CpG sites are annotated with gray lines. The thin green lines underneath represent the observed methylation level.
Figure 4—figure supplement 2
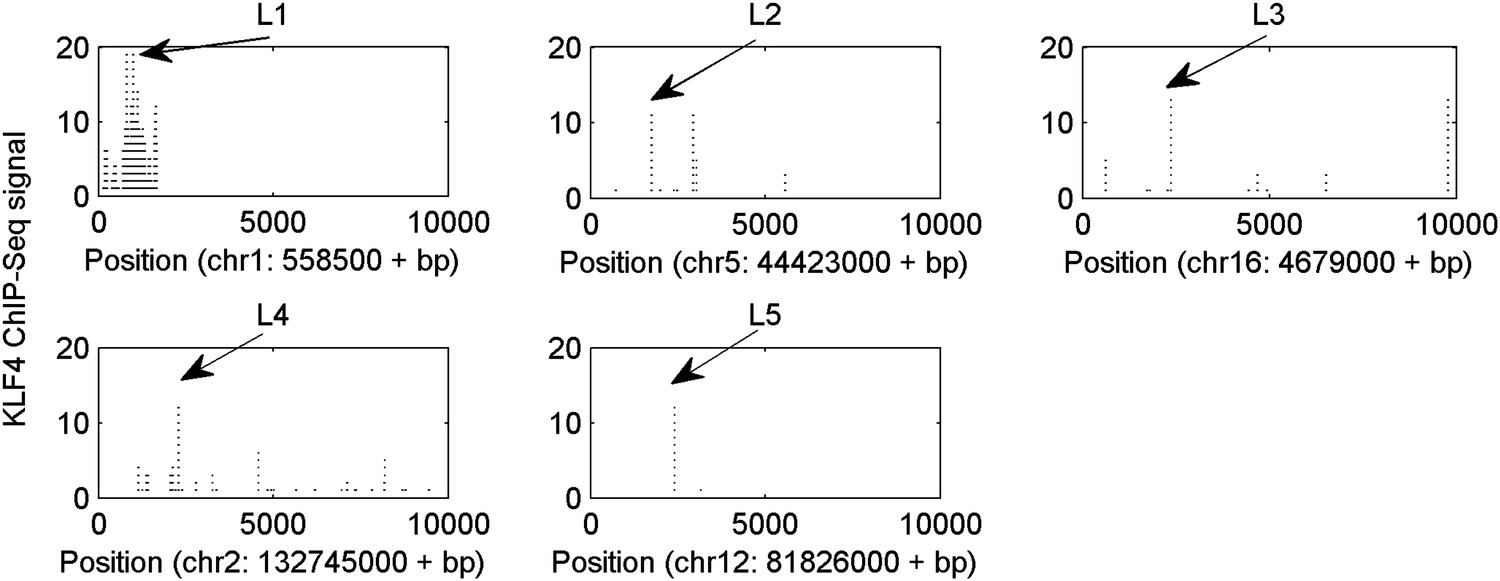
Five selected KLF4-binding loci for further analyses.
The chromosome positions and KLF4 ChIP-seq peaks (GSM447584) are shown.
Figure 4—figure supplement 3
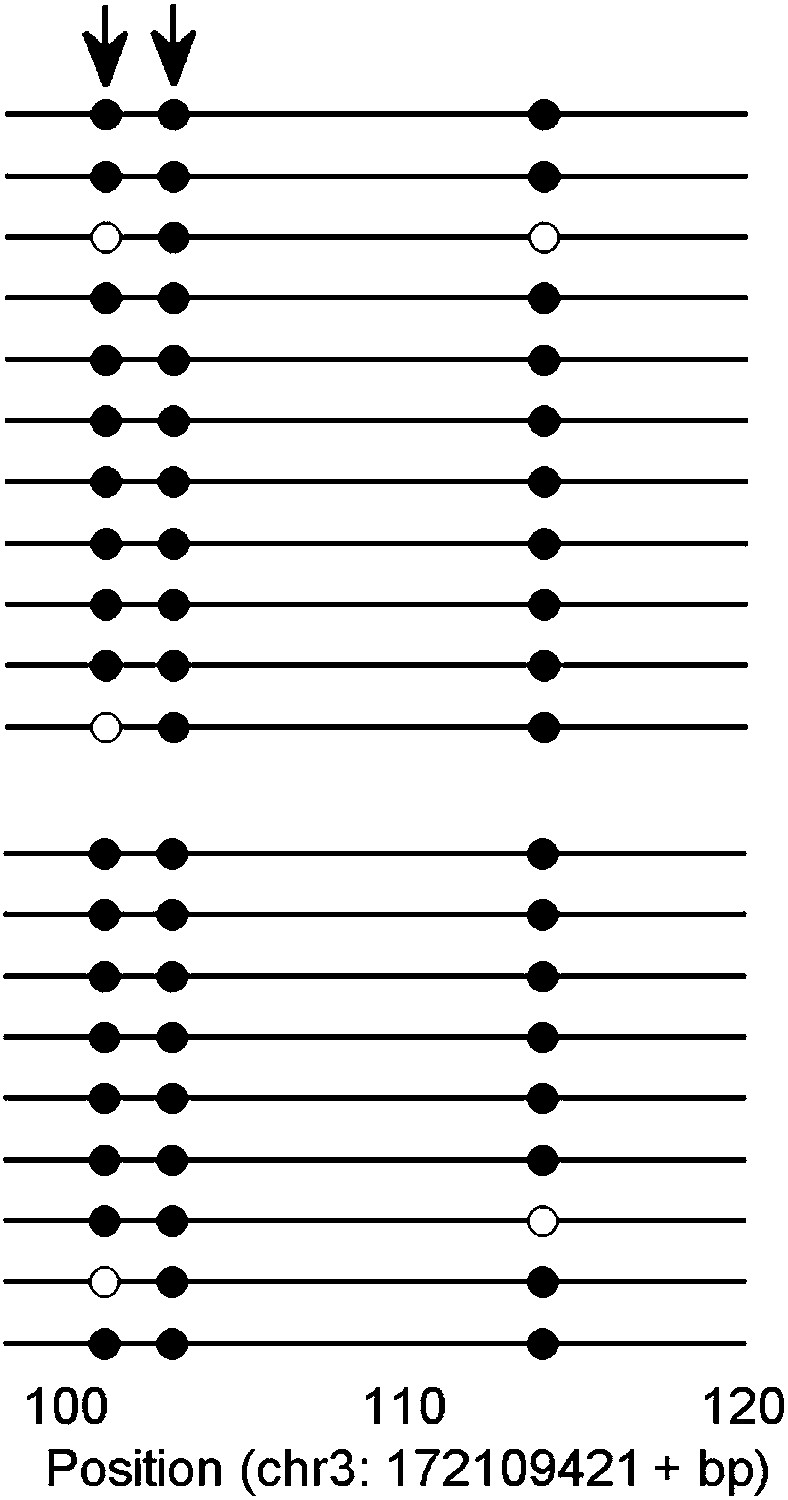
An example of KLF4 ChIP-bisulfite sequencing assay.
The sequencing results confirmed that KLF4 bound to hyper-methylated loci in the sequence context of CCmCGCC (arrows) in H1 cell. Upper and lower panels represent bisulfite sequencing results of the input and KLF4 ChIP'ed loci.
Additional files
-
Supplementary file 1
(A) 154 CpG-containing motifs tested on our protein microarray. (B) List of transcription factors and cofactors available on our protein microarray. (C) Transcription factors and cofactors binding to methylated DNA motif(s). (D) KLF4 binding methylated 6-mers with CpG at the center position obtained by integrating KLF4 ChIP-Seq and methylome data in human H1 cell. (E) Information of loci (L1–L5) tested in Figure 4C–F: genome locations (hg18), sequences, ChIP PCR and bisulfite-sequencing primers.
- https://doi.org/10.7554/eLife.00726.026
Download links
A two-part list of links to download the article, or parts of the article, in various formats.
Downloads (link to download the article as PDF)
Open citations (links to open the citations from this article in various online reference manager services)
Cite this article (links to download the citations from this article in formats compatible with various reference manager tools)
DNA methylation presents distinct binding sites for human transcription factors
eLife 2:e00726.
https://doi.org/10.7554/eLife.00726


