Fungal effector Ecp6 outcompetes host immune receptor for chitin binding through intrachain LysM dimerization
- Universidad Politécnica de Madrid, Spain
- Wageningen University, Netherlands
- University of Lübeck, Germany
- Centre for BioSystems Genomics, Netherlands
Figures
Figure 1
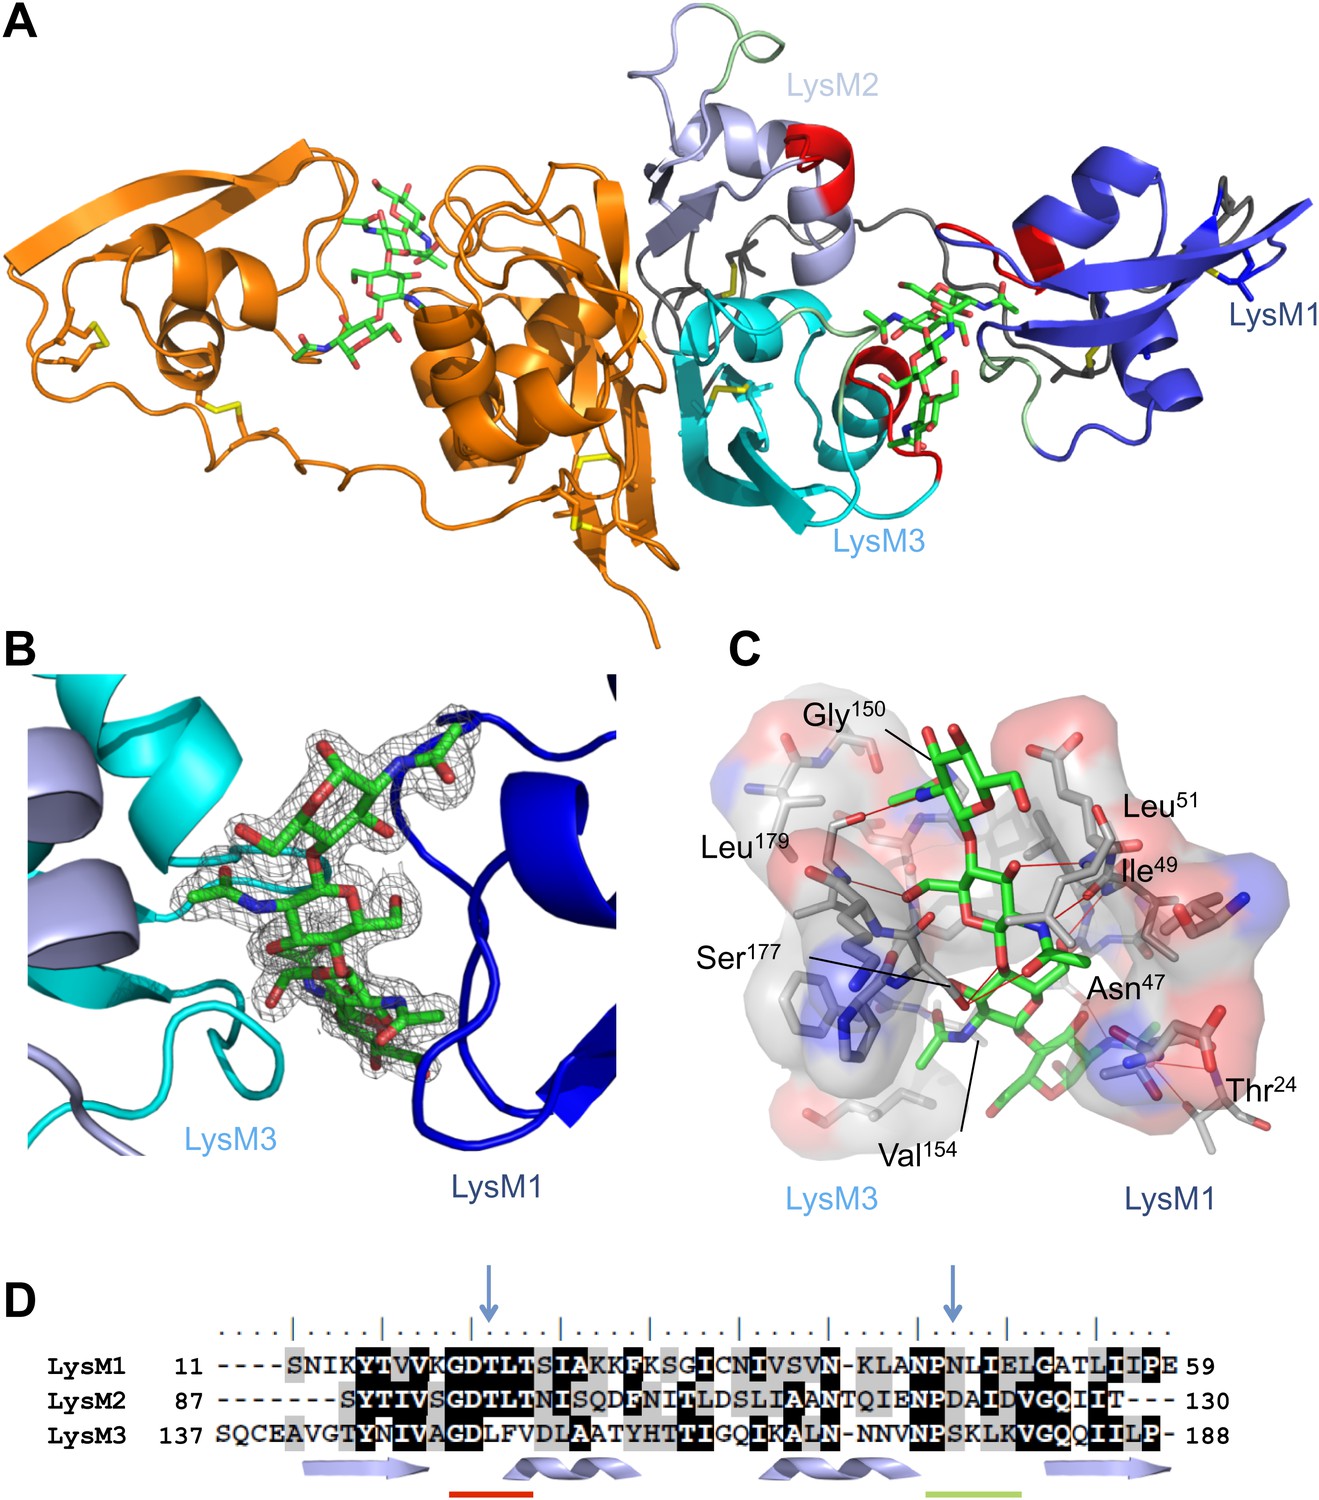
Overall crystal structure of the Cladosporium fulvum LysM effector Ecp6.
(A) Crystal structure model of an Ecp6 dimer in which the left monomer is colored orange and the three LysMs of the right monomer are indicated in three shades of blue with the flexible loop between LysM1 and LysM2 in gray. The chitin tetramer (green sticks) and four disulfide bridges (yellow sticks) are indicated. Furthermore, in the right monomer, the two (putative) chitin-binding loops are shown in red and green for each of the LysMs. (B) Omit map (2Fo−Fc; contoured at 1σ above the mean) with phases calculated omitting (GlcNAc)4. LysMs are colored in three shades of blue as in panel A. (C) Interactions between Ecp6 and (GlcNAc)4. Hydrogen bonds are indicated in red, and atoms involved in hydrophobic contacts are represented with transparent surface. Only residues forming H-bonds with the chitin are labeled. (D) Clustal-W alignment of the three LysM domains of Ecp6. The distribution of the α-helices (helices) and β-sheets (arrows) are shown. The two chitin-binding sites in LysM1 and LysM3 are indicated with a red line for the first loop between the first β-sheet and the first α-helix and a green line for the second loop between the second α-helix and the second β-sheet, as indicated in the right monomer in panel A. Blue arrows point towards residues targeted for mutagenesis in the three LysM domains.
Figure 2
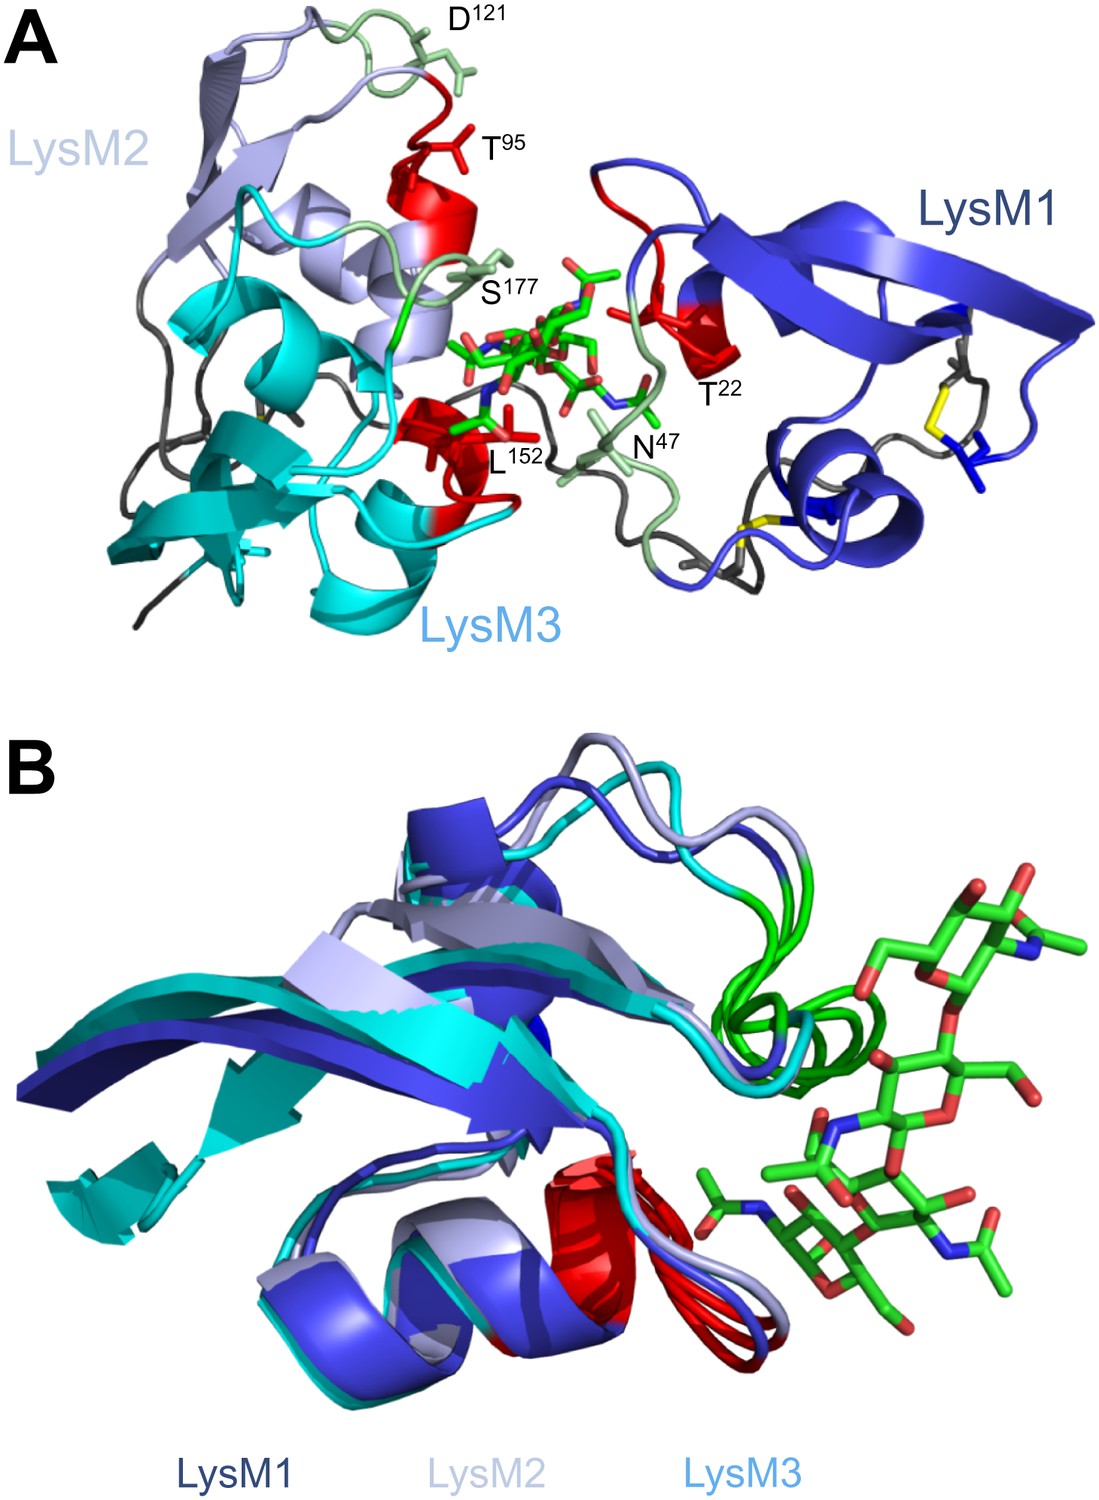
Structural and mutational analysis of chitin binding.
(A) Ecp6 monomer in which the residues targeted for mutagenesis are labeled and represented using sticks. The chitin oligomer is in green sticks. (B) Structural alignment of the three Ecp6 LysM domains. Each of the LysMs are colored in three shades of blue and the chitin tetramer is in green sticks. The two chitin-binding loops are shown in red and green for each of the LysMs, as indicated in Figure 1A.
Figure 3
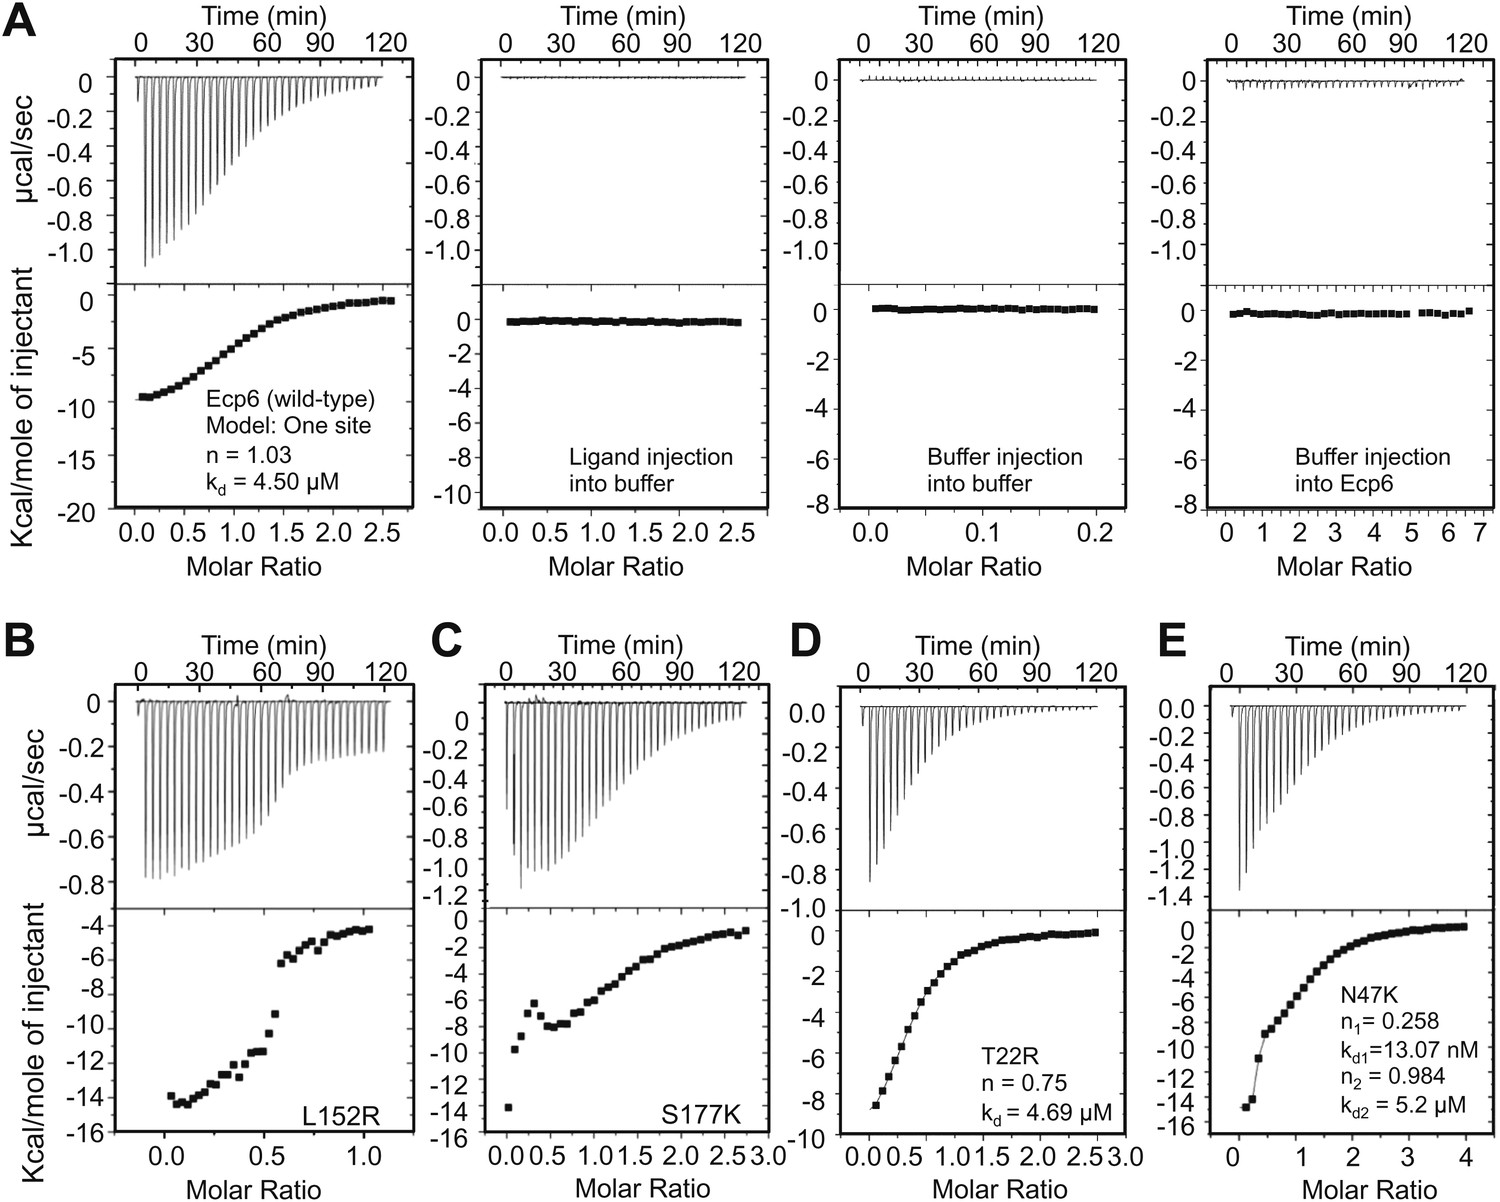
Mutants in LysM1 and LysM3 chitin-binding site still bind chitin.
Raw data (upper panels) and integrated heat measurements (lower panels) from isothermal titration calorimetry of (GlcNAc)6 binding to Ecp6 produced in P. pastoris (A) and mutants in LysM3 (B and C) and in LysM1 (D and E). Lines in the lower panel represent best-fit curves for one binding site model. ITC control experiments involving chitin ligand into the buffer (PBS), of buffer injection into the buffer, and buffer injection into Ecp6 protein solution are included in panel A.
Figure 4
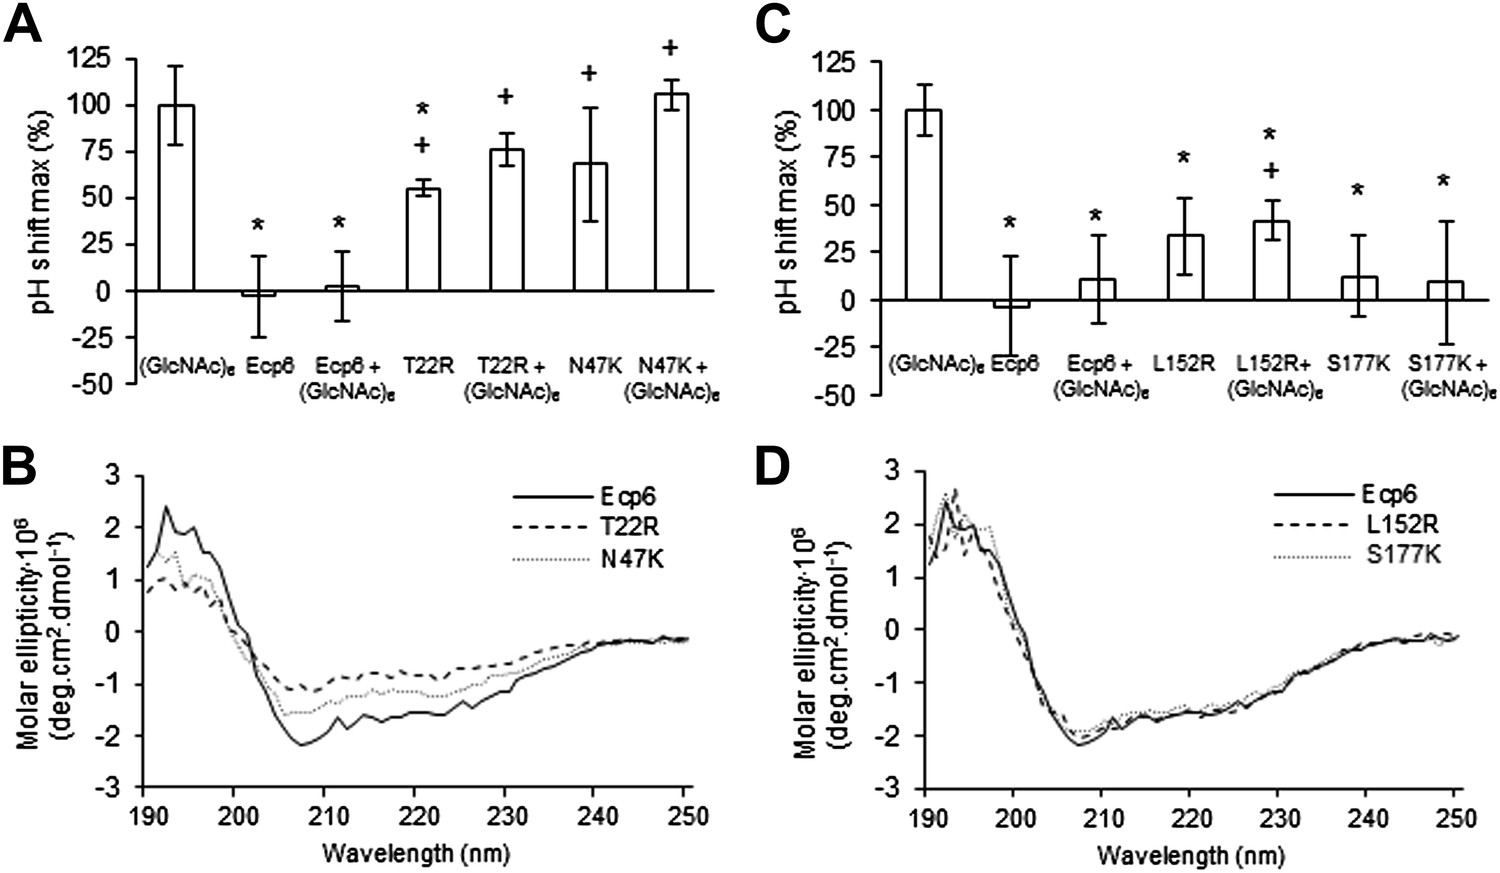
Analysis of the capacity to prevent chitin recognition by Ecp6 mutants on the chitin-binding site of LysM1 (A–B) or LysM3 (C–D).
(A and C) The maximum pH shift determined on treatment with 10 nM (GlcNAc)6 and 100 nM wild-type or mutants in LysM1 (A) and LysM3 (B) after normalization to treatment with (GlcNAc)6 in the absence of Ecp6 protein is represented. Bars present averages of at least two replications with standard deviations. Significant differences with (GlcNAc)6 treatment are indicated with asterisks and significant differences with Ecp6 treatment are indicated with plusses (t-test p≤0.05). (B and D) Circular dichroism spectra of the mutants in LysM1 (B) and LysM3 (D) at 10 µM.
Figure 5

LysM2 mutants are impaired in chitin scavenging.
(A) Prevention of chitin-triggered medium alkalinization in the tomato cell suspension assay by Ecp6 mutants. The maximum pH shift determined on treatment with 10 nM (GlcNAc)6 and 100 nM Ecp6 or the mutants on LysM2 (T95R and D121K) after normalization to treatment with (GlcNAc)6 in the absence of Ecp6 is represented. Bars present averages of three replicates with standard deviations. Significant differences with (GlcNAc)6 treatment are indicated with asterisks, and significant differences with Ecp6 treatment are indicated with plusses (t-test p≤0.05). (B) Circular dichroism spectra of the mutants on LysM2 at 10 µM. (C) T95R and (D) D121K mutants on LysM2 are impaired in chitin binding. Raw data (upper panels) and integrated heat measurements (lower panels) from isothermal titration calorimetry of (GlcNAc)6 binding to T95R and D121K mutants produced in P. pastoris.
Figure 6

Prevention of chitin-triggered medium alkalinization in the tomato cell suspension assay by Ecp6 and T95R produced in HEK293 cells.
The maximum pH shift determined on treatment with 10 nM (GlcNAc)6 and 100 nM Ecp6 or T95R mutant after normalization to treatment with (GlcNAc)6 in the absence of Ecp6 is represented. Bars present averages of three replicates with standard deviations. Significant differences with (GlcNAc)6 treatment are indicated with asterisks, and significant differences with Ecp6 treatment are indicated with plusses (t-test p≤0.05).
Figure 7
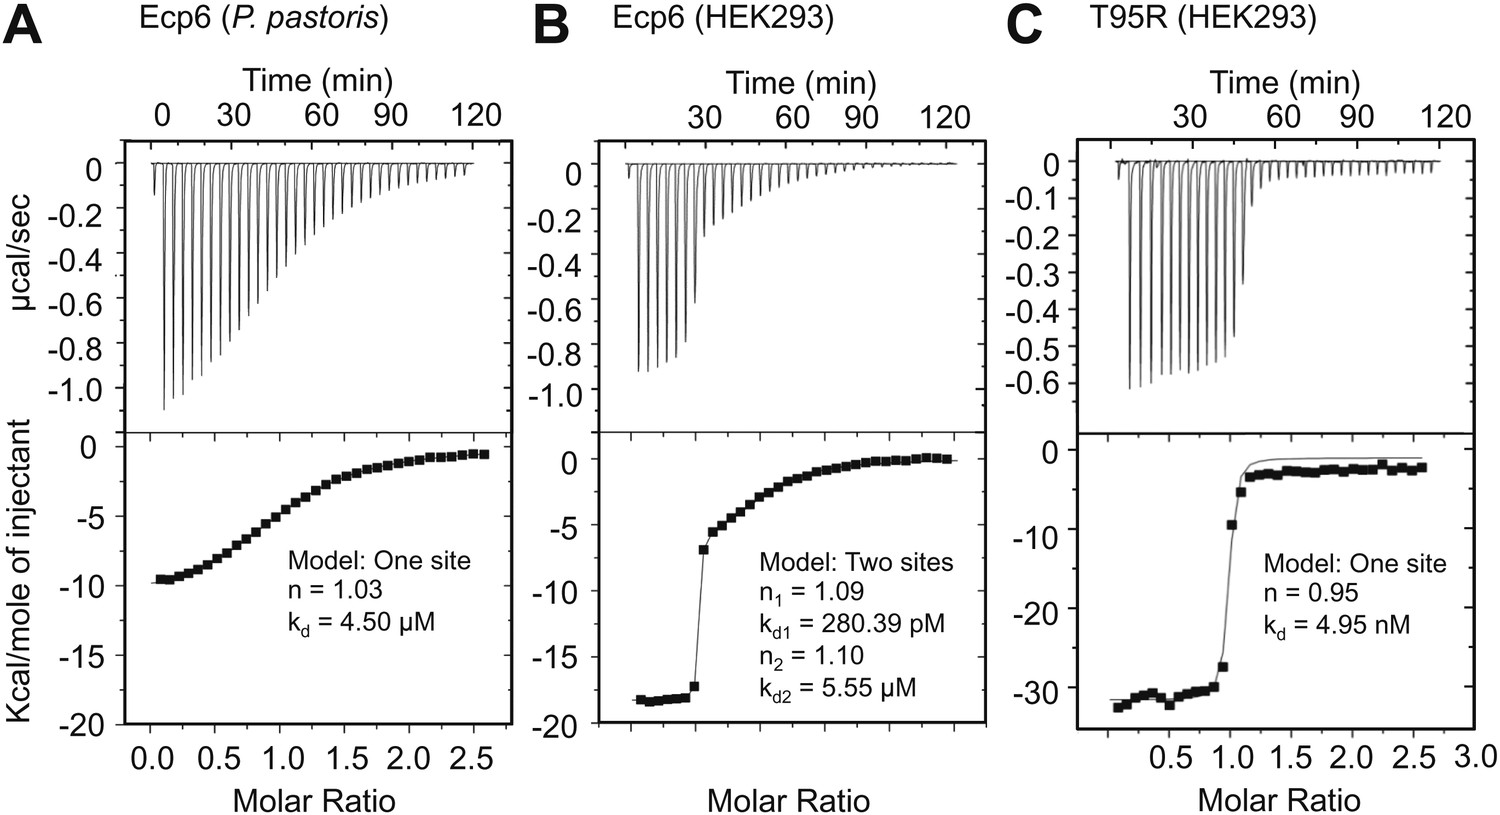
Ultra-high affinity chitin binding by intrachain LysM dimerization in Ecp6.
Raw data (upper panels) and integrated heat measurements (lower panels) from isothermal titration calorimetry of (GlcNAc)6 binding to Ecp6 produced in P. pastoris (A) and in HEK293 (B) and T95R mutant produced in HEK293 (C). Lines in the lower panel represent best-fit curves for one (P. pastoris-produced T95R) or two (HEK293-produced) binding site model.
Figure 8
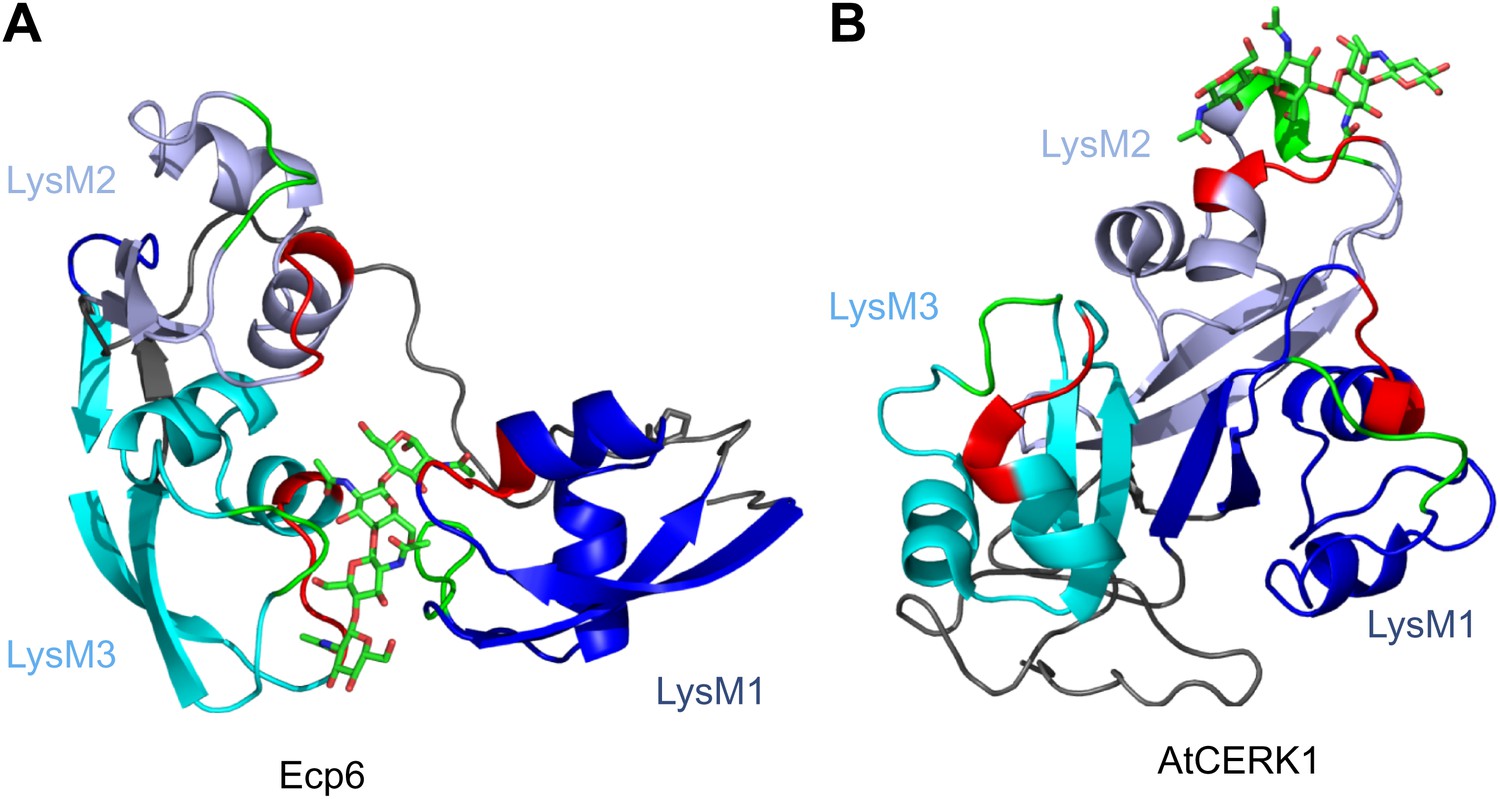
Spatial distribution of the LysM domains in the Arabidopsis thaliana chitin-binding immune receptor AtCERK1.
In contrast to Ecp6 (A), the global arrangement of the LysMs (colored in three shades of blue and with chitin-binding loops in red and green) in the AtCERK1 ectodomain does not allow the formation of an intrachain LysM dimer (B). Only one of the three LysMs is reported to bind a chitin oligomer (Liu et al., 2012).
Tables
Table 1
Data collection and refinement statistics
| Native | SAD | |
|---|---|---|
| Data collection statistics | ||
| Beamline | BL14.1 - BESSY | ID29 - ESRF |
| Wavelength (Å) | 0.91814 | 1.70 |
| Space group | P 32 2 1 | |
| Cell dimensions a, b, c (Å) | 57.5, 57.5, 118.7 | 57.9, 57.9, 119.7 |
| Resolution (Å) | 49.80–1.59 (1.68–1.59) | 46.24–2.10 (2.21–2.1) |
| Rsym* (%) | 5.1 (44.9) | 6.7 (40.9) |
| I/σI† | 20.6 (4.4) | 24.2 (2.9) |
| Completeness (%) | 98.4 (94.1) | 97.7 (85.9) |
| Redundancy | 9.2 (8.2) | 15.4 (5.6) |
| Phasing statistics (2.5 Å resolution cut-off) | ||
| Anomalous completeness (%) | – | 96.9 (81.2) |
| Anomalous multiplicity | – | 8.3 (3.0) |
| Figure of Merit (FOM) | – | 0.372 |
| Map Skew | – | 0.14 |
| Correlation of local R.m.s. density | – | 0.82 |
| Correlation Coefficient (CC) | – | 0.76 |
| Refinement statistics | ||
| Resolution (Å) | 49.8–1.6 | 31.0–2.10 |
| No. of reflections (work/free) | 29,078/1546 | 13,072/689 |
| Rwork/Rfree‡ (%) | 20.3 (24.0)/22.5 (27.1) | 21.0 (23.3)/26.6 (34.2) |
| No. of atoms/average B-factor | ||
| Protein | 1392/17.6 | 1387/34.33 |
| Water | 119/37.5 | 53/44.61 |
| Other | 99/24.3 | 115/39.90 |
| R.m.s. deviations bond lengths (Å) | 0.016 | 0.018 |
| R.m.s. deviations bond angles (°) | 1.81 | 1.94 |
| Ramachandran plot (% preferred region/% allowed region) | 96.74/3.26 | 95.72/4.28 |
-
The values in the parentheses refer to the highest resolution shell.
-
*
Rsym = (∑│Ihkl−<Ihkl>│)/(∑ Ihkl), where the average intensity <Ihkl> is taken over all symmetry equivalent measurements and Ihkl is the measured intensity for any given reflection.
-
†
I/σI is the mean reflection intensity divided by the estimated error.
-
‡
Rwork = ││Fo│−│Fc││/│Fo│, where Fo and Fc are the observed and calculated structure factor amplitudes, respectively. Rfree is equivalent to Rwork but calculated for 5% of the reflections chosen at random and omitted from the refinement process.
Download links
A two-part list of links to download the article, or parts of the article, in various formats.
Downloads (link to download the article as PDF)
Open citations (links to open the citations from this article in various online reference manager services)
Cite this article (links to download the citations from this article in formats compatible with various reference manager tools)
Fungal effector Ecp6 outcompetes host immune receptor for chitin binding through intrachain LysM dimerization
eLife 2:e00790.
https://doi.org/10.7554/eLife.00790


