PI3K/Akt1 signalling specifies foregut precursors by generating regionalized extra-cellular matrix
- University of Edinburgh, United Kingdom
- University of Copenhagen, Denmark
- Sloan-Kettering Institute, United States
- Jefferson Medical College, United States
Figures
Figure 1 with 2 supplements
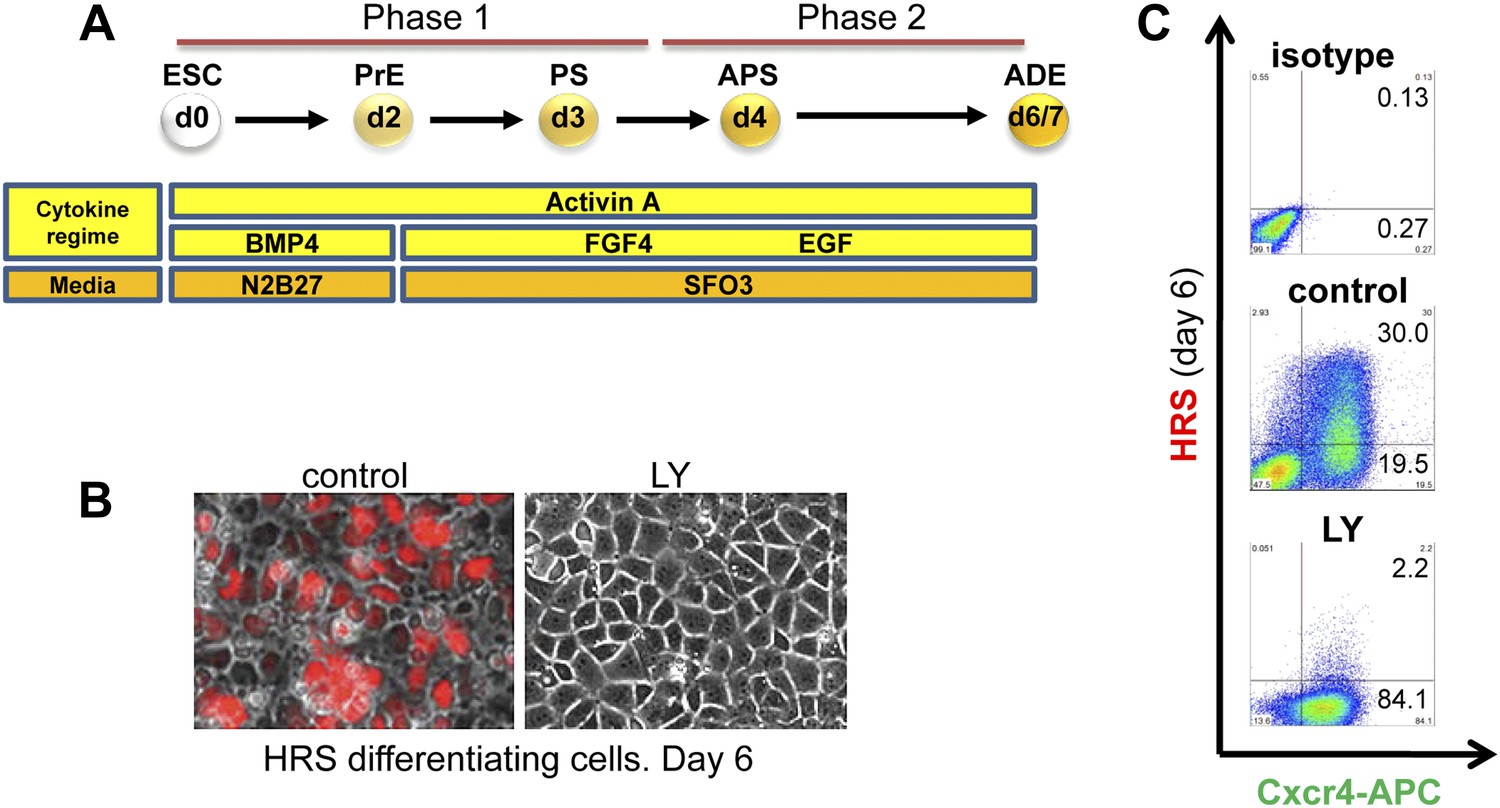
Inhibition of PI3K signalling disrupts Hhex positive ADE specification, but does not interfere with mesendoderm induction.
(A) Schematic representation of ESC differentiation towards ADE. PrE: primitive ectoderm, PS: primitive streak, APS: anterior primitive streak, ADE: anterior definitive endoderm. (B) Fluorescence and brightfield images of HRS ADE cultures generated in the absence or presence of LY. LY was present throughout phase 2. (C) ADE (H+C+), but not Cxcr4+ mesendoderm (H−C+) was impaired by LY treatment. Gates were set using parental E14 Tg2A (E14) cells without fluorescent reporters. Hereinafter, LY treatment refers 10 μM at d3.5 and 20 μM at d4.5 onwards. For some of the experiments described in this paper the base media SFO3 was substituted by ADEM with identical results.
Figure 1—figure supplement 1
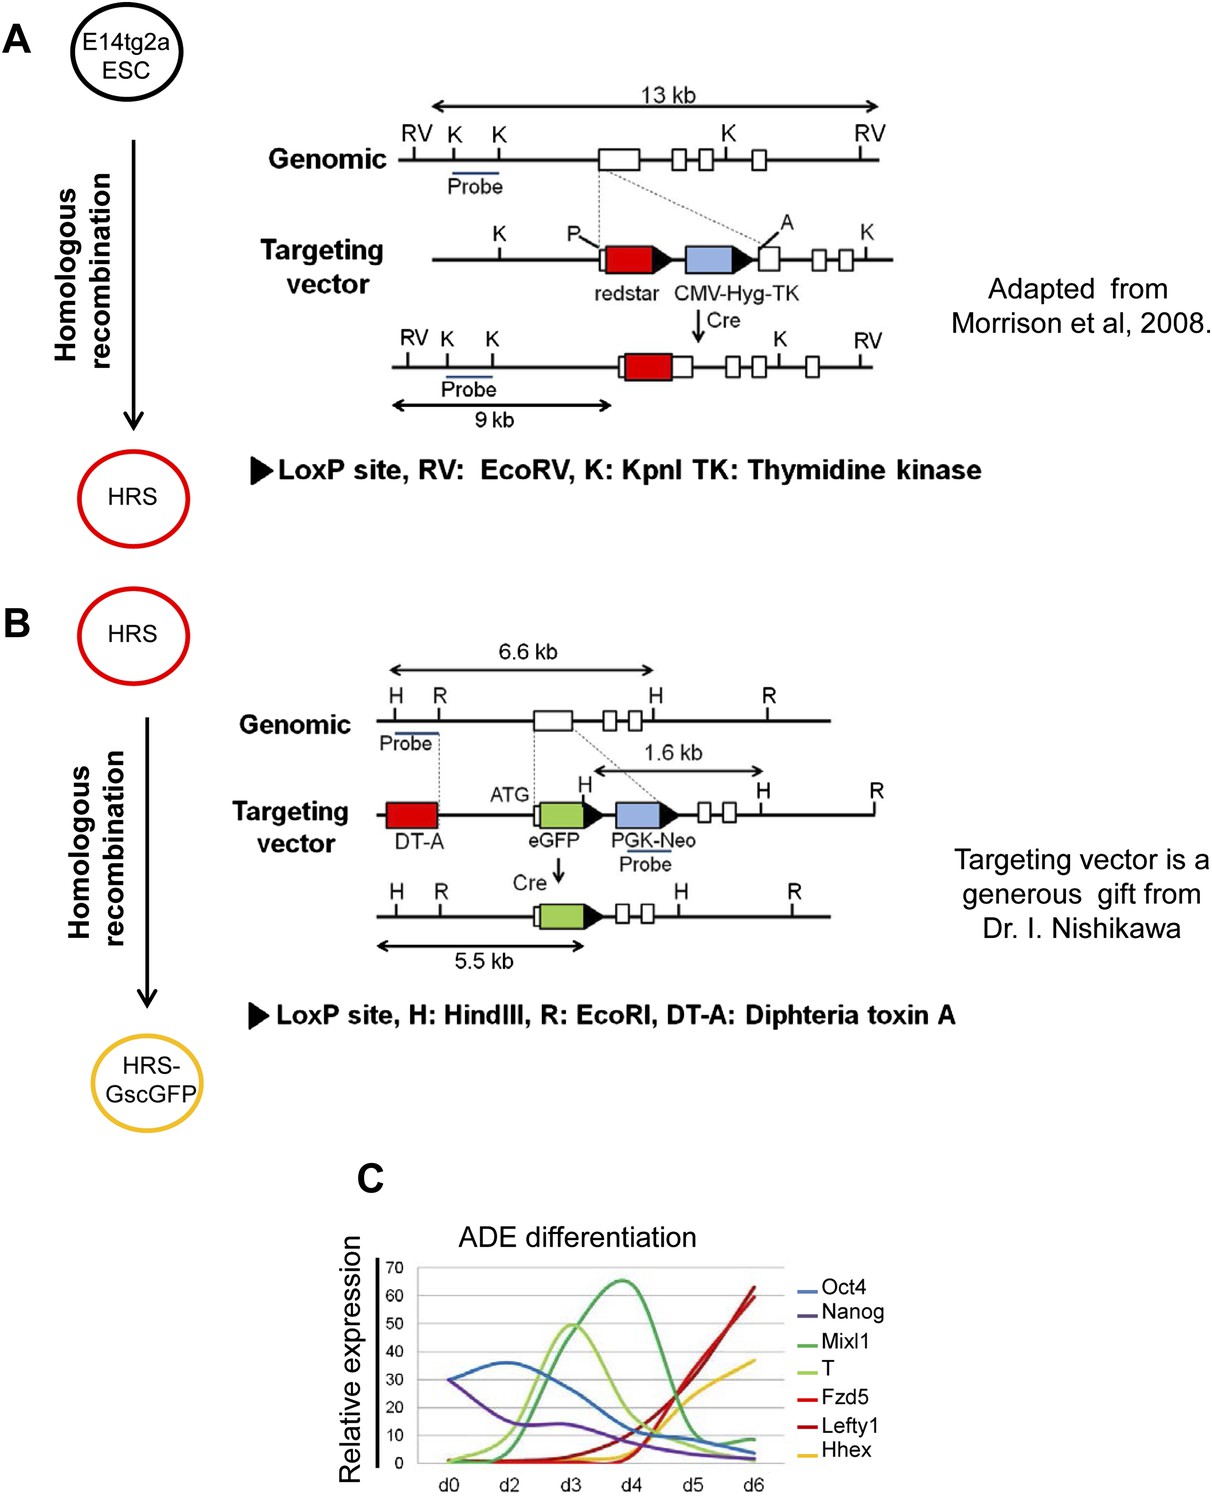
A model for monitoring endoderm specification from ESCs.
(A and B) Schematic showing the strategy used in the construction of the HRS/Gsc-GFP dual reporter cell line. (A) is adapted from Figure 1 in Morrison et al., 2008. (C) Response of key lineage markers by q-RT-PCR in our defined culture system confirms that ADE differentiation in vitro recapitulates the in vivo developmental program of gene expression. The expression of the pluripotency markers Oct4 and Nanog decreased as differentiation proceeded. Mesendoderm markers T and Mixl1 peaked between phase 1 and 2 of differentiation and their expression was down-regulated as markers of anterior endoderm (ADE), Hhex, Lefty1 and Fzd5 were up-regulated. Transcript levels were normalised to the Tbp value obtained for each sample. Normalised values are related to the level obtained for ESC.
Figure 1—figure supplement 2
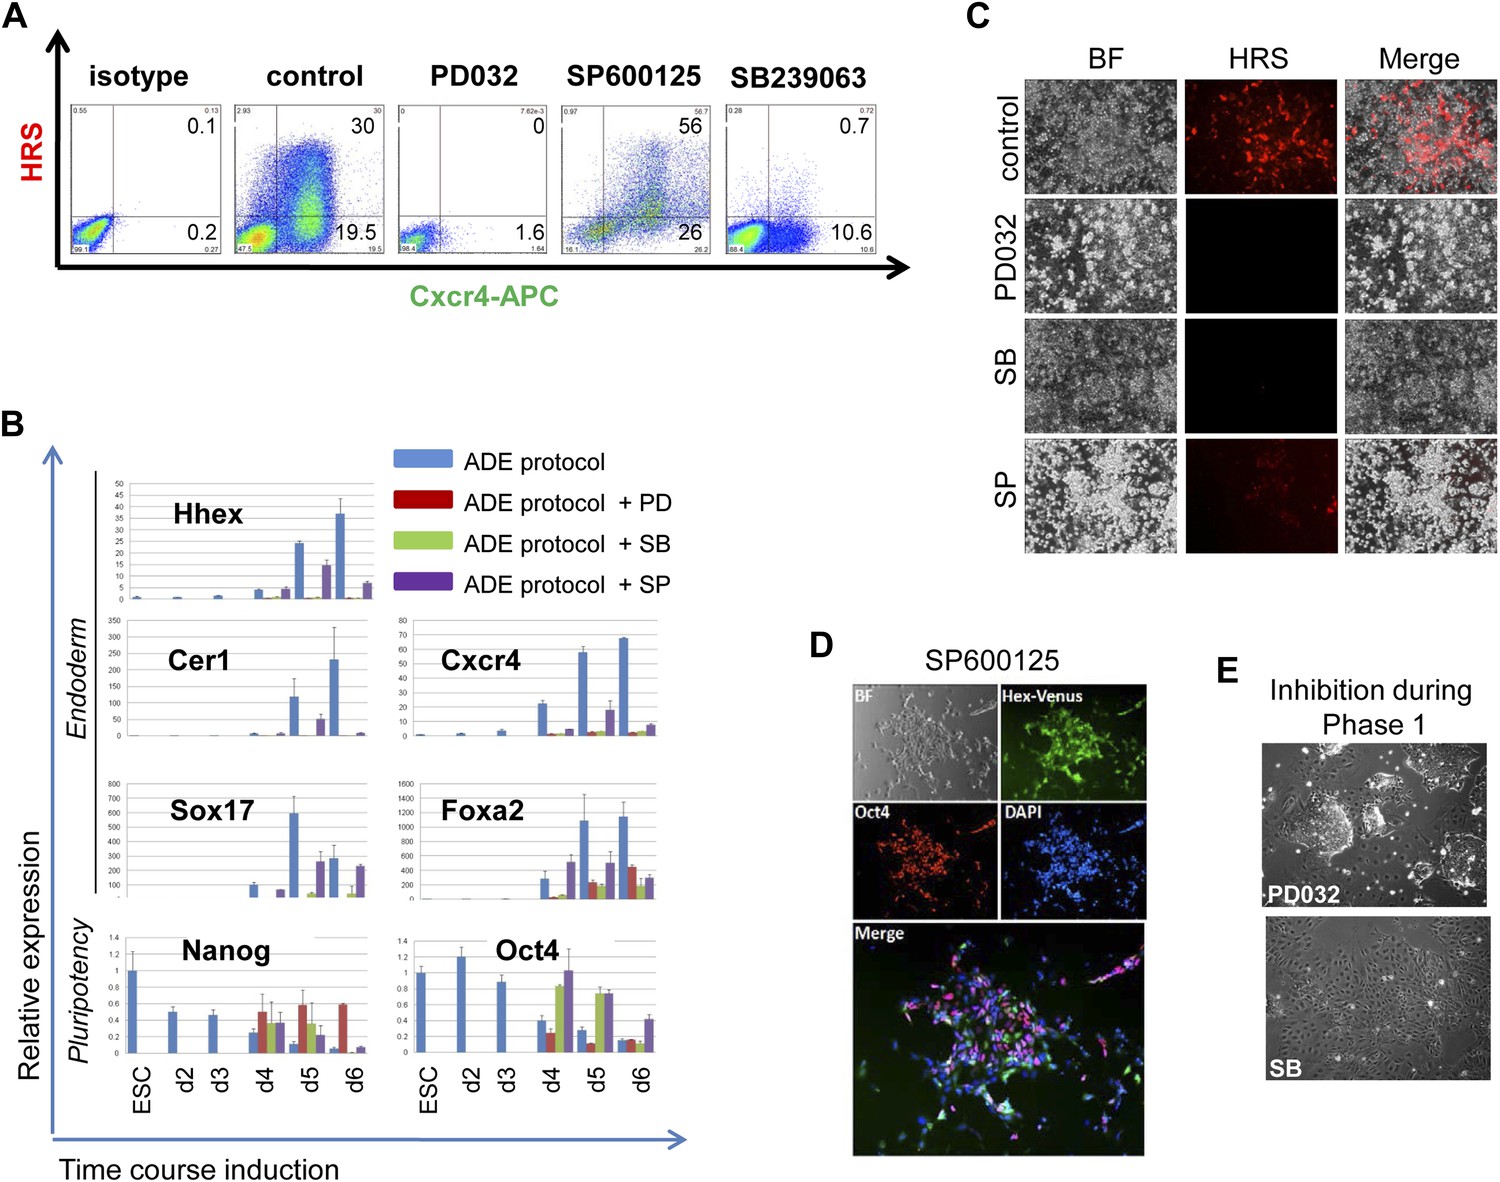
MAPK kinase signalling is required for endoderm induction.
(A) Flow cytometry on differentiating HRS/Gsc-GFP cells showing the effect of specific MAPK inhibitors on both mesendoderm differentiation and ADE emergence (d6). Inhibitors were added during phase 2 of differentiation. (B) Q-RT-PCR showing the response of mesoderm and endoderm markers to MAPK signalling inhibition in endoderm differentiation. Transcript levels were normalised to the Tbp value obtained for each sample. Normalised values are related to the level obtained for ESC. (C) Fluorescence microscopy on differentiating HRS cells (d6) showing a failure in ADE specification in the presence of MAPK inhibitors. (D) Morphology and gene expression in response to inhibition of p38 with the SP inhibitor. Hhex-IRES-Venus differentiating cells, reporting low levels of Hhex (Canham et al., 2010), showed broad Hhex/Venus expression when cultures were exposed to SP during ADE differentiation. Cell morphology was different from that observed in normal conditions and cells also co-expressed the pluripotency marker Oct4. (E) A blockade to ERK and p38 MAPK signalling during the phase 1 of differentiation disrupted the formation of mesendodermal intermediates. Treatment with PD03 led to the generation of tightly packed ESC-like colonies surrounded by large flat cells, whereas SB treatment produced highly homogeneous non-mesendodermal cells.
Figure 2 with 1 supplement
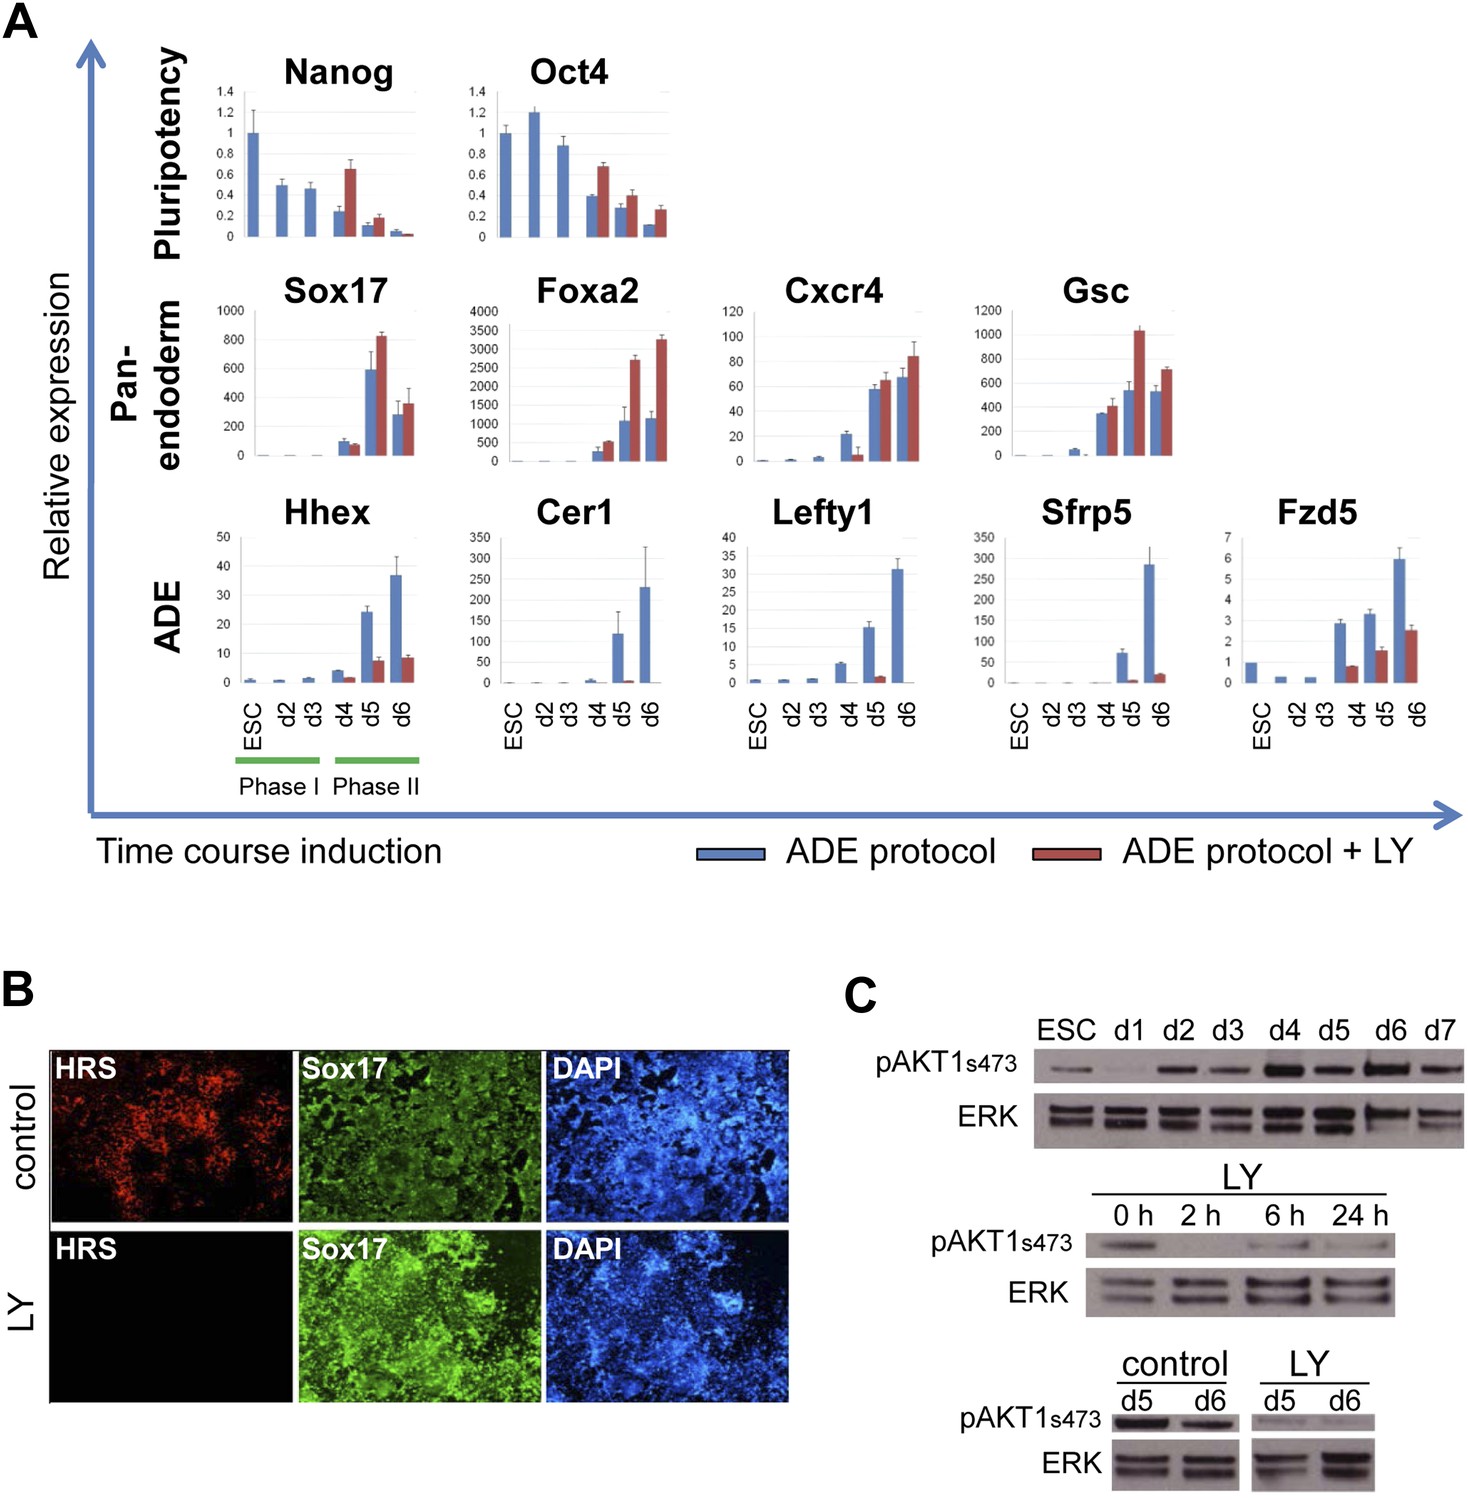
Inhibition of PI3K signalling inhibits ADE but not DE differentiation.
(A) Differential regulation of ADE, pan-endoderm and pluripotency markers as a result of LY treatment. Q-RT-PCR showing relative gene expression for ESC, endodermal and ADE markers in ESC differentiation towards endoderm. Transcript levels were normalised to the Tbp value obtained for each sample. Normalised values are shown relative to ESC expression level. ESCs were differentiated to ADE using the protocol described in Figure 1 in the presence or absence of LY. (B) Treatment with LY impaired HRS but not Sox17 expression. Fluorescence images showing HRS expression and Sox17 antibody staining at day 6 of differentiation. (C) Phosphorylation of Akt1 in ESC differentiation. Western blot showing phosphorylation of Akt1 during a time course for endoderm differentiation toward ADE (upper panel) and its dephosphorylation after the addition of 20 µM LY at different time points (middle panel, h; hours, top and bottom panel, d; days). Total ERK was used as loading control.
Figure 2—figure supplement 1
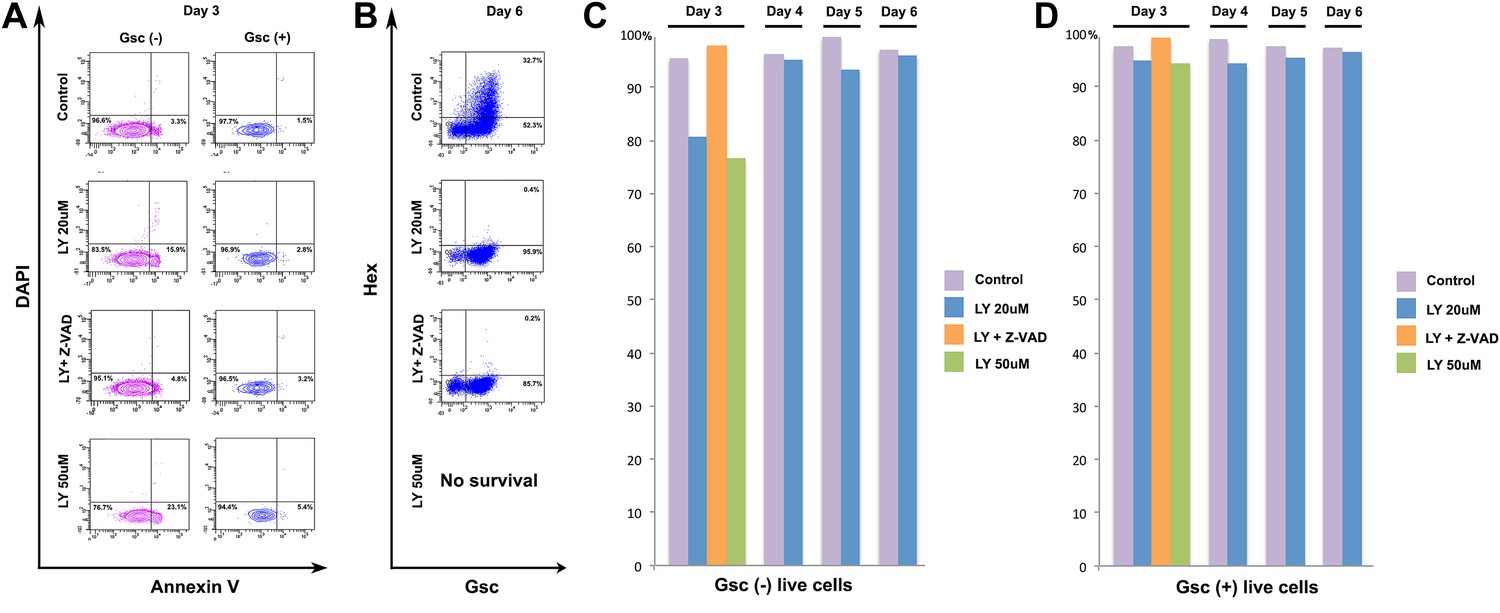
PI3K is not specifically required for ADE survival.
(A) Flow cytometry showing Annexin V staining of Gsc- and Gsc+ differentiating ESCs. At the time of LY application (Day 3) some apoptosis is apparent in the Gsc- population. Caspase inhibitor Z-VAD-FMK (10 µM) was used to inhibit apoptosis. (B) Flow cytometry at day 6 showing ADE induction and that cell death inhibition does not rescue the LY mediated block to ADE induction. High dose of LY (50 µM) led to extensive cell death during differentiation and therefore no data were available at this time point. (C) Quantification of flow cytometry for each day of differentiation in both Gsc- and (D) Gsc+ differentiating cells.
Figure 3 with 1 supplement
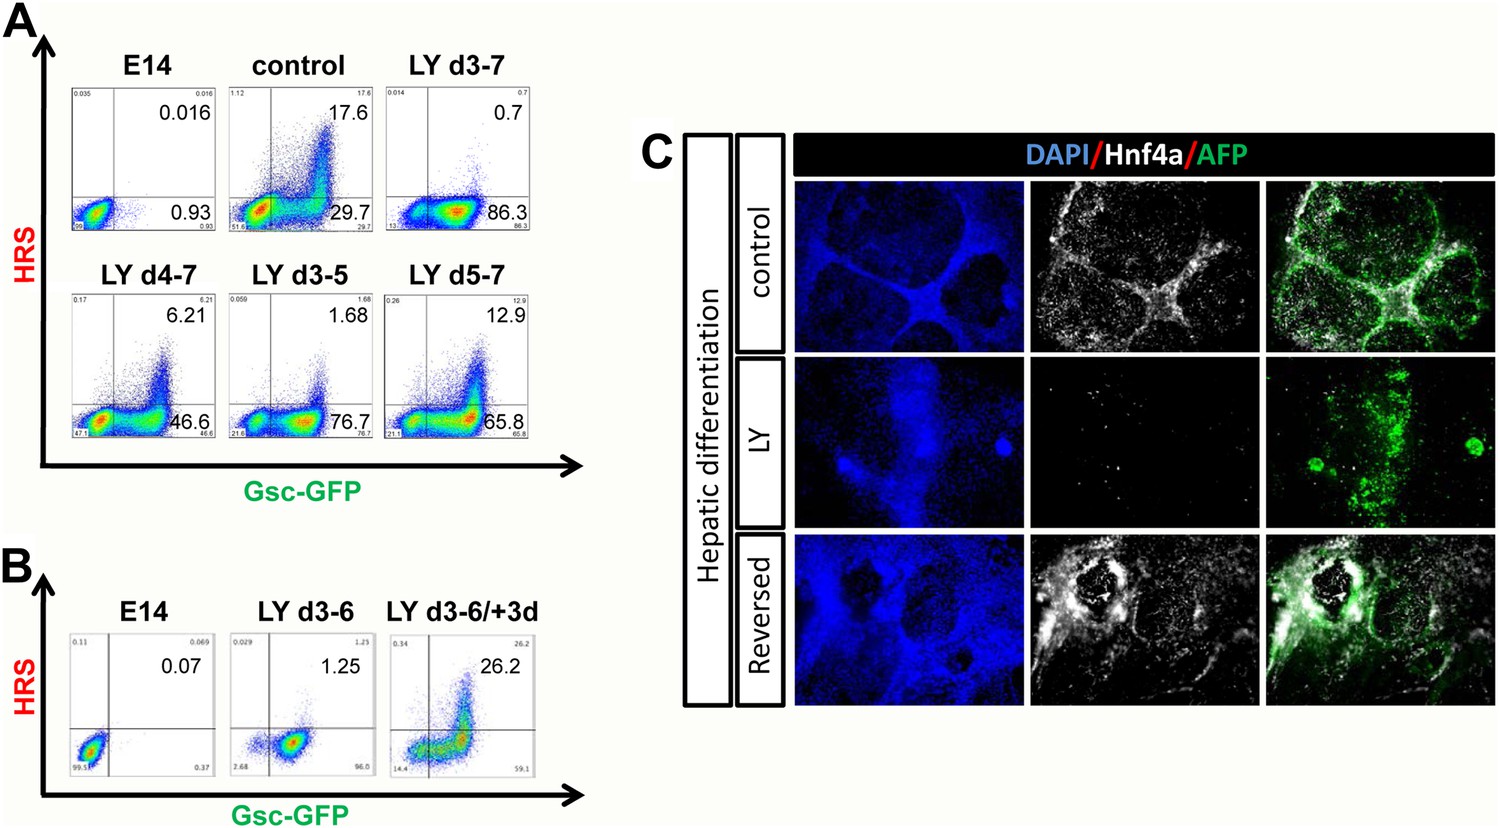
PI3K promotes exit from a naïve endoderm state.
(A) PI3K is essential during endoderm segregation. Time course for endoderm differentiation analysed by flow cytometry on the HRS/Gsc-GFP cells showing a requirement for PI3K signalling during days 3–5 of ADE differentiation. Cells were differentiated under normal conditions or treated with LY for different periods of time. The period of LY treatment is stated for each graph and ADE induction was assessed at day 7 of differentiation. Gates were set with parental E14s as in Figure 1. (B) Cells exposed to LY during d3–6 could be returned to normal differentiation to generate ADE. Flow cytometry showing the emergence of the Hhex+/Gsc+ ADE after LY-treated naïve endoderm was returned to normal differentiation for a further 3 days. Gates were set as in A. (C) Hepatic differentiation of ADE and naïve endoderm. Immunostaining for AFP and Hnf4a on differentiated cells showing the formation of hepatocyte progenitors. ADE (control-upper panel), cells differentiated in LY (middle panel) and ADE generated from LY-treated naïve cells (lower panel) were subjected to hepatocyte differentiation. LY-treated cells showed reduced differentiation efficiency, whereas both ADE and recovered LY-treated ADE efficiently generated hepatocytes.
Figure 3—figure supplement 1
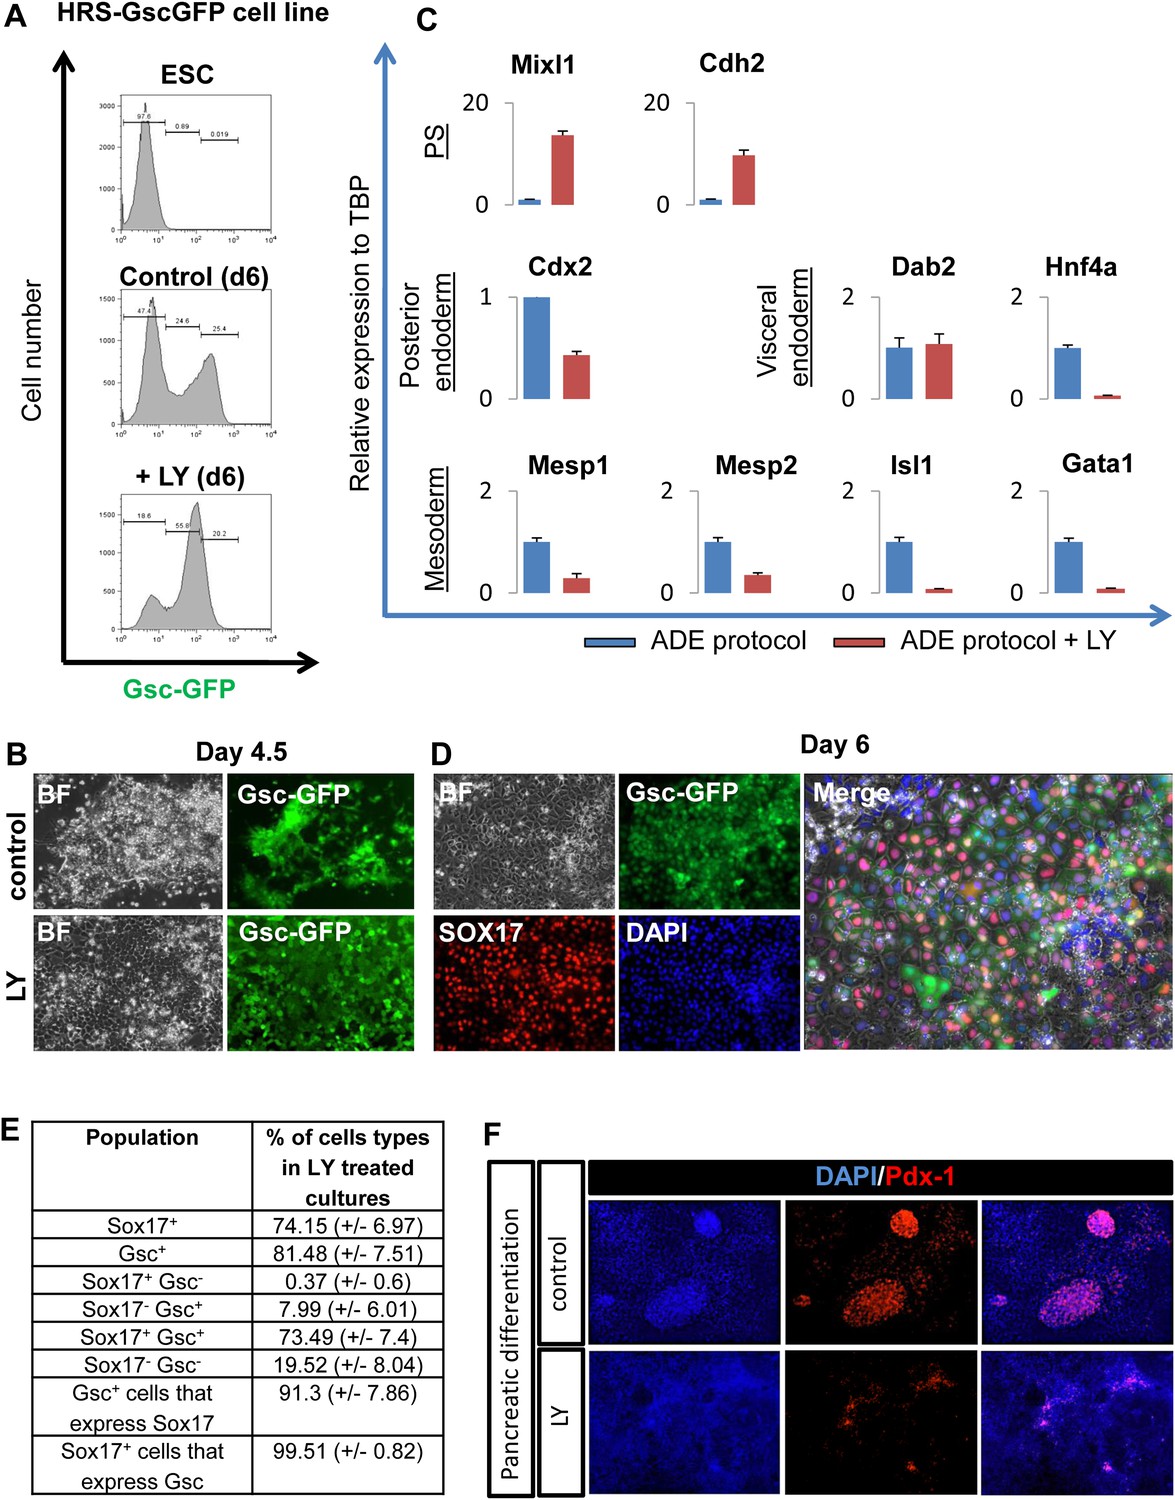
PI3K inhibition supports a naïve endoderm state.
(A) Histograms based on flow cytometry showing that while the Gsc-GFP cell number is increased by LY treatment, the population is shifted to a lower level of Gsc expression (Gsclow). (B) Fluorescence imaging of HRS/GscGFP differentiating cultures showing clusters of cells with Gschigh expression (pre-ADE) (upper panel) that are eliminated when PI3K is inhibited. Cultures treated with LY failed to form ordered epithelial junctions and showed uniform Gsclow expression (lower panel). (C) Q-RT-PCR showing markers of posterior, visceral endoderm and mesoderm/PS in LY-treated cultures. Meox1&2 (mesoderm) transcripts were not detected. (D) Fluorescence images of the Gsclow population stained for Sox17 in cultures differentiated in the presence of LY. The majority of these cultures co-expressed the endodermal marker Sox17 alongside low levels of Gsc-GFP. (E) Quantification of cell types found in LY differentiating cultures similar to those depicted in C and D, at day 6 of differentiation. (F) Pdx-1 immunostaining (pancreatic progenitor marker) showing expression in further differentiation of ADE cultures. ADE (upper panel) and LY-treated cells (lower panel) were subjected to further pancreatic differentiation and stained for Pdx-1. LY-cells showed significantly reduced differentiation efficiency compared to ADE.
Figure 4
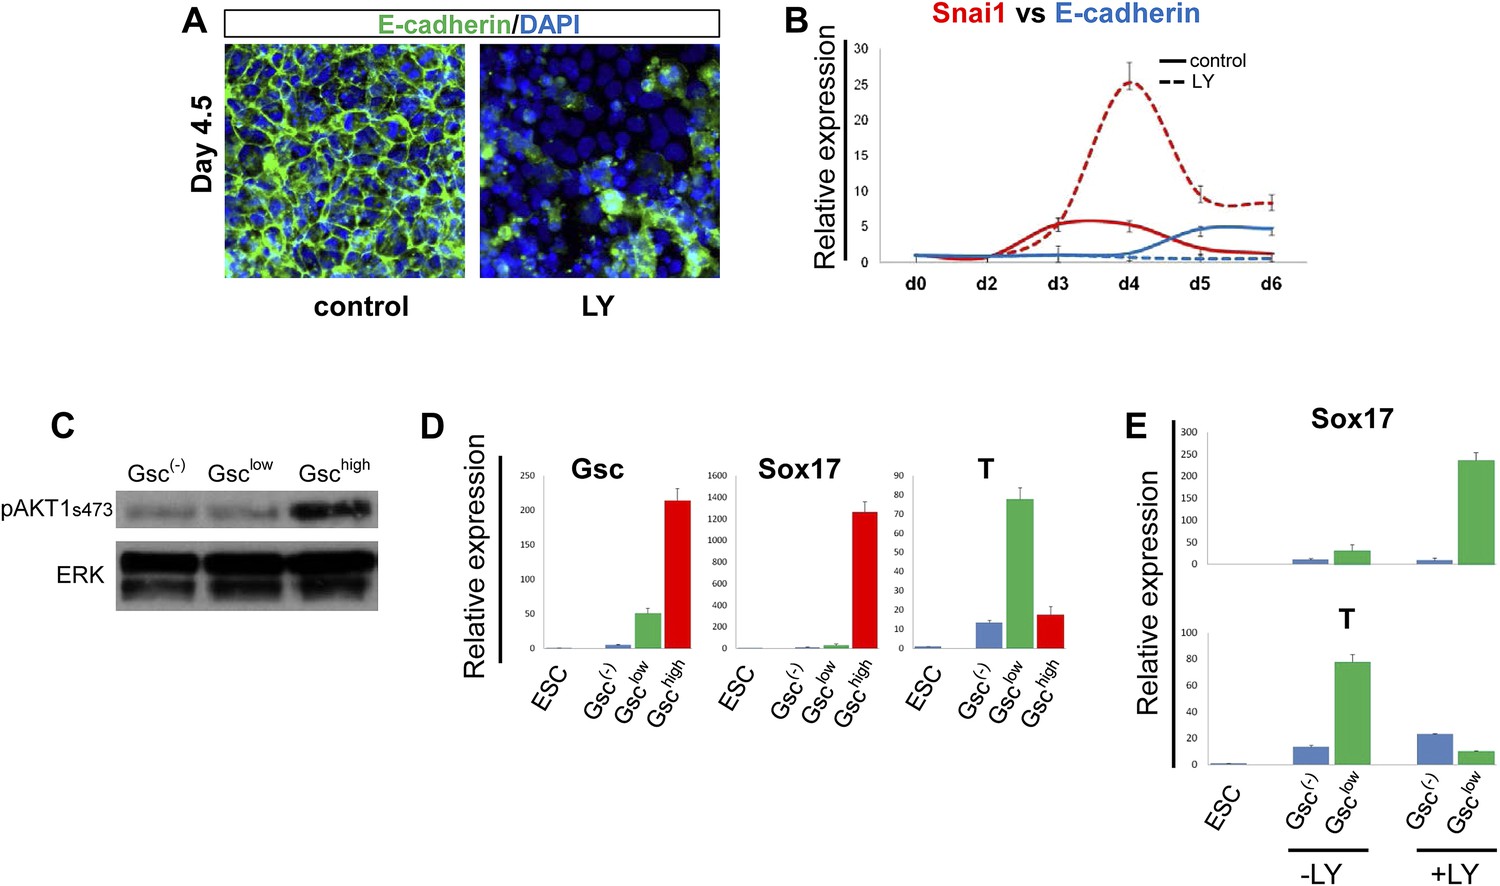
PI3K/Akt1 regulates EMT and is localized to the pre-ADE population.
(A) PI3K activity is necessary to maintain epithelial integrity in endoderm differentiation. Immunofluorescense images showing strong expression of the epithelial marker E-cadherin during ADE specification. Addition of LY during phase 2 resulted in a reduction of E-cadherin levels and disappearance of E-cadherin from cell–cell junctions. (B) Q-RT-PCR showing a failure in E-cadherin transcriptional up-regulation as well as the up-regulation of its repressor and EMT inducer, Snai1, in LY-treated cultures. Transcript levels were normalised as described in Figure 2A. Control: ADE differentiation protocol. (C and D) Normal differentiating HRS/Gsc-GFP cells were sorted by flow cytometry based on Gsc levels at day 4.5 of ADE differentiation. (C) Western blots showing Akt1 phosphorylation in different fractions of differentiating ESC. pAkt1 was localized to the Gschigh population. Total ERK was used as loading control. (D) Q-RT-PCR showing lineage markers in sorted cells. The Gschigh/Akt1high population coincides with the Sox17 positive emergent endoderm. (E) Inhibition of PI3K during phase 2 alters the identity of the Gsclow population. Q-RT-PCR showing the mesoderm and endoderm markers T and Sox17. Transcript levels for D and E were normalised as described in Figure 2A.
Figure 5 with 1 supplement
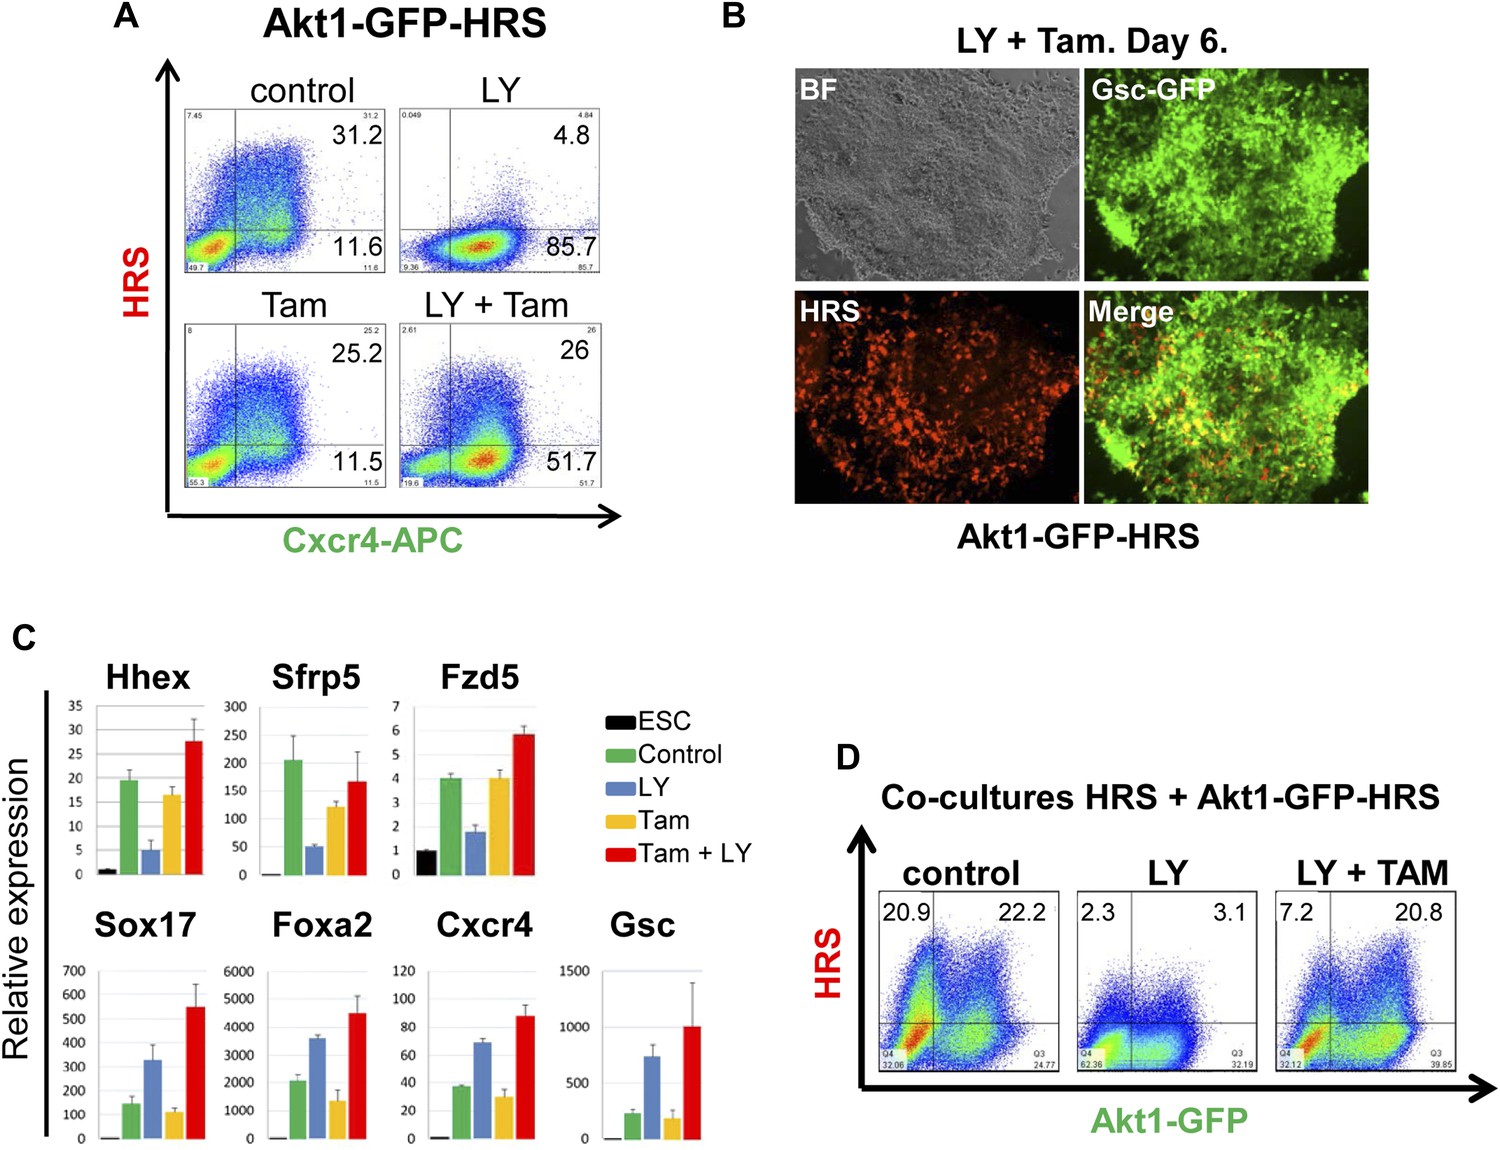
Akt1 activation rescues the block to PI3K in ADE differentiation.
(A) ADE induction is rescued by Akt1 activation. Flow cytometry on Akt1-GFP-HRS differentiating cells showing that induction of Akt1 with Tamoxifen (Tam) rescues HRS expression. (B) Fluorescence microscopy showing Akt1-GFP-HRS differentiating cultures in presence of LY and Tam. HRS expression and ADE epithelial morphology were both rescued. (C) Q-RT-PCR showing rescue of ADE marker expression in LY-treated cultures by Tam-induced Akt1 expression. Transcript levels were normalised as described in Figure 2A. (D) Flow cytometry showing cell non-autonomous rescue of mixed Akt1-GFP-HRS and HRS differentiating co-cultures treated with Tam and/or LY. Akt1-GFP-HRS cells can be distinguished based on GFP expression (X-axis). HRS expression (Y-axis) was rescued in both Akt1-GFP-HRS expressing and non-expressing cells.
Figure 5—figure supplement 1
Activation of Akt1 supports Hhex induction in the presence of a block to PI3K.
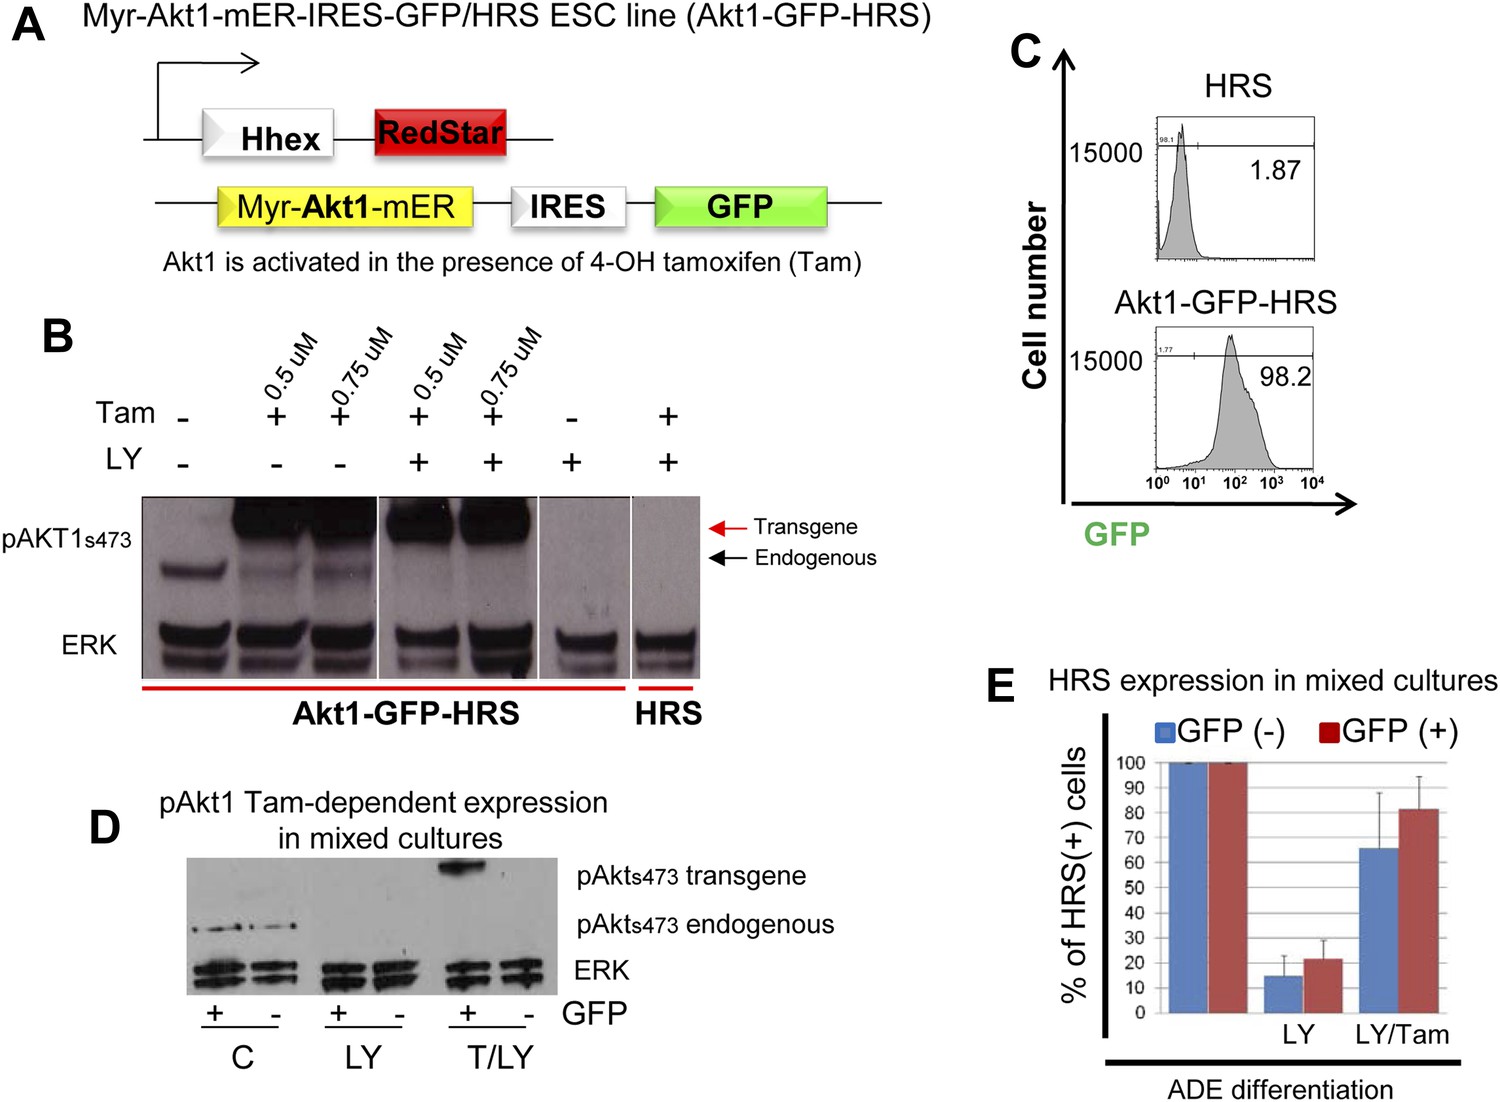
(A) Schematic showing Akt1-GFP-HRS cell line. HRS cells were modified to express a myristoylated fusion protein that includes the activated form of Akt1 fused to a mutant version of the ligand binding domain of the murine oestrogen receptor (mER). This mutant ligand binding domain recognizes 4-Hydroxy-tamoxifen (Tam) in place of oestrogen and places Akt1 under the control of Tam. (B) Western blot showing endogenous and conditional transgenic Akt1 expression in response to Tam and LY treatment. Differentiating cells were harvested on d4, 1 hr after Tam/LY treatment. (C) Flow cytometry showing uniform expression of the Akt1 containing transgene in Akt1-GFP-HRS cells during endoderm differentiation. Akt1-GFP-HRS cells were compared to HRS on day 6 of differentiation. (D) Western Blot confirming the Tam-induced expression of the Akt1 trangene in the GFP+ fraction of mixed HRS and Akt1-GFP-HRS co-cultures following cell sorting by flow cytometry based on GFP. Endogenous pAKT1 expression was observed in control conditions and was blocked by LY treatment. Cells were sorted based on GFP expression 6 hr after LY and Tam+LY (T/LY) treatments. (E) Quantification of the rescue of ADE induction as assessed by flow cytometry in Figure 5D. The experiments were performed by mixing HRS cells with Akt1-GFP-HRS cells (1:1), differentiating in the presence of LY and Tam, and assessing HRS expression in the different GFP populations at day 6. Blue columns represent the percentage of HRS expressing cells in the GFP− fraction (non-Akt1 expressing cells). Red columns represent the GFP+ fraction (Akt1 expressing cells). Treatments are stated below each set of columns. For normalization, HRS expression in control mixed cultures was taken as 100% for each fraction. Quantification of the non-cell autonomous effect of Tam was obtained by the ratio between HRS+GFP−/GFP−, while similar quantification of the cell-autonomous effect was obtained by the ratio between HRS+GFP+/GFP+, and compared to the control. LY decreased HRS expression in both GFP− (14.76% +/− 8.12) and GFP+ (21.68% +/− 7.26) fractions, whereas in Tam/LY treated cultures rescue of HRS expression was observed in both GFP− (65.95% +/− 21.87), and GFP+ (81.66% +/− 14.03) fractions, (n = 4).
Figure 6 with 1 supplement
PI3K/Akt1 dependent-ECM generated during endoderm differentiation can support ADE specification.
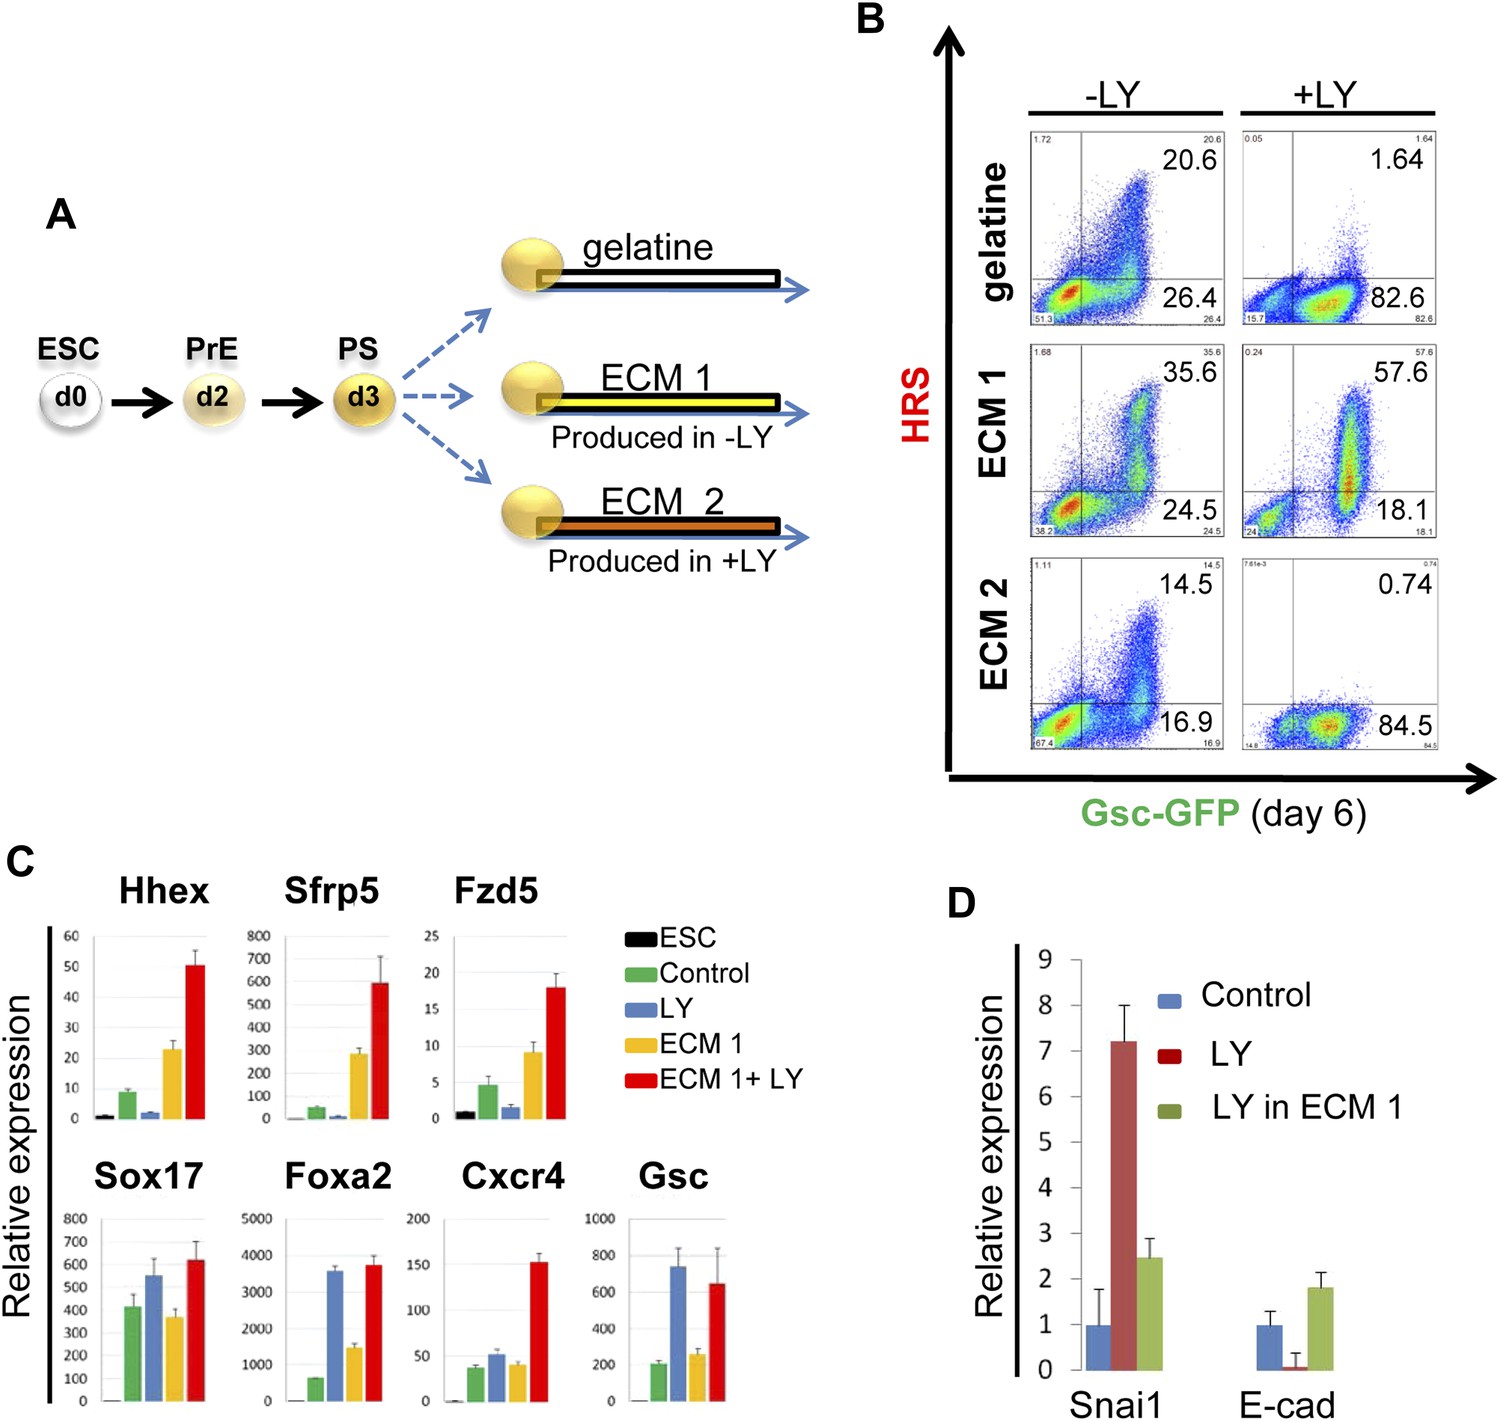
(A) Schematic showing the experimental strategy designed to test the role of ECM in supporting ADE specification. ECM1 and ECM2 were produced by differentiating cells in the absence or presence of LY respectively. Matrices were obtained by removing differentiated cells from day 6 cultures. (B) ADE generation assessed by flow cytometry on differentiating cells exposed to LY. ADE induction was rescued and enhanced when cells were re-plated onto ECM1. APS-like cells re-plated on either ECM2 or gelatine failed to counteract LY-induced phenotypes. (C) Q-RT-PCR analysis showing rescue of ADE markers in differentiating cells re-plated onto ECM1 and simultaneously treated with LY. Transcript levels were normalised to the Tbp value obtained for each sample. Normalised values are related to the level obtained for ESC. (D) Q-RT-PCR showing the regulation of EMT markers by ECM1. Transcript levels were normalised to the Tbp value obtained for each sample. Normalised values are related to the level obtained in control conditions.
Figure 6—figure supplement 1
PI3K/Akt1 signalling modulates ECM activity to induce ADE specification.
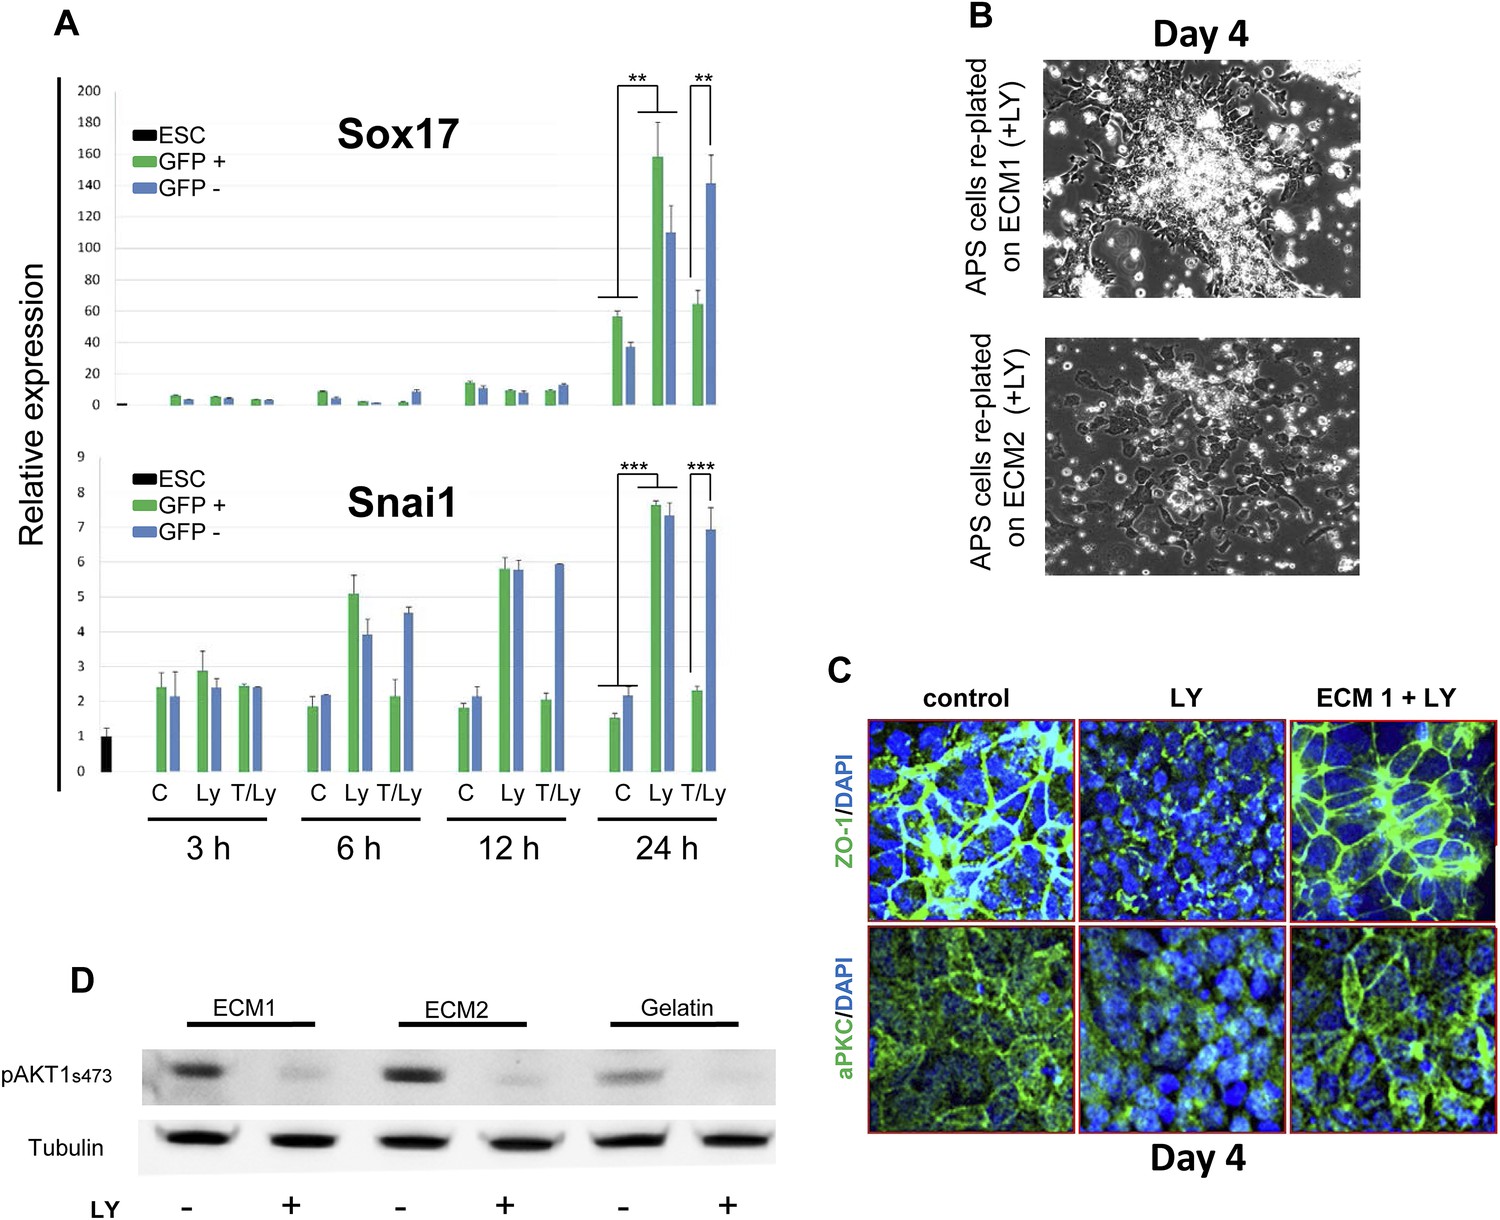
(A) A time course for induction of Snai1 and Sox17 by Akt1. Q-RT-PCR on mixed HRS and Akt1-GFP-HRS co-cultures (+/− Ly, +/− Tam) that were sorted based on GFP and analysed at the indicated times. Transcript levels were normalised to the Tbp value obtained for each sample. Normalised values are related to the level obtained for ESC. (B) Phase contrast image showing APS cells re-plated onto ECM1 and 2. On ECM1 cells formed epithelial clusters in the presence of LY, whereas cells plated onto ECM2 retained a mesenchymal-like morphology in the presence of LY. (C) Cell–cell contacts and localization of the tight junction marker, ZO-1, and the polarity marker, aPKC, were severely affected by LY treatment, but were unaffected in APS cells exposed to LY and plated onto ECM1. IC showing expression of aPKC and ZO-1 12 hr after plating on indicated ECMs. (D) Western blots showing activation of Akt1 in cells plated on different substrates with or without LY. Re-plating onto ECM1 did not prevent Akt1 dephosphorylation by LY.
Figure 7 with 1 supplement
Composition of ECM determines cell fate choices within endoderm.
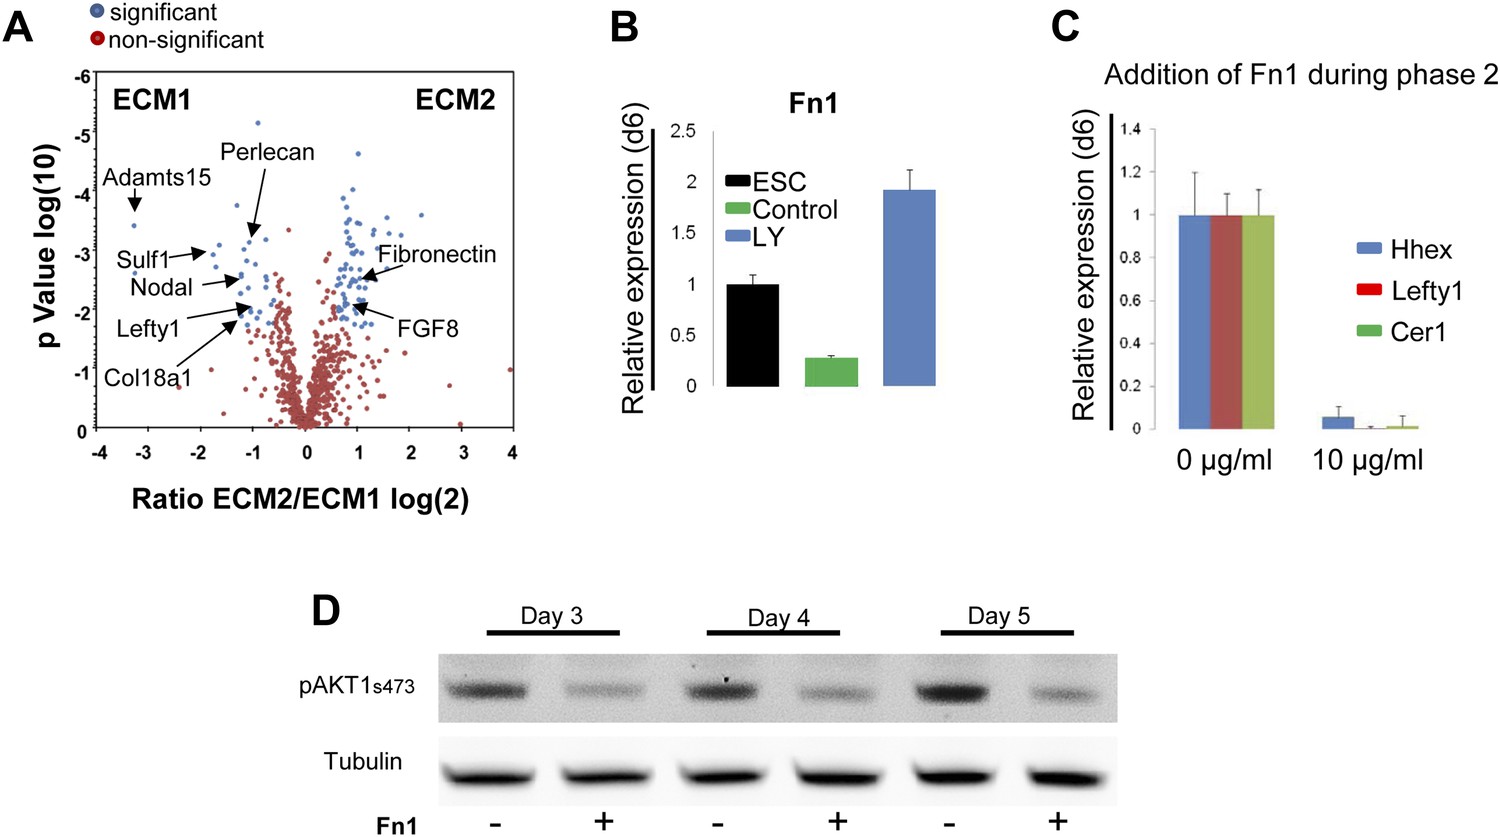
(A) Different compositions of ECM1 and ECM2 as determined by mass spectrophotometry. Significantly over-represented peptides (blue dots) or evenly represented peptides (red dots) in the ECM1 (left side), and ECM2 (right side) are shown in the volcano plot. Relevant peptides are indicated. (B) Q-RT-PCR showing the regulation of Fn1 expression as a result of PI3K inhibition (d6). (C) Q-RT-PCR analysis showing inhibition of ADE gene expression when Fn1 was added to the culture media. Transcript levels were normalised to the Tbp value obtained for each sample. Normalised values are related to the level obtained in ESC (B) and in control conditions with no exogenous Fn1 (C). (D) Fn1 inhibits Akt1 activation. Western blots showing inhibition of Akt1 phosphorylation by Fn1 during ESC differentiation. Tubulin was used as loading control.
-
Figure 7—source data 1
ECM global gene analysis.
- https://doi.org/10.7554/eLife.00806.016
-
Figure 7—source data 2
LC-MS analysis I.
- https://doi.org/10.7554/eLife.00806.017
-
Figure 7—source data 3
LC-MS analysis II.
- https://doi.org/10.7554/eLife.00806.018
Figure 7—figure supplement 1

Expression of ECM components during endoderm differentiation and in response to Akt1 activation.
(A) Q-RT-PCR showing a time course for metalloprotease transcription during endoderm differentiation in the presence and absence of LY. Metalloproteases belonging to the matrisome identified based on transcriptomics of the different differentiating endoderm populations (Morrison et al., 2008). Transcript levels were normalised to the Tbp value obtained for each sample. Normalised values are related to the level obtained for ESC. (B) Q-RT-PCR sorted mixed population (HRS and Akt1-GFP-HRS) in a time course experiment (+/− Ly, +/− Tam) showing that Fn1 expression is Akt1 dependent. Transcript levels were normalised to the Tbp value obtained for each sample. Normalised values are related to the level obtained for ESC.
Figure 8 with 3 supplements
Anterior specification in vivo requires PI3K-dependent ECM.
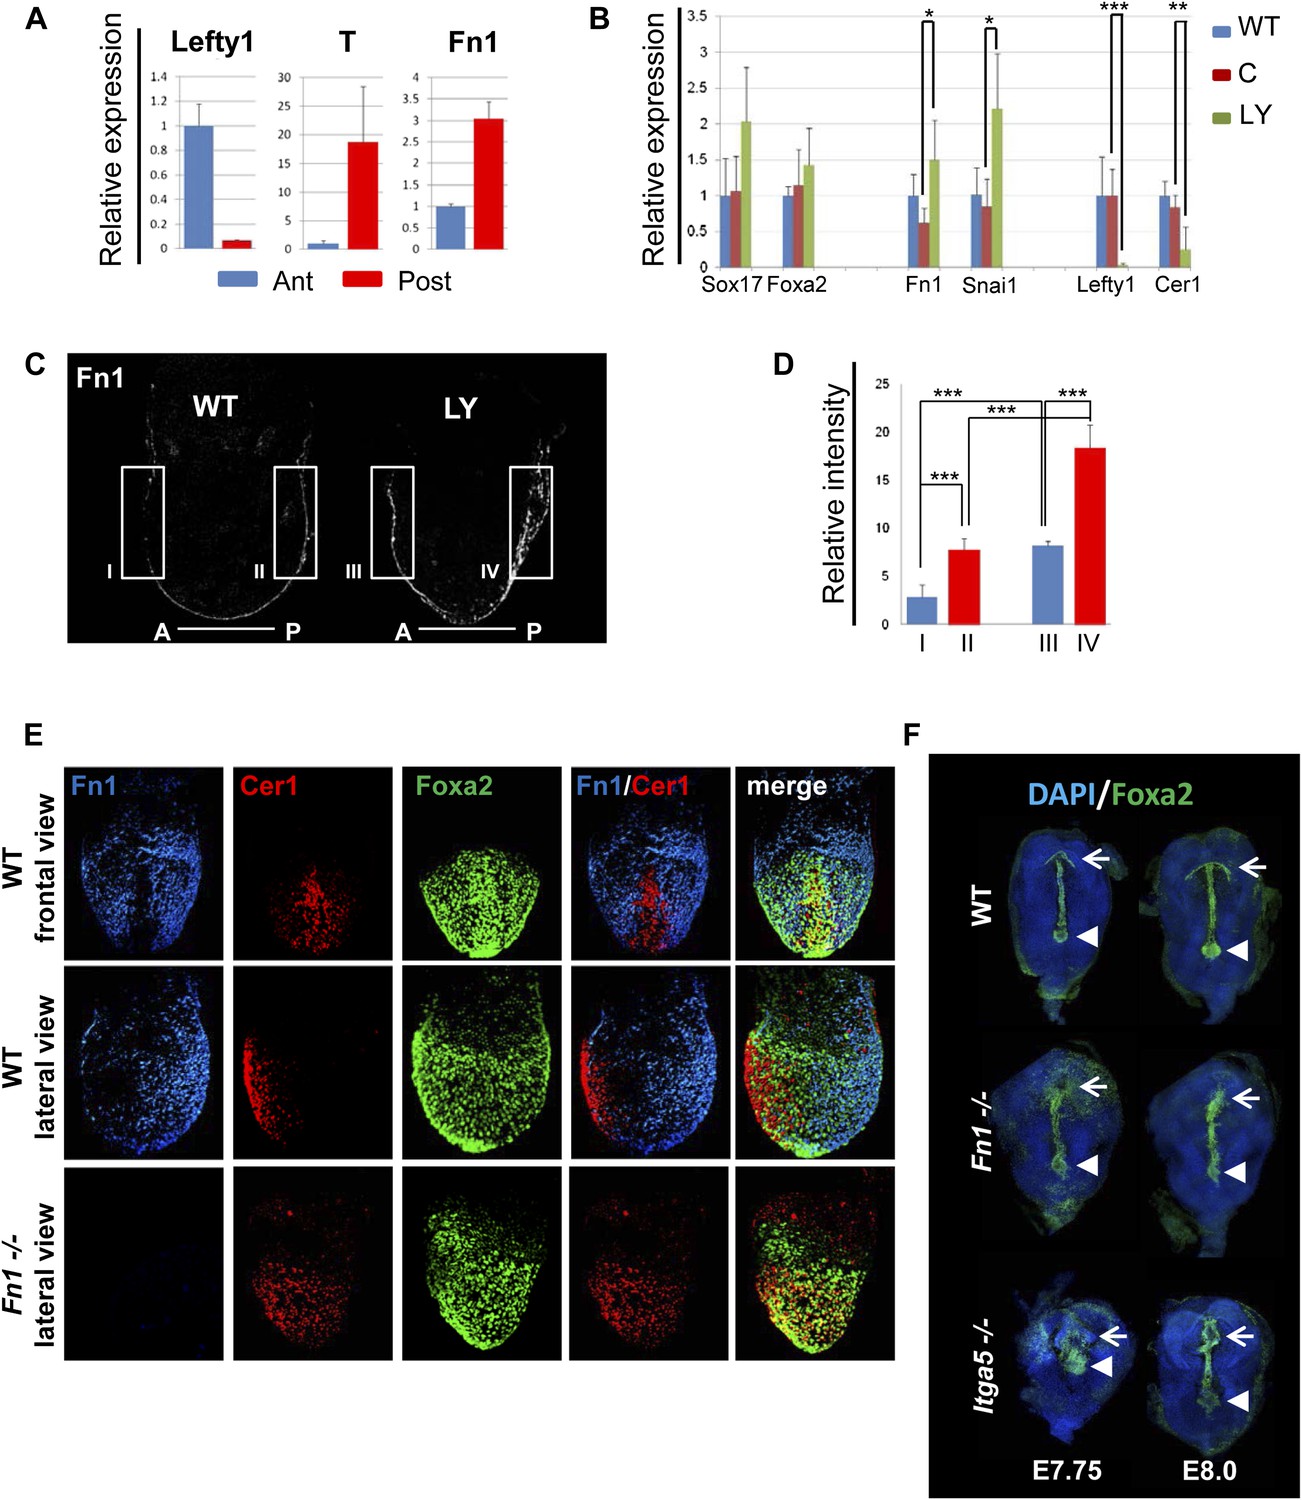
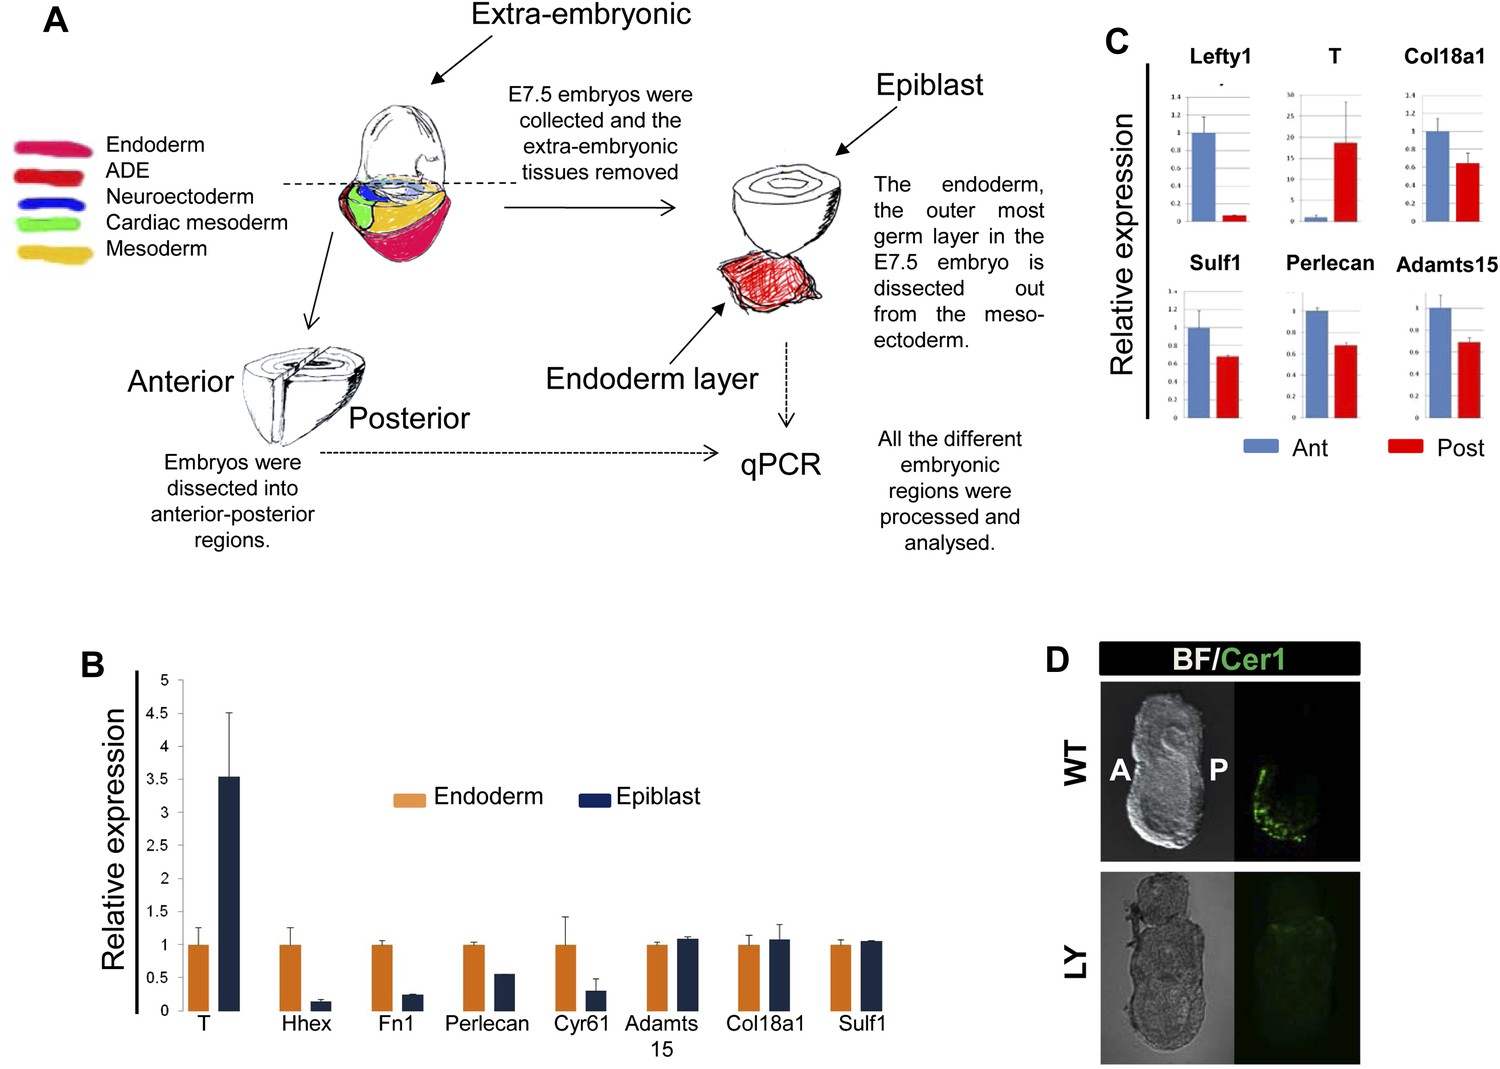
(A) Q-RT-PCR showing differential expression of Fn1 in vivo. Individual E7.5 mouse embryos were bi-dissected into anterior and posterior halves, and Lefty1 and T expression were used as a control for bi-dissection efficiency. Transcript levels were normalised to the Tbp value obtained for each sample. Normalised values are related to the level obtained in the anterior region. (B) Fn1 is regulated by PI3K in vivo. Q-RT-PCR on single embryos dissected at E6.5 and cultured ex-vivo for 24 hr in the presence or absence of LY. Wild-type (WT) embryos were dissected at E7.5 and used as control. Embryos treated with LY exhibited a failure in the expression of anterior markers, and up-regulation of Snai1 and Fn1, similar to that observed in vitro. Error bars represent the standard deviation between embryos (*>0.05; **>0.01; ***>0.001). Both in A and B the transcript levels were normalised to the Tbp value obtained for each sample. Normalised values are related to the level obtained in the anterior region (A) and in E7.5 wild-type embryos (B). (C) Immunohistochemistry (IHC) on sectioned embryos showing higher levels Fn1 on the posterior side of E7.5 wild-type embryos (left) and increased expression of Fn1 in embryos dissected at E6.5 and cultured ex-vivo during 24 hr in the presence of LY (right). (D) Images analysis on the areas highlighted in (C) indicating differential expression of Fn1 along the A–P axis in WT embryos (I, II), and increased expression of Fn1 in embryos cultured ex vivo in the presence of LY (III, IV) (n = 4, ***>0.001). (E) IHC on E7.5 embryos showing differential expression of Fn1 along the anterior–posterior axis and anterior expression of Cer1. In Fn1−/− embryos the Cer1 domain is significantly expanded. Embryos are shown in frontal and in lateral view (anterior to the left). (F) IHC on WT and mutant embryos (dorsal view) showed an expanded Foxa2 expression domain at E7.75, and defects in gut folding and in the formation of the anterior intestinal portal (AIP) at E8.0. Arrowhead points to the node and arrows the foregut.
Figure 8—figure supplement 1
Composition of ECM in the gastrulation stage mouse embryo.
(A) To analyse the in vivo regional expression of the ECM components detected by LC-MS, the endoderm layer was dissected away from the epiblast in E7.5 embryos. Schematic showing the details of the dissections used in Figure 8A and Figure 8—figure supplement 1B,C. (B and C) Q-RT-PCR showing differential expression levels of ECM components in the epiblast vs endoderm (B), and in the anterior vs posterior embryonic region (C). Hhex, Lefty1 and T expression were used to validate the efficacy of individual germ layer and A–P dissections. (D) IHC in ex-vivo gastrulating cultured embryos. Embryos collected at E6.5 exposed for 24 hr to LY showed an impairment in Cer1 expression.
Figure 8—figure supplement 2
Reduction in Fn1 activity resulted in expansion of the anterior endodermal domain in mouse gastrula.
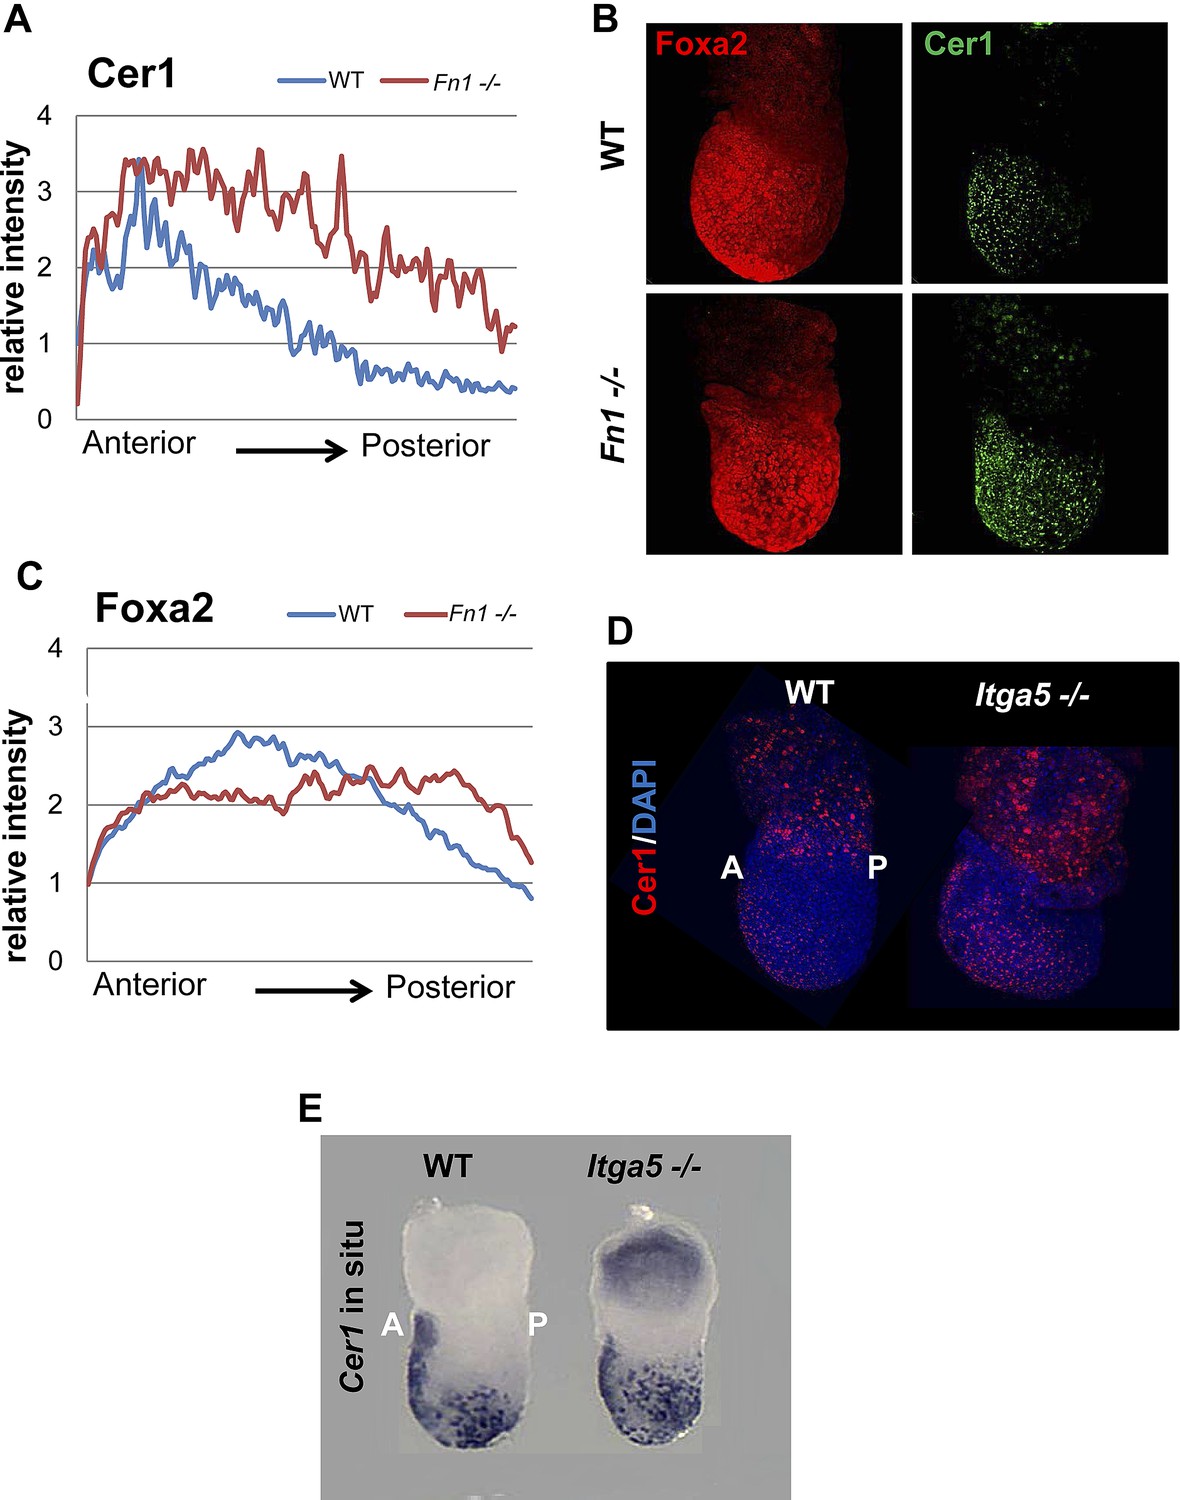
(A) Image analysis measuring the intensity of Cer1 expression across A–P axis in WT and Fn1−/− E7.5 embryos. (B) IHC on Fn1−/− E7.5 embryos showed Cer1 expression is expanded alongside enhanced posterior Foxa2 expression. Embryos are shown in a lateral view. (C) Image analysis measuring the intensity of Foxa2 expression across A-P axis in WT and Fn1−/− E7.5 embryos. (D) IHC on WT and Itga5−/− E7.5 embryos showing a similar expansion of the Cer1 domain. Embryos are shown in a lateral view. (E) In situ hybridization on E7.5 Itga5−/− mutants showing Cer1 RNA expression is also expanded.
Figure 8—figure supplement 3
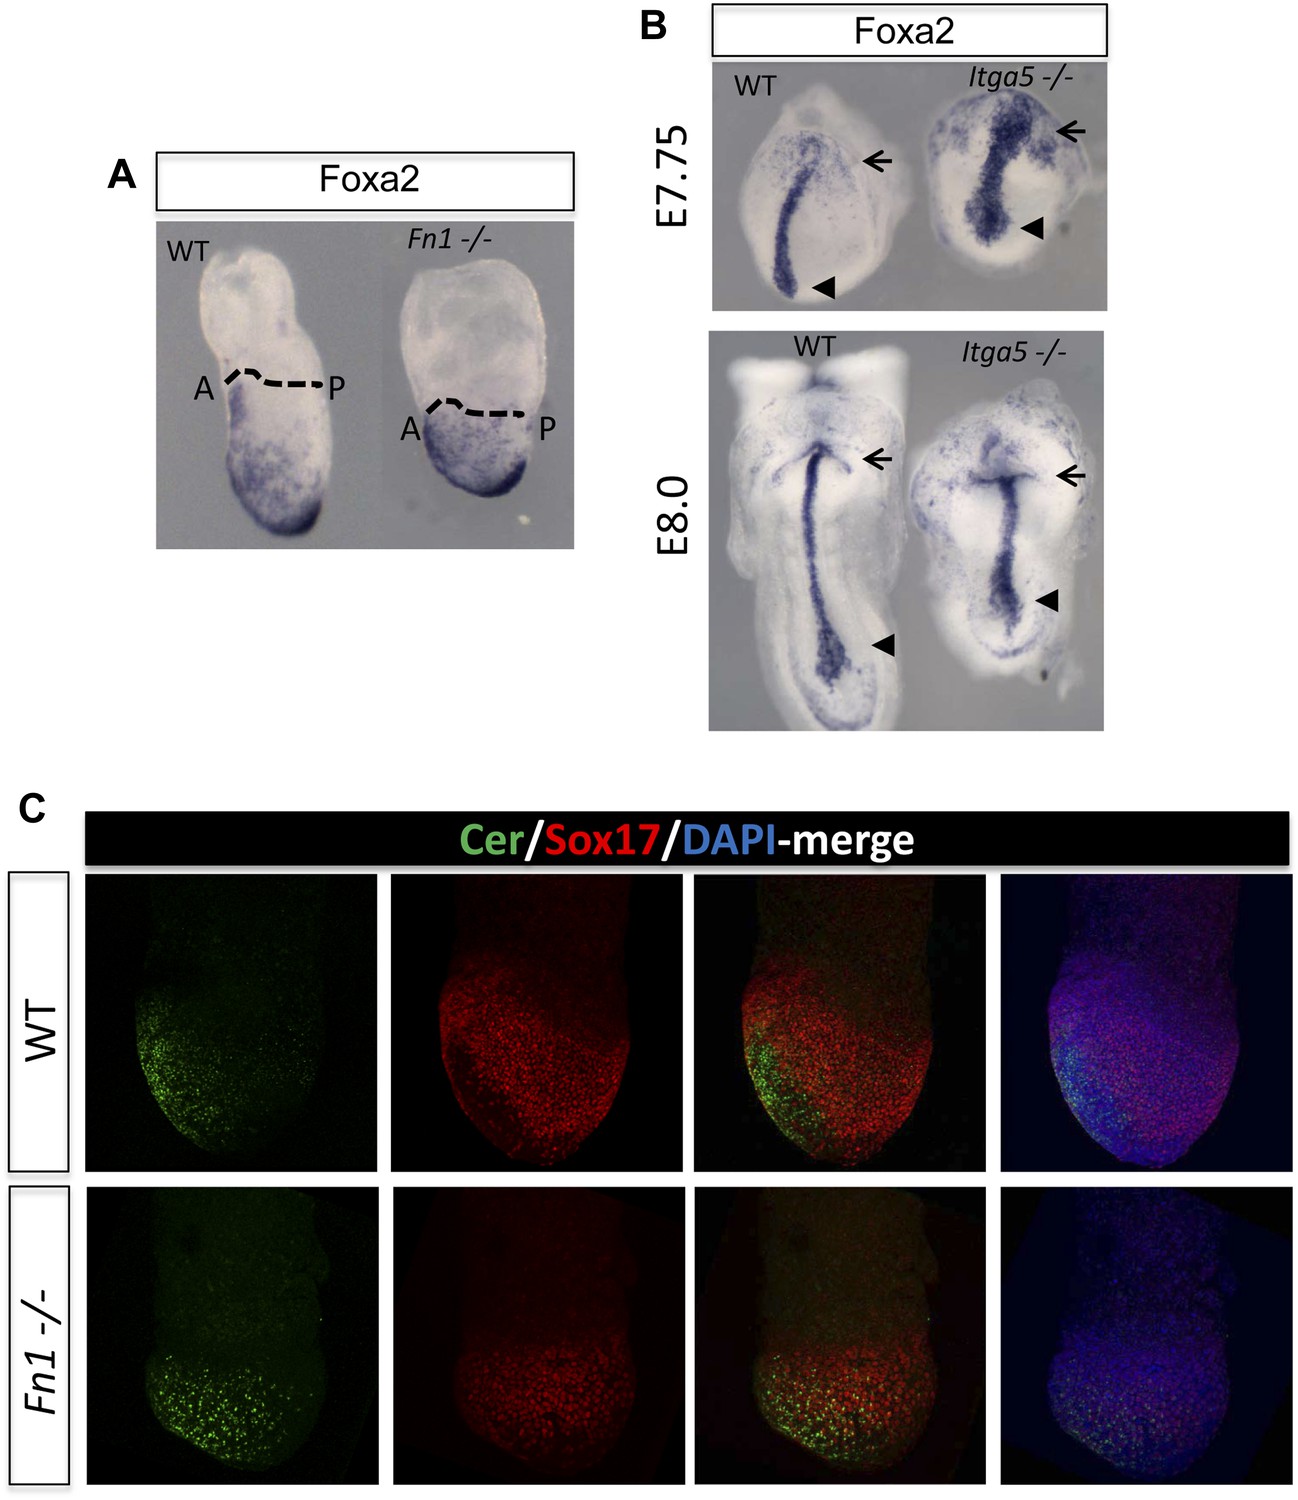
Fibronectin mutants exhibit defects in foregut and naïve endoderm.
(A) Lateral view of WT and Fn1−/− E7.5 embryos after in situ hybridization showing expanded domain of Foxa2 RNA expression. (B) Expanded Foxa2 expression becomes more apparent as the foregut begins to form at E7.75 in the Itga5−/− mutants. In situ hybridisation showing Foxa2 expression at E7.75 and E8.0 in WT and mutant embryos. (C) IHC on WT and Fn1−/− E7.5 embryos showing the relationship between Cer1, Sox17 and Fn1. Sox17 expression is reduced in the prospective foregut domain in WT embryos, similar to the graded expression observed for Fn1. Sox17 expression in the Fn1−/− embryos showed decreased intensity and more homogeneous distribution alongside the expansion of Cer1. Embryos are shown in a lateral view.
Figure 9

A role for ECM in positional specification in the endoderm.
Schematic illustration of the proposed role played by PI3K/Akt1 signalling in positional identity within the endoderm. Cells in PS region are in the process of generating mesoderm and endoderm (mesendoderm). At the anterior end of the PS, high levels of pAkt1 regulate proper epithelialization and anterior endoderm specification through the production of a unique ECM low in Fn1. Low levels of PI3K/Akt1 led to the production of an Fn1-enriched ECM that favours naïve endoderm generation.
Author response image 1
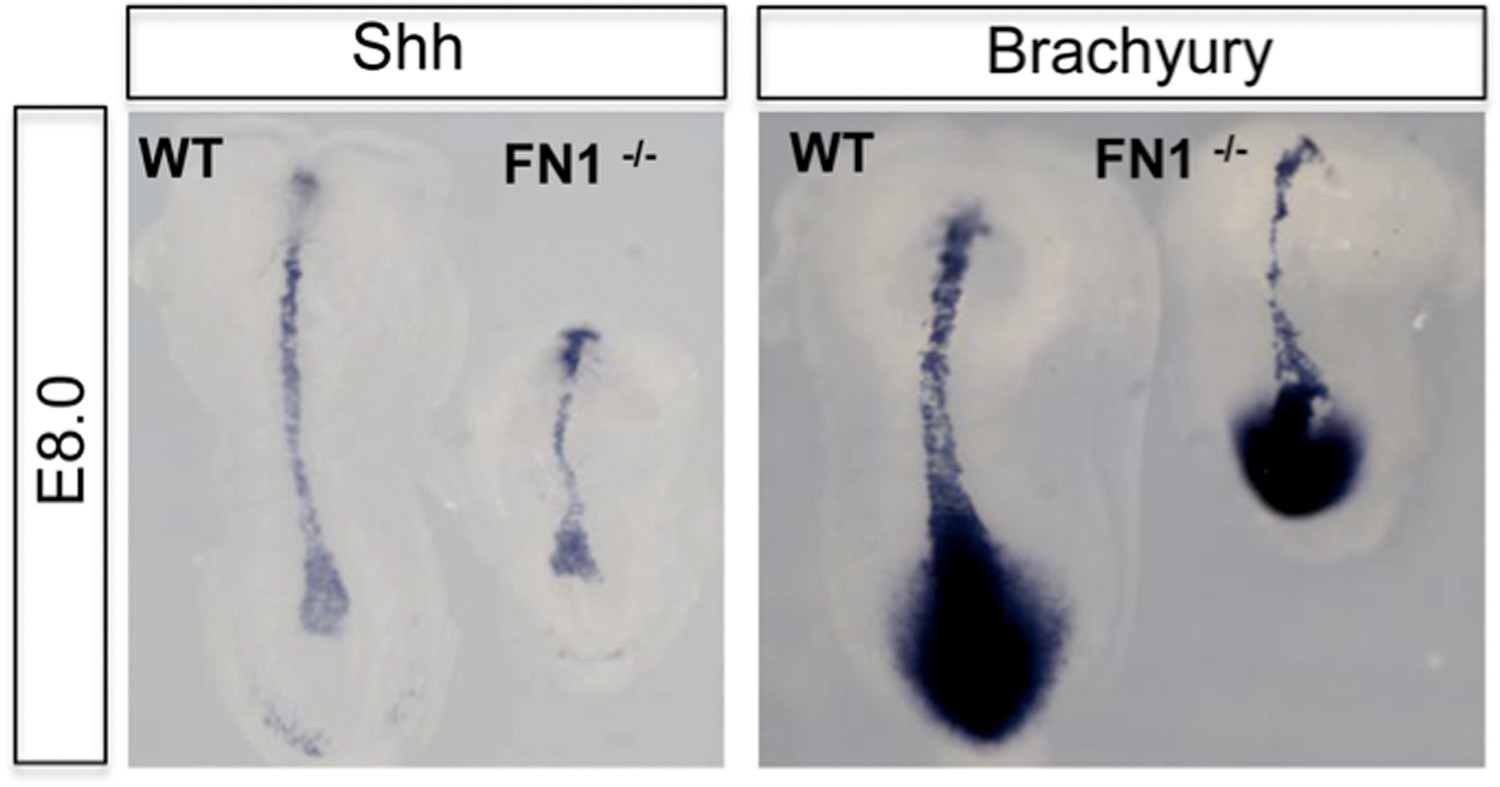
Dorsal view of WT and Fn1-/- E8.0 embryos after in situ hybridization showing RNA expression for mesoderm markers Brachyury (T) and Sonic Hedgehog.
Additional files
-
Supplementary file 1
Inhibitor doses and cell survival.
- https://doi.org/10.7554/eLife.00806.025
-
Supplementary file 2
List of primers and conditions used.
- https://doi.org/10.7554/eLife.00806.026
-
Supplementary file 3
List of antibodies and conditions used.
- https://doi.org/10.7554/eLife.00806.027
Download links
A two-part list of links to download the article, or parts of the article, in various formats.
Downloads (link to download the article as PDF)
Open citations (links to open the citations from this article in various online reference manager services)
Cite this article (links to download the citations from this article in formats compatible with various reference manager tools)
PI3K/Akt1 signalling specifies foregut precursors by generating regionalized extra-cellular matrix
eLife 2:e00806.
https://doi.org/10.7554/eLife.00806


