A component of the mir-17-92 polycistronic oncomir promotes oncogene-dependent apoptosis
- University of California, Berkeley, United States
- University of Cambridge, United Kingdom
- University of California, San Francisco, United States
- Duke University, United States
- Center for Systems Biology, University of Texas at Dallas, United States
- The Third Military Medical University, China
- Northwestern University Feinberg School of Medicine, United States
Figures
Figure 1 with 1 supplement
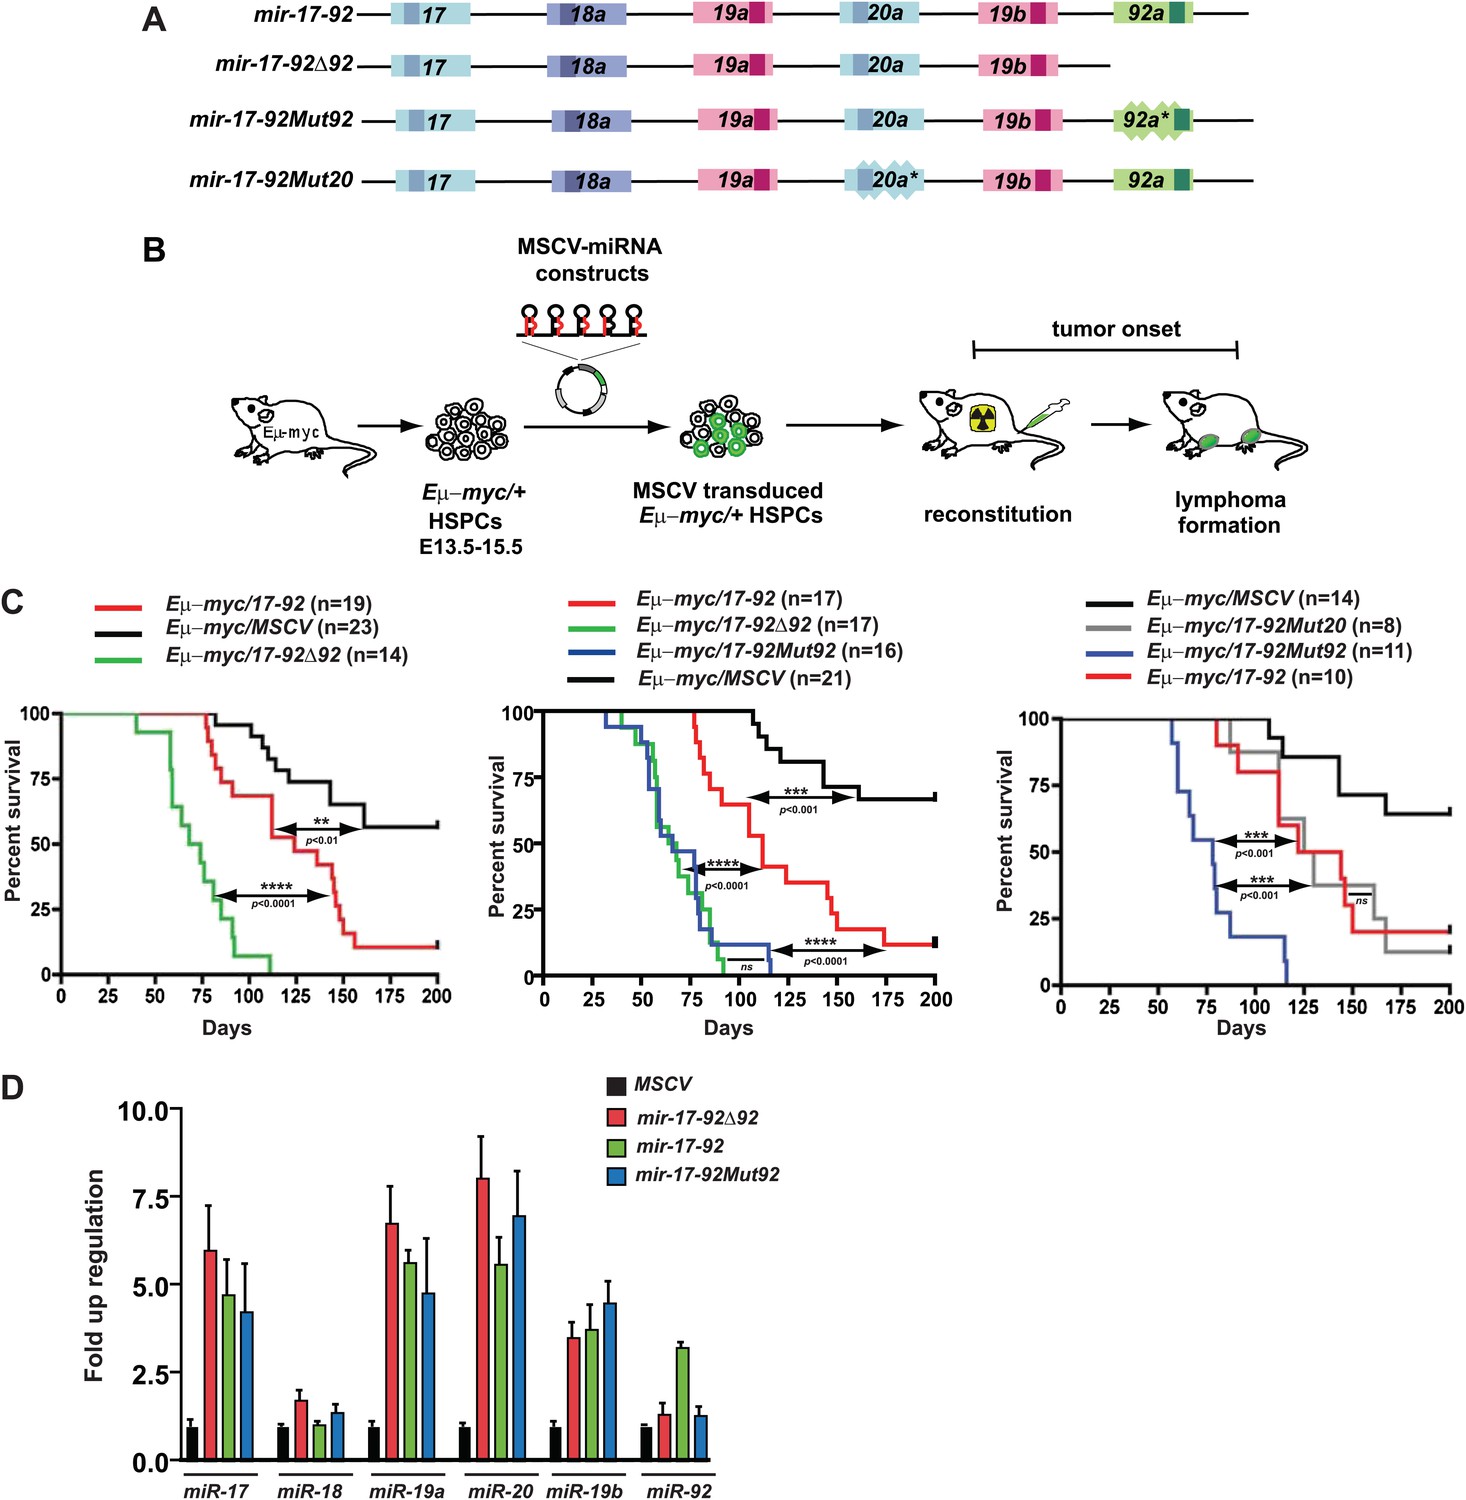
miR-92 negatively regulates the mir-17-92 oncogenic activity in the Eμ-myc B-lymphoma model.
(A) The gene structure of the mir-17-92 polycistron and its mutated derivatives. Light colored boxes, pre-miRNAs; dark colored boxes, mature miRNAs. Homologous miRNA components are indicated by the same color. (B) Schematic representation of the adoptive transfer protocol using Eμ-myc hematopoietic stem and progenitor cells (HSPCs). Eμ-myc/+ HSPCs were extracted from E13.5–E15.5 mouse embryos, infected with MSCV retroviral vectors overexpressing mir-17-92 and its derivatives, and finally transplanted into lethally irradiated recipient mice. Lymphoma onset of the adoptive transferred mice was monitored to evaluate the oncogenic collaboration between c-Myc and a specific miRNA. (C) miR-92 deficiency specifically accelerates the oncogenic activity of mir-17-92 in the Eμ-myc model. Using the Eμ-myc adoptive transfer model, we compared the oncogenic effects between mir-17-92 and mir-17-92Δ92 and observed a significant acceleration of tumor onset in Eμ-myc/mir-17-92Δ92 mice (p<0.0001, left). When the oncogenic effects of mir-17-92, mir-17-92Δ92 and mir-17-92Mut92 were compared in the same adoptive transfer model, mir-17-92Δ92 and mir-17-92Mut92 similarly accelerated Eμ-myc-induced lymphomagenesis compared to mir-17-92 (p<0.0001 for both comparisons, middle). Deficiency of miR-20 failed to affect the oncogenic cooperation between mir-17-92 and Eμ-myc, having minimal effects on tumor onset (right). (D) The mutation of miR-92 has minimal effects on the levels of the remaining mir-17-92 components. Eμ-myc B-lymphoma cells were infected with MSCV retrovirus overexpressing mir-17-92, mir-17-92Δ92 and mir-17-92Mut92 at an MOI (multiplicity of infection) of 1. Expression levels of miR-17, 18a, 19a, 20a, 19b and 92 were subsequently determined using Taqman miRNA assays. Error bars indicate standard deviation (n = 3). **p<0.01, ***p<0.001, ****p<0.0001.
Figure 1—figure supplement 1

Gene structure and evolutionary conservation of mir-17-92.
(A) A diagram represents the gene structure of mir-17-92 and its two mammalian homologs. The six mir-17-92 components are classified into four distinct miRNA families based on the seed sequence conservation. (B and C) miR-92 has a more ancient evolutionary history compared to the rest of mir-17-92 components. miR-92 is evolutionarily conserved in Deuterostome, Ecdysozoa and Lophotrochozoa, yet the remaining mir-17-92 components only have vertebrate homologs. (D) The mutation of miR-92 or miR-20 in the mir-17-92 retroviral construct has minimal effects on the expression levels of the remaining mir-17-92 components. 3T3 cells were infected with MSCV retrovirus at an MOI (multiplicity of infection) of 1 to overexpress mir-17-92, mir-17-92Δ92 and mir-17-92Mut92 (left), or overexpress mir-17-92Mut20 (right). Expression levels of miR-17, 18a, 19a, 20a, 19b and 92 were each determined using Taqman miRNA assays. Error bars indicate standard deviation (n = 3).
Figure 2
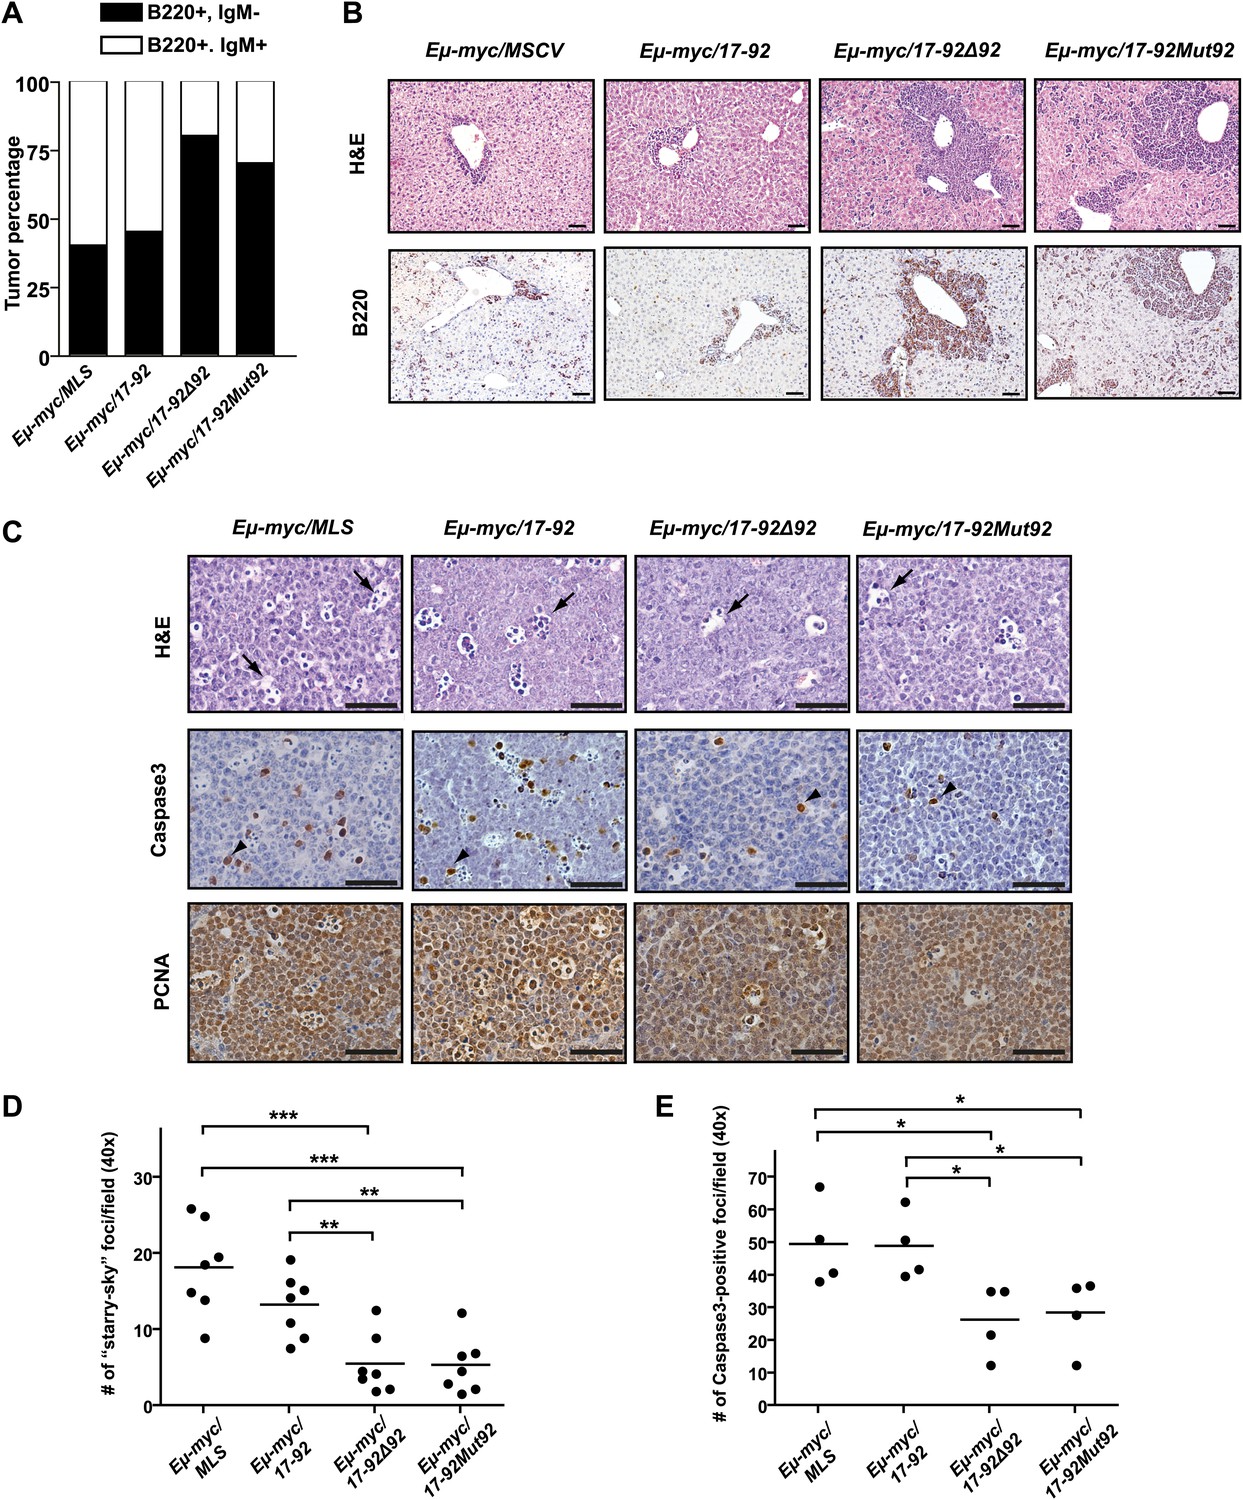
The miR-92 deficient mir-17-92 cooperates with c-Myc to promote highly aggressive B-lymphomas.
(A) The percentage of IgM positive and IgM negative B-lymphomas was calculated for each genotype (Eμ-myc/MSCV, n = 10; Eμ-myc/17-92, n = 9; Eμ-myc/17-92Δ92, n = 10; Eμ-myc/17-92Mut92, n = 10). (B) The Eμ-myc/17-92Mut92 and Eμ-myc/17-92Δ92 mice developed high grade B-lymphomas that were frequently disseminated into the liver. When compared to Eμ-myc/MSCV and Eμ-myc/17-92 mice, Eμ-myc/17-92Mut92 and Eμ-myc/17-92Δ92 lymphomas gave rise to more liver dissemination, as indicated by H&E and B220 staining. (C) Eμ-myc/17-92Mut92 and Eμ-myc/17-92Δ92 lymphomas exhibited a decreased apoptosis compared to Eμ-myc/MSCV or Eμ-myc/17-92 lymphomas. Representative lymphomas were stained for H&E, cleaved caspase-3 and PCNA. Arrow, ‘starry sky’ feature of apoptotic lymphoma cells; arrowhead, apoptotic cells with positive staining for cleaved caspase-3; scale bar, 50 μm. (D and E) Apoptosis was quantitatively measured in representative lymphomas of each genotype using the ‘starry sky’ features (D) and cleaved caspase-3 staining (E). *p<0.05, **p<0.01, ***p<0.001.
Figure 3 with 1 supplement
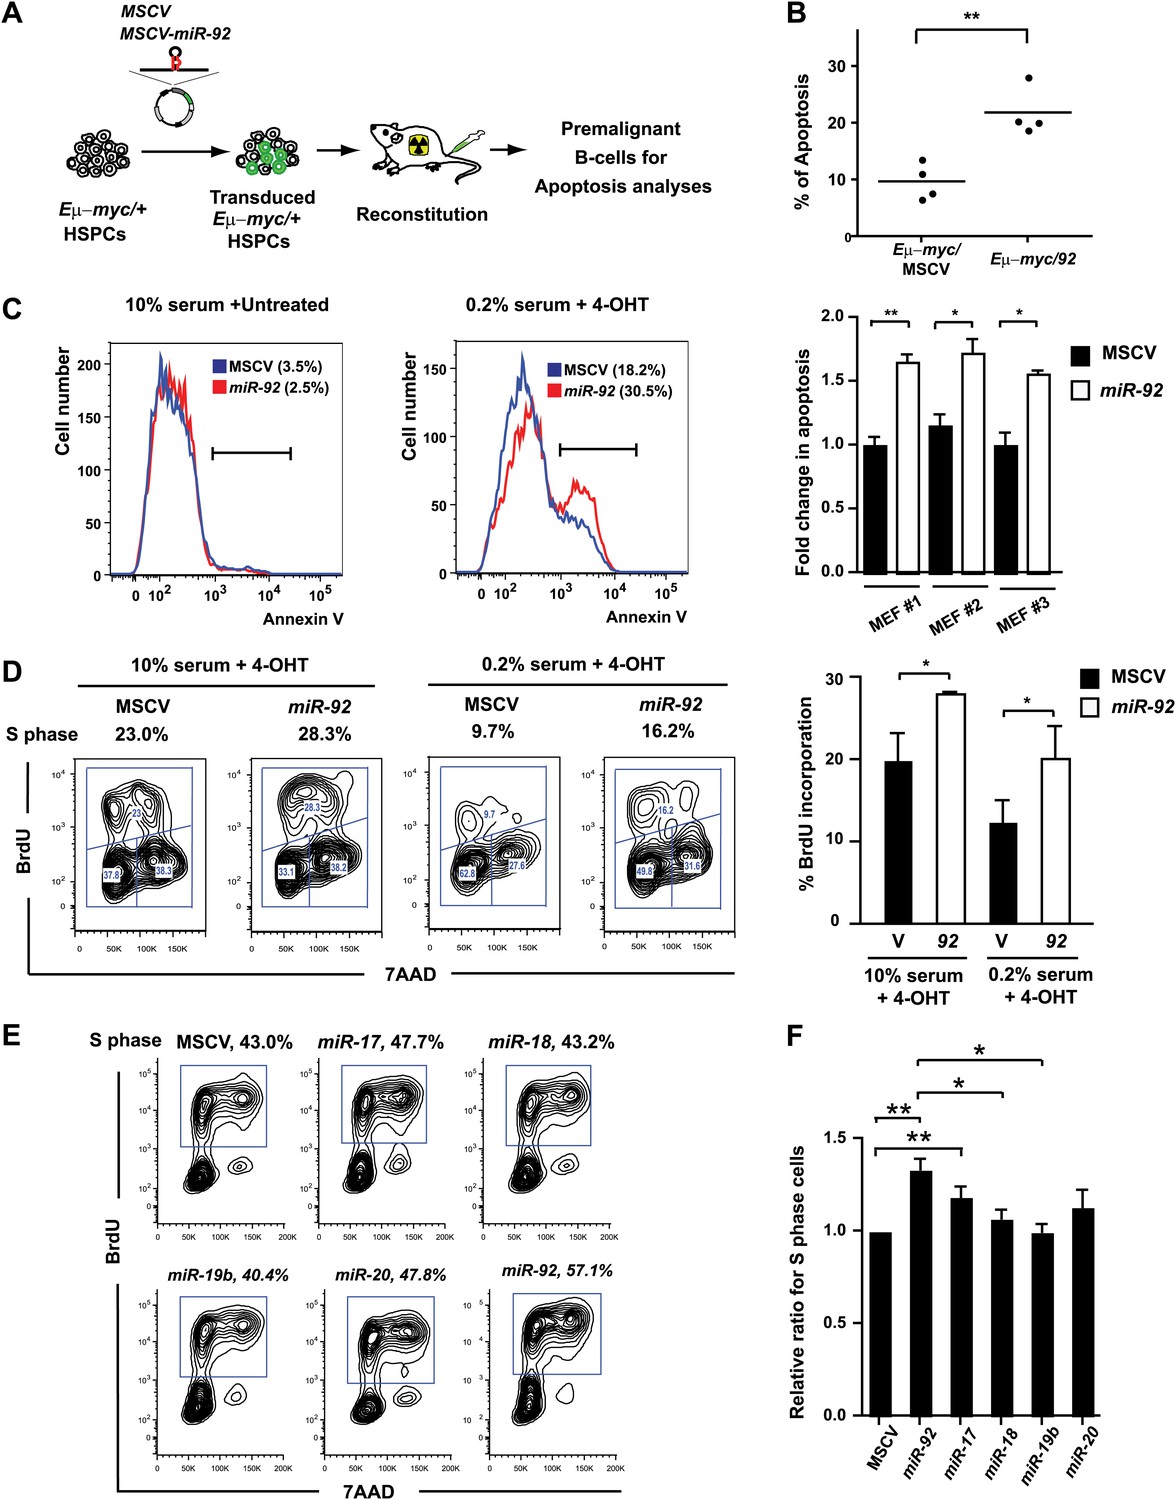
miR-92 enhances both c-Myc-induced apoptosis and c-Myc-induced proliferation.
(A) The schematic representation of the adoptive transfer model to evaluate the miR-92 effects on the Eμ-myc premalignant B-cells in vivo. (B) miR-92 overexpression enhances the apoptotic response in the premalignant Eμ-myc B-cells in vivo. Using the Eμ-myc adoptive transfer model, we generated well-controlled Eμ-myc/MSCV and Eμ-myc/92 mice reconstituted from donor matched Eμ-myc HSPCs. Premalignant Eμ-myc splenic B-cells were isolated from the Eμ-myc/MSCV and Eμ-myc/92 mice 6 weeks after reconstitution. The in vivo apoptosis was measured by the level of caspase activation using Red-VAD-FMK, a fluorescently labeled caspase inhibitor that specifically bound to cleaved caspases. The percentage of Eμ-myc B-cells positive for cleaved caspases was shown for four independent experiments. (C) Enforced miR-92 expression in R26MER/MER MEFs significantly enhanced c-Myc-induced apoptosis. miR-92 overexpressing and the control R26MER/MER MEFs were serum starved, and the MycERT2 transgene was activated by 4-OHT treatment. The level of apoptosis of each MEF was measured using Annexin V staining before (left) and after (middle) 4-OHT treatment and serum starvation. Quantification of c-Myc-induced apoptosis was performed in three independent MEF lines that overexpressed MSCV or miR-92 (right panel, error bars represent SEM). (D) Enforced miR-92 expression in R26MER/MER MEFs significantly enhanced c-Myc-induced proliferation. Proliferative effects of miR-92 was measured by BrdU incorporation in MycERT2 activated R26MER/MER MEFs. miR-92 cooperated with c-Myc to promote BrdU incorporation in both 10% (left) and 0.2% (middle) serum culture conditions. Quantification of BrdU incorporation was performed in two independent experiments (right). (E) miR-92 is a potent mir-17-92 component to promote primary B-cell proliferation. The proliferative effects of all mir-17-92 miRNAs were measured individually in primary B-cells using BrdU incorporation. (F) The quantification of BrdU incorporation in experiments described in (E) was performed in four independent experiments. Error bars represent standard deviation, *p<0.05, **p<0.01.
Figure 3—figure supplement 1

miR-92 enhances c-Myc-induced apoptosis both in vitro and in vivo.
(A) miR-92 enhances the apoptotic response in the premalignant Eμ-myc B-cells in vivo. Using the Eμ-myc adoptive transfer model, we generated well-controlled Eμ-myc/MSCV and Eμ-myc/92 mice that were reconstituted from the same Eμ-myc HSPCs. The in vivo apoptosis was measured by the level of caspase activation 6 weeks after the transplantation. The percentage of Eμ-myc B-cells positive for cleaved caspases was shown for four independent experiments. (B) miR-92 infected, premalignant Eμ-myc B-cells is significantly depleted in the Eμ-myc adoptive transfer model. We generated well-controlled Eμ-myc/MSCV and Eμ-myc/92 mice reconstituted from the same Eμ-myc HSPCs. We measured the percentage of retrovirally infected cells (GFP+) before reconstitution (left), and demonstrated similar infection efficiency in Eμ-myc/MSCV and Eμ-myc/92 mice. At day 33 post adoptive transfer, we isolated white blood cells from the peripheral blood of these mice, and measured the percentage of retrovirally infected, Eμ-myc B-cells (B-220-positive; GFP-positive cells) using FACS. Error bars indicate standard deviation, n = 4, **p<0.01. (C) Enforced miR-92 expression in R26MER/MER MEFs significantly enhanced c-Myc-induced apoptosis. The miR-92 effect was most evident when the infected R26MER/MER MEFs were serum starved and treated with 4-OHT. (D) miR-92 is required for the potent proliferative effect of mir-17-92 in primary B-cells. miR-92 deficient mir-17-92 miRNA polycistrons exhibited a reduced BrdU incorporation in primary B-cell culture in vitro.
Figure 4 with 1 supplement

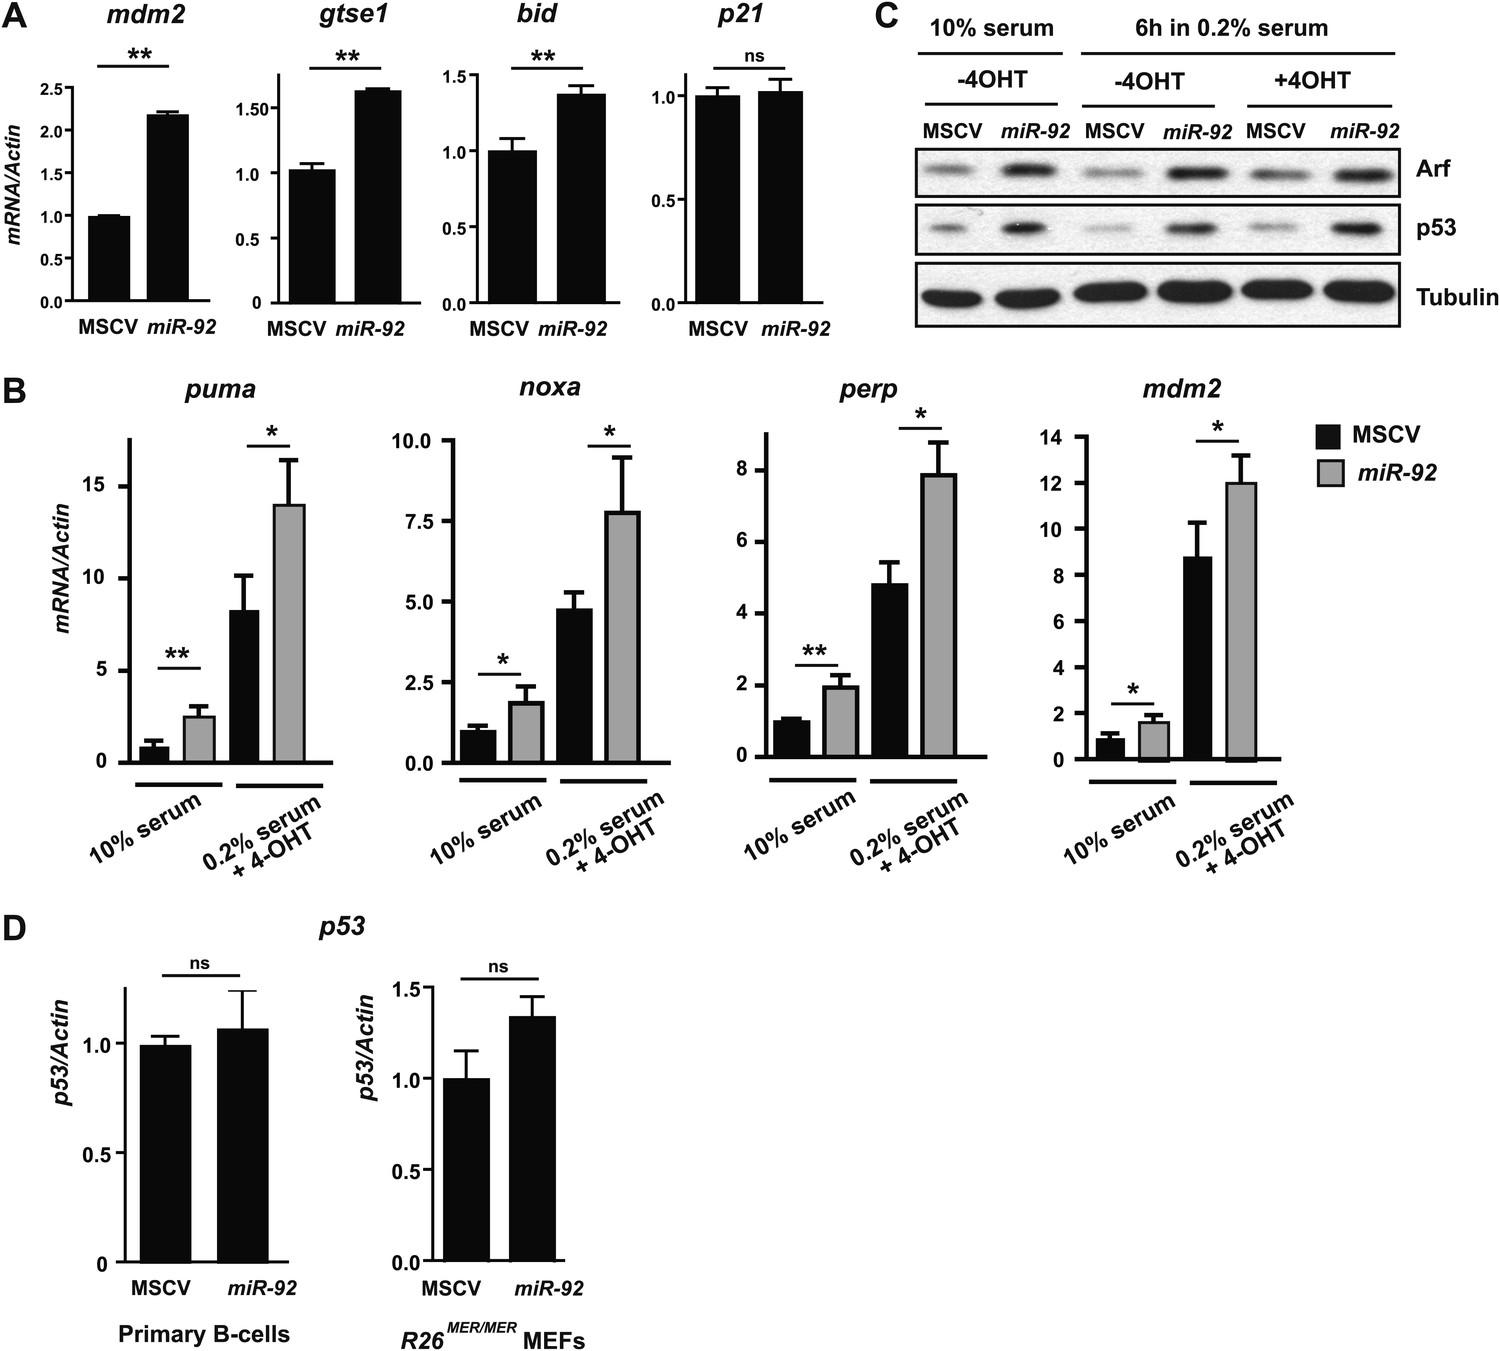
miR-92 induces apoptosis through the activation of the p53 pathway.
(A) The genes upregulated by miR-92 were enriched for the cell cycle pathway and the p53 pathway. Microarray analyses compared gene expression profiles of serum starved and 4-OHT treated R26MER/MER MEFs overexpressing either miR-92 or a control MSCV vector (n = 3). The differentially expressed genes were defined as those with at least 1.5-fold expression level change using SAM (Significance analysis of microarrays, false discovery rate <1%). Pathway analyses were performed on upregulated and downregulated genes using the KEGG database. (B) The heatmaps of the miR-92 upregulated genes enriched for the cell cycle and p53 pathways. (C) Components of the cell cycle and p53 pathways were upregulated upon miR-92 overexpression in both MEFs (left) and primary B-cells (right). The quantitation of gene expression was performed using real time PCR. (D) miR-92 overexpression induces the accumulation of Arf and p53 proteins in MEFs and primary B-cells from bone marrow. Western analyses were performed on the R26MER/MER MEFs (left) and primary B-cells (right) that overexpressed miR-92 or a control MSCV vector in two independent experiments. The infected R26MER/MER MEFs were assayed at 6 hr after serum starvation and 4-OHT treatment; the infected primary B-cells were collected 72 hr post infection. (E) The apoptotic effect of miR-92 requires an intact p53 pathway. We infected R26MER/MER MEFs with two MSCV retrovirus, MSCV-p53shRNA and MSCV-92, to obtain doubly infected cells. Knocking down p53 in R26MER/MER MEFs abolished the ability of miR-92 to enhance c-Myc-induced apoptosis, as measured by Annexin V staining (two left panels). The percentage of apoptotic MEFs of each experimental condition was quantitatively measured (right). (F) The induction of the p53 pathway components by miR-92 is dependent on an intact p53. Knocking down p53 in R26MER/MER MEFs abolished the ability of miR-92 to induce pro-apoptotic p53 targets and other canonical p53 targets, including noxa, perp and mdm2. Error bars represent standard deviation, *p<0.05, **p<0.01, ***p<0.001.
Figure 4—figure supplement 1
miR-92 overexpression triggers the activation of the p53 pathway.
(A) miR-92 overexpression in R26MER/MER MEFs induced several p53 target genes in addition to those described in Figure 3C, including mdm2, Gtse1 and Bid, but not p21. (B) Induction of p53 targets by miR-92 in R26MER/MER MEFs with and without MycERT2 activation. (C) miR-92 overexpression alone enhanced Arf and p53 protein level in R26MER/MER MEFs with and without 4-OHT treatment. (D) miR-92 overexpression did not affect p53 mRNA levels in either primary B-cells or in R26MER/MER MEFs. Error bars indicate standard deviation, n = 3, *p<0.05; **p<0.01.
Figure 5 with 1 supplement
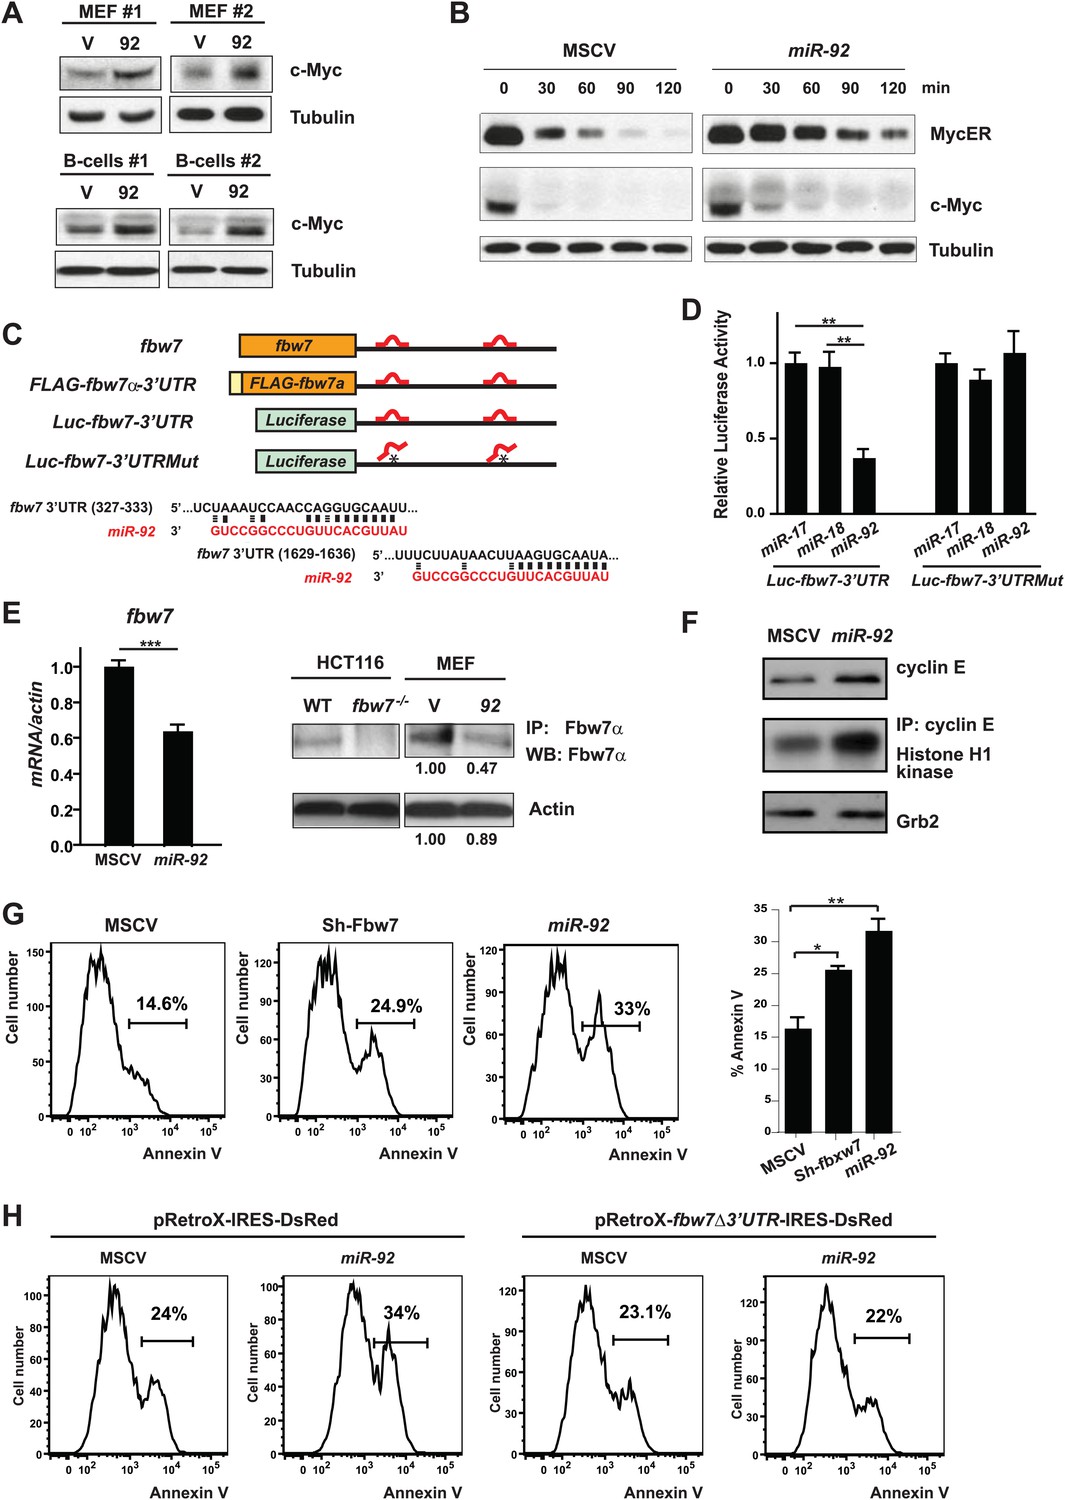
miR-92 promotes the accumulation of c-Myc protein through repressing Fbw7.
(A) miR-92 enhances the accumulation of c-Myc protein in synchronized R26MER/MER MEFs (upper), as well as primary B-cells (lower). The miR-92 overexpression and the control R26MER/MER MEFs were synchronized by serum starvation and were collected 12 hr after being released into serum culture conditions to determine the c-Myc protein level. This synchronization approach in R26MER/MER MEFs has provided us with the most consistent measurement for c-Myc protein level, because it is regulated in a cell-cycle-dependent manner. (B) miR-92 overexpression decreases the turnover of c-Myc protein. Serum-synchronized R26MER/MER MEFs that overexpress either miR-92 or the control MSCV vector were released into the serum for 6 hr, treated with cycloheximide, collected at the indicated time points, then analyzed by western blot to determine the levels of MycER and the endogenous c-Myc protein. (C) Schematic representation of the two miR-92 binding sites in the murine fbw7 3′UTR. Additionally, a luciferase reporter and a FLAG tagged fbw7 ORF were each placed upstream of a wild-type fbw7 3′UTR, or a mutated fbw7 3′UTR that abolished the predicted miR-92 binding. (D) The expression of Luc-fbw7-3′UTR was specifically repressed by miR-92 in Dicer−/− HCT116, while mutations of the two putative miR-92 binding sites within the fbw7-3′UTR (Luc-fbw7-3′UTRMut) abolished this repression. (E) The endogenous fbw7 gene was downregulated by miR-92 post-transcriptionally. Both the endogenous fbw7 mRNA (left) and the endogenous Fbw7 protein (right) were repressed upon miR-92 overexpression in R26MER/MER MEFs. Due to the lack of a proper antibody to detect endogenous Fbw7 in regular western analysis, we demonstrated the downregulation of endogenous Fbw7 by miR-92 using immunoprecipitation followed by immunoblotting with a polyclonal anti-Fbw7 antibody. (F) miR-92 enhances the accumulation of Cyclin E protein. Overexpression of miR-92 increased the accumulation of Cyclin E protein, which was further confirmed by the increased Cyclin E-dependent kinase activity. (G) The knockdown of fbw7 resembles the effect of miR-92 to enhance c-Myc-induced apoptosis. Knocking down fbw7 in R26MER/MER MEFs enhanced c-Myc-induced apoptosis, partially recapitulating the phenotype caused by miR-92 overexpression. Apoptosis was quantitatively measured by Annexin V staining in two independent lines of R26MER/MER MEFs upon serum starvation and 4-OHT treatment. (H) Overexpression of fbw7 abolished the apoptotic effects of miR-92 in R26MER/MER MEFs. R26MER/MER MEFs were doubly infected by pRetro-fbw7αΔ3′UTR-IRES-dsRed and MSCV-miR-92. The c-Myc-induced apoptosis was quantitatively measured by Annexin V staining in doubly infected R26MER/MER MEFs upon serum starvation and 4-OHT treatment. Error bars represent standard deviation). *p<0.05; **p<0.01.
Figure 5—figure supplement 1

miR-92 overexpression enhances c-Myc protein level by repressing Fbw7.
(A) miR-92 overexpression did not affect c-myc mRNA levels in two independent primary B-cells. (B) The c-Myc dosage determines the degree of c-Myc-induced apoptosis in R26MER/MER MEFs. When R26MER/MER MEFs were compared with R26MER/+ MEFs, a twofold increase in the MycERT2 dosage significantly enhanced the c-Myc-induced apoptotic response upon serum starvation. This effect was observed in R26MER/MER MEFs either with or without miR-92 overexpression. (C) Negative regulators of c-Myc that contain a putative miR-92 binding site(s) were screened for miR-92-mediated repression in R26MER/MER MEFs that overexpress miR-92 or a control MSCV vector. Only fbw7 exhibited a miR-92–mediated repression. (Error bars indicate standard deviation, n = 3, **p<0.01). (D) The expression of FLAG-fbw7-3′UTR was significantly repressed by miR-92 in Dicer−/− HCT116 cells. (E) fbw7 is downregulated in Eμ-myc lymphomas that overexpress miR-92. A panel of Eμ-myc/MSCV (n = 9), Eμ-myc/17-92 (n = 7), Eμ-myc/17-92Δ92 (n = 6) and Eμ-myc/17-92Mut92 (n = 5) lymphomas were compared for their expression level of endogenous fbw7. Eμ-myc/17–92 lymphomas exhibited a specific decrease of fbw7 compared to the other genotypes, possibly due to the miR-92 overexpression. (F) The c-MYC upregulation by miR-92 requires an intact fbw7. The effect of miR-92 to upregulate c-MYC protein level was observed in wild-type Hct116 cells, but largely absent in FBW7−/− Hct116 cells. (G) fbw7 knockdown by RNAi in R26MER/MER MEFs recapitulated the c-Myc upregulation by miR-92. (H) fbw7 expression level in R26MER/MER MEFs infected with pRetroX-fbw7-IRES-DsRedExpress. Error bars indicate standard deviation, *p<0.05; **p<0.01.
Figure 6 with 1 supplement
The antagonistic interaction between miR-19 and miR-92 regulates the balance between proliferation and apoptosis.
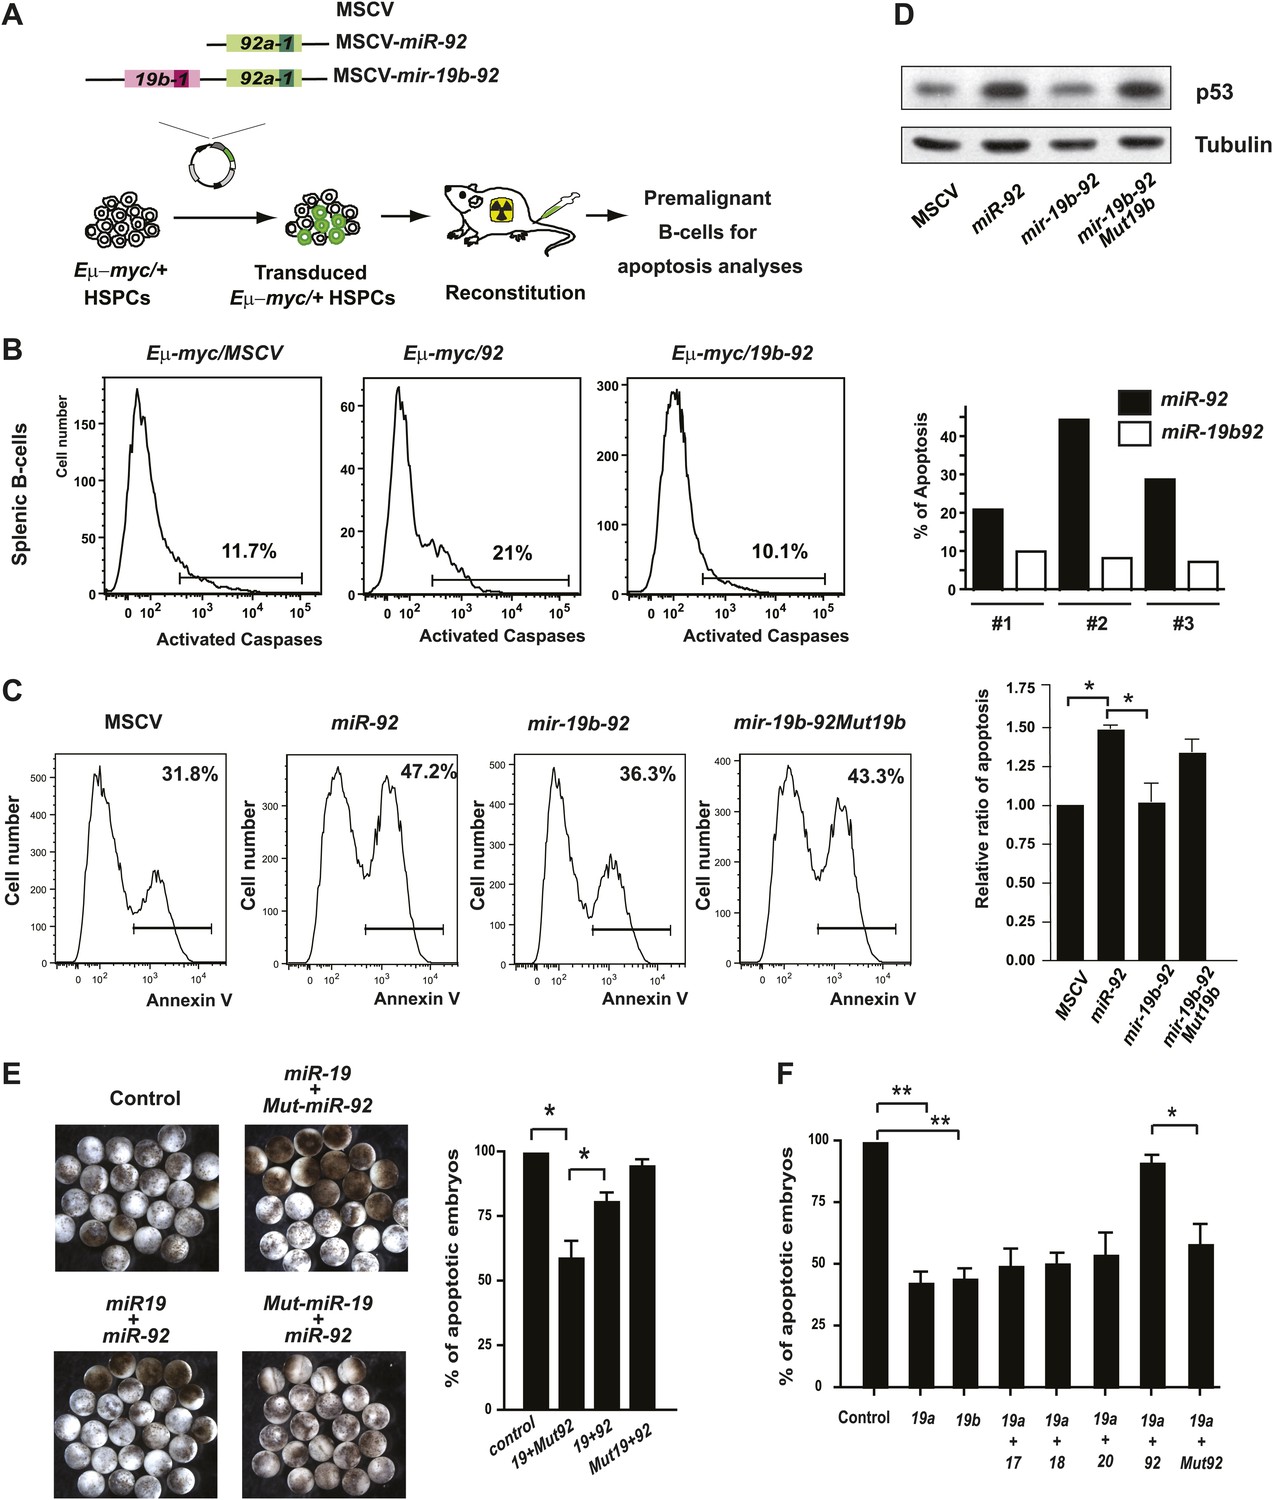
(A) The schematic representation of the Eμ-myc adoptive transfer model to evaluate the functional interaction between miR-92 and miR-19 in vivo. Light colored boxes, pre-miRNAs; dark colored boxes, mature miRNAs. (B) miR-19 antagonizes the apoptotic effects of miR-92 in vivo. miR-92 overexpression in the Eμ-myc adoptive transfer model enhanced apoptosis in premalignant Eμ-myc splenic B-cells, while the mir-19b-92 dicistron expression abolished this apoptotic effect (left three panels). A quantitative analysis of apoptosis by FACS was shown for three independent, well-controlled experiments (right). (C) miR-19b dampens the miR-92-induced apoptosis in MycERT2 activated R26MER/MER MEFs. R26MER/MER MEFs were infected by miR-92, mir-19b-92, mir-19b-92Mut19b and the MSCV control vector, and were subsequently serum starved and treated with 4-OHT to activate MycERT2. Apoptosis in these samples was measured quantitatively using Annexin V staining (left four panels). The extent of apoptosis induced by MSCV, miR-92, mir-19b-92, mir-19b-92Mut19b was normalized to that of MSCV infected R26MER/MER MEFs and then averaged from four independent experiments (right). (D) miR-19b dampens the miR-92-induced p53 activation. R26MER/MER MEFs that overexpress the indicated constructs (miR-92, mir-19b-92Mut19b and mir-19b-92) were collected 48 hr after infection and then analyzed by western blot to determine the level of p53 protein. (E) miR-92 and miR-19 exhibit antagonistic effects to regulate hydroxyurea (HU)-induced cell death in Xenopus embryos. Representative images of HU-treated Xenopus embryos that were co-injected with human Ago2 and the indicated miRNA mimics (left). Co-injection of miR-92 dampened the cell survival effects of miR-19 on HU-induced apoptosis (right, n = 3, with >20 embryos in each group). (F) miR-92 exhibits a specific antagonistic interaction with miR-19. Injection of miR-19a or miR-19b rescued HU-induced apoptosis in Xenopus embryos. Co-injection of miR-92, but not a mutated miR-92, or other mir-17-92 components, dampened the cell survival effect of miR-19 (n = 3, with >20 embryos in each group). Error bars represent standard deviation, *p<0.05; **p<0.01.
Figure 6—figure supplement 1
Functional antagonism between miR-19:miR-92 regulates the balance between proliferation and apoptosis.
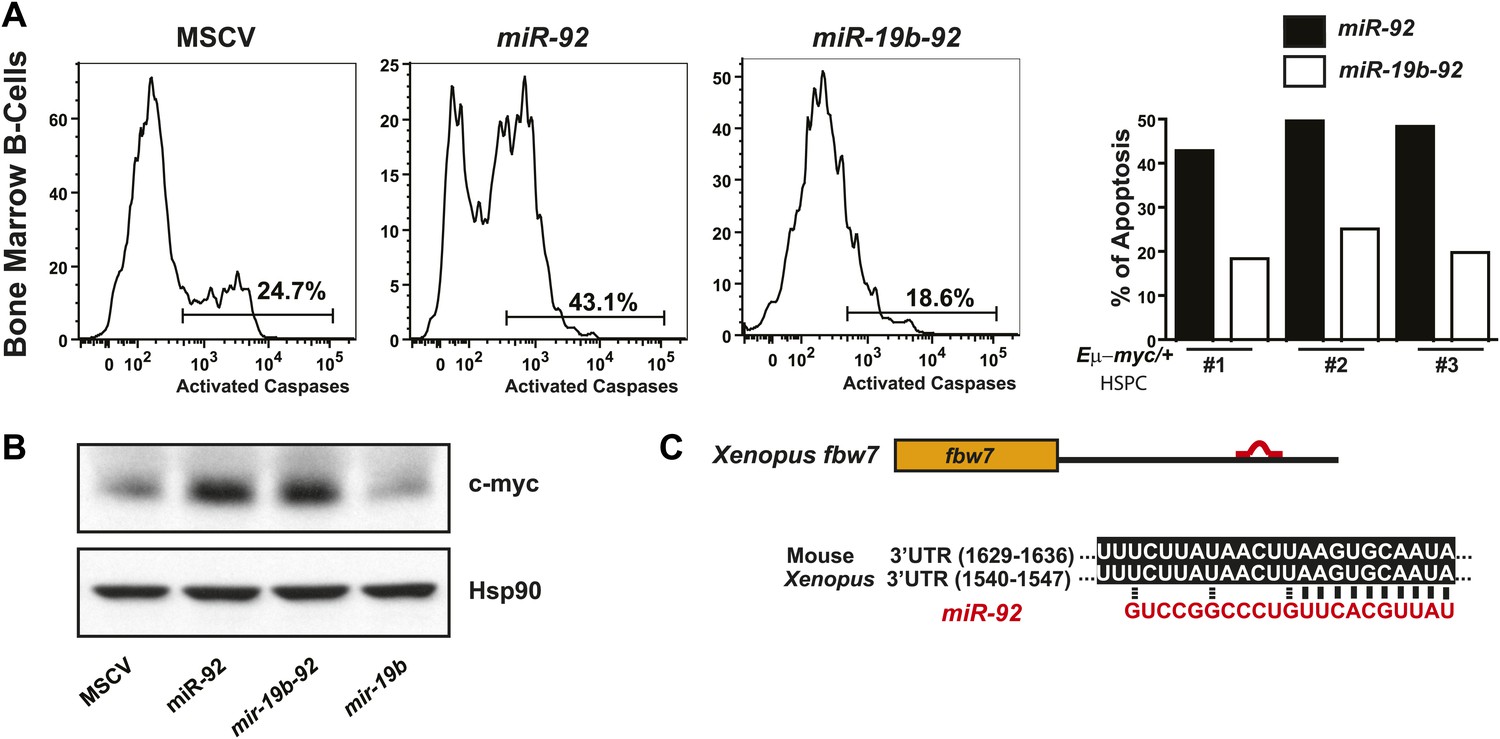
(A) miR-19 antagonizes the apoptotic effects of miR-92 in vivo. miR-92 overexpression enhanced apoptosis in premalignant Eμ-myc bone marrow B-cells in vivo, while co-expression of miR-19 and miR-92 as a dicistron (mir-19b-92) abolished this apoptotic effect (left three panels). A quantitative analysis of apoptosis by FACS was shown for three independent experiments (right). (B) miR-19 has no effects on the level of c-Myc protein. While miR-92 overexpression significantly enhanced the level of c-Myc in R26MER/MER MEFs, co-expression of miR-19b and miR-92 did not reverse the increase in c-Myc expression. In addition, miR-19b expression alone did not impact the dosage of c-Myc protein. (C) Xenopus fbw7 contains one predicted target site for miR-92. This predicted miR-92 binding site is conserved between Xenopus and mouse.
Figure 7
The miR-19:miR-92 antagonism is disrupted during malignant transformation.
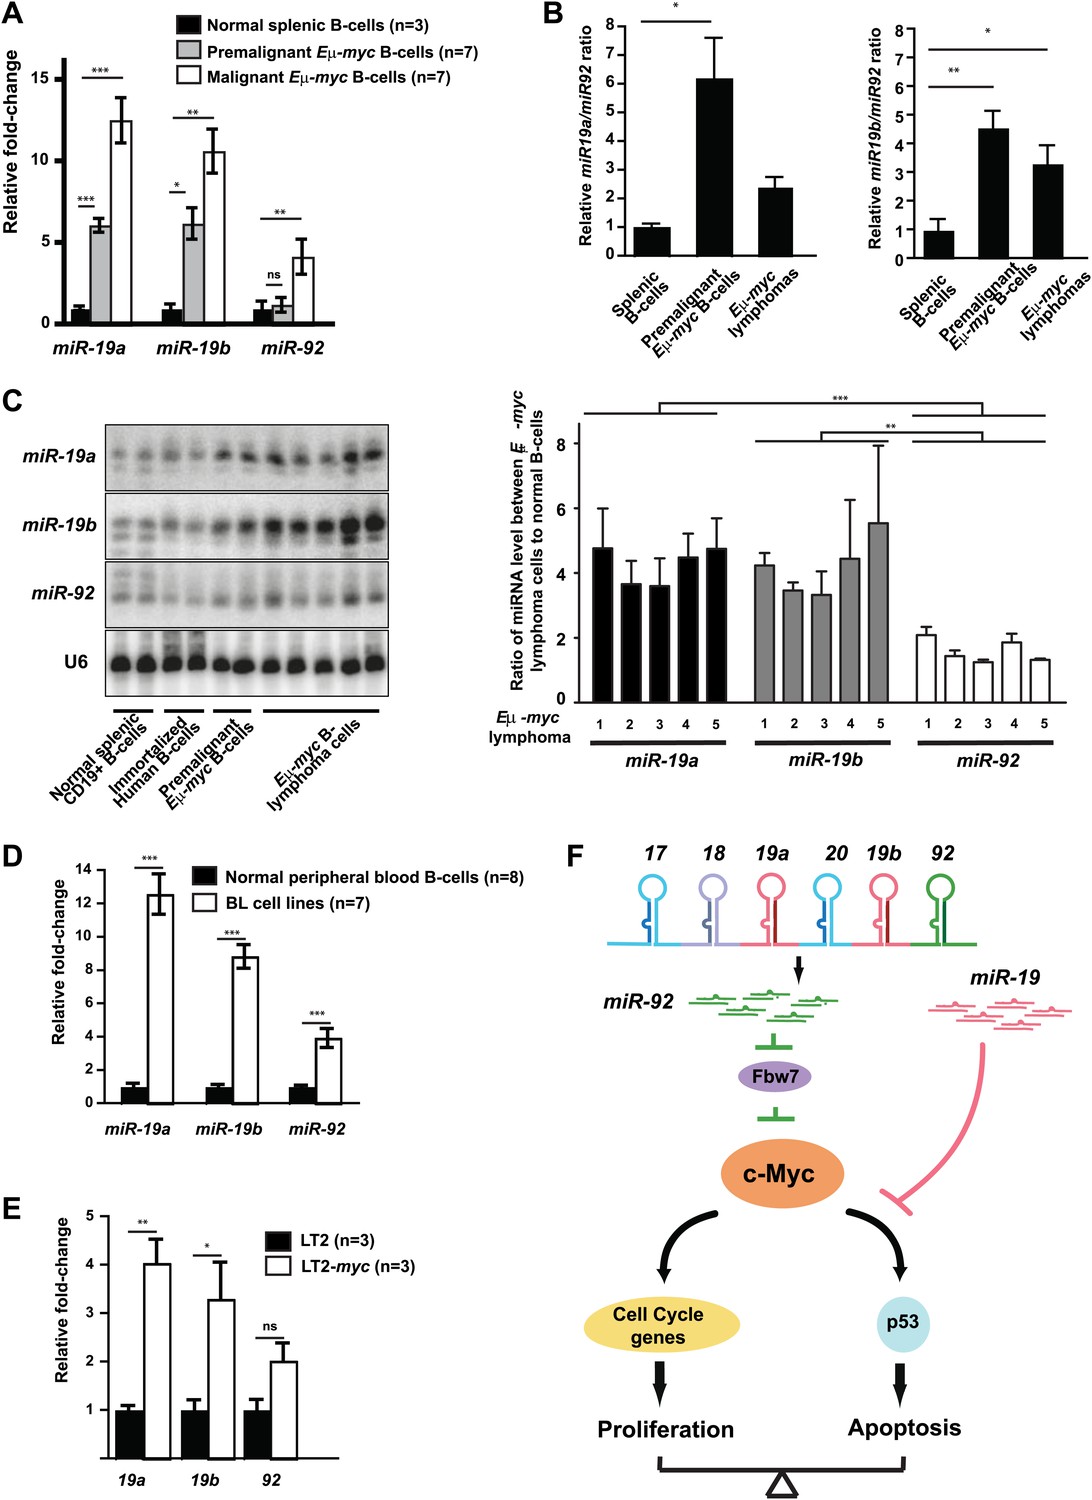
(A and B) Compared to normal splenic B-cells, premalignant and malignant Eμ-myc B-cells favored a greater increase in mature miR-19 (miR-19a and miR-19b) than miR-92. The purified normal splenic B-cells, premalignant Eμ-myc bone marrow B-cells and malignant Eμ-myc B-lymphoma cells were subjected to Taqman miRNA assays to determine the expression level of miR-19a, miR-19b and miR-92. Comparing premalignant/malignant Eμ-myc B-cells vs normal splenic B-cells, all three miRNAs exhibited an increased level, although the increase in miR-19a or miR-19b was significantly higher than that of miR-92 (A). In the same experiment, the relative ratios for miR-19a:miR-92 and miR-19b:miR-92 were measured for all normal splenic B-cells and Eμ-myc B-cells (B). (C) Mature miR-19 and miR-92 are differentially expressed in normal splenic B-cells and Eμ-myc B-lymphoma cells. The normal splenic B-cells, immortalized human B-cells, premalignant Eμ-myc/+ B-cells, and Eμ-myc/+ B-lymphoma cells were subjected to Northern analysis. Compared to normal splenic B-cells, both malignant and premalignant Eμ-myc/+ B-cells favored a greater increase of miR-19 than miR-92. (D) Compared to normal B-cells isolated from peripheral blood, human Burkitt’s lymphoma cell lines favor a greater increase in mature miR-19 than miR-92. (E) Compared to normal livers (LT2), mouse hepatocellular carcinomas caused by the inducible c-Myc over-expression (LT2-myc) favor a greater increase in mature miR-19 than miR-92. (F) A diagram describes our proposed model to explain the functional interactions between miR-92 and miR-19 in c-Myc-induced B-lymphomagenesis. Aberrant c-Myc expression couples rapid proliferation and p53-dependent apoptosis. miR-92 overexpression further increases c-Myc dosage to strengthen this coupling, at least in part by repressing Fbw7. This miR-92 effect ensures a potent mechanism to eliminate premalignant c-Myc overexpressing cells. Interestingly, miR-92 and can be antagonized by the survival effects of the miR-19 miRNAs encoded by the same mir-17-92 miRNA polycistron. Taken together, while miR-19 miRNAs repressed c-Myc-induced apoptosis to promote the oncogenic cooperation between mir-17-92 and c-Myc, miR-92 exhibits a negative regulation. Thus, the antagonistic interactions between miR-92 and miR-19 confer an intricate crosstalk between proliferation and apoptosis. Error bars represent standard deviation, *p<0.05; **p<0.01, ***p<0.001.
Tables
Table 1
Flow cytometric immunophenotyping of Eμ-myc lymphomas with enforced expression of different mir-17-92 derivatives
https://doi.org/10.7554/eLife.00822.006| Genotype | n | Percentage (%) | Immunotype |
|---|---|---|---|
| Eμ-myc/MSCV | 4 | 40 | B220+, IgM−, CD19+, CD4−, CD8− |
| 6 | 60 | B220+, IgM+, CD19+, CD4−, CD8− * | |
| Eμ-myc/17–92 | 4 | 40 | B220+, IgM−, CD19+, CD4−, CD8− |
| 5 | 50 | B220+, IgM+, CD19+, CD4−, CD8− † | |
| 1 | 10 | B220−, IgM−, CD19−, CD4+, CD8+ | |
| Eμ-myc/17–92Mut92 | 7 | 70 | B220+, IgM−, CD19+, CD4−, CD8− |
| 3 | 30 | B220+, IgM+, CD19+, CD4−, CD8− ‡ | |
| Eμ-myc/1792Δ92 | 8 | 80 | B220+, IgM−, CD19+, CD4−, CD8− |
| 2 | 20 | B220+, IgM+, CD19+, CD4−, CD8− § |
-
*
1 out of 6 samples predominantly contains IgM+ cells, with a small percentage of IgM− cells.
-
†
3 out of 5 samples predominantly contain IgM+ cells, with a small percentage of IgM− cells.
-
‡
1 out of 3 samples predominantly contains IgM+ cells, with a small percentage of IgM− cells.
-
§
1 out of 2 samples predominantly contains IgM+ cells, with a small percentage of IgM− cells.
Download links
A two-part list of links to download the article, or parts of the article, in various formats.
Downloads (link to download the article as PDF)
Open citations (links to open the citations from this article in various online reference manager services)
Cite this article (links to download the citations from this article in formats compatible with various reference manager tools)
A component of the mir-17-92 polycistronic oncomir promotes oncogene-dependent apoptosis
eLife 2:e00822.
https://doi.org/10.7554/eLife.00822


