MYBL2 is a sub-haploinsufficient tumor suppressor gene in myeloid malignancy
- University Hospital Essen, Germany
- Dana-Farber Cancer Institute, United States
- MD Anderson Cancer Center, United States
- University of Helsinki, Finland
- University of California, San Francisco, United States
- Children’s Hospital Oakland Research Institute, United States
- Brigham and Women’s Hospital, United States
Figures
Figure 1 with 3 supplements
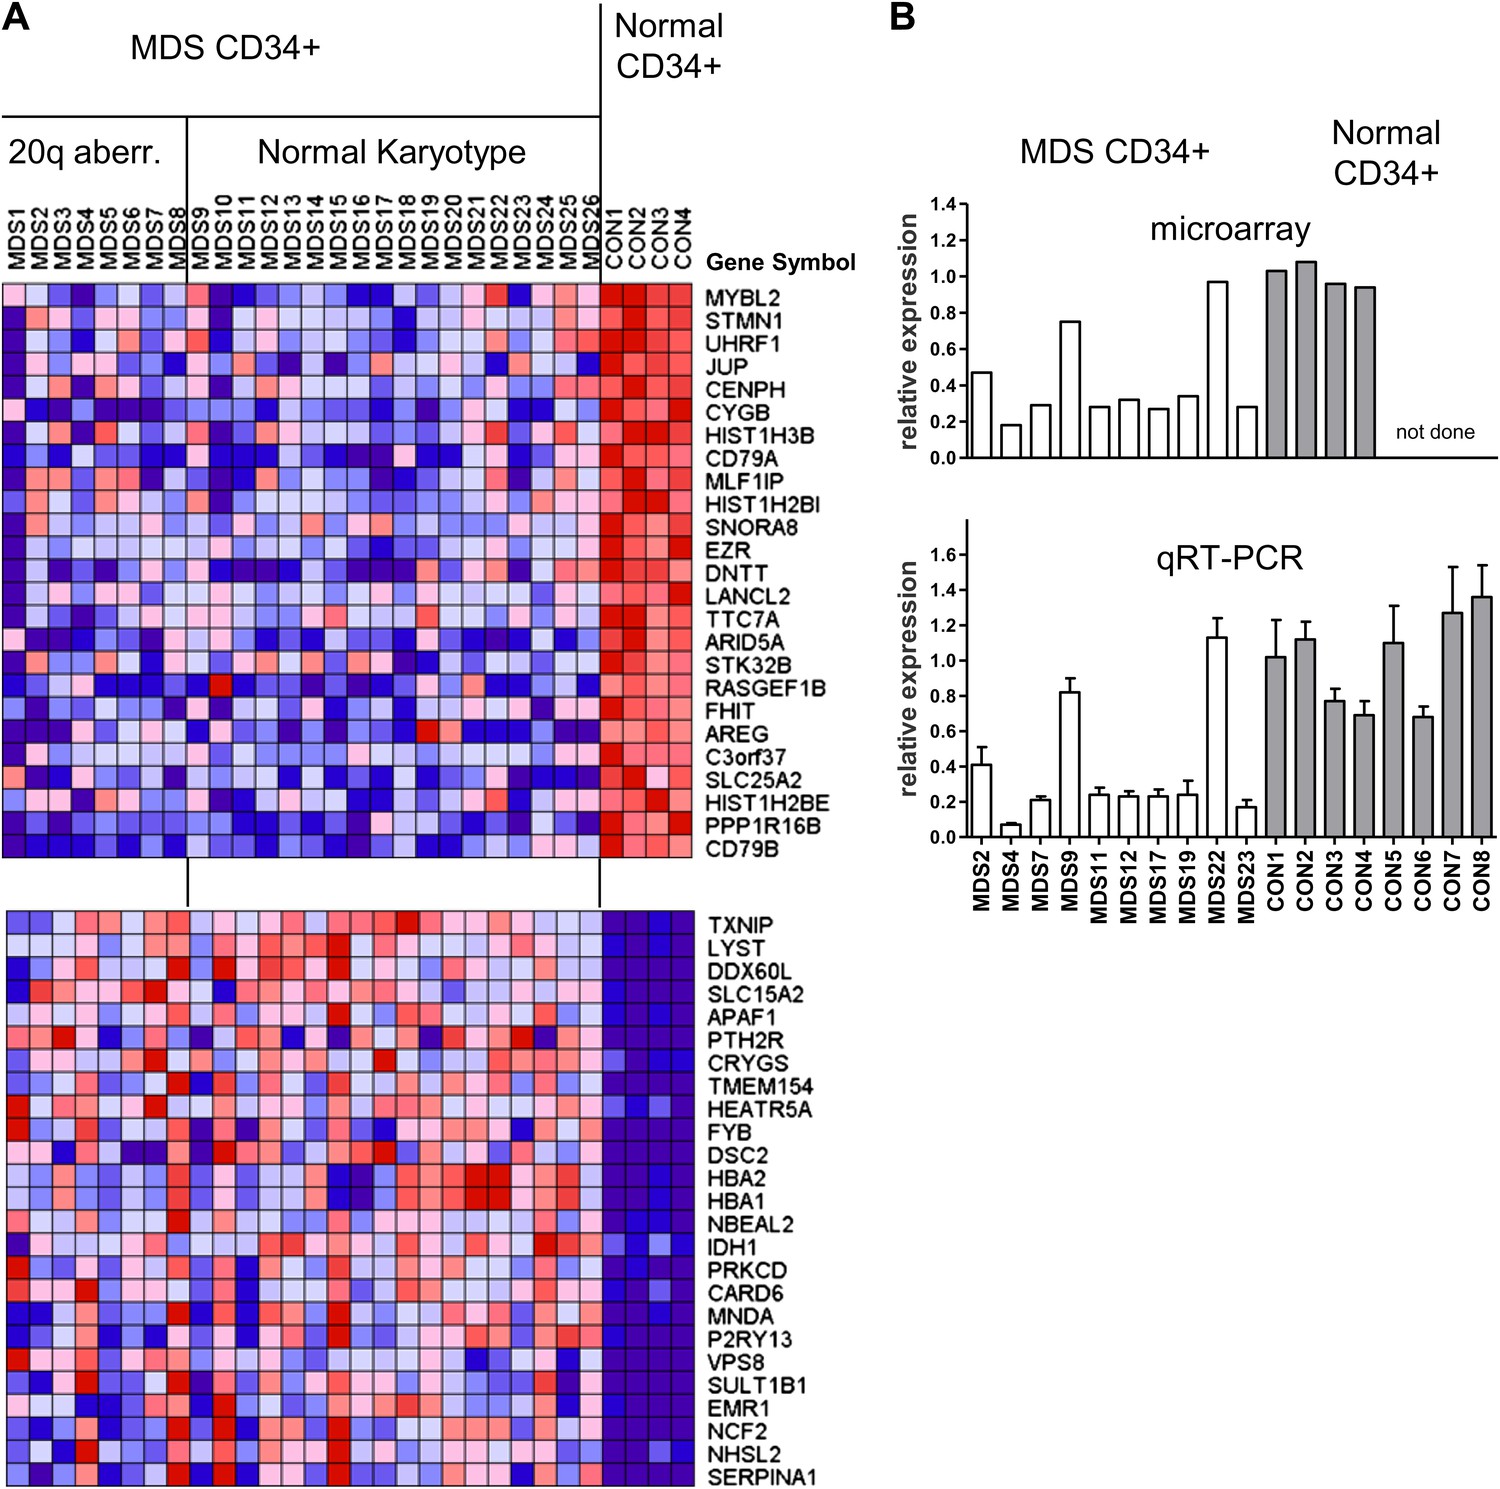
Gene expression analysis of CD34+ cells from MDS patients with a 20q aberration or a normal karyotype.
(A) Heat map showing the top-scoring 25 genes that were either up- or downregulated in CD34+ cells from 26 MDS patients vs normal donors (see Supplementary file 1A for patient characteristics). Genes were considered differentially expressed if they met two criteria: q ≤ 0.006 and fold-change ≥2.0 (108 genes). (B) Validation of microarray-based MYBL2 gene expression data for selected clinical samples (upper panel) by qRT-PCR analysis (lower panel), including four additional samples of normal CD34+ bone marrow cells. Relative MYBL2 expression results by qRT-PCR analysis were normalized to three control genes.
Figure 1—figure supplement 1
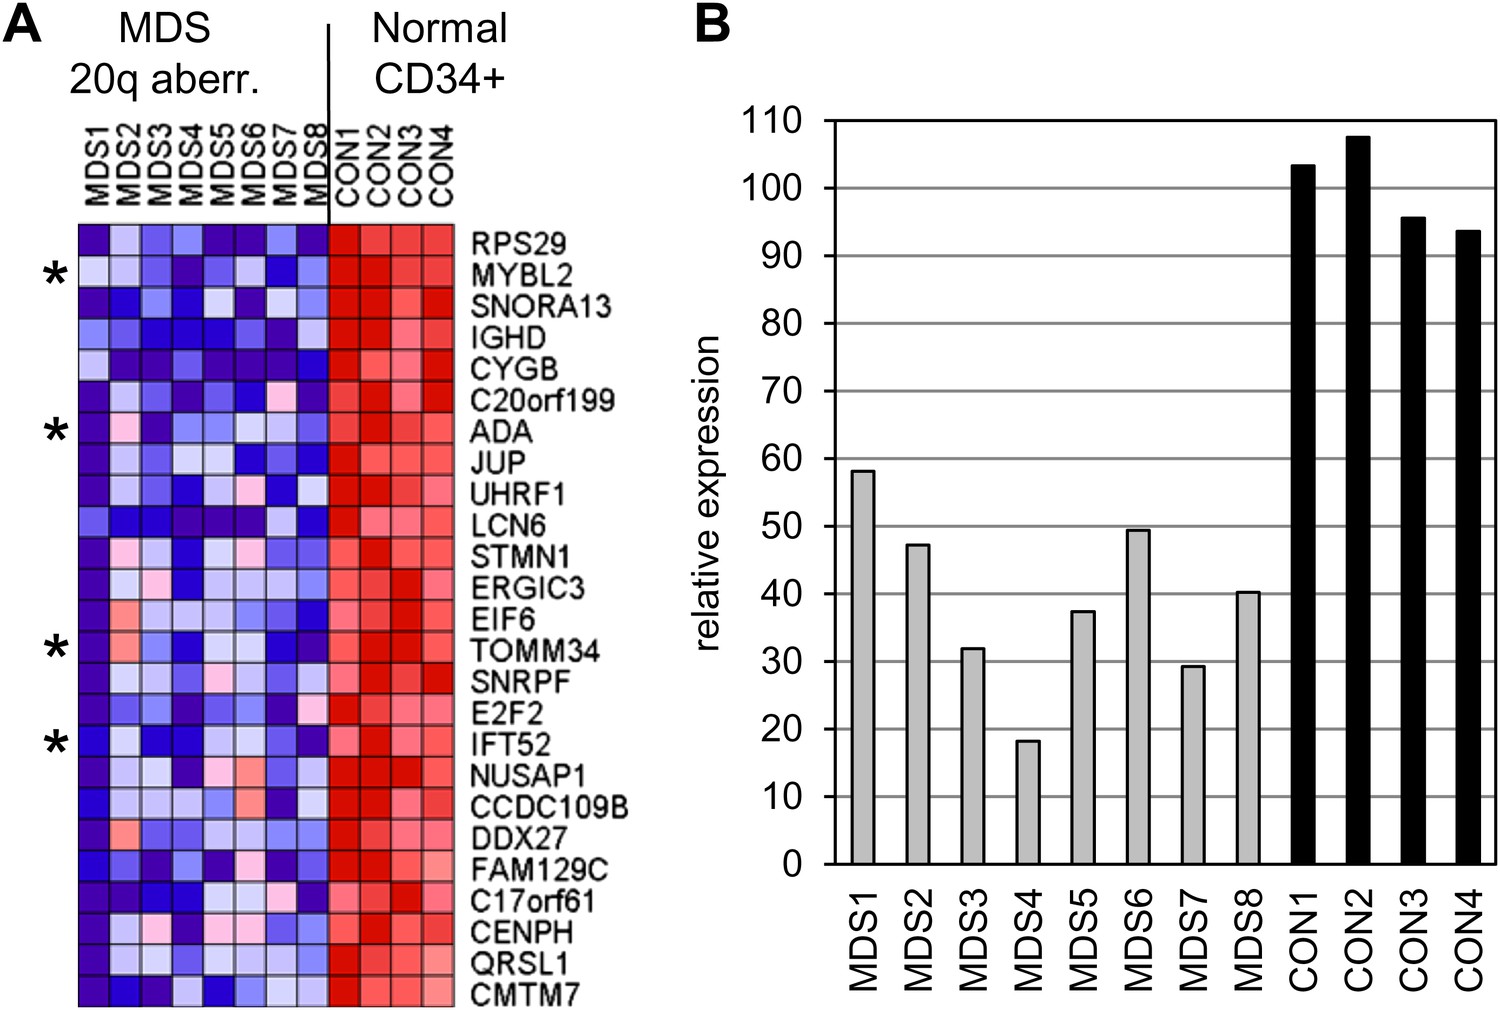
Gene expression analysis comparing CD34+ MDS cells with a 20q aberration to normal CD34+ cells.
(A) Heat map showing the top 25 downregulated genes. A two class comparison was performed using q ≤ 0.006 and fold-change ≥2.0 as criteria. Asterisks indicate genes located within the 20q CDR. (B) Bar chart illustrating MYBL2 expression levels corresponding to row 2 of the heat map.
Figure 1—figure supplement 2
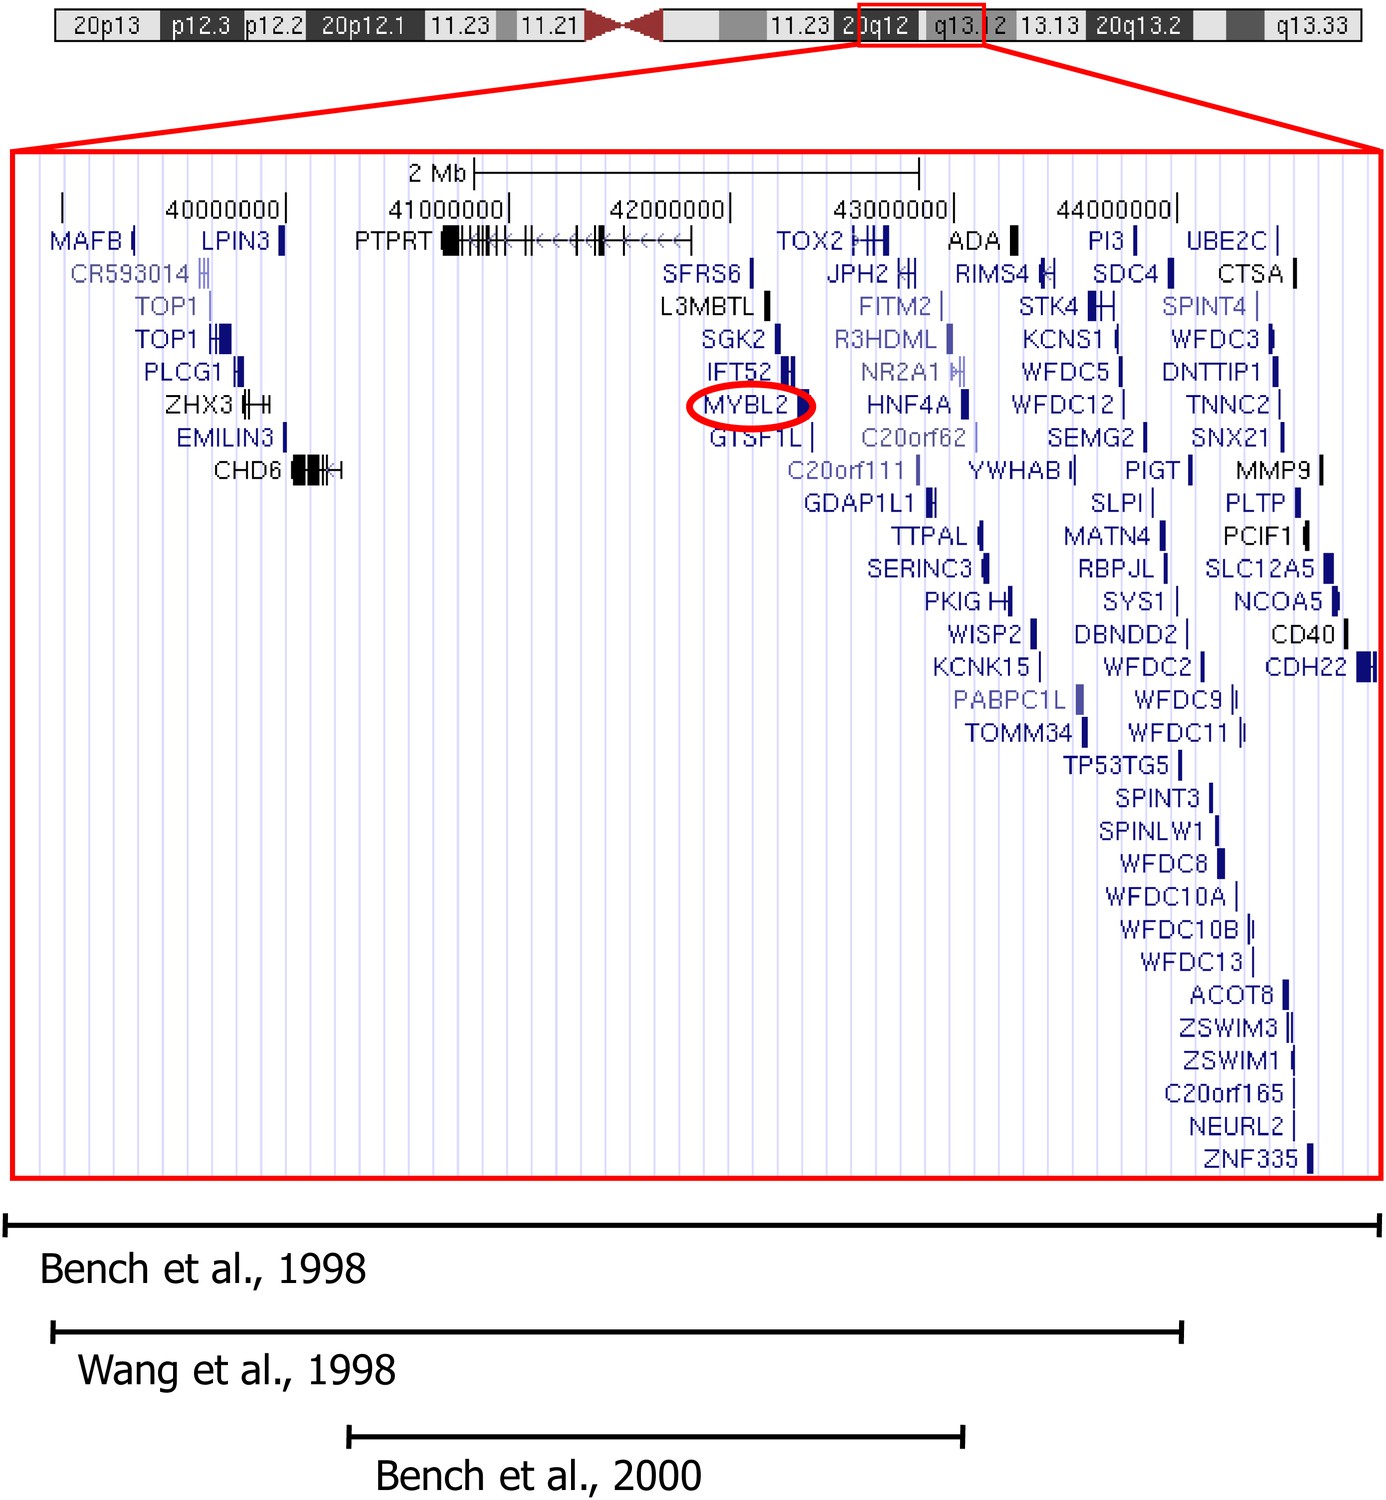
Genomic map of the chromosome 20 CDR.
The boundaries are based on the markers D20S465 and D20S17 according to Bench et al. (1998) and the location of MYBL2 is highlighted by a red circle. All regions delineated in the publications below included the MYBL2 genomic locus. The map was generated from the hg19 assembly of the UCSC genome browser (http://genome.ucsc.edu).
Figure 1—figure supplement 3
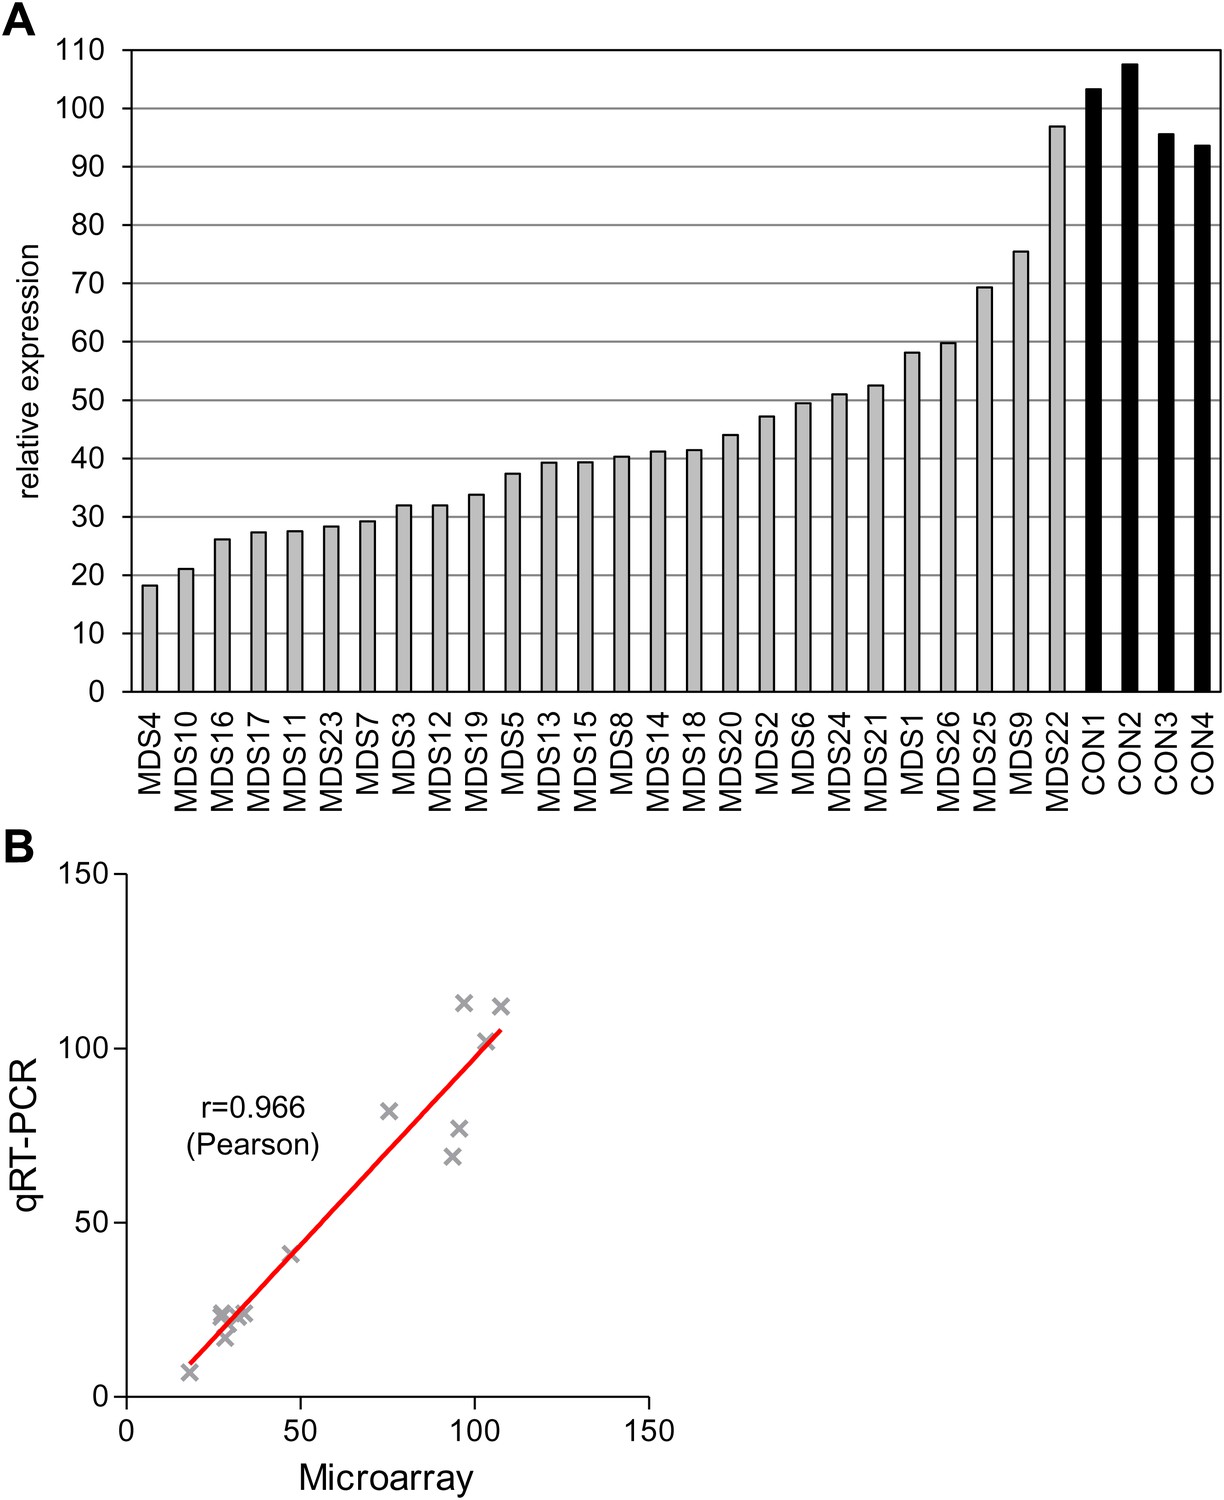
MYBL2 expression levels.
(A) MYBL2 expression was determined by microarray analysis. Normalized fluorescence intensity values are displayed as percentages of the mean expression levels of MYBL2 in CD34+ cells from normal bone marrow. (B) Correlation analysis of qRT-PCR and microarray expression data. The Pearson correlation coefficient is 0.966.
Figure 2 with 2 supplements
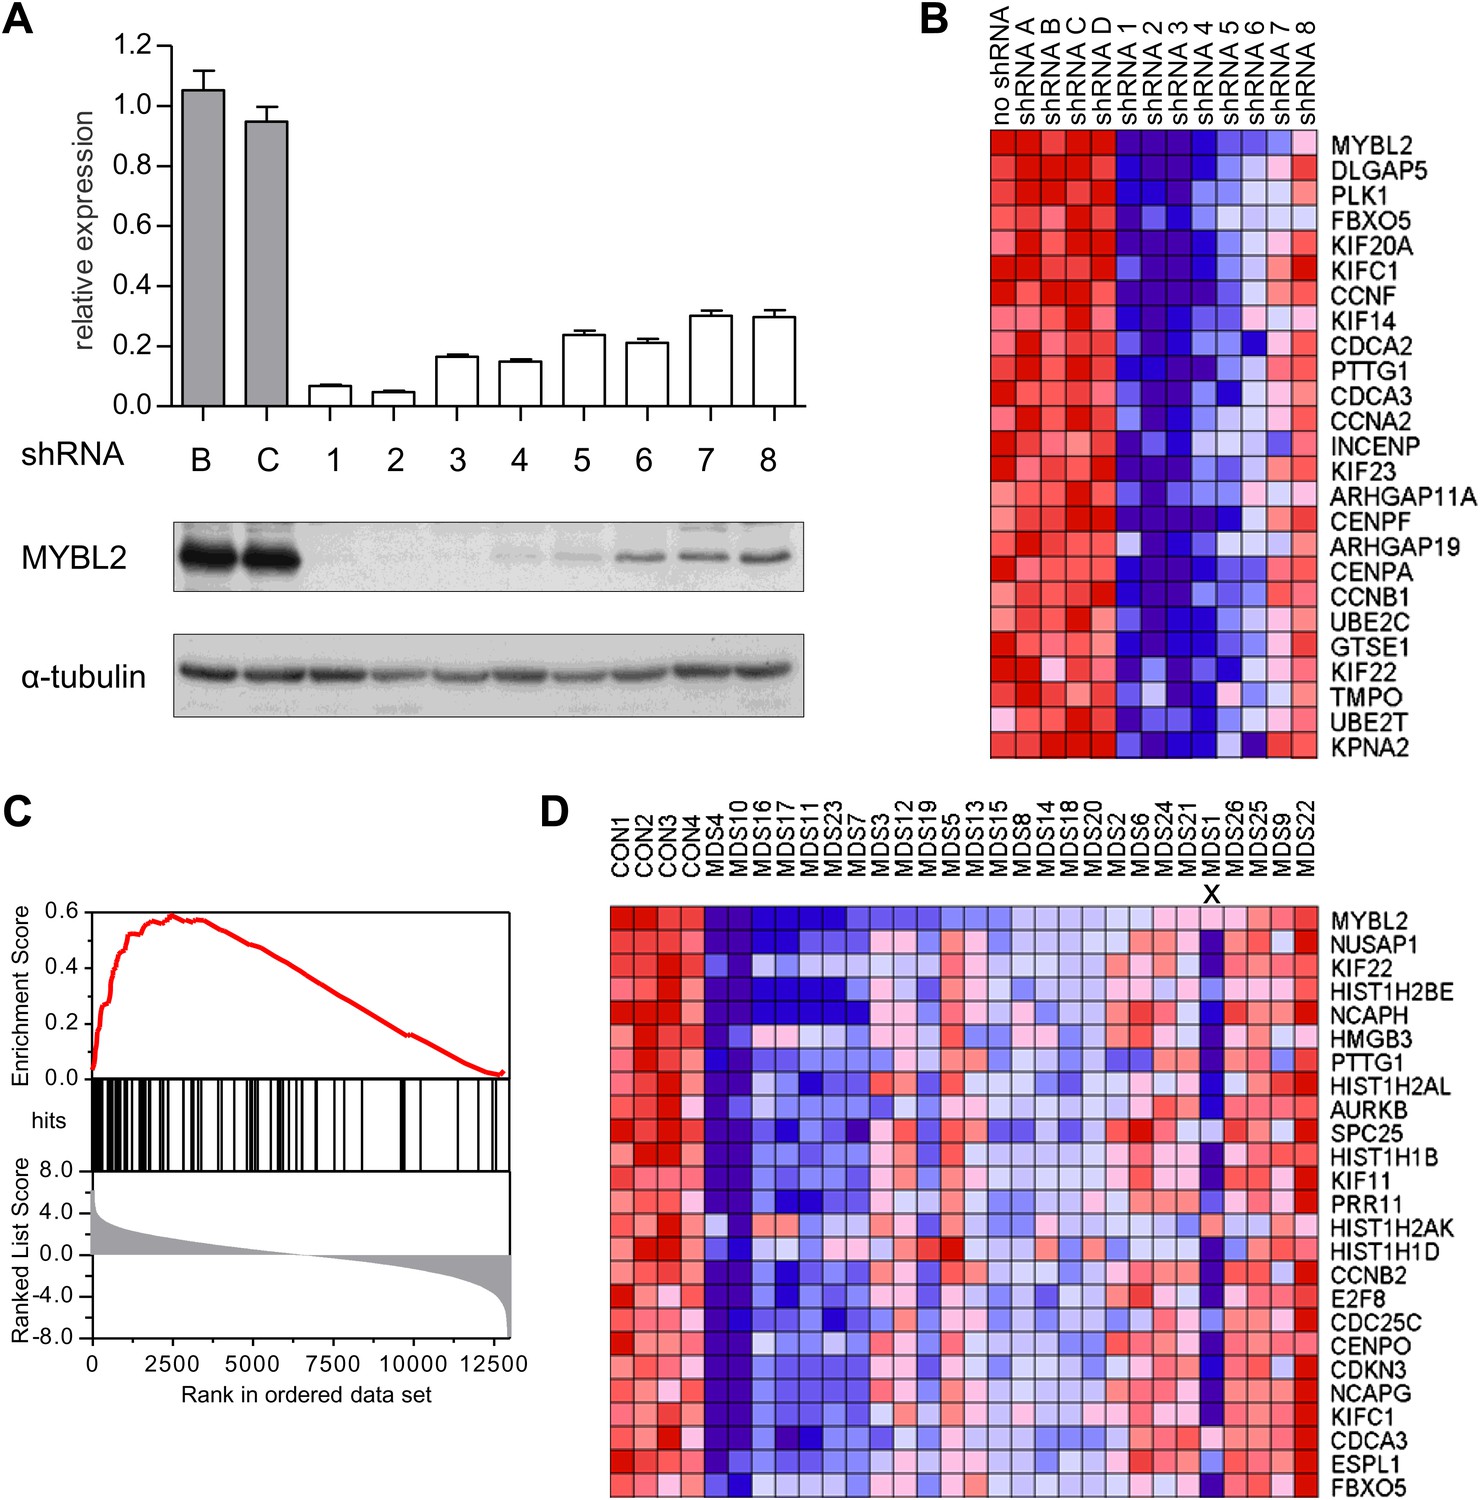
Identification of an MYBL2-regulated gene expression signature and its enrichment in CD34+ cells from MDS patients.
(A) MYBL2 knockdown in SKM1 cells by a series of shRNAs (control shRNAs are labeled B and C; MYBL2-specific shRNAs are labeled 1–8). MYBL2 expression levels were measured by qRT-PCR normalized to three control genes (upper panel) and by Western blotting with tubulin as a normalization control (lower panels). (B) Heat map of the top 25 genes whose expression levels positively correlated (score ≥ 0.8) with those of MYBL2. Gene expression in normal CD34+ cells was measured by microarray in one unperturbed sample (‘no shRNA’), four control shRNA-expressing samples (shRNAs A–D) and eight MYBL2-specific shRNA-expressing samples (shRNAs 1-8). (C) Gene set enrichment analysis (GSEA) of the MYBL2 gene signature (top 81 positively correlated genes) within the ranked gene expression results for CD34+ cells from MDS patients, compared to CD34+ cells from normal bone marrow. Enrichment of the MYBL2 signature in MDS bone marrow cells (see Figure 1A) is apparent. Genes are ranked by score and plotted on the x-axis; hits are indicated by vertical black bars and the enrichment score is plotted in red. (D) Heat map corresponding to the GSEA showing the 25 top-scoring genes. One sample, indicated by an ‘x’, shows enrichment of the MYBL2 signature, but relatively normal MYBL2 expression suggesting a measurement problem.
Figure 2—figure supplement 1
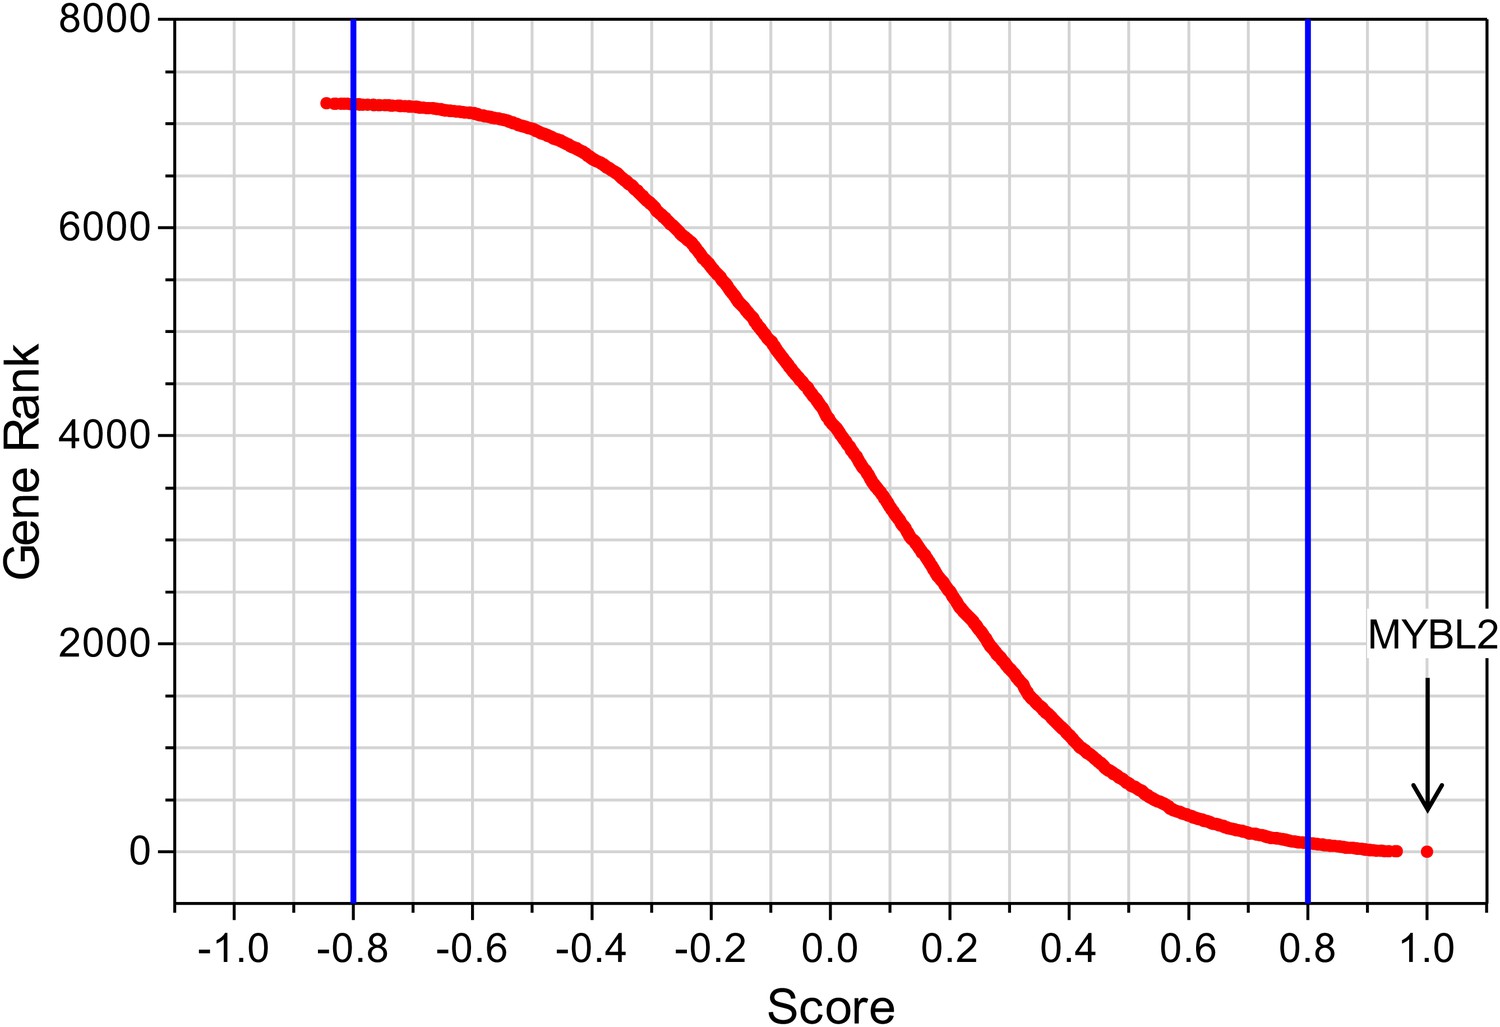
Gene expression analysis upon MYBL2 knockdown.
After exclusion of all nonexpressed genes, the remaining genes (7194) were rank-ordered according to their correlation score (Pearson) relative to MYBL2 expression. Using a cut-off score of ±0.8 (blue lines), 8 genes were found to be negatively correlated with MYBL2 knockdown (score < 0.8), while 81 were found to be positively correlated (score > 0.8).
Figure 2—figure supplement 2
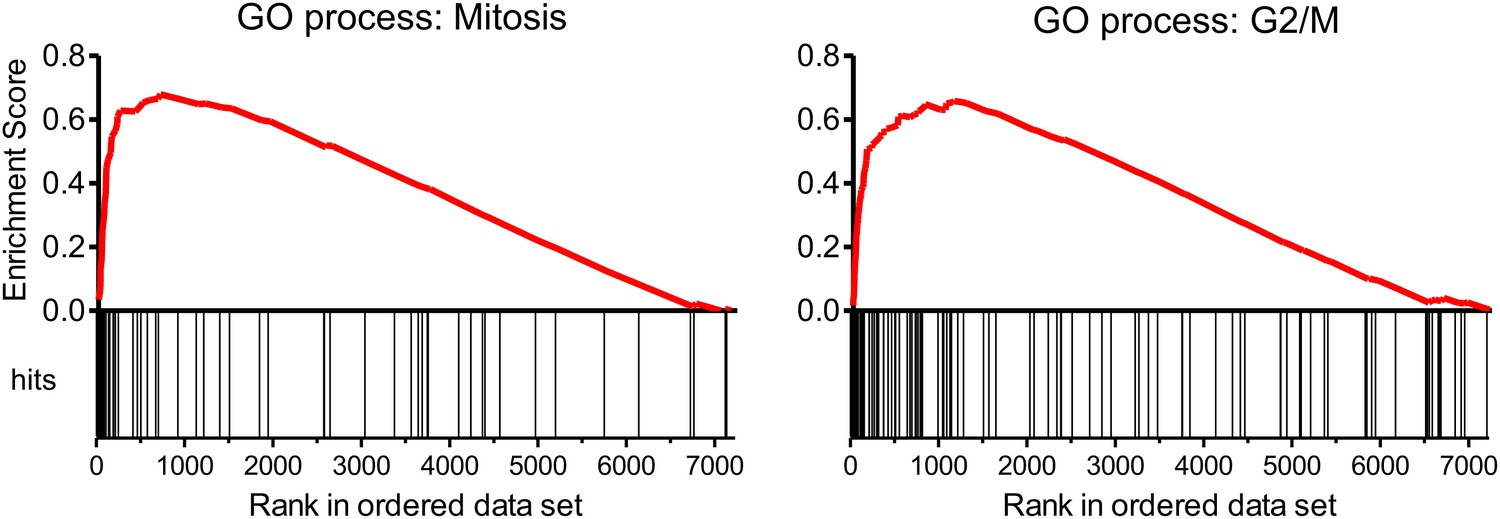
Gene set enrichment analysis (GSEA) of the expression profile of CD34+ cells upon MYBL2 knockdown.
The highest scoring subset using the ‘gene ontology processes’ gene sets of MSigDB (v3.0) was the ‘mitosis’ gene set (left panel). Gene sets reflecting distinct phases of the cell cycle were used to determine the prominent cycle phase, and the gene set ‘G2/M’ had the highest score (right panel).
Figure 3 with 1 supplement
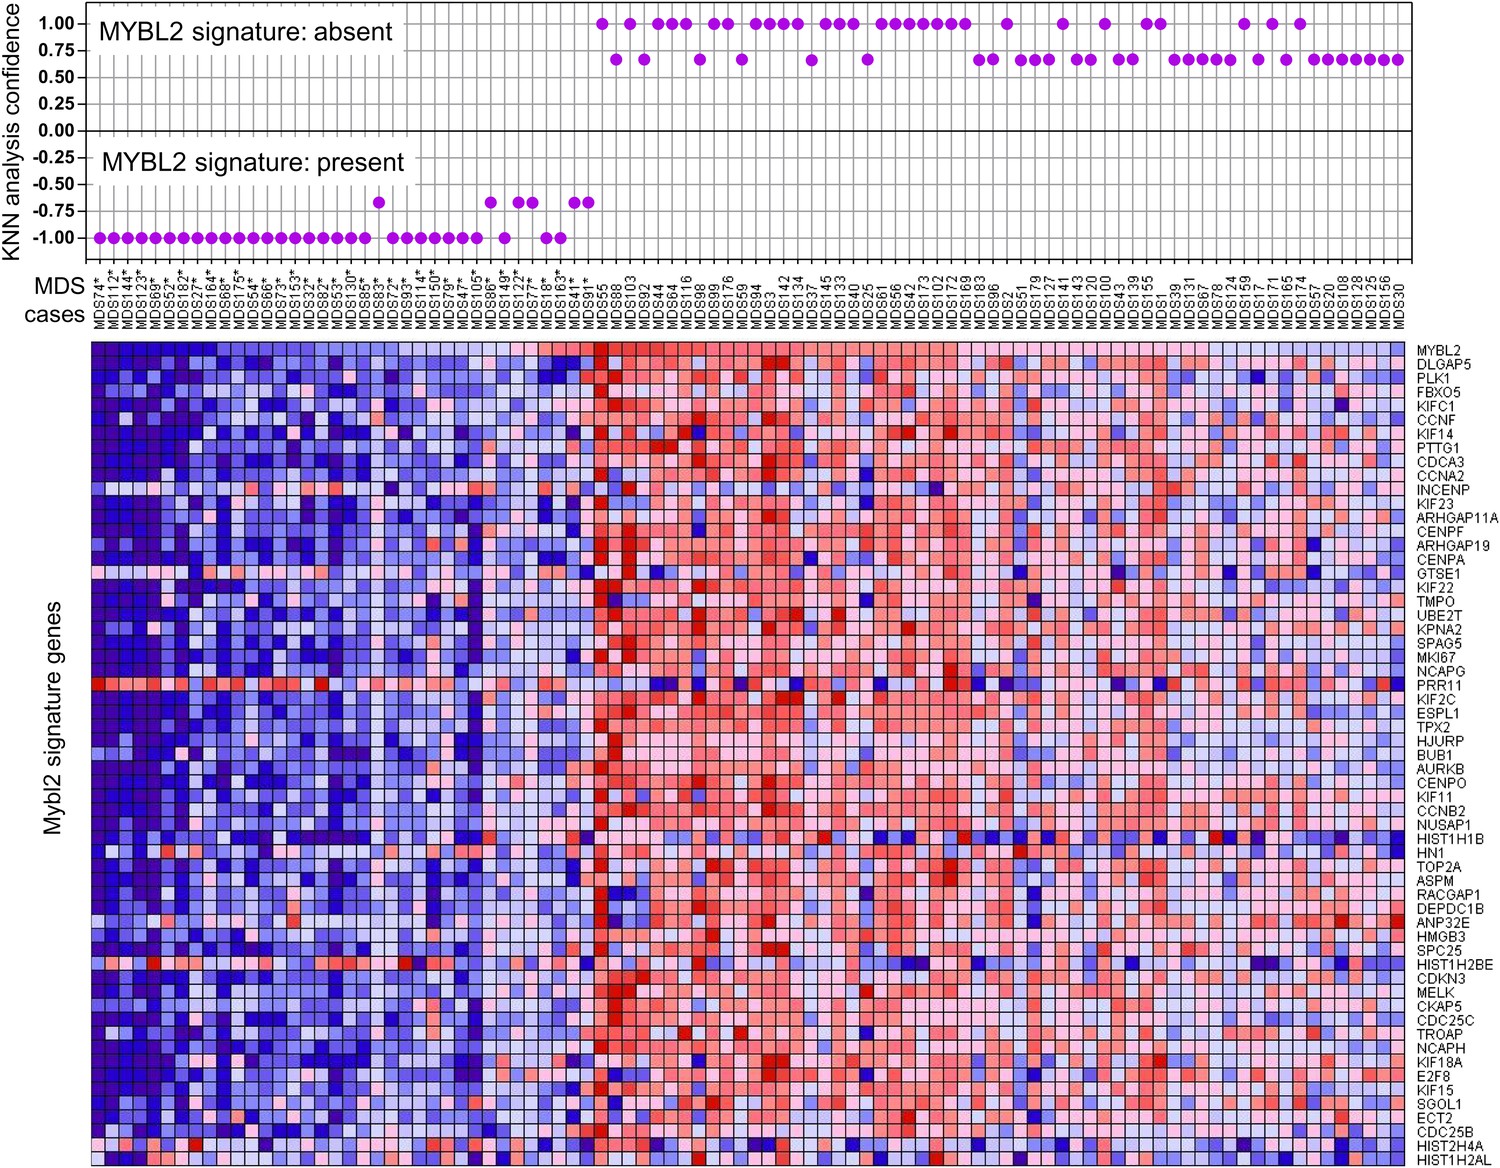
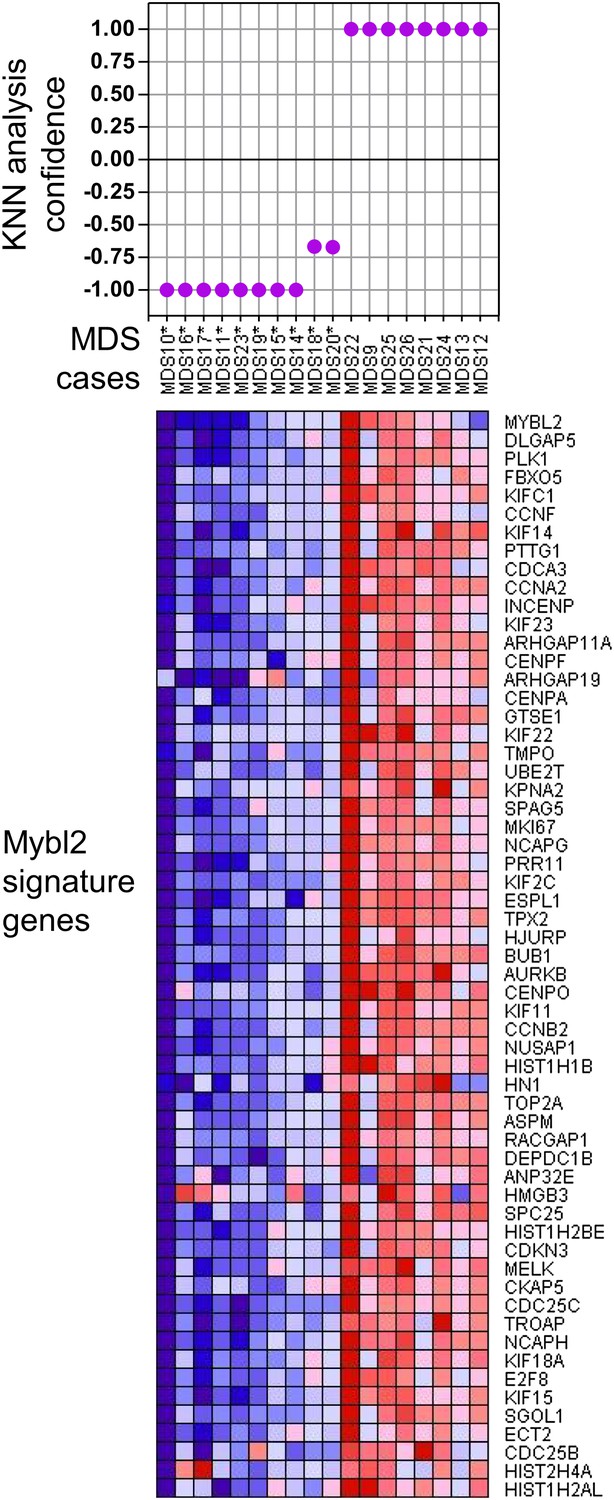
KNN classification for normal karyotype patient samples of an independent data set (Pellagatti et al., 2010).
A k-nearest-neighbor (KNN) classification model for patient samples was trained on our gene expression data set of CD34+ cells with or without MYBL2 knockdown by RNAi. Upper panel: KNN classification for the presence (negative values) or absence (positive values) for the MYBL2 signature using Euclidean distance (k = 3) to predict the class label by a majority vote. Lower panel: gene expression profile of MYBL2 signature genes. Note that some gene profiles (INCEP, GTSE1, PRR11, HIST1H1B, HIST1H2AL, HIST1H2BE, HIST2H4A, HN1) appear not to match the overall signatures most likely due to platform inconsistencies.
Figure 3—figure supplement 1
KNN classification for normal karyotype patient samples.
A k-nearest-neighbor (KNN) classification model for patient samples was trained on our gene expression data set of CD34+ cells with or without MYBL2 knockdown by RNAi. Upper panel: KNN classification for the presence (negative values) or absence (positive values) for the MYBL2 signature using Euclidean distance (k = 3) to predict the class label by a majority vote. Lower panel: gene expression profile of MYBL2 signature genes.
Figure 4 with 1 supplement
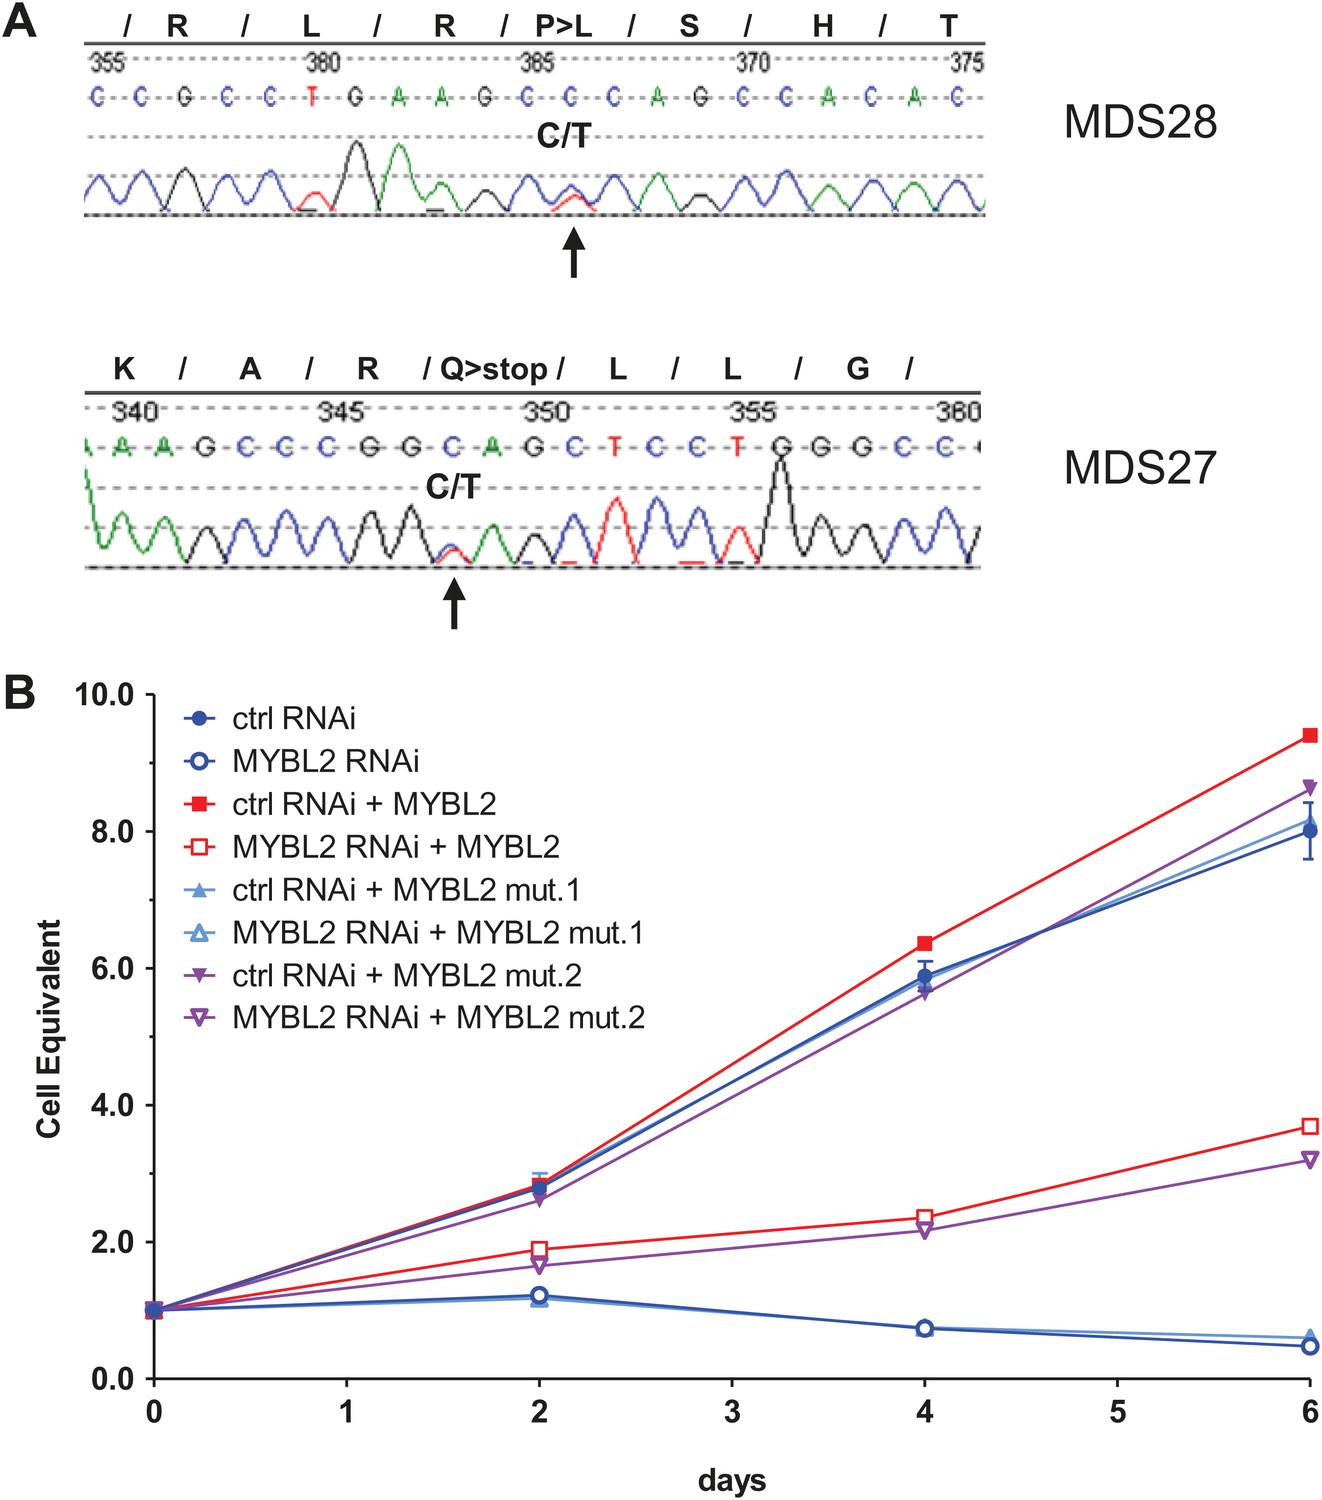
MYBL2 is mutated at a low frequency in MDS.
(A) MYBL2 exons were resequenced in the DNA of mononuclear bone marrow cells of 144 MDS patients. The results indicated a P-to-L aminoacid substitution (top, mutation 1, patient MDS28) and a nonsense mutation (bottom, mutation 2, patient MDS27). (B) Growth curves of SKM1 cells after transduction with a MYBL2 shRNA. SKM1 cells were transduced with an empty vector (circles), a vector expressing wildtype MYBL2 cDNA (squares), mutant MYBL2 cDNA (mut.1, triangles) or mutant MYBL2 cDNA (mut.2, diamonds). Upon transduction with a control (solid symbols) or a MYBL2-specific (open symbols) shRNA-expressing vector growth was monitored for 6 days.
Figure 4—figure supplement 1
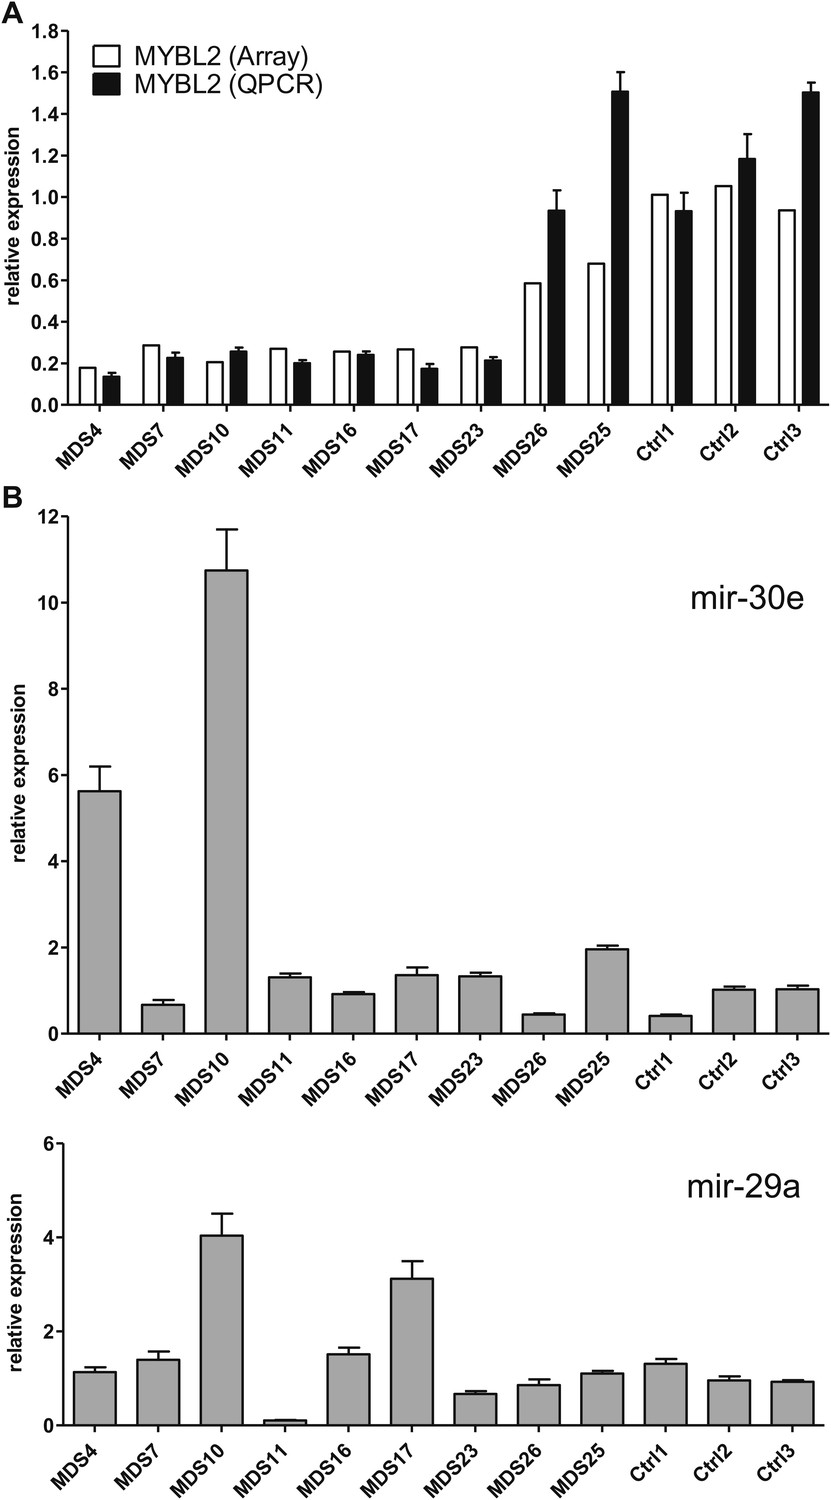
Analysis of Mybl2 expression in context with mir-29a and mir-30e expression in selected patient samples and controls.
(A) Confirmation of microarray-based MYBL2 gene expression data (white bars) by qRT-PCR analysis (black bars). Here, the same cDNA reaction was used for mRNA and miRNA expression analysis. (B) Relative expression levels of mir-30e and mir-29a determined by qRT-PCR analysis. Normalization was performed to three control genes.
Figure 5 with 3 supplements
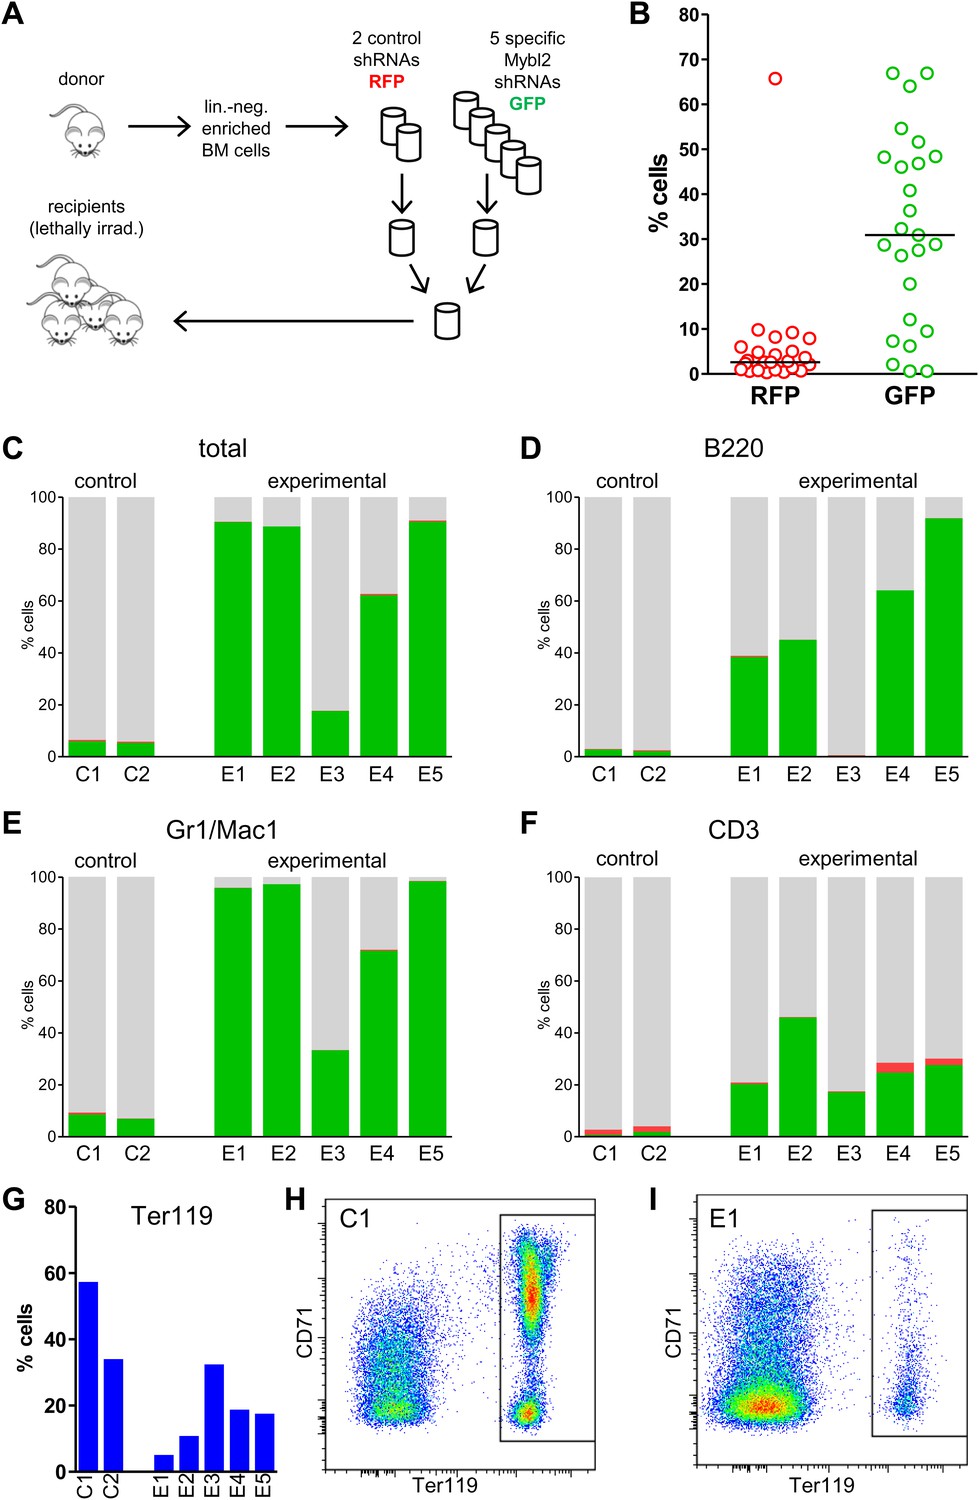
Competitive in vivo reconstitution assay testing expansion capacity of cells with low Mybl2 expression.
(A) Mononuclear bone marrow cells were collected from donor mice, enriched for lineage-negative cells and transduced in separate wells with specific Mybl2 shRNA/GFP vectors and control shRNA/RFP vectors. Equal numbers of cells were combined to obtain a pool with specific shRNA-expressing cells and a pool of control shRNA-expressing cells. Both pools were combined in equal parts and transplanted into lethally irradiated mice (n = 25) in two independent experiments with transduction efficiencies of 5–8%. (B) Analysis of peripheral blood mononuclear cells for GFP and RFP positivity at 12 weeks post-transplant as an indicator of long-term reconstitution (Morrison and Weissman, 1994) (GFP+ vs RFP+, p<0.0001 by paired t-test; horizontal bars denote median values). (C–F), Analysis of bone marrow samples from mice 6–7 months after competitive reconstitution. Flow cytometric analysis of mononuclear bone marrow cells from five experimental mice (E1–E5) transplanted with Mybl2-specific shRNA/GFP cells and control shRNA/RFP cells showed marked overrepresentation of GFP+ cells by comparison with results for control mice (C1, C2) transplanted with control shRNA/RFP- and shRNA/GFP-transduced cells. The fractions of GFP (green), RFP (red) and unlabeled cells (gray) are shown for the total cell populations (C), B220-positive population (D), Gr1/Mac1-positive population (E), and CD3-positive population (F). (G) Respective analysis of bone marrow erythropoiesis by CD71/Ter119 staining. Frequencies of Ter119-positive cells are shown for all animals, and representative plots presented for mouse C1 (H) and mouse E1 (I).
Figure 5—figure supplement 1
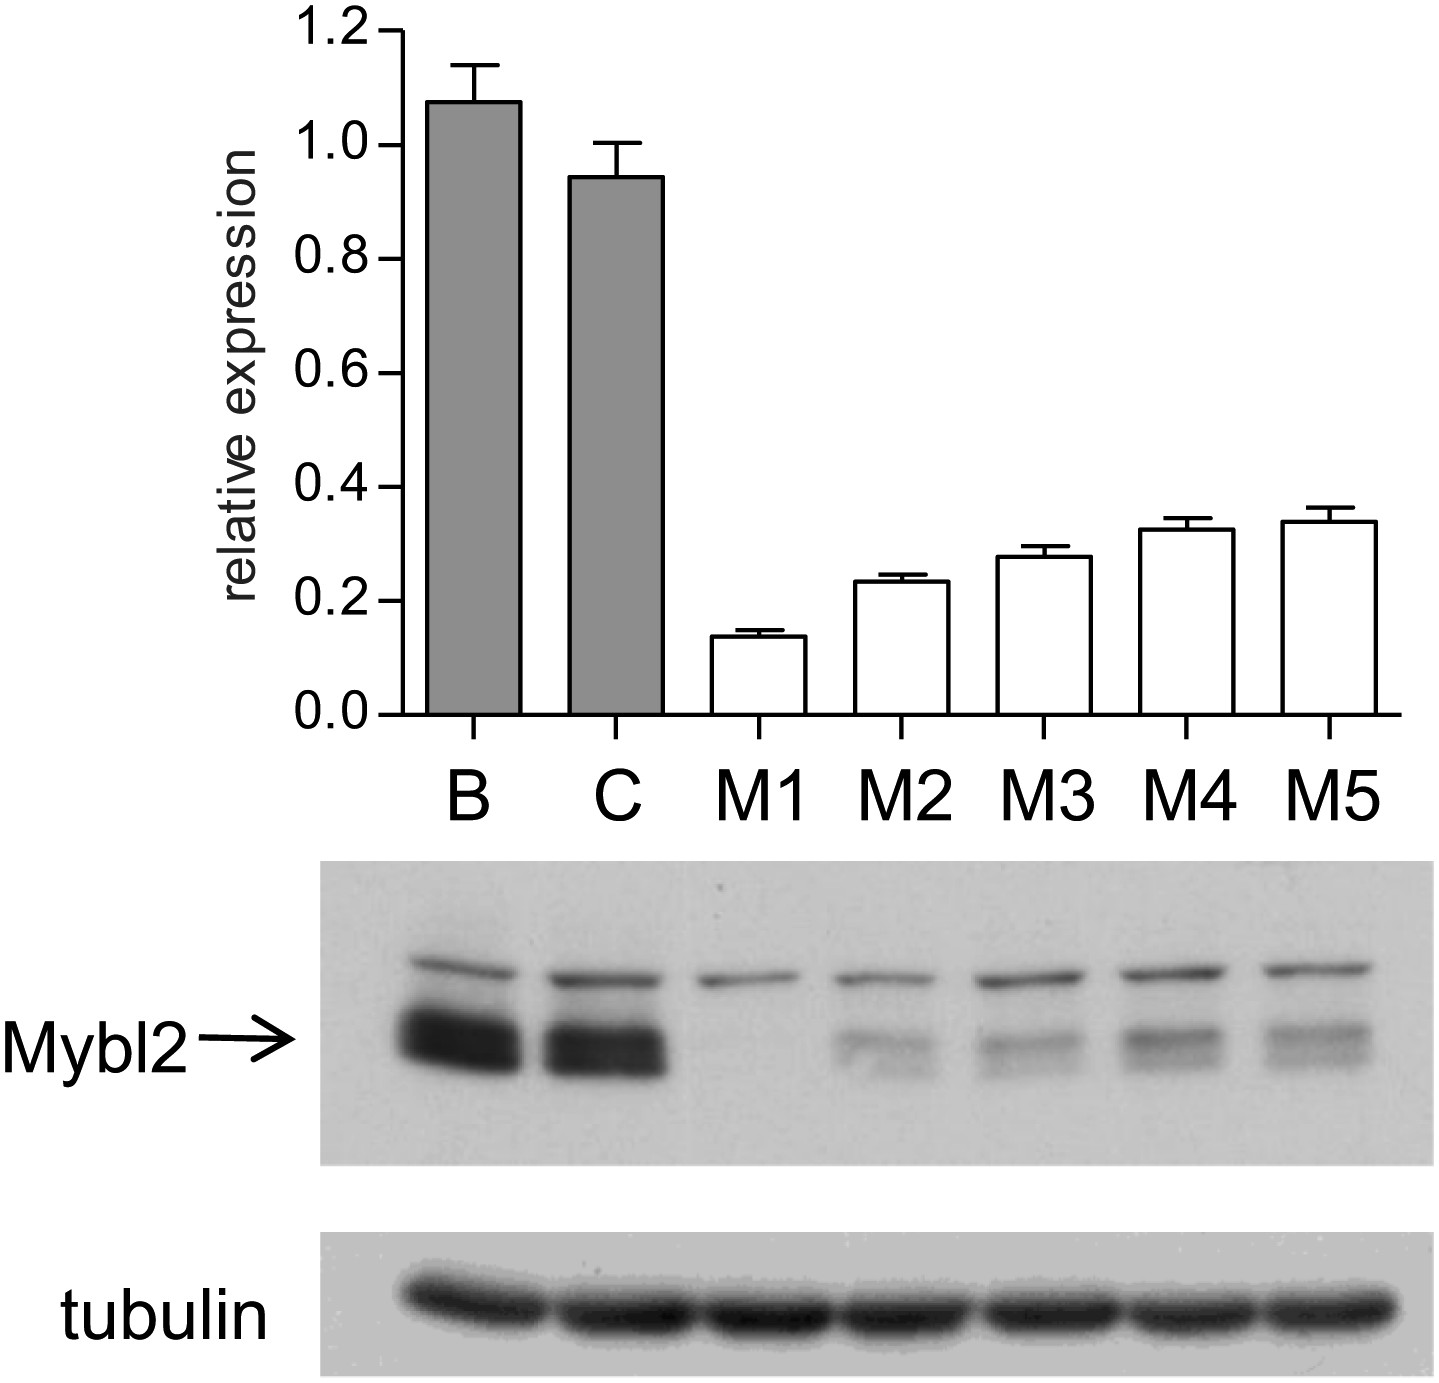
Mybl2 knockdown in 32D cells by a series of shRNAs.
Mybl2 knockdown in 32D cells by a series of shRNAs (control shRNAs are labeled B and C; Mybl2-specific shRNAs are labeled M1–M5). Mybl2 expression levels were measured by qRT-PCR normalized to three control genes (upper panel) and by Western blotting with tubulin as a normalization control (lower panel).
Figure 5—figure supplement 2
Control experiment for the competitive in vivo reconstitution assay testing expansion capacity of cells with low Mybl2 expression.
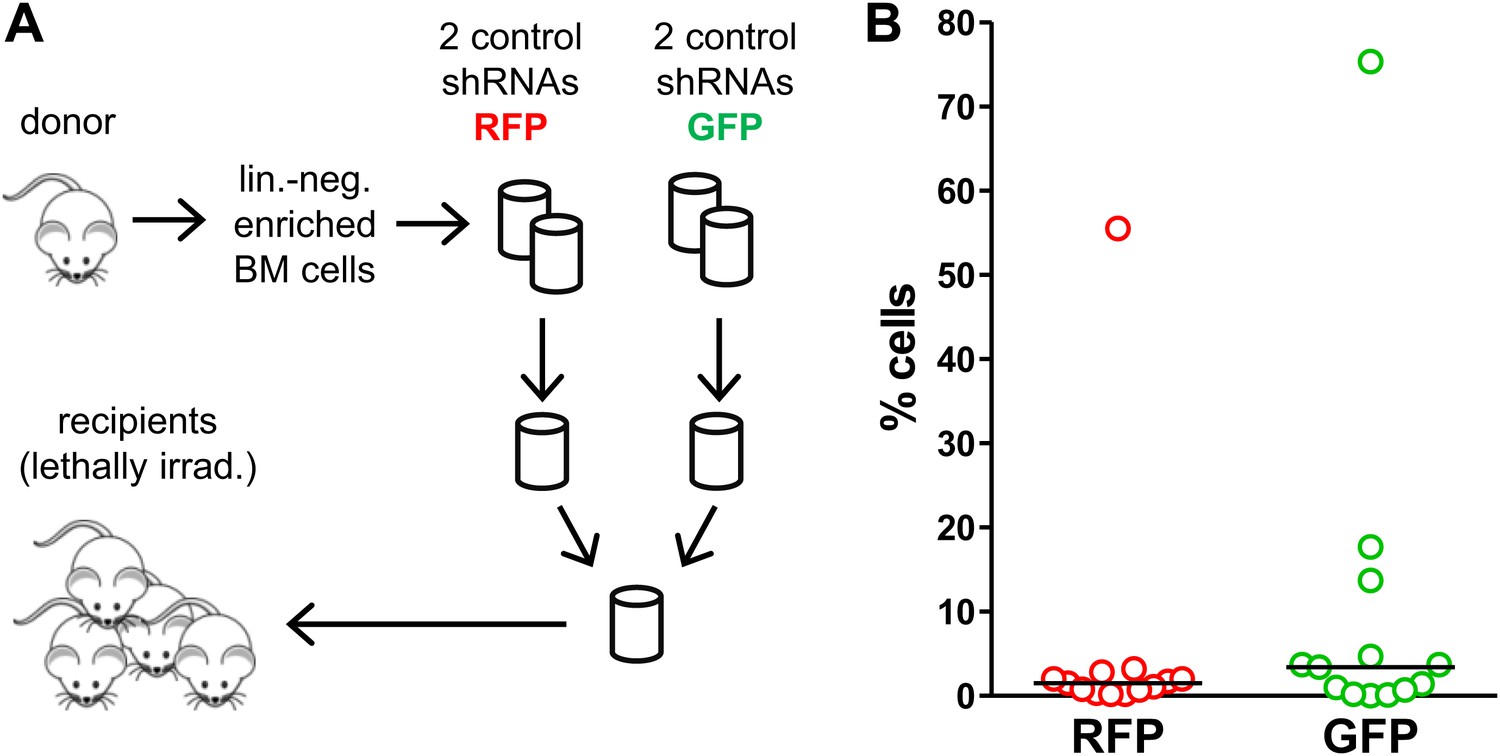
(A) Mononuclear bone marrow cells were collected from donor mice, enriched for lineage-negative cells and transduced in separate wells with control shRNA/GFP vectors and control shRNA/RFP vectors. Equal numbers of cells were combined to obtain a pool of control shRNA-expressing cells and transplanted into lethally irradiated mice (n = 13) in two independent experiments with transduction efficiencies of 5–8%. (B) Analysis of peripheral blood mononuclear cells for GFP and RFP positivity at 12 weeks post-transplant as an indicator of long-term reconstitution.
Figure 5—figure supplement 3
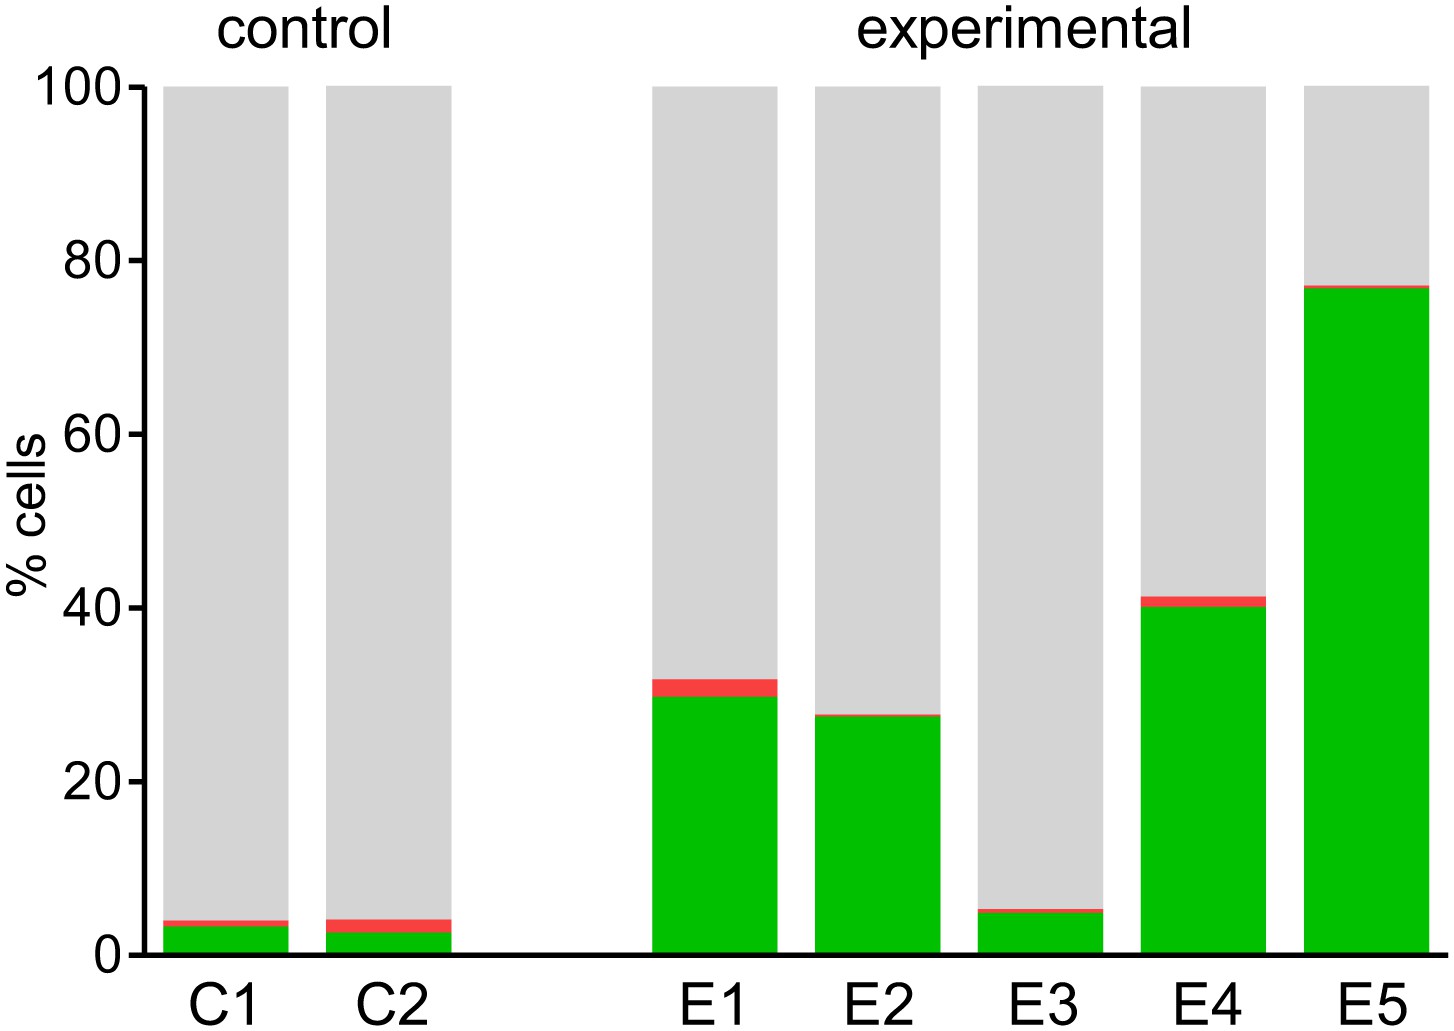
Analysis of bood samples from mice 6–7 months after competitive reconstitution.
Flow cytometric analysis of blood samples from five experimental mice (E1–E5) transplanted with Mybl2-specific shRNA/GFP cells and control shRNA/RFP cells demonstrating marked overrepresentation of GFP+ cells in comparison to results for control mice (C1, C2) transplanted with control shRNA/RFP and shRNA/GFP transduced cells (GFP+ (green), RPF+ (red) and unlabeled cells (gray))
Figure 6 with 2 supplements
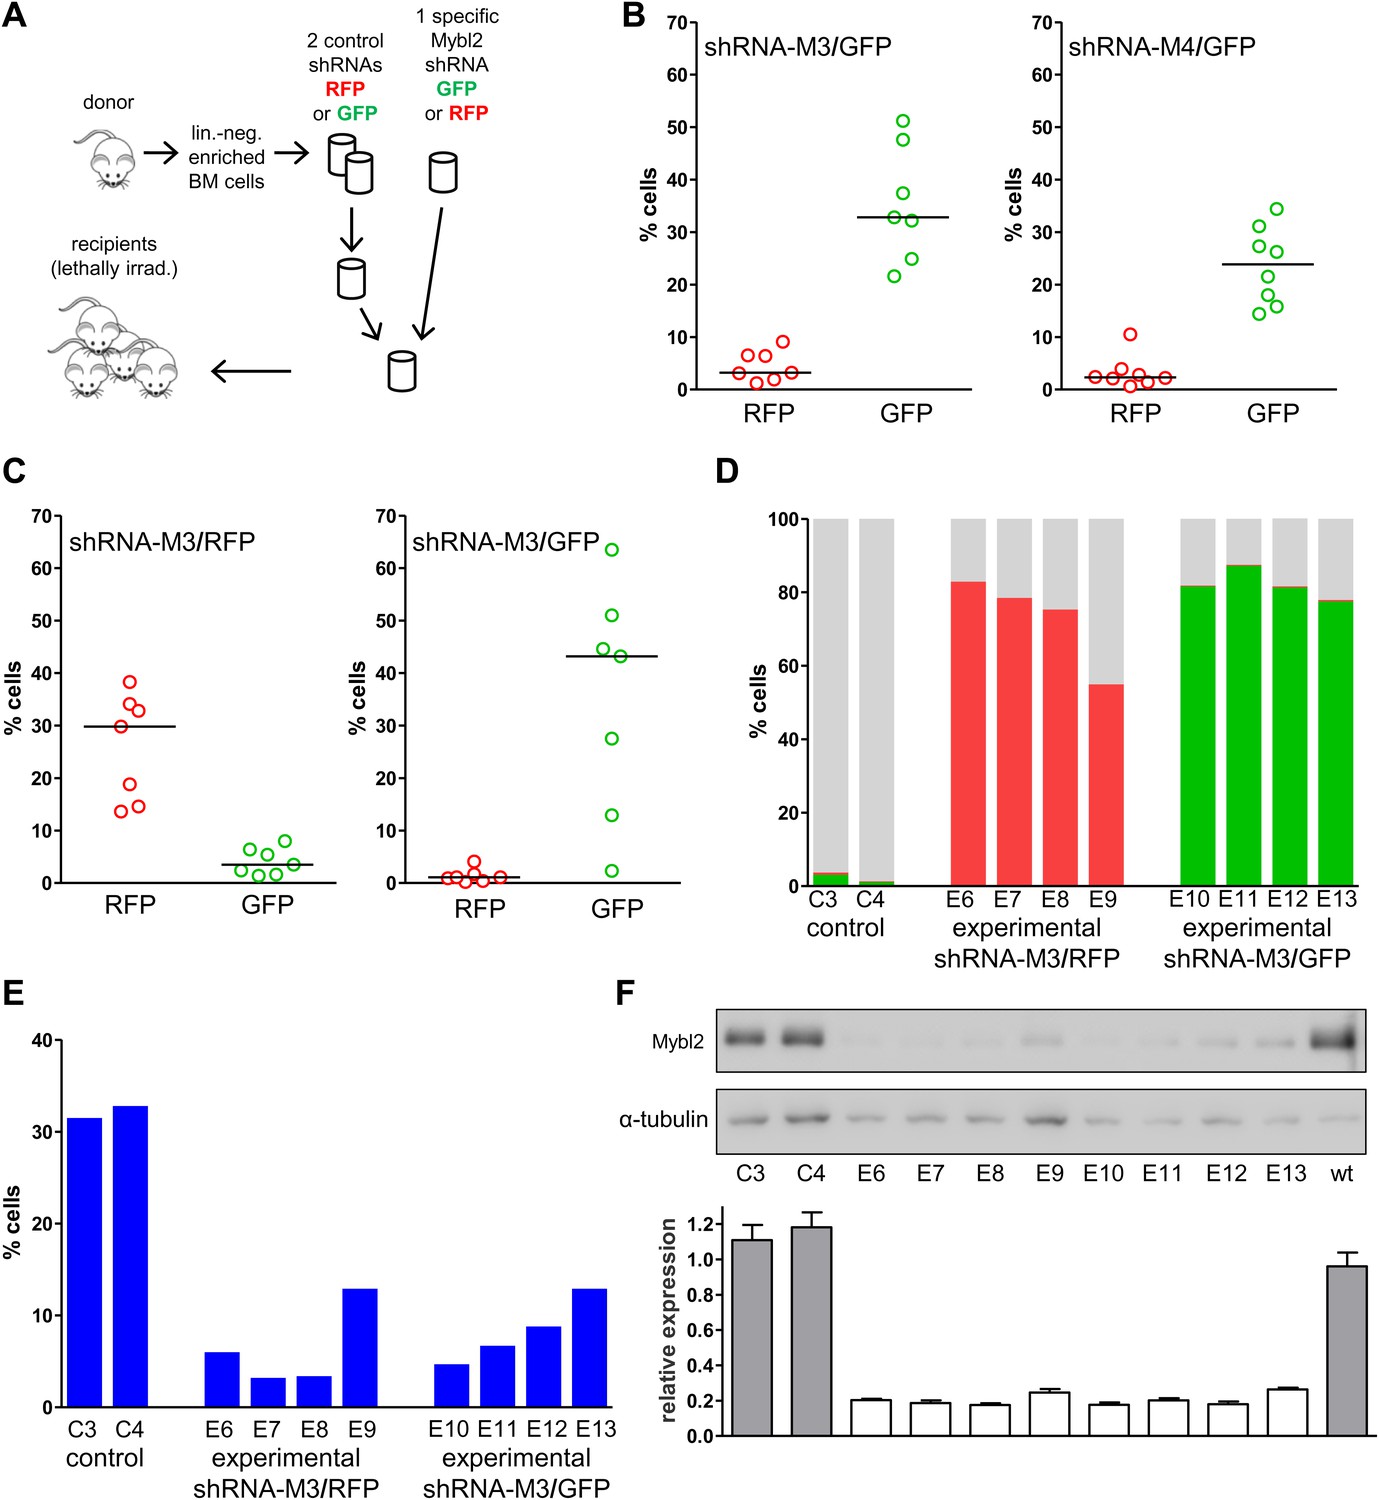
Analysis of peripheral blood and bone marrow samples from mice transplanted with single Mybl2-targeting shRNA vectors.
(A) Mononuclear bone marrow cells were collected from donor mice, enriched for lineage-negative cells and transduced in separate wells with a single, specific Mybl2 shRNA vector or control shRNA vector with an efficiency of <10%. The vectors allowed for co-expression of RFP or GFP. Equal numbers of control shRNA-expressing cells and Mybl2-specific shRNA-expressing cells were combined and transplanted into lethally irradiated mice in two independent experiments. (B) Experiment 1: Analysis of peripheral blood mononuclear cells for GFP and RFP positivity at 12 weeks post-transplant as an indicator of long-term reconstitution. Significant expansion of GFP-positive cells with use of either shRNA M3 (left, p=0.0004 by paired t-test) or M4 (right, p=0.0005). Horizontal bars denote median values. (C) Experiment 2, ‘color-swap’ experiment: Mybl2-specific shRNA M3 coupled with GFP (right) or RFP (left) expression associated with a significant expansion of Mybl2-downregulated cells (p=0.007 and p=0.001, respectively). (D) Flow cytometric analysis of mononuclear bone marrow cells from eight experimental mice (E6–E13) transplanted with cells expressing Mybl2-specific M3 shRNA/GFP and control shRNA/RFP cells (E6–E9) or Mybl2-specific M3 shRNA/RFP cells and control shRNA/GFP cells (E10–E13). Mybl2-RNAi cells were markedly overrepresented by comparison to results for control mice (C3, C4) transplanted with control shRNA/RFP- and shRNA/GFP-transduced cells. The fractions of GFP (green), RPF (red) and unlabeled cells (gray) are shown. (E) Analysis of bone marrow erythropoiesis by CD71/Ter119 staining with frequencies of Ter119-positive cell frequencies shown for all animals. (F) Analysis of Mybl2 levels of flow sorted cells by Western-blotting (upper panel) and qRT-PCR (lower panel).
Figure 6—figure supplement 1
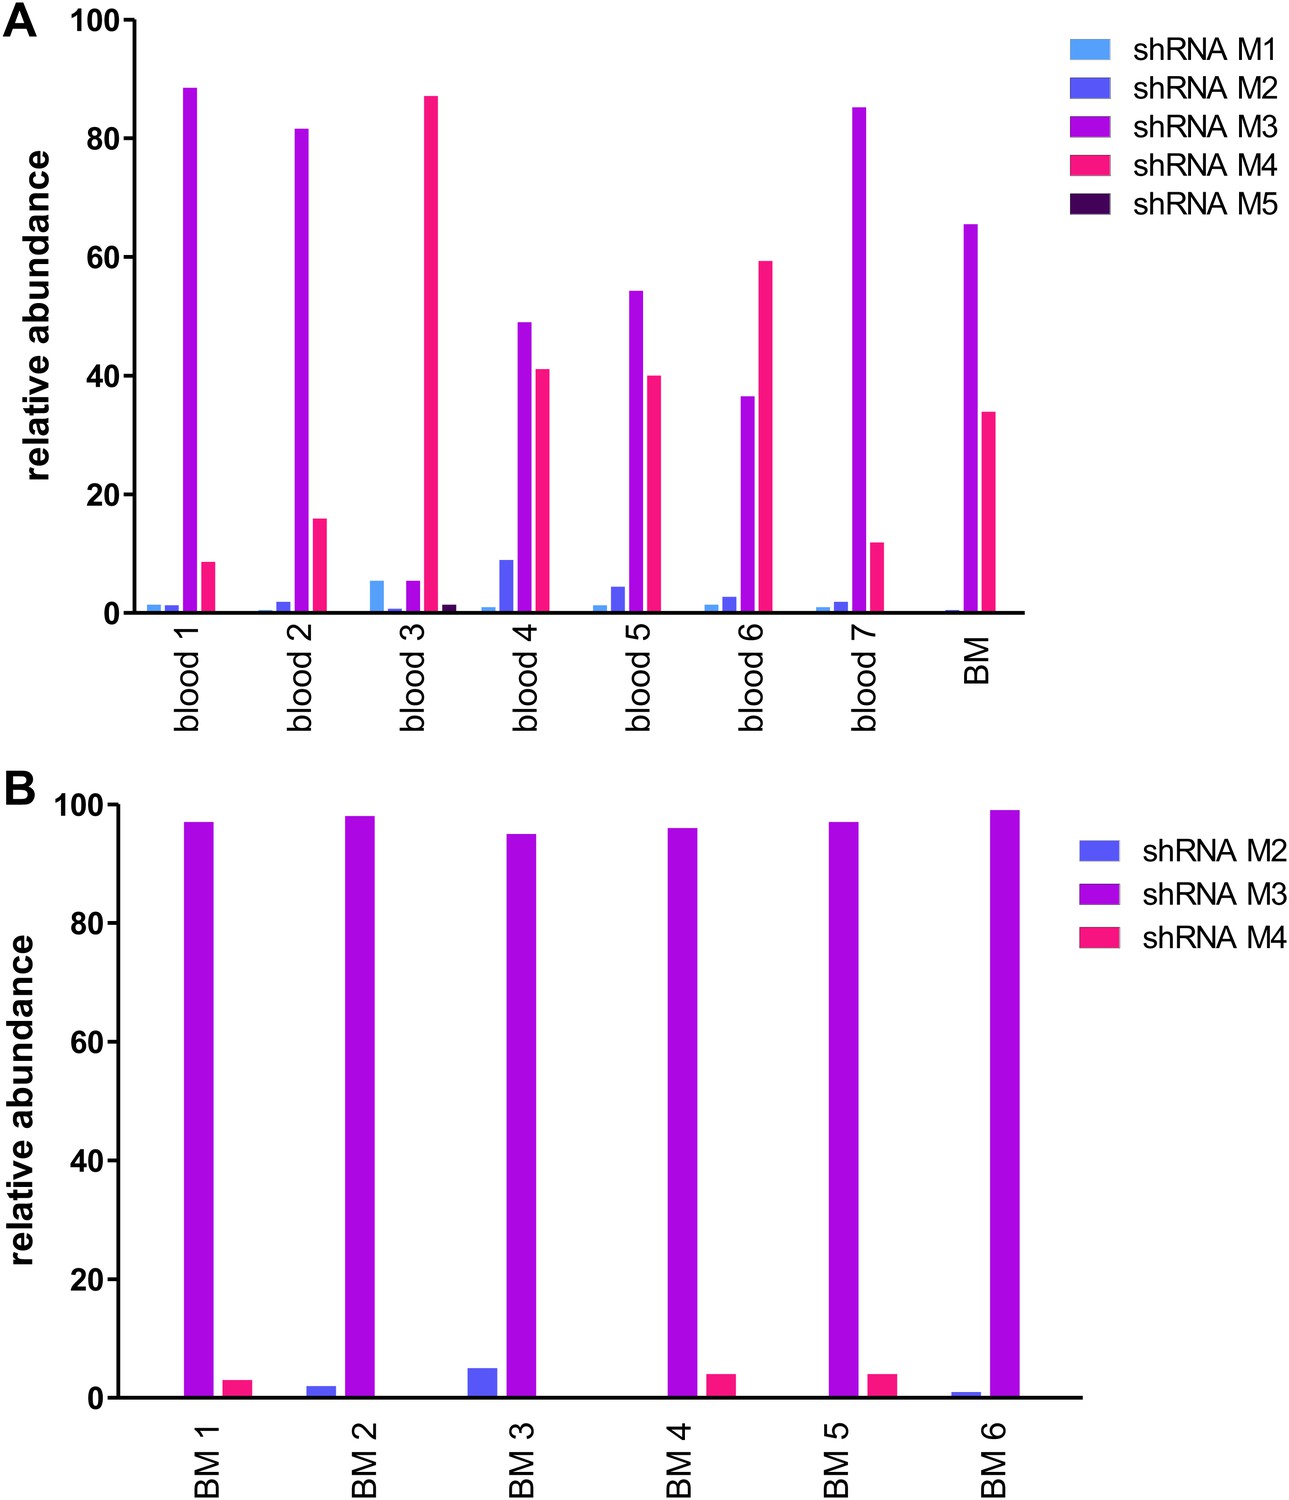
Analysis of genomic DNA for the presence of specific Mybl2-targeting shRNA sequences.
(A) Analysis of the relative abundance of shRNAs M1 to M5 in the peripheral blood of seven mice and the bone marrow of one mouse 12 weeks after reconstitution. (B) Analysis of the bone marrow of six animals more than 6 months after reconstitution.
Figure 6—figure supplement 2
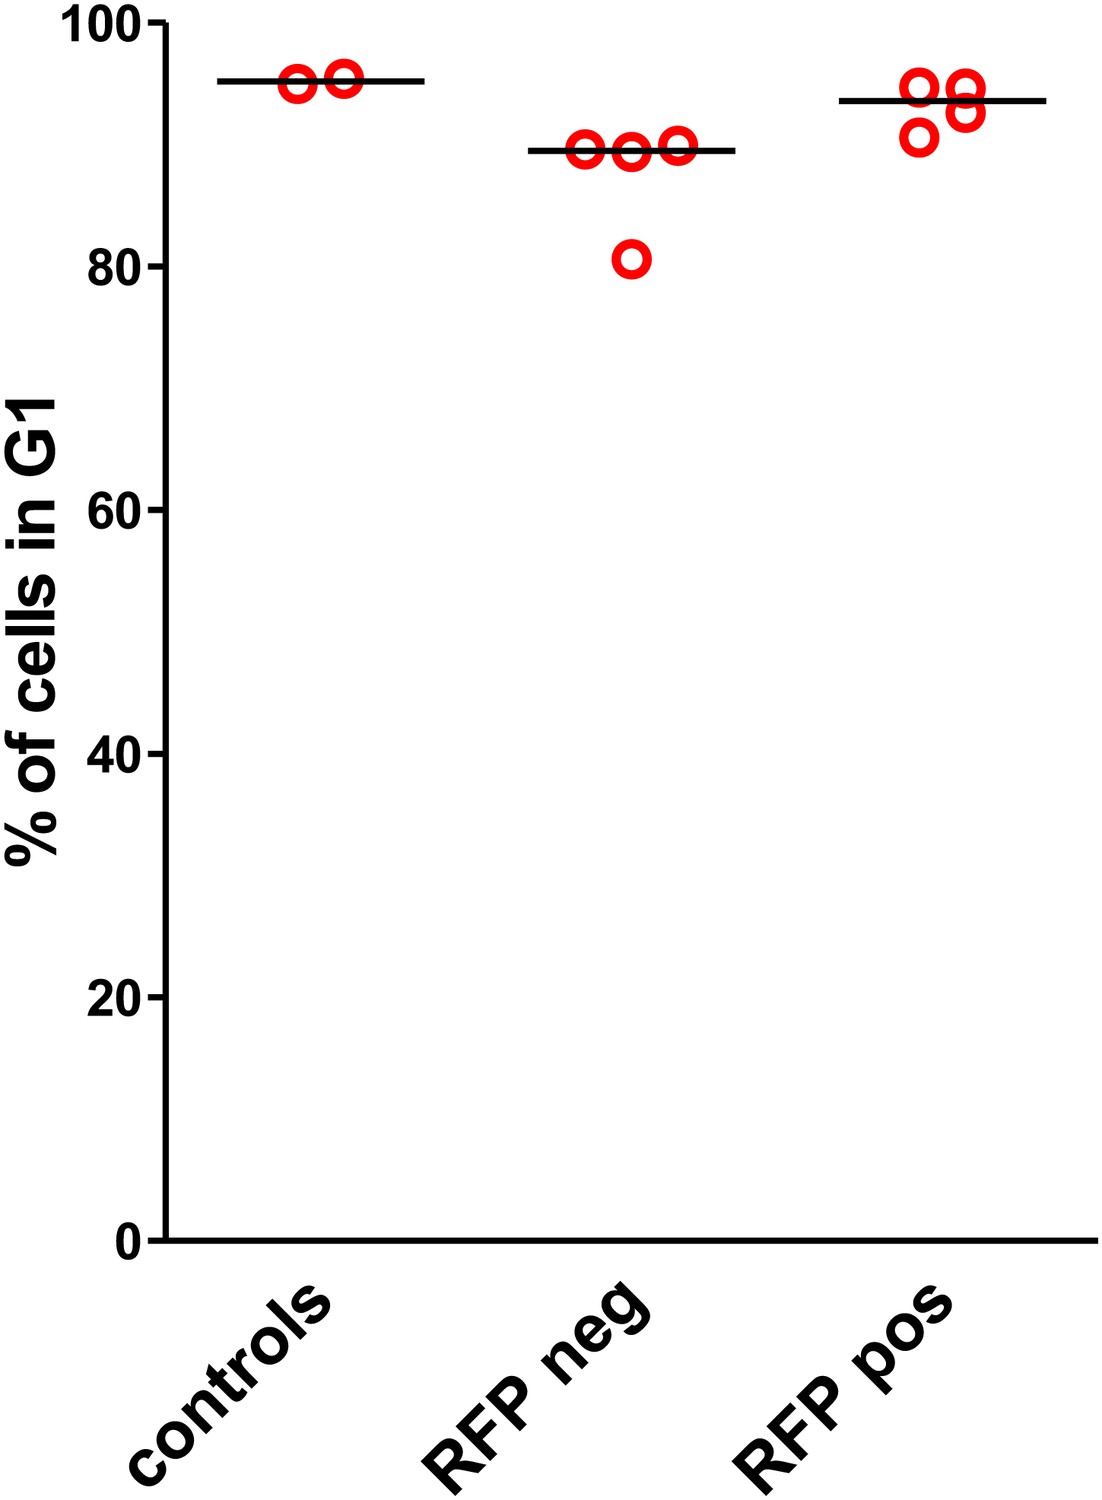
Cell cycle analysis.
Cell cycle phase distribution was determined by standard Propidium Iodide staining in control bone marrow cells and in sorted, RFP-negative cells (no Mybl2 RNAi) and in sorted, RFP-positive cells (Mybl2 knockdown).
Figure 7 with 2 supplements
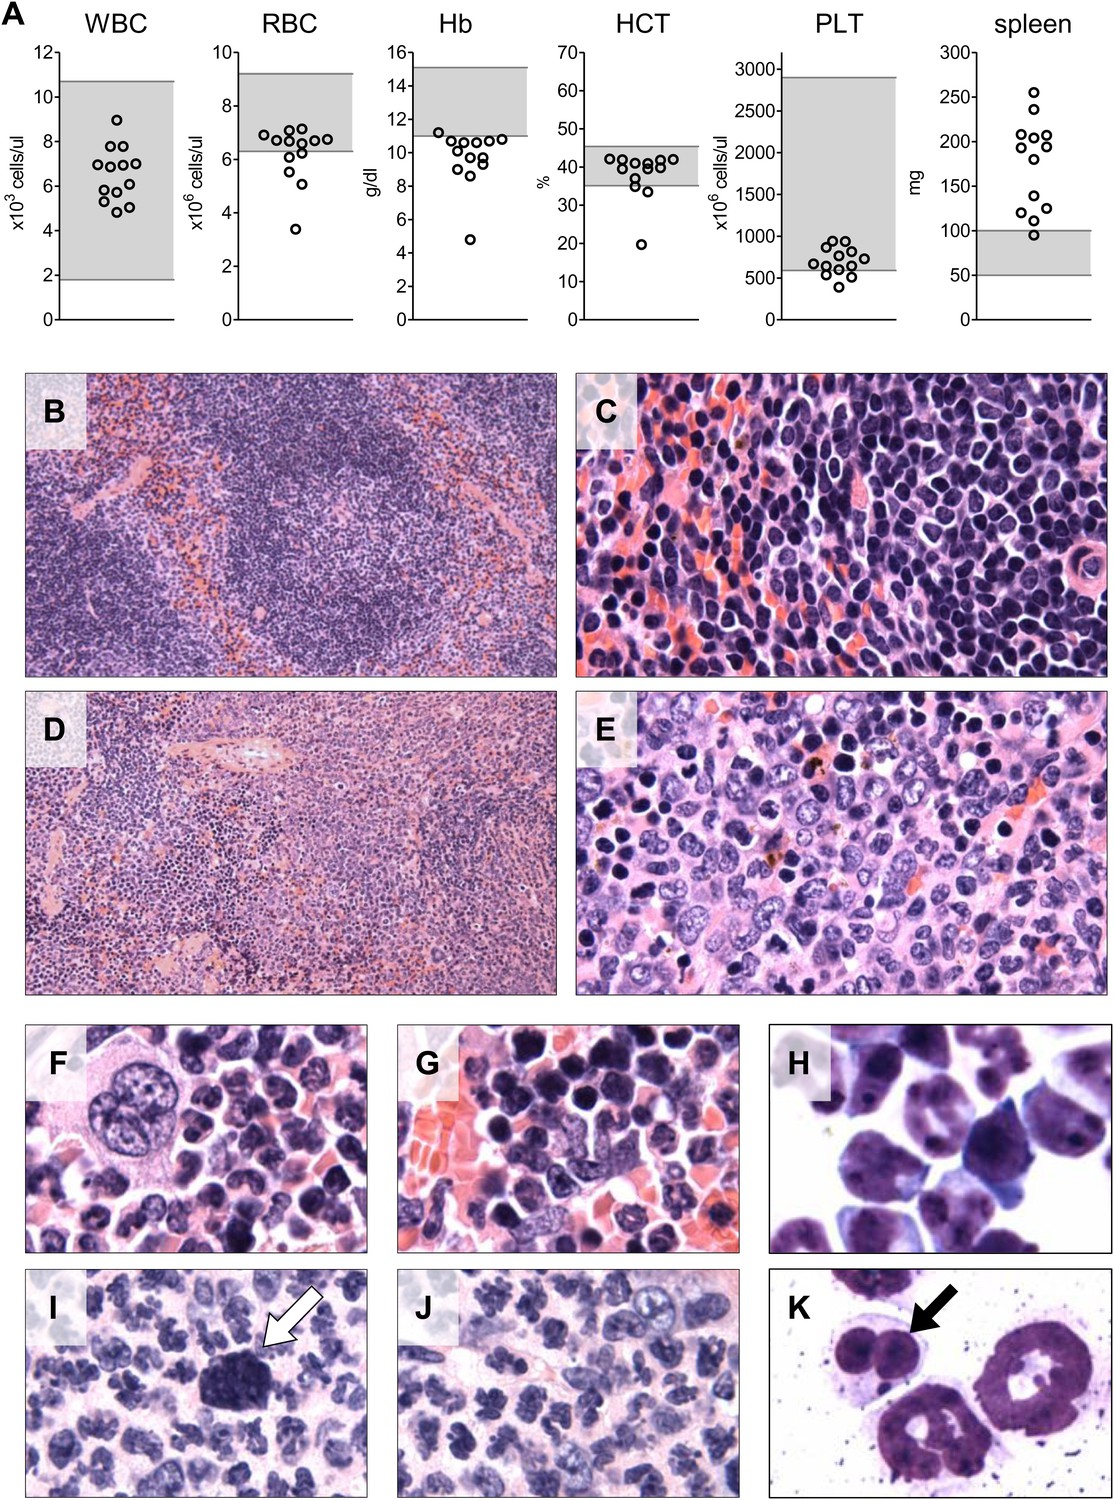
Analysis of blood counts and spleen weight (A), spleen (B–E) and bone marrow (F–K) samples from mice 6-7 months after competitive reconstitution.
(A) Analysis of peripheral blood parameters showing anemia of animals that received transplants of specific Mybl2-shRNA engineered cells: white blood cell count (WBC), red blood cell count (RBC), hemoglobin (HB), hematocrit (HCT), and platelet count (PLT). Spleen weights are shown as well. Grey areas indicate the normal range for each value. (B and C) Normal spleen histology at different magnification of control mouse C1 showing normal lymphoid-rich white pulp (50% spleen volume) and red pulp (50%). About 10% of the spleen consists of extramedullary hematopoiesis, which is in the red pulp and normal for mice. (D and E) Spleen histology of mouse E1 with specific Mybl2-knockdown at different magnification shows a marked depletion of white pulp. About 90% consists of red pulp, which is almost entirely extramedullary hematopoiesis. (F–K) Normal bone marrow histology (F and G) and cytology (H) of control mouse C1, compared to corresponding results for mouse E1 with specific Mybl2-knockdown (histology I, J; cytology K). Note marked shift to myeloid elements with loss of erythropoiesis and occasional dysplastic myeloid cells (white arrow: hypolobate megakaryocyte, black arrow: dysplastic neutrophil).
Figure 7—figure supplement 1

Erythroid leukemia associated with Mybl2 knockdown.
Flow cytometric analysis for erythroid differentiation markers of bone marrow (A) and spleen (B) cells of a diseased animal. Histologic and cytological analysis of the bone marrow (C and E) and the spleen (D and F) shows dominance of erythroblasts (arrows). More than 90% of the immature spleen CD71+ are GFP+; the spleen weight was 792 mg (not shown).
Figure 7—figure supplement 2
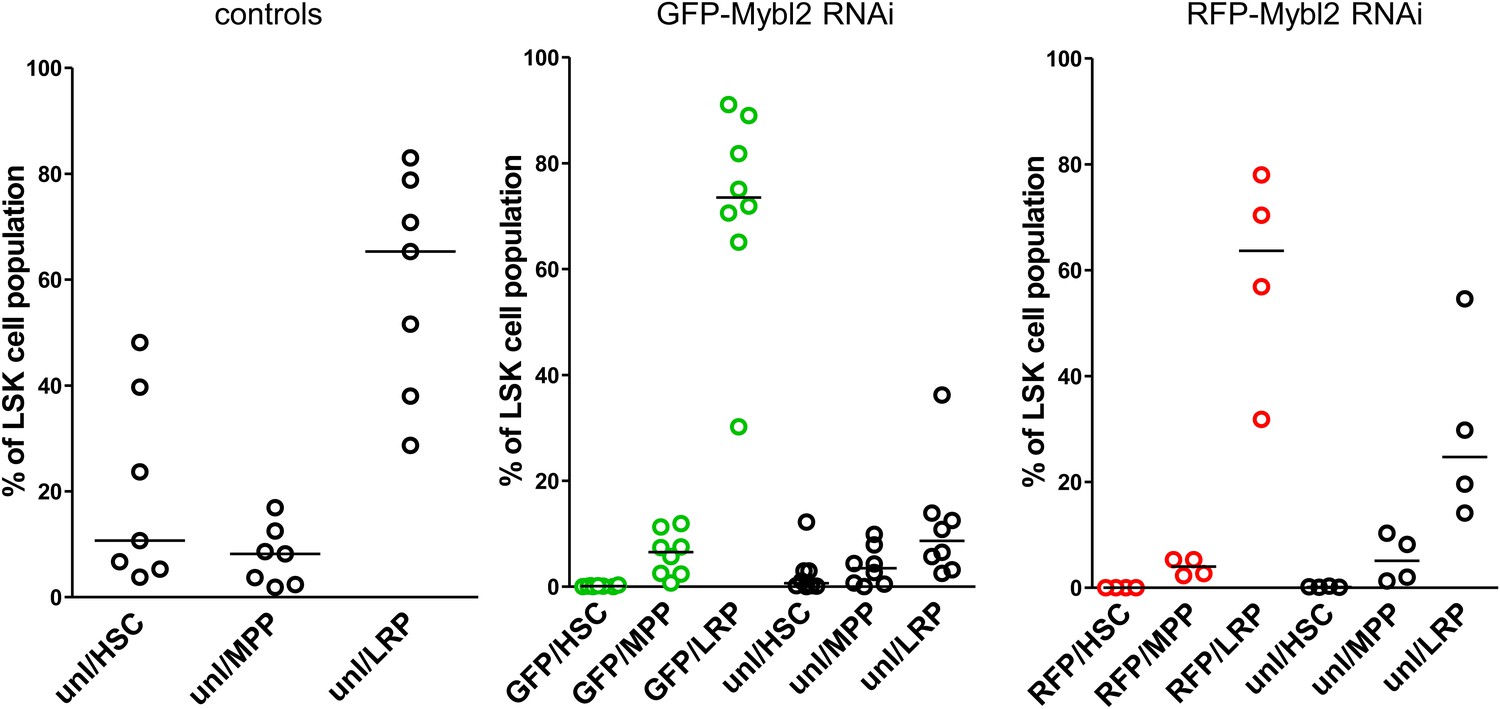
Flow cytometric analysis of the LSK population in the bone marrow of mice upon reconstitution with Mybl2 shRNA-expressing cells.
The analysis was performed in control animals (left panel) and in animals with Mybl2 downregulation (middle and right panel). Vertical bars designate median values. Populations were labeled according to the following markers: CD150+/CD48- (HSC), CD150-/CD48- (MPP) and CD150-/CD48+ (LRP).
Figure 8 with 1 supplement
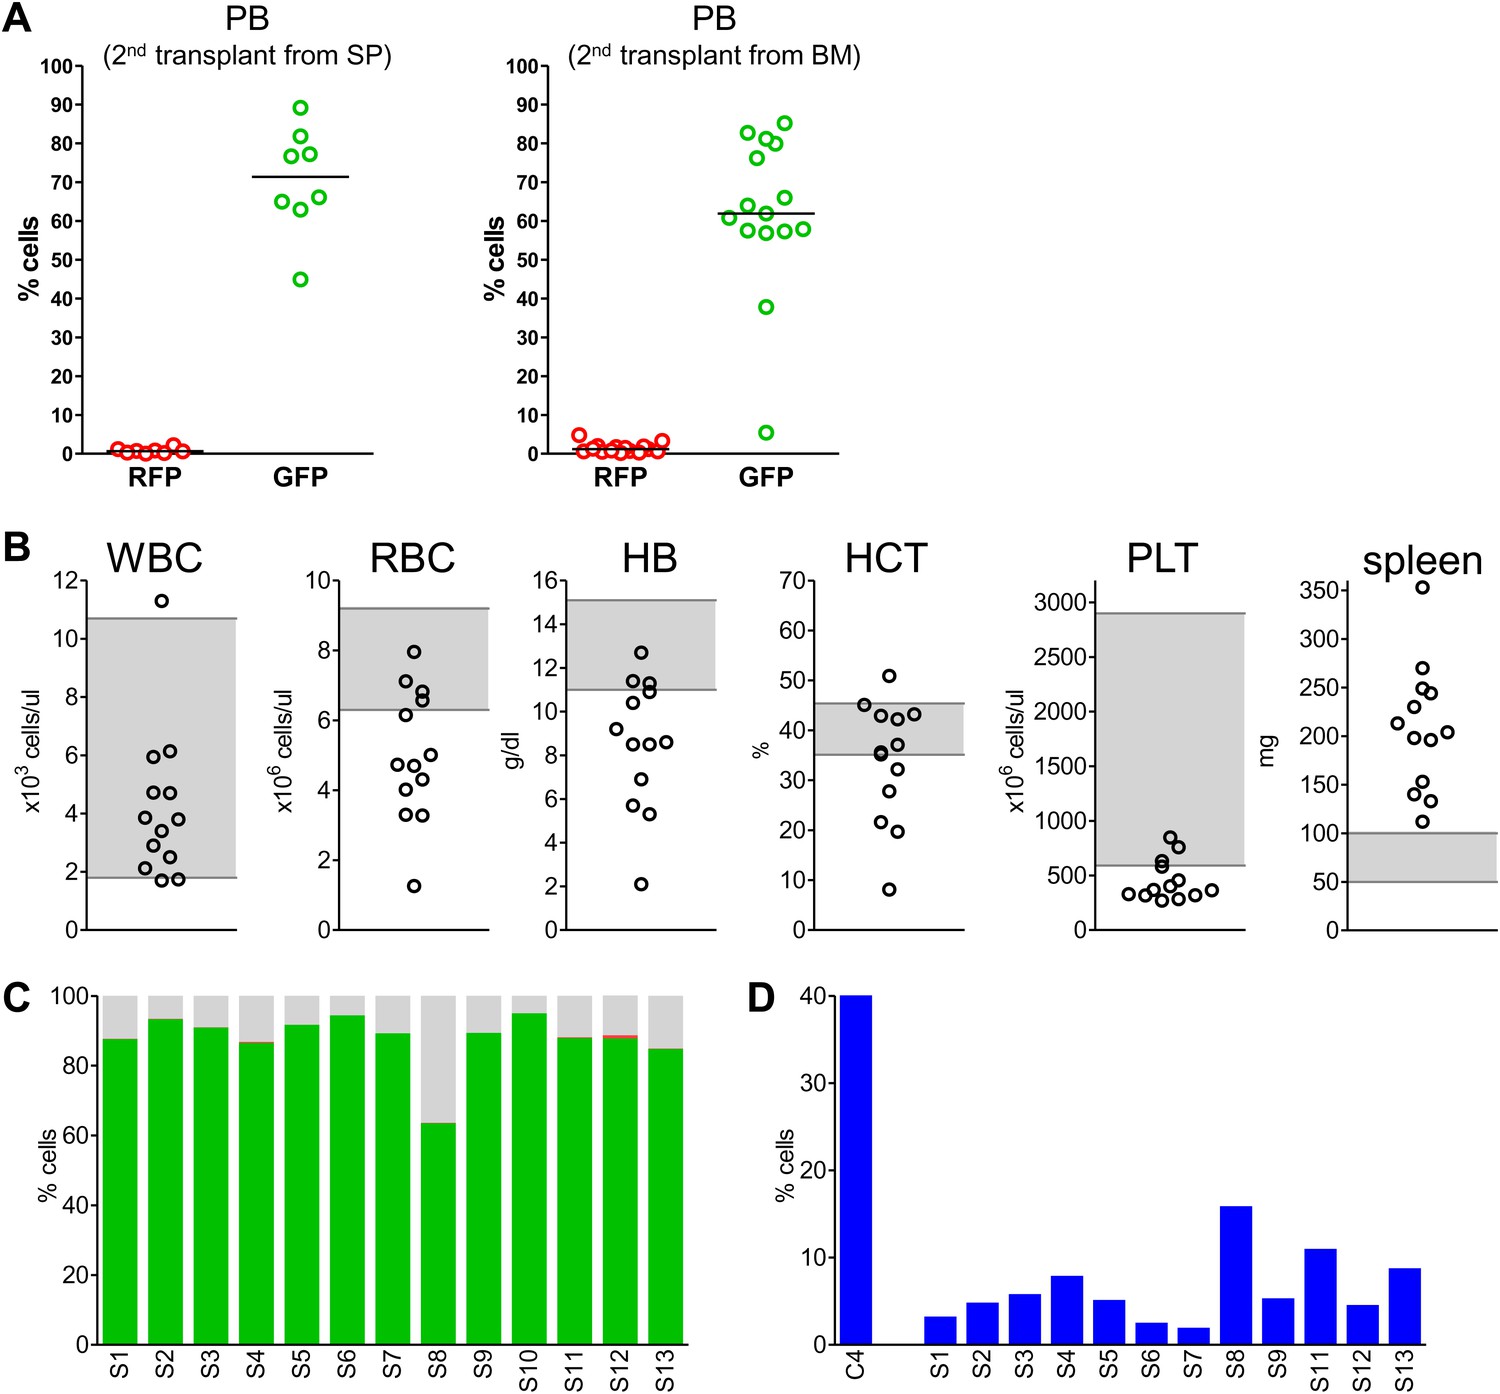
Secondary transplants: In vivo reconstitution assay testing capacity of cells with low Mybl2 expression to engraft in lethally irradiated mice.
(A) Analysis of peripheral blood mononuclear cells for GFP and RFP positivity at 10 weeks post-transplant showing engraftment of cells originating from spleen (p<0.0001, left panel) or bone marrow cells (p<0.0001, right panel). Horizontal bars denote median values. (B) Analysis of peripheral blood parameters showing anemia of animals that received secondary transplants of specific Mybl2-shRNA engineered cells: white blood cell count (WBC), red blood cell count (RBC), hemoglobin (HB), hematocrit (HCT), and platelet count (PLT). Spleen weights are shown as well. Grey areas indicate the normal range for each value. (C) Flow cytometric analysis of mononuclear bone marrow cells 3 months after transplantation from 13 mice (S1–S13) demonstrating strong engraftment and expansion of cells with a specific Mybl2 knockdown (color code as in Figure 5). (D) Analysis of bone marrow erythropoiesis by CD71/Ter119 staining showing the frequencies of CD71−/Ter119+ cells and revealing a strong reduction of Ter119+ cells in all experimental animals in comparison to a wild-type control animal.
Figure 8—figure supplement 1
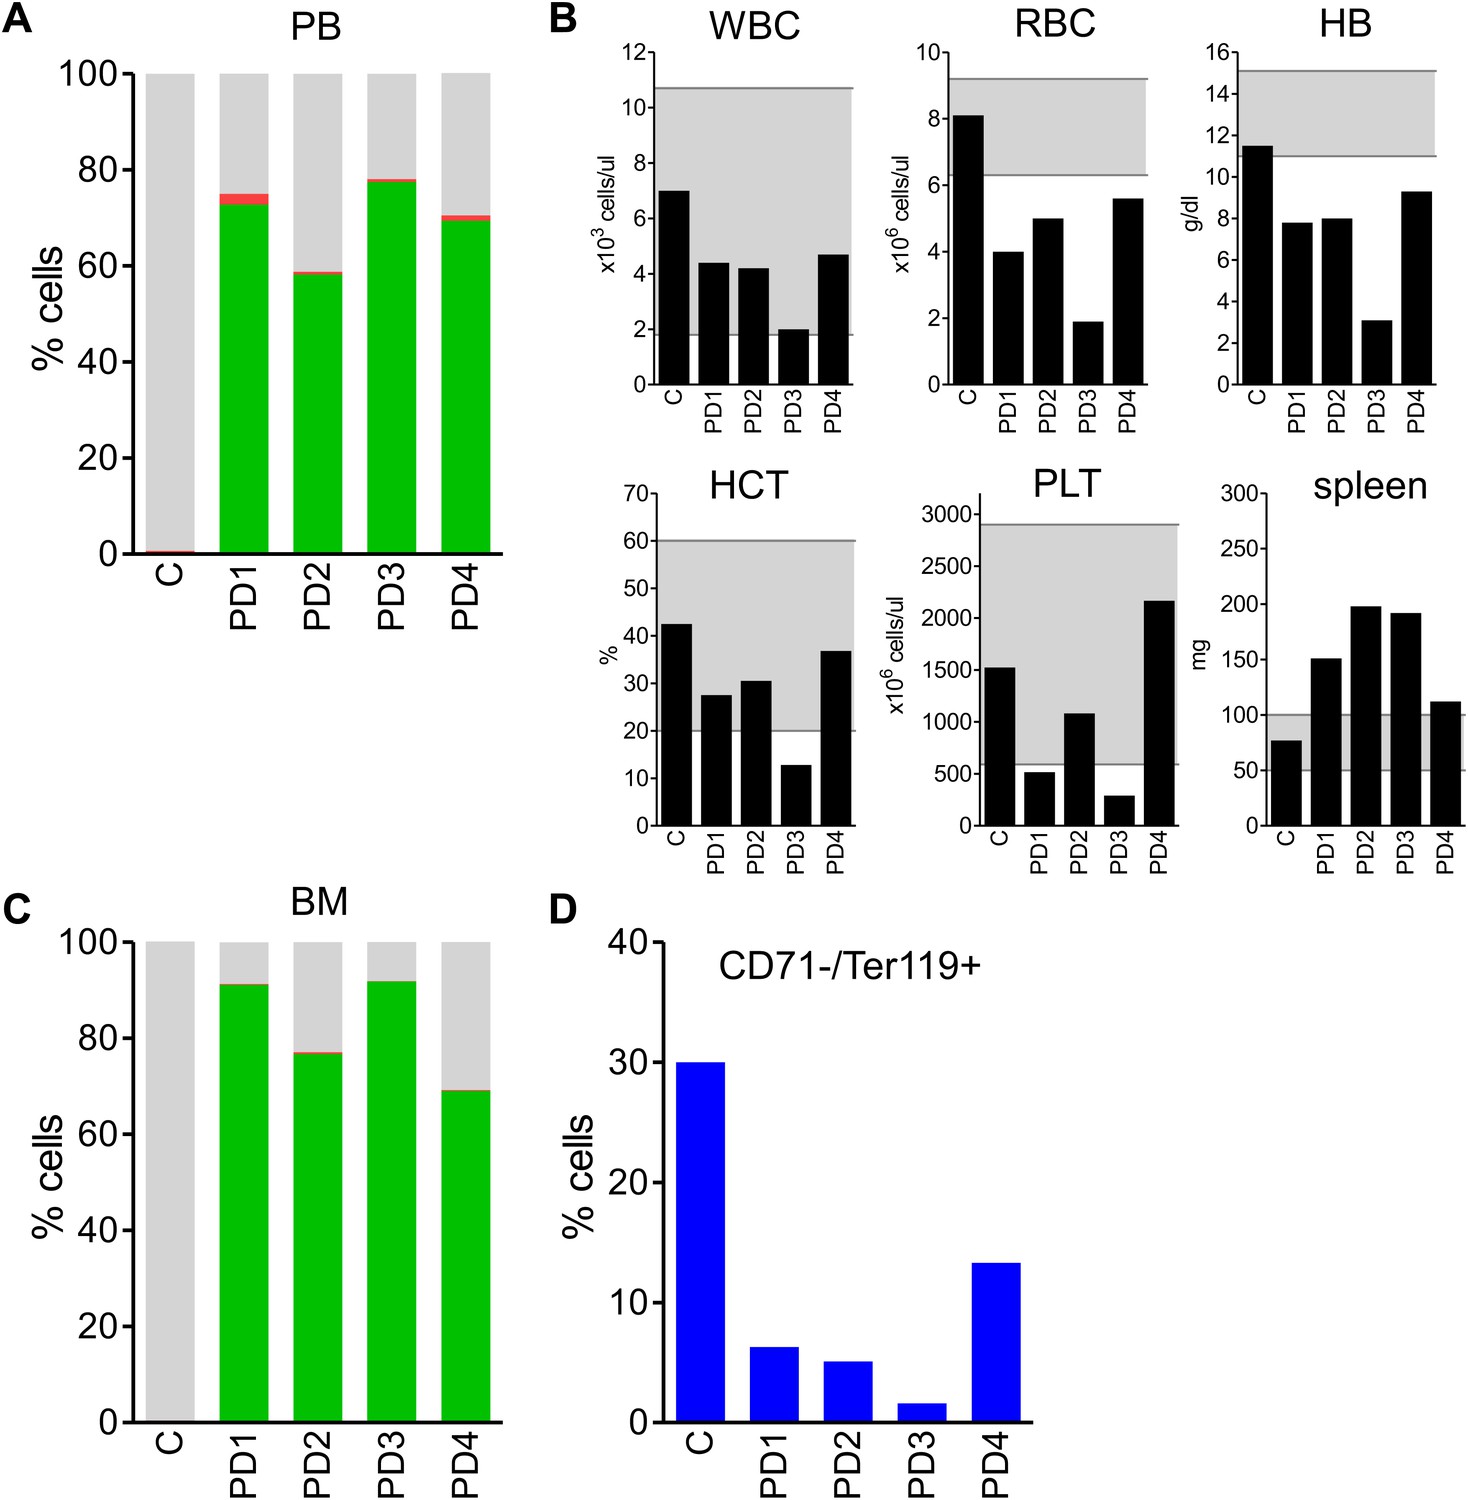
Analysis of the peripheral blood and bone marrow 8 months after transplantation of lineage-negative bone marrow cells transduced with Mybl2-targeting shRNA expression vectors (primary transplant donors).
(A) Analysis of peripheral blood mononuclear cells for GFP and RFP positivity showing engraftment and competitive expansion GFP-positive cells expressing shRNAs targeting Mybl2 in competition to non-transduced cells (unlabeled, grey) or control shRNA expressing cells (RFP-positive, red). PD1-4: primary donor animals (GFP: Mybl2-specific shRNA vectors, RFP: control shRNA vectors); C3: control animal (GFP: control shRNA vectors, RFP: control shRNA vectors) (B) Analysis of peripheral blood parameters showing anemia of the animals transplanted with specific Mybl2-shRNA engineered cells: white blood cell count (WBC), red blood cell count (RBC), hemoglobin (HB), hematocrit (HCT), and platelet count (PLT). Spleen weights are shown as well. Grey areas indicate the normal range for each value. (C) Analysis of the bone marrow mononuclear cells as in A. (D) Analysis of bone marrow erythropoiesis by CD71/Ter119 staining showing the frequencies of Ter119-positive cells.
Additional files
-
Supplementary file 1
(A) MDS patient characteristics. (B) Genes positively correlated with MYBL2 (MYBL2 gene signature). (C) qRT-PCR primer sequences.
- https://doi.org/10.7554/eLife.00825.026
Download links
A two-part list of links to download the article, or parts of the article, in various formats.
Downloads (link to download the article as PDF)
Open citations (links to open the citations from this article in various online reference manager services)
Cite this article (links to download the citations from this article in formats compatible with various reference manager tools)
MYBL2 is a sub-haploinsufficient tumor suppressor gene in myeloid malignancy
eLife 2:e00825.
https://doi.org/10.7554/eLife.00825


