Direct live imaging of cell–cell protein transfer by transient outer membrane fusion in Myxococcus xanthus
- Aix Marseille University-CNRS UMR7283, France
- Institut de Microbiologie de la Méditerranée, France
Figures
Figure 1 with 1 supplement
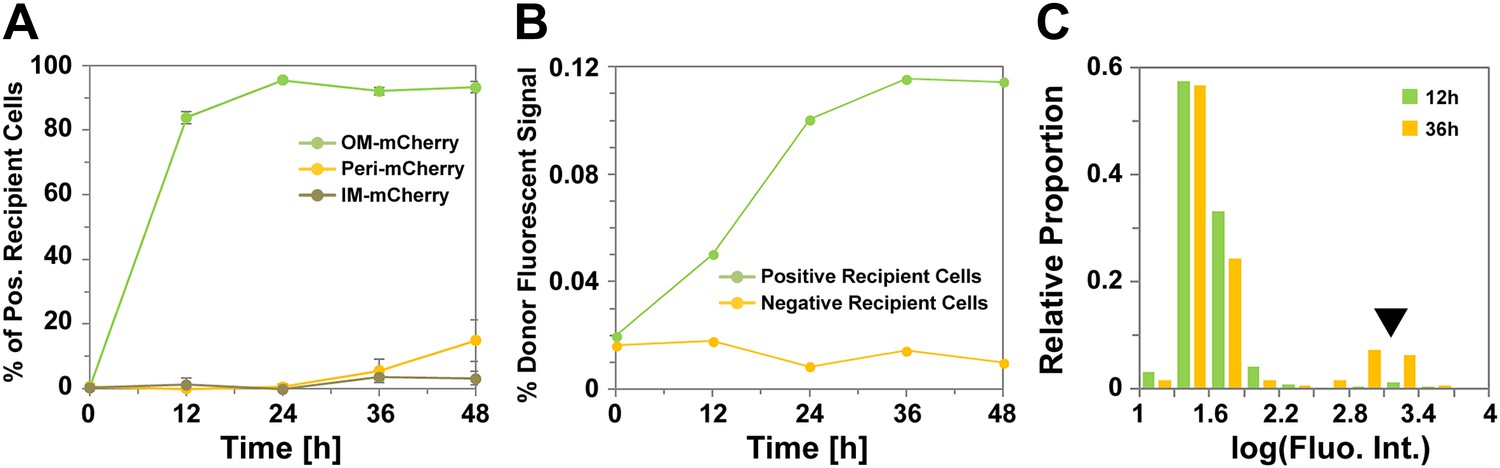
Transfer is a highly efficient OM-specific process.
(A) Percentage of mCherry+ recipient cells as a function of time. For each strain and time point, at least 3000 cells were analyzed in triplicate. Error bars = SD. (B) Fluorescence intensity of mCherry+ recipient cells as a function of time. For each time point, the fluorescence numbers are expressed as a percentage of the mean fluorescence intensity of the donor cells population. For each time point, fluorescence intensities were measured for ∼3000 cells per strain. (C) Distribution of fluorescence intensities measured in the positive recipient cells after 12 hr (green bars) and 36 hr (orange bars) of co-incubation. Note the logarithmic scale log(Fluorescence Intensity). The black arrow highlights the appearance of a highly-stained cell sub-population of mCherry+ cells at 36 hr. For each time point, fluorescence intensities were measured for ∼3000 cells per strain.
Figure 1—figure supplement 1
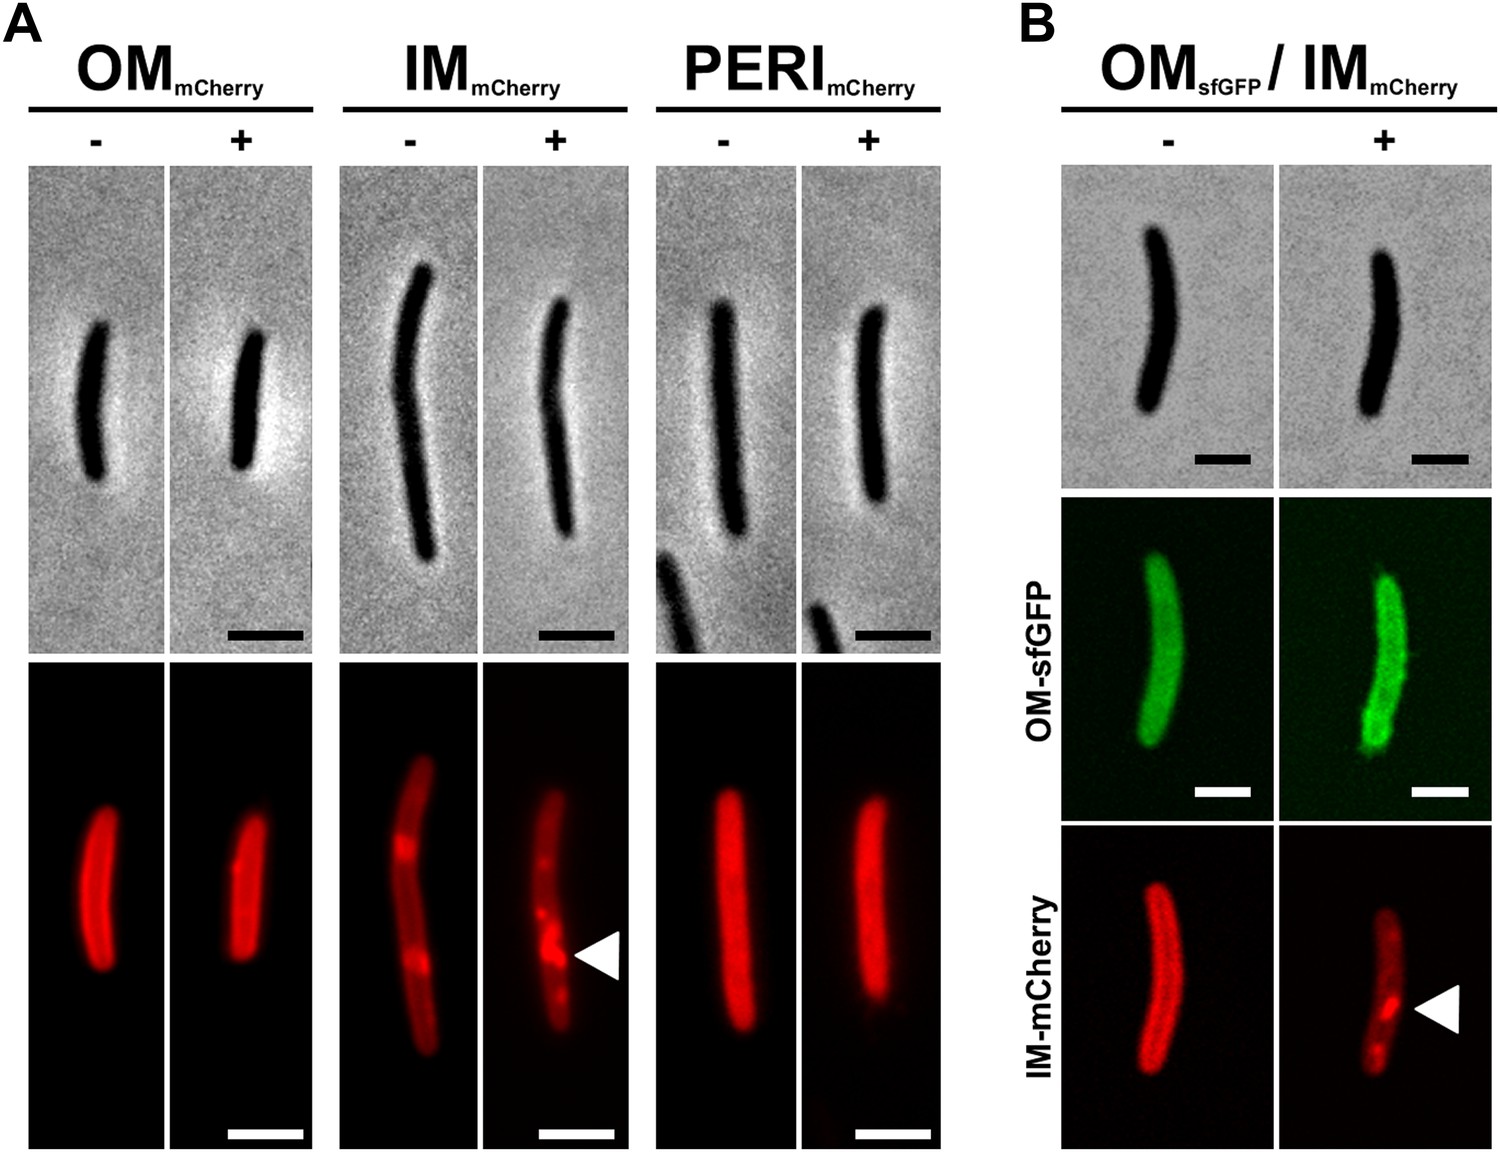
Subcellular localization of indicated fluorescent probes before and after a plasmolysis treatment.
(A and B) Sub-cellular localization of the OMmcherry, OMsfGFP, IMmcherry, PERImcherry fusions before (−) and after (+) plasmolysis treatment (0.5 M NaCl). For each fusion, cells were immobilized in a hybrid flow chamber and imaged before and after injection of the plasmolysis solution. Note that fluorescent cytoplasmic aggregates are observed for the IMmcherry fusion after the plasmolysis treatment (white arrow). Scale bar = 1 µm.
Figure 2 with 1 supplement
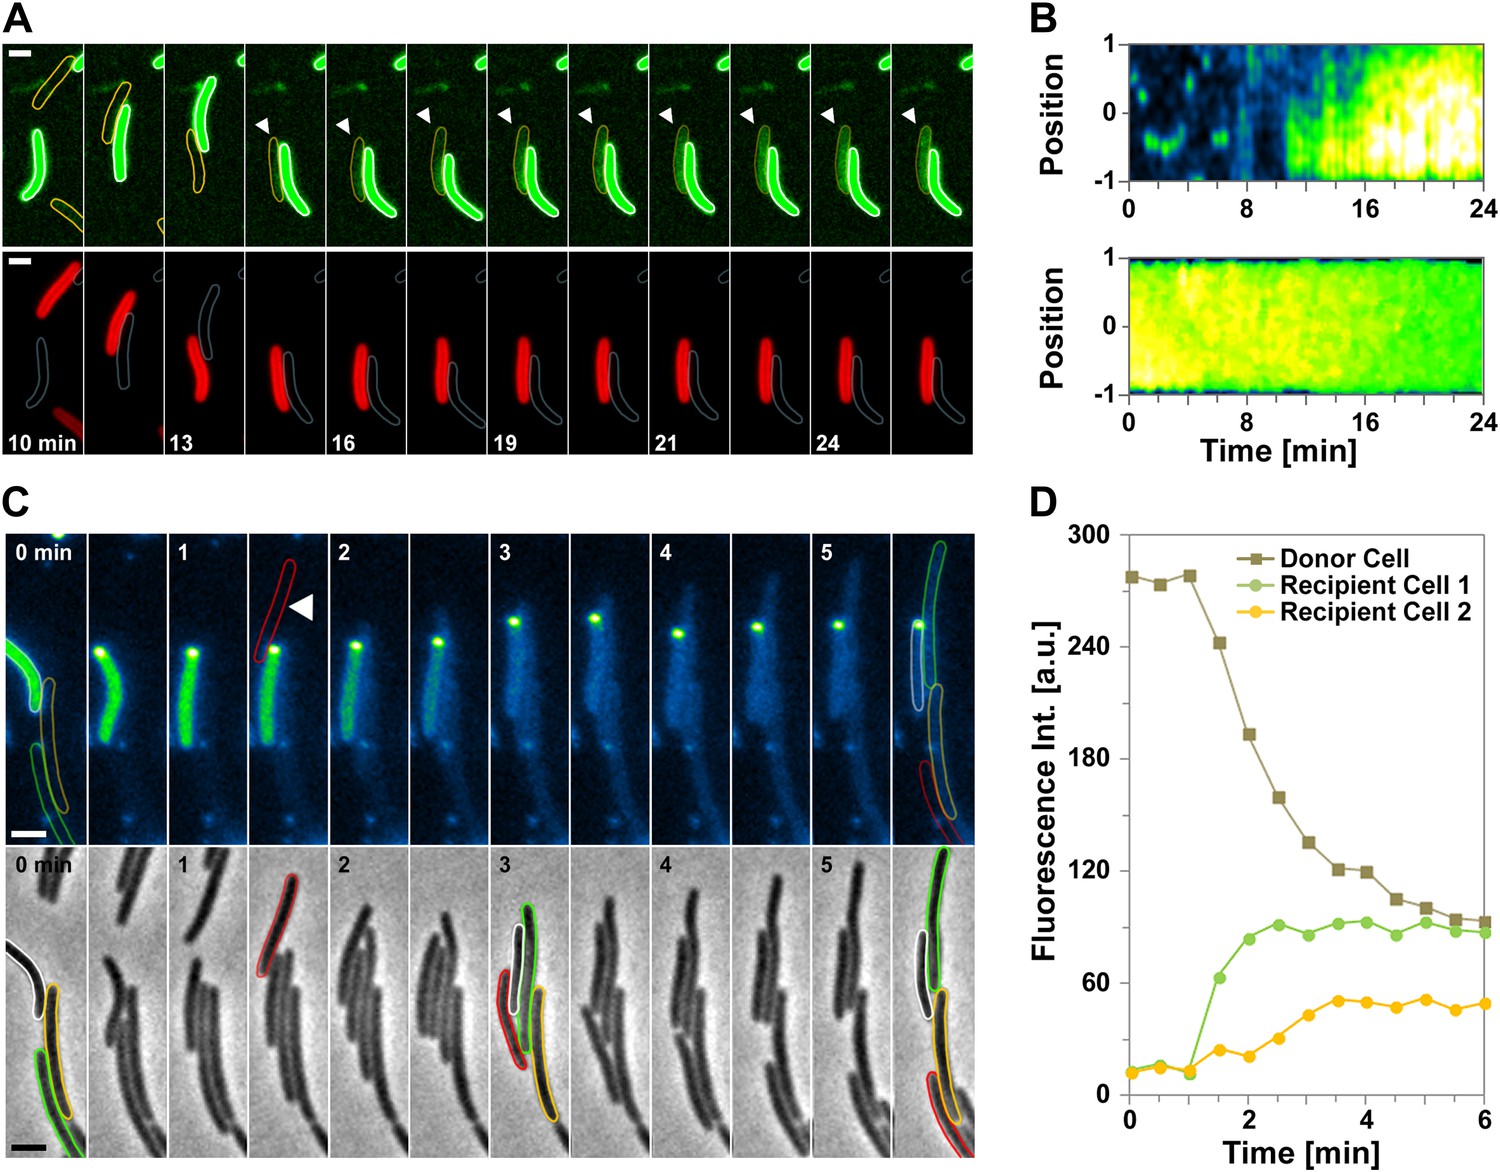
Cell-contact-dependent transfer of OMsfGFP/DiO between single cells.
(A) sfGFP transfer from a donor OMsfGFP+ (white contour in lower panel) cell to a recipient OMsfGFP− IMmCherry+ cell (orange contour in upper panel). Scale bar=1 µm. (B) Kymographs of green fluorescence intensities in the positive recipient cell (top) and the donor cell (bottom) shown in (A). Note that in the recipient cell, green fluorescence diffuses from one half (t12min to t16min) to the entire cell body. The Y-axis of each kymograph represents the relative position along the cell body, where 0 represents mid-cell and 1 or −1 the cell poles. The −1 pole is the pole closer to the bottom of the frames for each cell shown in panel (A). (C) A DiO+ cell (white cell contour) transfers DiO to two unlabeled cells (orange and green contours). Fluorescence and corresponding phase contrast images are shown. Fluorescence fluctuations are shown in pseudo colors where high fluorescence levels appear yellow-green and low fluorescence levels appear blue. Note that the green cell is not immediately in contact with the DiO+ cell. A cell that comes in contact with the DiO+ cell but does not become labeled is shown by a red contour. Scale bar = 1 µm. (D) Mean DiO fluorescence intensity over time in the donor cell (gray square), the first positive recipient cell (green circle) and the second positive recipient cell (orange circle).
Figure 2—figure supplement 1
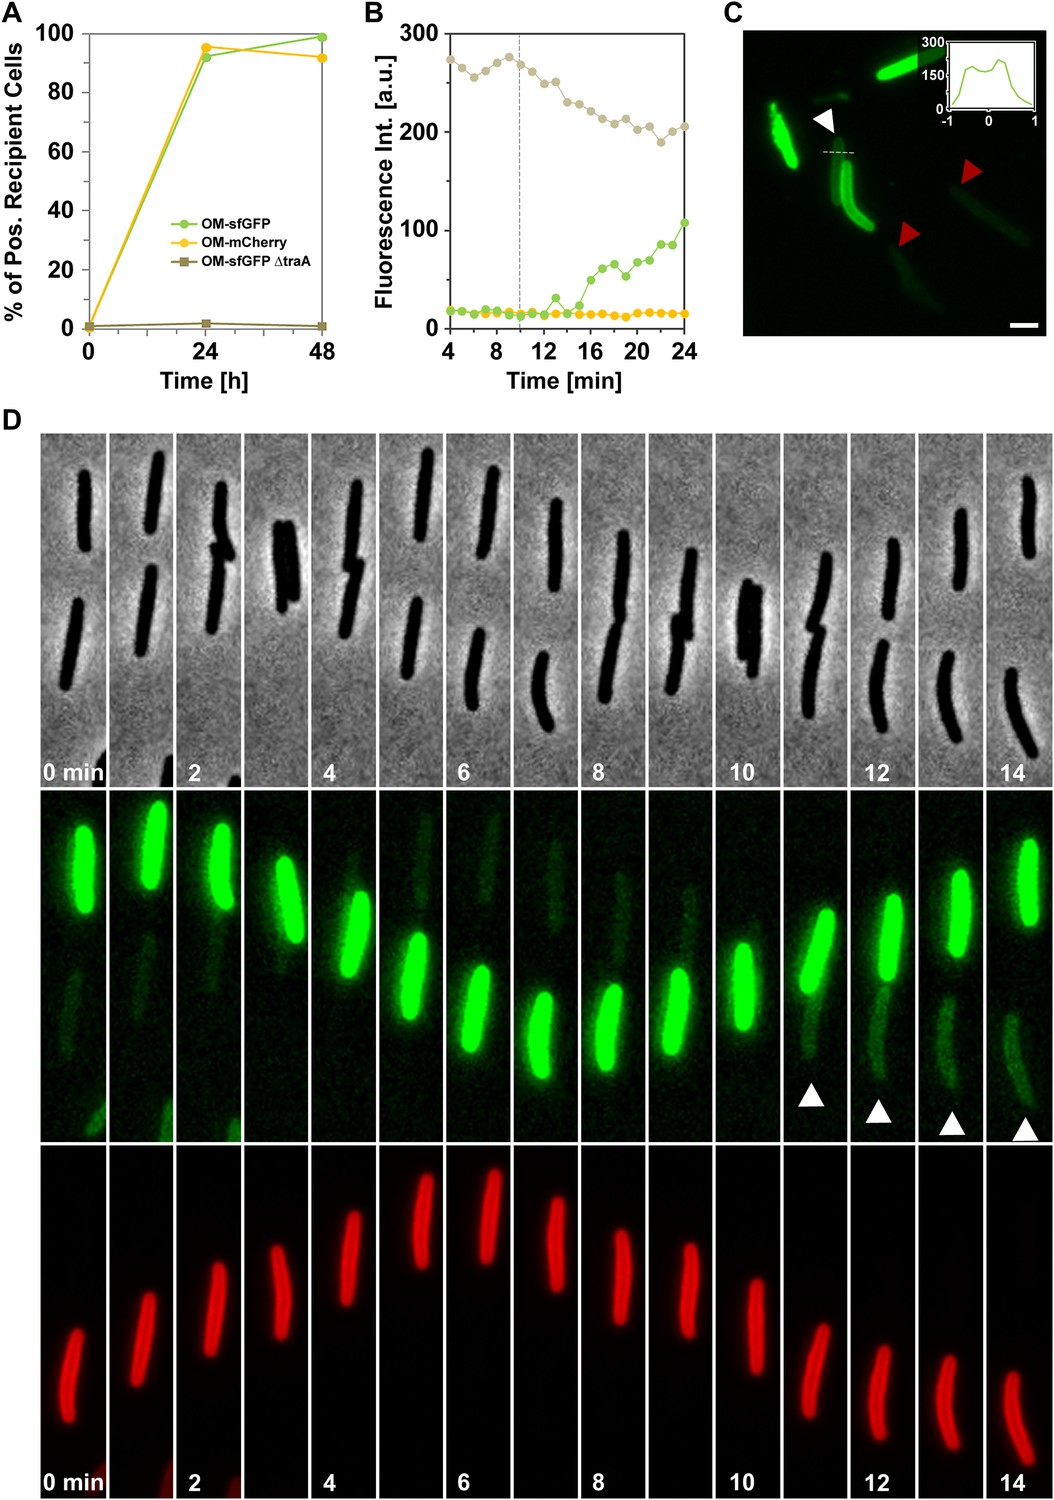
Cell-contact-dependent transfer of OMsfGFP.
(A) OMsfGFP is transferred in a traA dependent-manner. The transfer kinetics of OMmcherry are also shown for comparison. The percentage of fluorescent recipient cells is plotted as a function of time. For each condition and time point, at least 3000 cells were analyzed in triplicate. (B) Mean green fluorescence intensities of distinct cell types over time, donor cell (gray circle), the positive recipient cell (green circle) and a negative and isolated recipient cell (orange circle) observed in Figure 1D. The dashed line represents the time when the donor and recipient cells establish contact. (C) Peripheral membrane staining of the recipient cell shown in Figure 1D (white Arrow). For comparison, the red triangles indicate OMsfGFP− recipient cells (red triangle) showing no significant level of green fluorescence during the time course. The inset shows a trans-section fluorescence scan. The Y-axis represents the fluorescence intensity and the X-axis represents the relative position along the scan represented by the dashed line. (D) OMsfGFP transfer upon transient cell contact between a donor OMsfGFP+ and a recipient IMmCherry+ cell. Note that OMsfGFP transfer is only observed during the second contact between the donor and the recipient cells (white arrow). Scale bar = 1 µm.
Figure 3 with 1 supplement
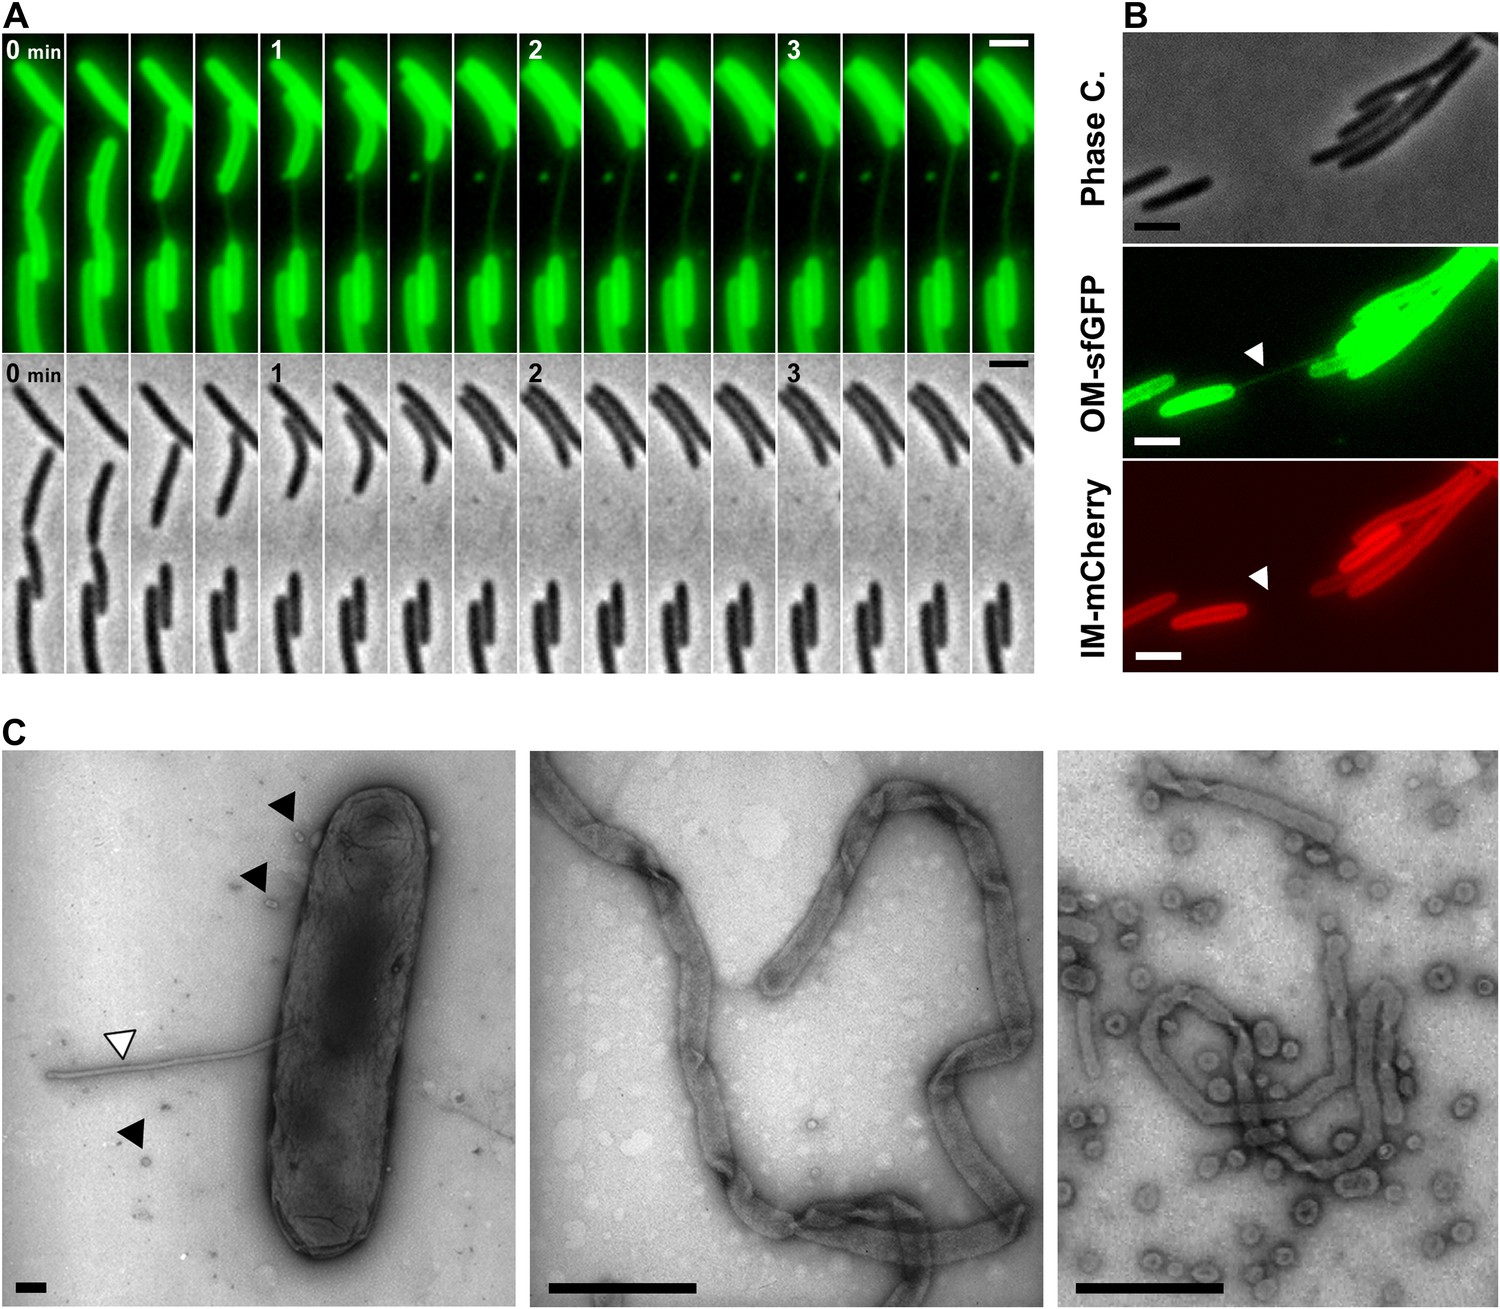
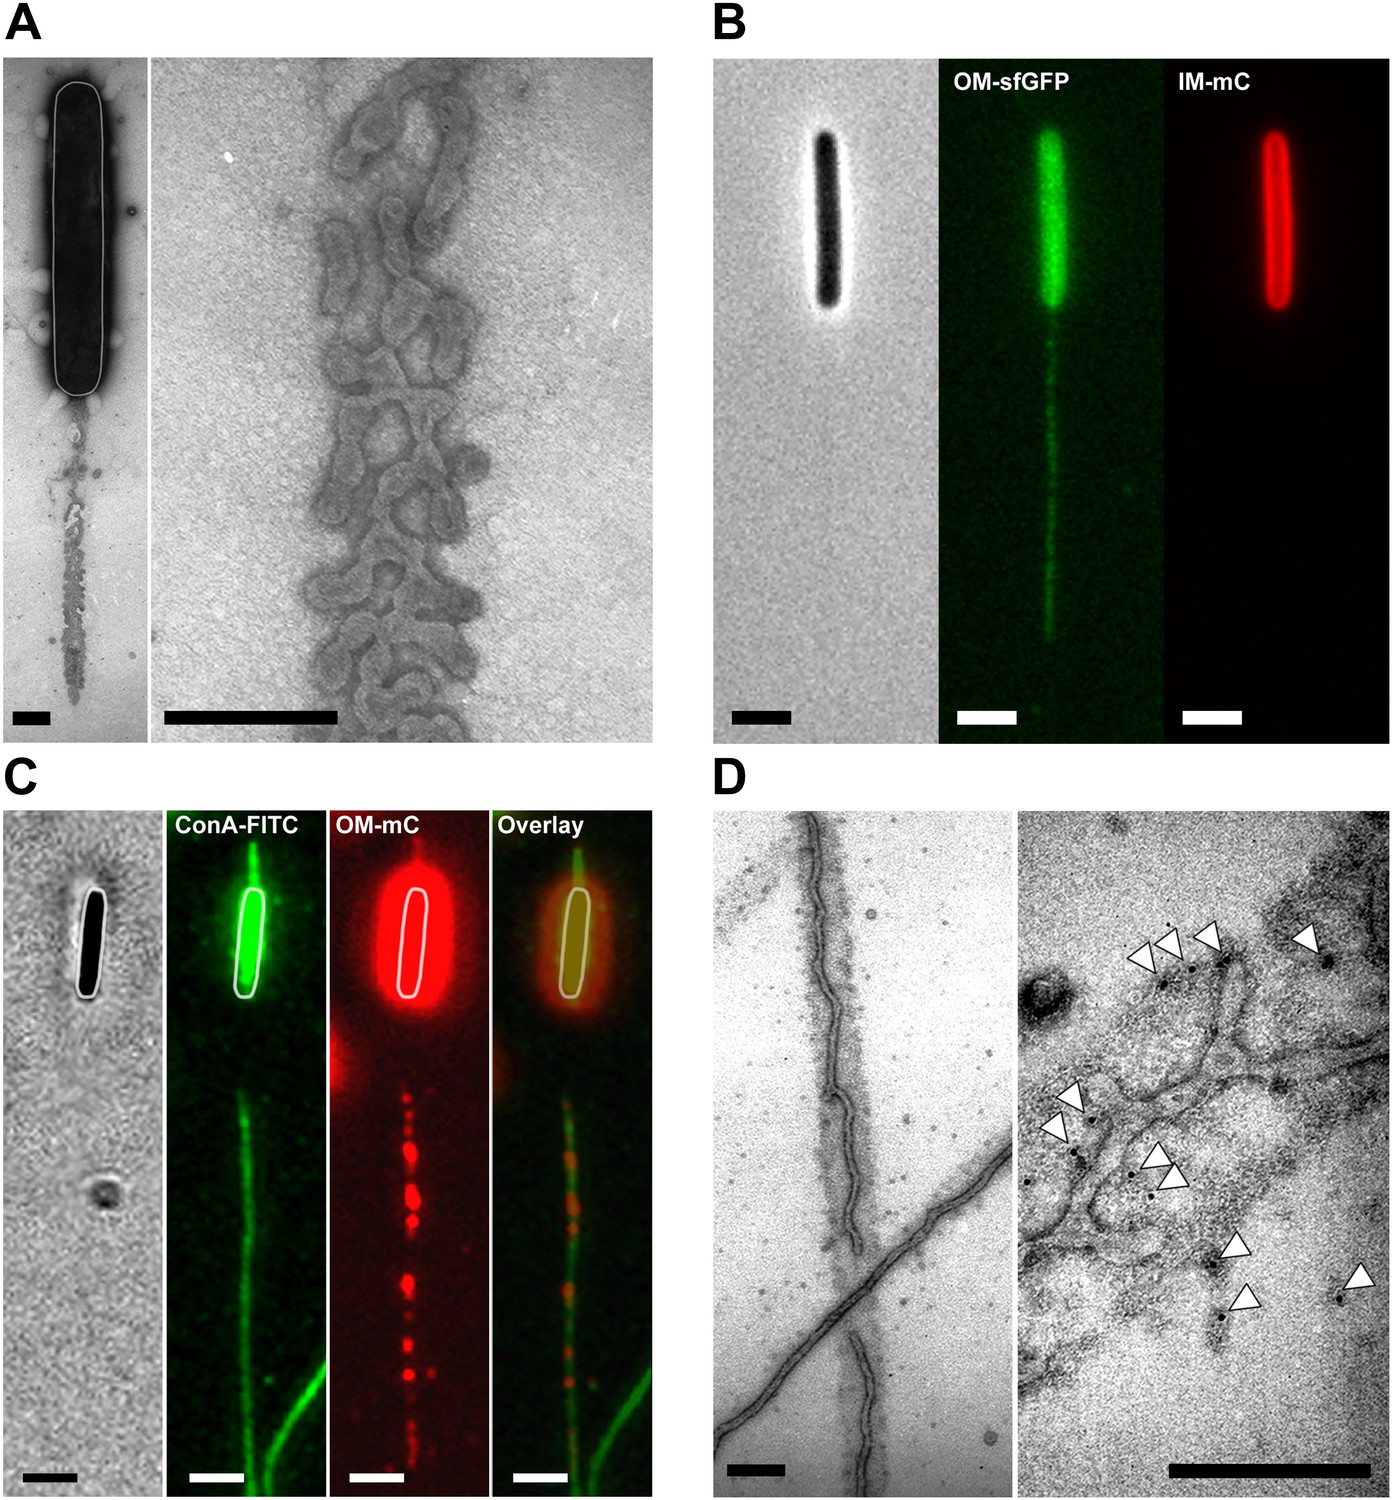
Lipid tubes are OM-derived and are observed when cells move apart.
(A) A lipid tubes formed between two cells expressing OMsfGFP. (B) Lipid tubes formed by OMsfGFP IMmCherry-expressing cells (white arrow). Scale bar = 1 µm. (C) TEM images of lipid tubes. Tubes appear as continuous and flexible structures emerging from the cell surface (white arrow). Note the presence of vesicles in close proximity with the cell body (black arrows, left panel) or around the cells (right panel). Scale bar=250 nm.
Figure 3—figure supplement 1
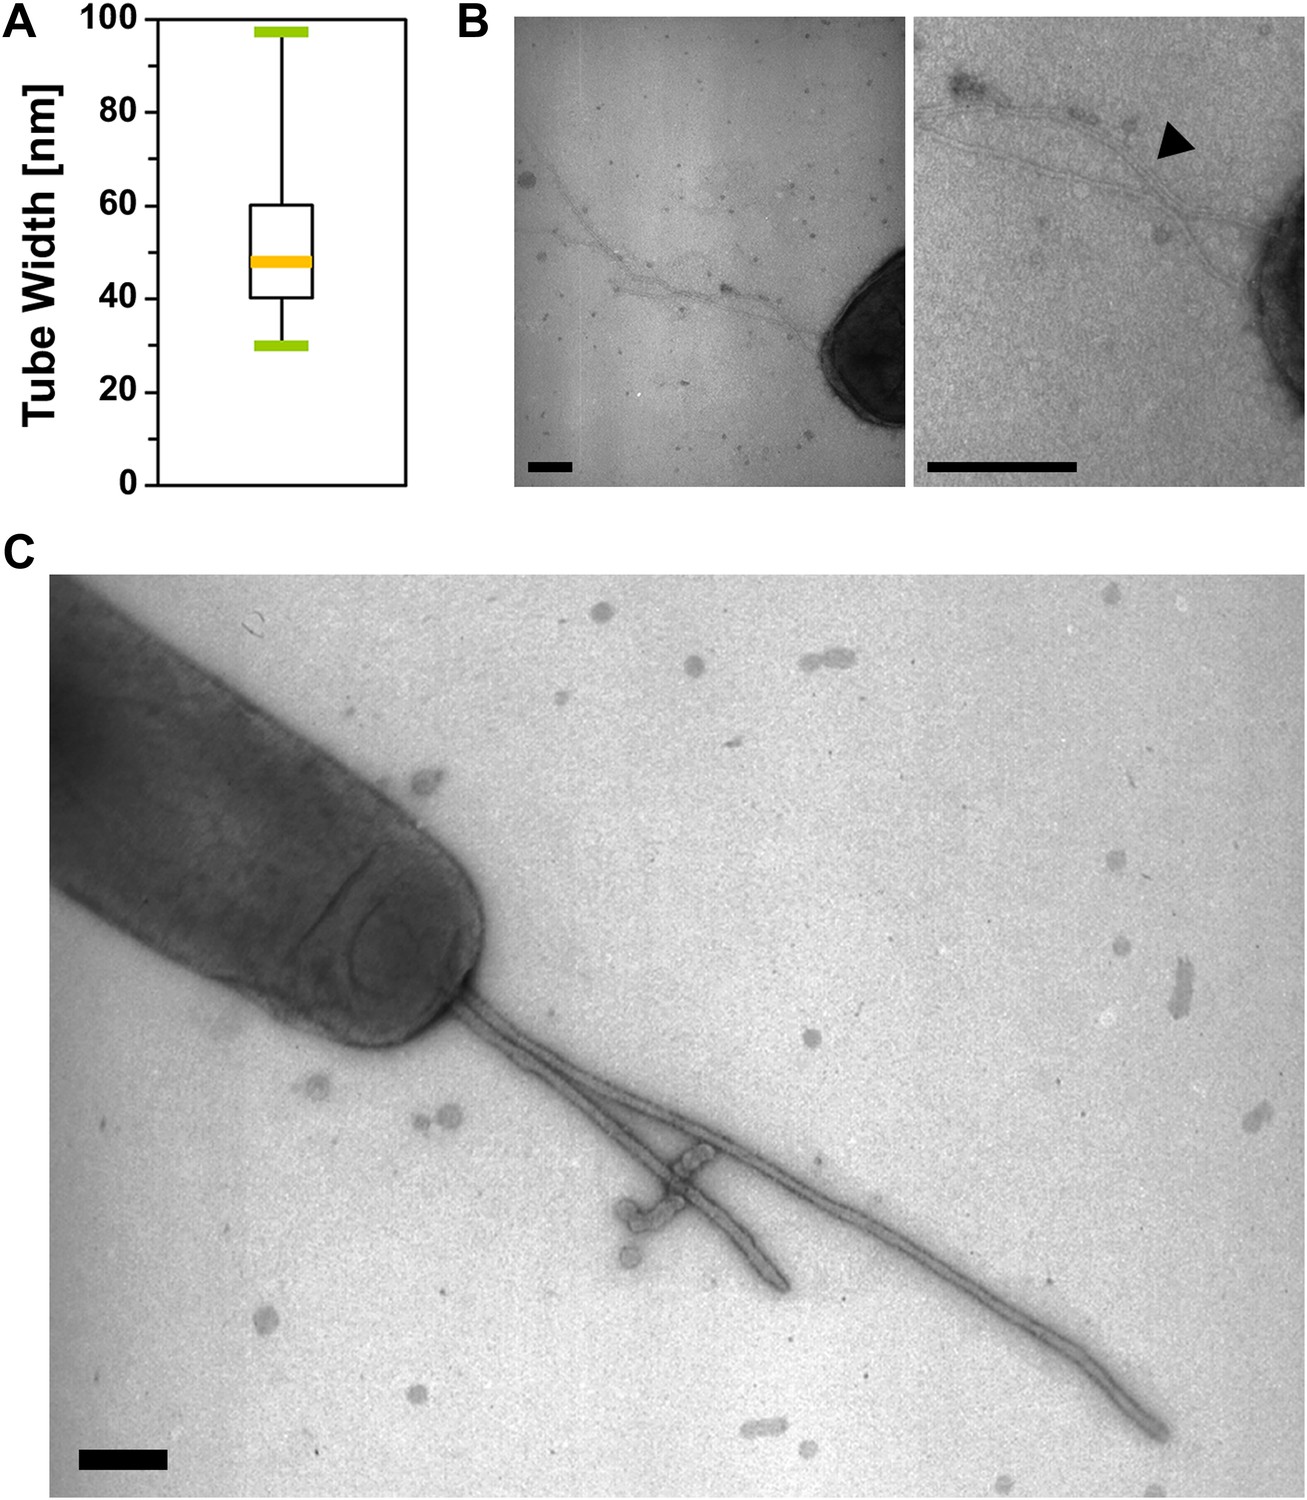
The tubular extensions are not Type-IV pili.
(A) Measured diameters of the tubes observed by TEM. The diameters distribution is shown as a boxplot (n=100). (B) Polar Type-IV pili observed in wt cells by Transmission Electron Microscopy. (Scale bar = 100 nm). (C) Tubes formed by a pilA mutant cell observed by TEM is shown for comparison. (Scale bar = 100 nm).
Figure 4 with 2 supplements
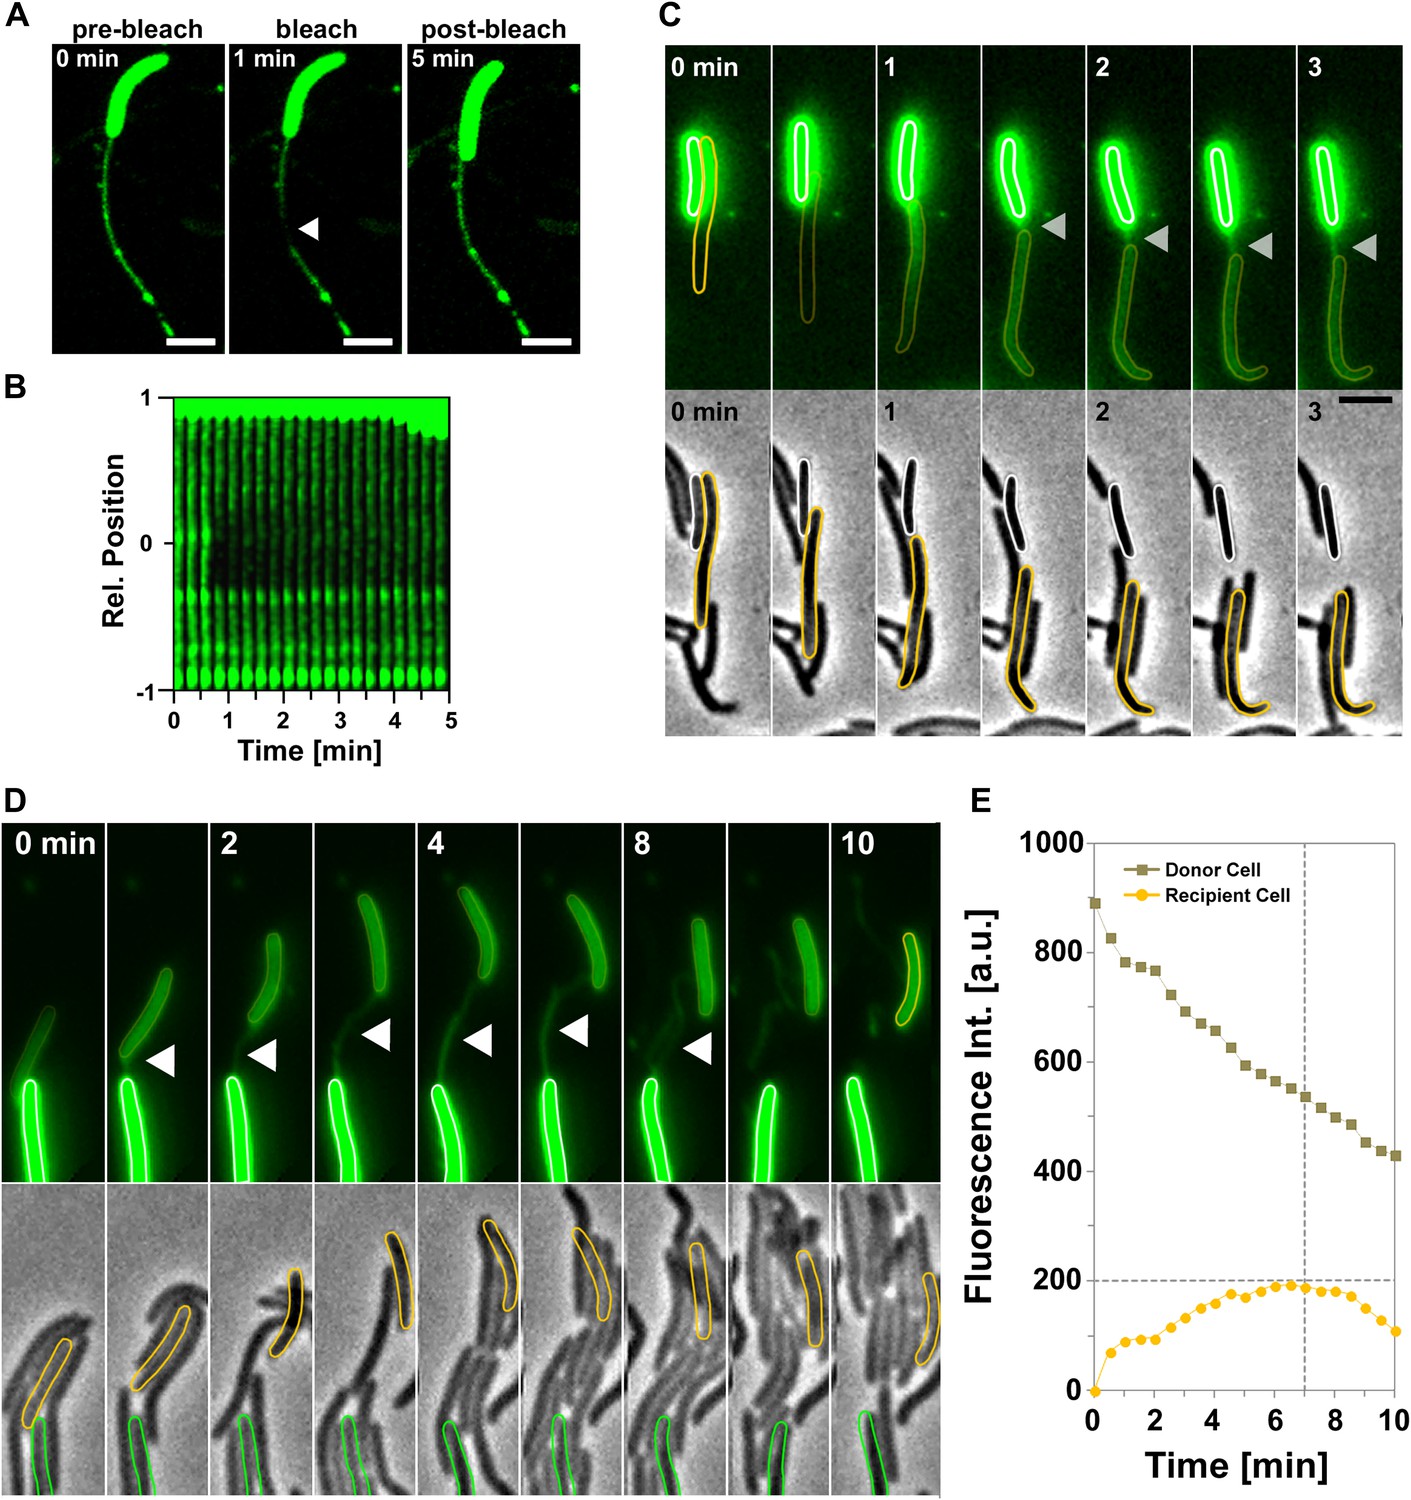
Transfer is driven by transient OM fusion between donor and recipient cells.
(A and B) Fluorescence recovery after photobleaching (FRAP) experiments targeting a tube connected to a single DiO+ cell. Rapid DiO exchange is observed between the tube and the cell body. The cell body is positioned at +1 in (A). (C) DiO transfer and formation of DiO+ tubes between two cells. An unstained recipient cell (orange cell contour) becomes stained in contact with a DiO donor cell (white cell contour). The grey arrow points to a tube formed between the two cells. Note that transfer only occurs between the two cells although other cells are also in contact with the donor cell. Scale bar = 1 µm. (D) DiO is exchanged by tubes connecting two cells. Fluorescence and corresponding phase contrast images between two transferring cells (green and orange contours) are shown. Scale bar = 1 µm. (E) Mean DiO fluorescence intensity over time in the donor cell (gray square) and the recipient cell (orange circle). The vertical dashed line represents the time where the tube connection was ruptured. The horizontal dashed line represents the maximal value of fluorescence intensity observed in the recipient cell.
Figure 4—figure supplement 1
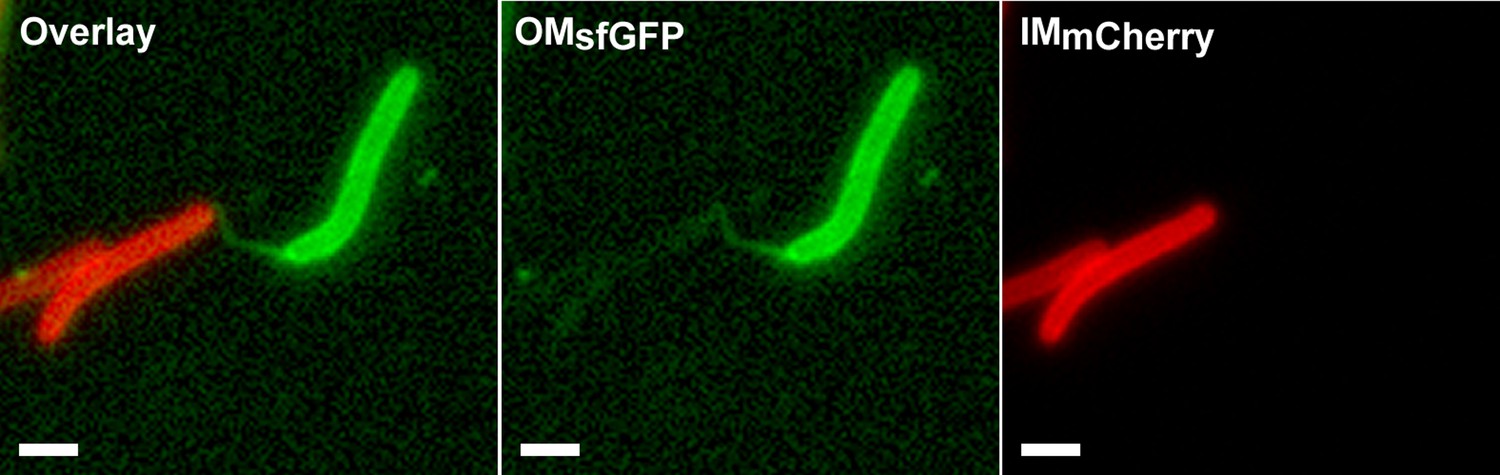
The OMsfGFP or OMmCherry fluorescent probes are not significantly exchanged through the lipid tubes.
OMsfGFP-stained tubes formed between an OMsfGFP+ IMmcherry− cell and an OMsfGFP− IMmcherry+ recipient cell. No significant exchange of green fluorescence can be observed through the tubes. Scale bar = 1 µm.
Figure 4—figure supplement 2
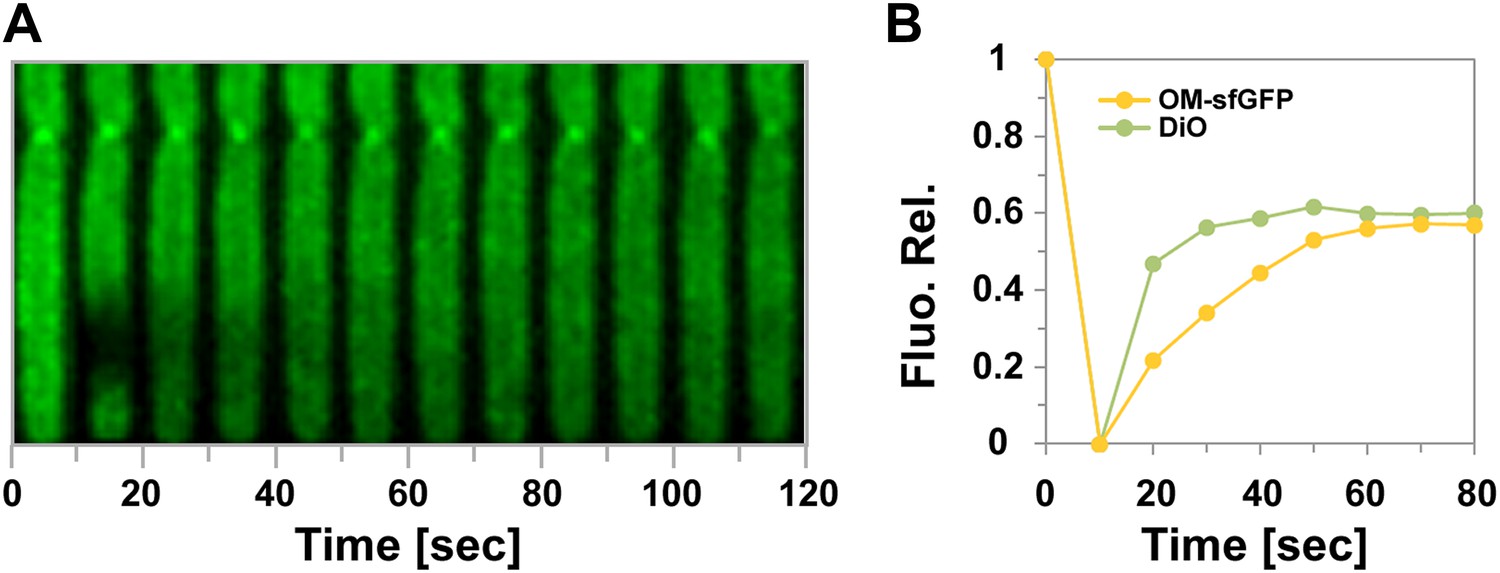
Fluorescence Recovery After Photobleaching (FRAP) experiments targeting indicated fluorescent probes.
(A) Representative fluorescence recovery after FRAP on the cell body of a DiO-stained cell. (B) Comparative recovery kinetics of DiO and OMsfGFP after FRAP.
Figure 5 with 1 supplement
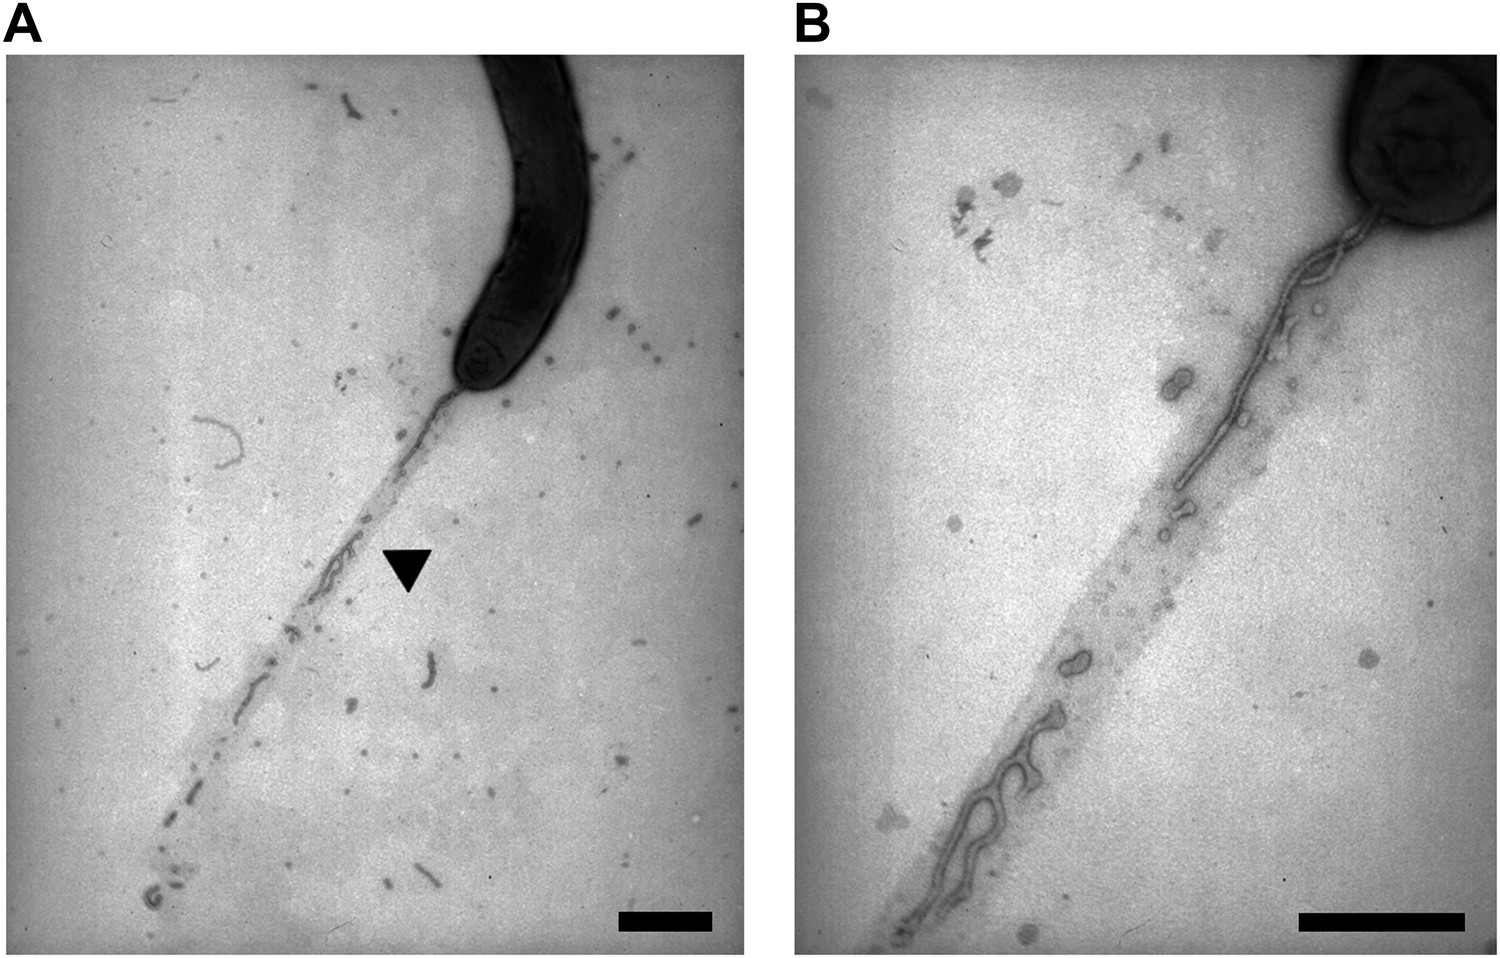
Lipid tubes and vesicles are deposited in slime trails.
(A) TEM images of lipid tubes deposited in the wake of a moving cell (left panel). A higher magnification view of lipid tubes/vesicles is shown in the right panel. Scale bars = 250 nm. (B) Deposition of lipid tubes/vesicles observed by an OMsfGFP+/IMmCherry+ cell. The deposited material is only stained with green fluorescence implying that it is derived from the OM. Scale bar = 1 µm. (C) Co-localization of deposited OM materials detected using OMmCherry probe and slime detected using ConA-FITC. Corresponding phase contrast, red fluorescence, green fluorescence and overlay images are shown. Scale bar = 1 µm. (D) Lipid tubes/vesicles are embedded in the slime polymer (Black Arrow). Electron dense trails are clearly visible after ConA treatment. White arrows highlight gold particles specifically associated with biotinylated ConA and thus slime. Scale bar = 250 nm.
Figure 5—figure supplement 1
Lipid tubes and vesicles are deposited in slime trails.
(A) OM materials are deposited in the wake of motile cells and specifically associated with slime. A higher magnification view of lipid tubes/vesicles is shown in the panel (B). Scale bars = 500 nm.
Figure 6 with 2 supplements

Distribution of TraA is restricted to the deltaproteobacteria.
(A) TraA homologues in Myxococcus xanthus DK1622 (gi|108763680), Myxococcus stipitatus (gi|442324418), Corallococcus coralloides (gi|383459429), Myxococcus fulvus (gi|338532052), Stigmatella aurantiaca (gi|310818240), Cystobacter fuscus (gi|444910311), Haliangium Ochraceum (gi|262197466), Sorangium Cellulosum (gi|162451690). (B) The PA-14 domain is variable in Myxococcus xanthus strains. The conservation of the Ct domain is shown for comparison. Sequence database access numbers are shown to the left.
Figure 6—figure supplement 1
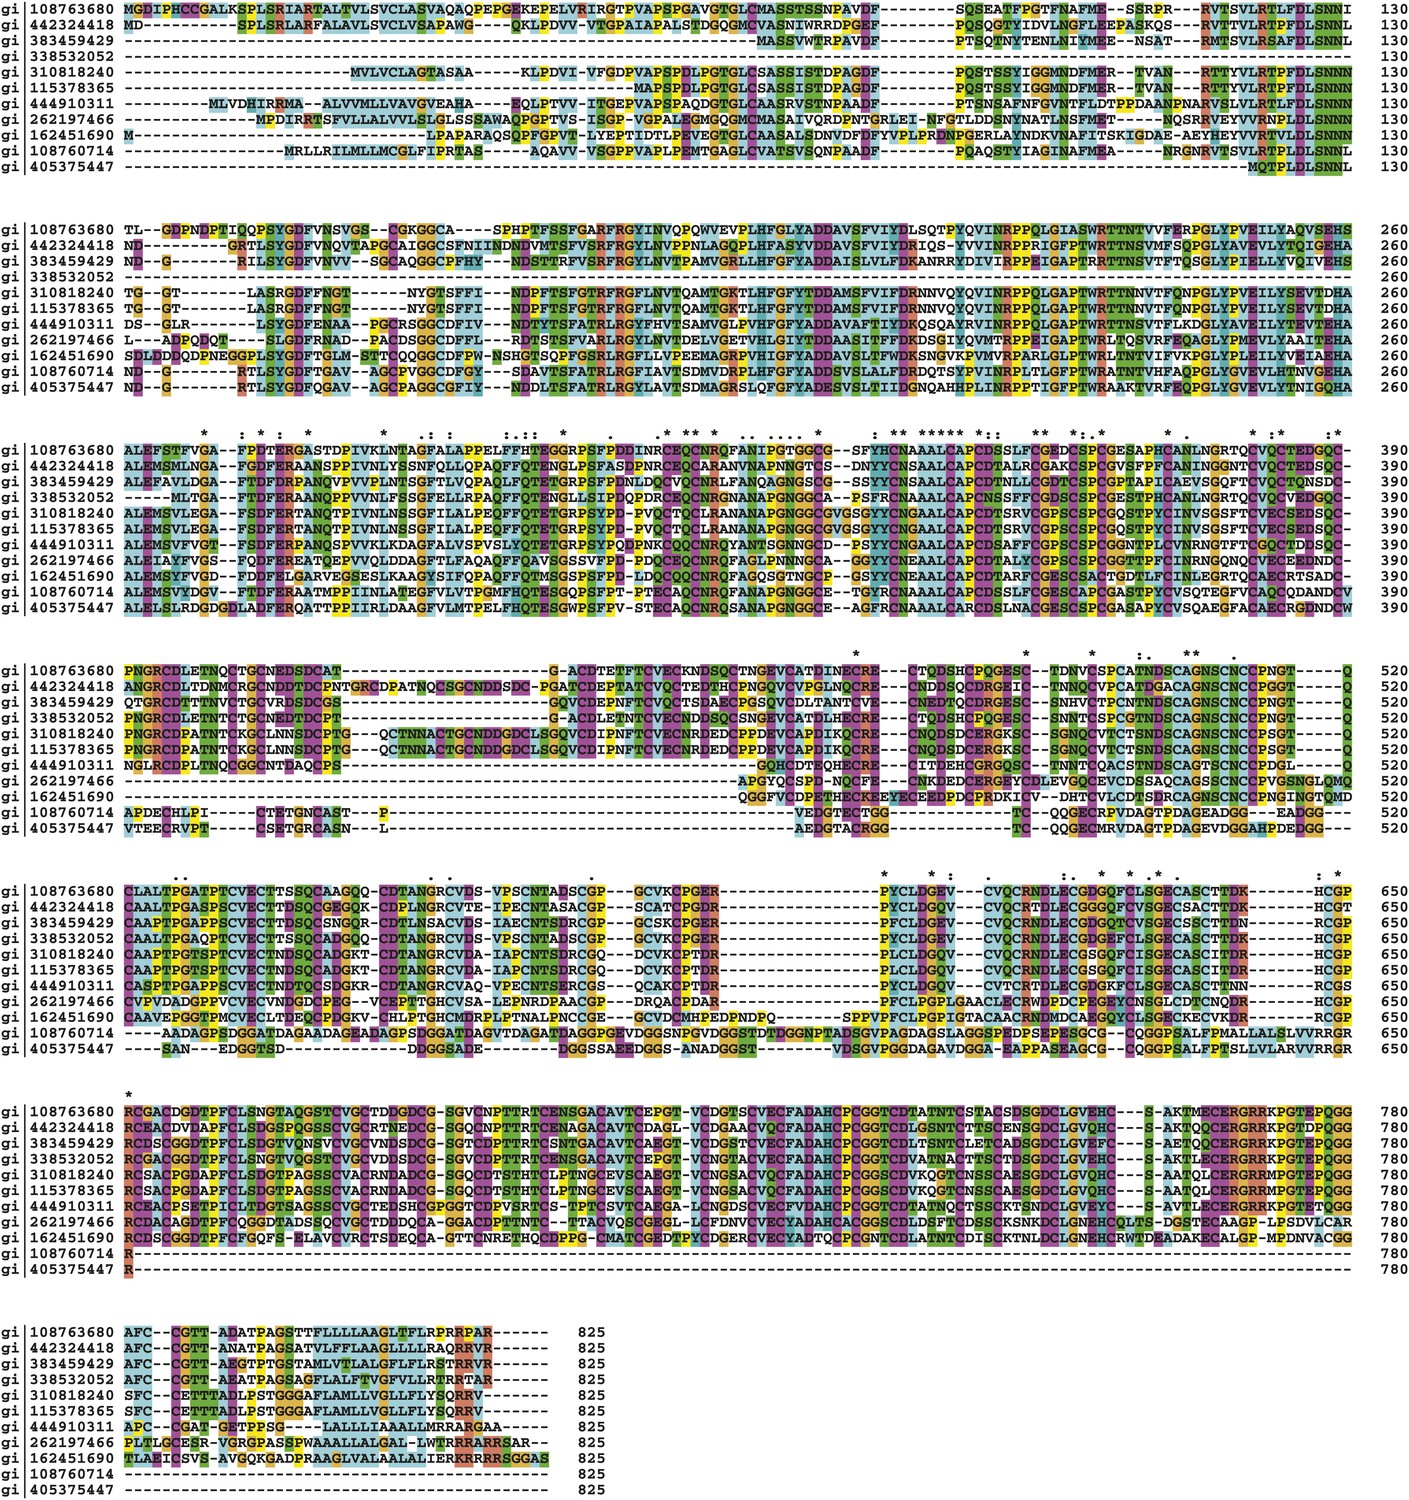
TraA homologues in deltaproteobacteria.
ClustalW alignment of TraA homolog: Myxococcus xanthus DK1622 (gi|108763680), Myxococcus stipitatus (gi|442324418), Corallococcus coralloides (gi|383459429), Myxococcus fulvus (gi|338532052), Stigmatella aurantiaca (gi|310818240), Cystobacter fuscus (gi|444910311), Haliangium Ochraceum (gi|262197466), Sorangium Cellulosum (gi|162451690).
Figure 6—figure supplement 2
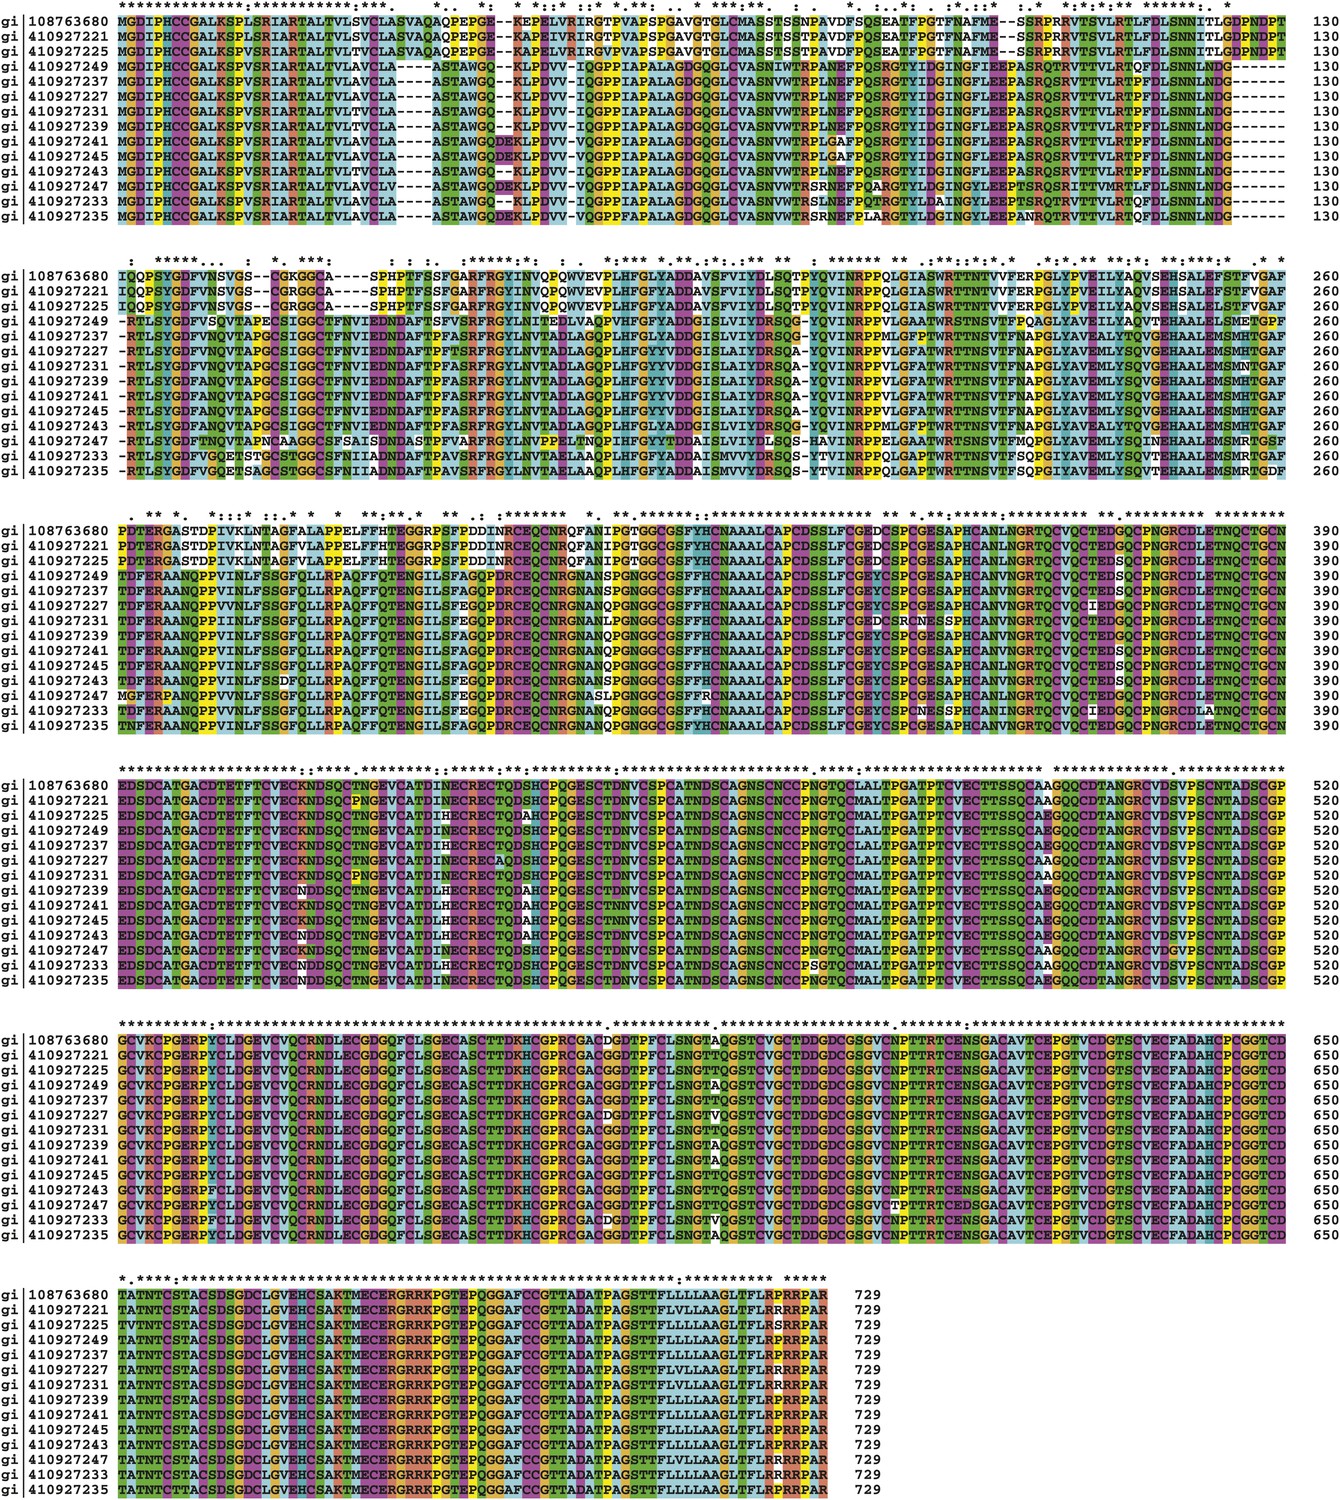
ClustalW alignment of TraA in Myxococcus xanthus strains.
Note that most amino acids variations are localized in the first 300 N-terminal residues region encompassing the so-called PA14 domain.
Videos
Video 1
Live observations of cell–contact dependent transfer of OMsfGFP between single cells.
Corresponding green fluorescence and red fluorescence are shown. For details see Figure 2. Pictures were taken every 30 s.
Video 2
Live observations of cell–contact dependent transfer of OMsfGFP between single cells.
Corresponding phase contrast, green fluorescence and red fluorescence are shown. Pictures were taken every 30 s.
Video 3
Live observations of cell–contact dependent transfer of DiO between single cells.
Corresponding phase contrast and green fluorescence which are displayed in pseudo colors, are shown. For details see Figure 3A. Pictures were taken every 30 s.
Video 4
Formation of OMsfGFP tubes between two cells.
Corresponding phase contrast and green fluorescence are shown. Pictures were taken every 30 s.
Video 5
Live observations of DiO transfer and formation of DiO+ tubes between two cells.
For details see Figure 3A. Corresponding phase contrast and green fluorescence are shown. Pictures were taken every 30 s.
Video 6
Live observations of DiO transfer and formation of DiO+ tubes between two cells.
For details see Figure 3C. Corresponding phase contrast and green fluorescence are shown. Pictures were taken every 30 s.
Additional files
-
Supplementary file 1
(A) Strains used in this study. (B) Primers used in this study. (C) Plasmids used in this study and their mode of construction.
- https://doi.org/10.7554/eLife.00868.023
Download links
A two-part list of links to download the article, or parts of the article, in various formats.
Downloads (link to download the article as PDF)
Open citations (links to open the citations from this article in various online reference manager services)
Cite this article (links to download the citations from this article in formats compatible with various reference manager tools)
Direct live imaging of cell–cell protein transfer by transient outer membrane fusion in Myxococcus xanthus
eLife 2:e00868.
https://doi.org/10.7554/eLife.00868


