UNC-13L, UNC-13S, and Tomosyn form a protein code for fast and slow neurotransmitter release in Caenorhabditis elegans
- Massachusetts General Hospital, United States
- Harvard Medical School, United States
Figures
Figure 1
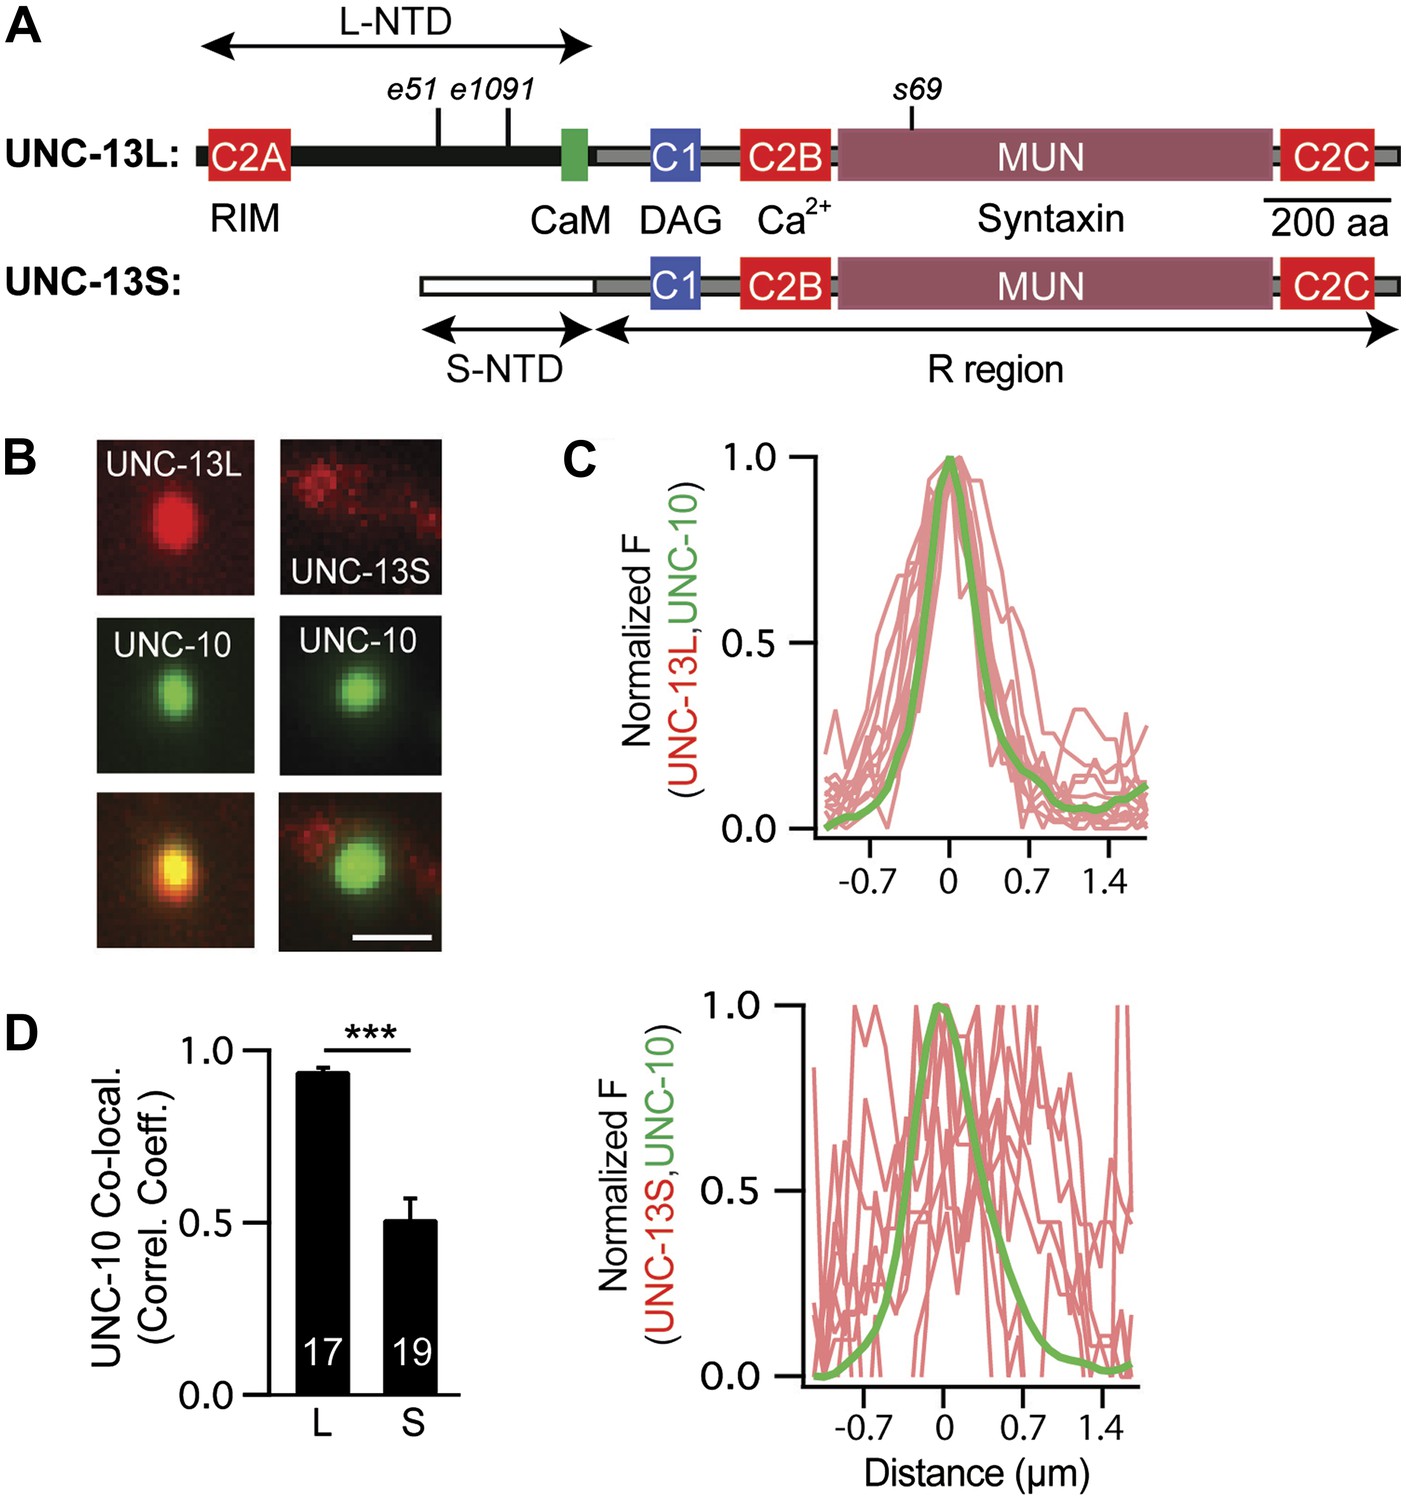
UNC-13L and UNC-13S have distinct localization patterns in axons.
(A) The domain structure of UNC-13L (encoded by exons 1–31, excluding exon 14) and UNC-13S (exons 14–31) are illustrated. Ligands for each domain are indicated. The R region (1205 aa, comprising C1, C2B, MUN, and C2C domains) is shared between the two isoforms and is encoded by exons 15–31. Each isoform has a unique NTD. The L-NTD (610 aa) is encoded by exons 1–13 and contains a C2A domain (aa 1–96) and a predicted calmodulin binding site (green box, aa 556–610). The S-NTD (259 aa) is encoded by exon 14. The e51 and e1091 alleles correspond to nonsense mutations in L-NTD exons (exons 11 and 12, respectively). The s69 allele corresponds to a 5 base pair deletion in an R domain exon (exon 21). (B–D) The localization of UNC-10/RIM in dorsal cord axons is compared to that of UNC-13L and UNC-13S. GFP-tagged UNC-10 and mCherry-tagged UNC-13L and UNC-13S were expressed in the DA and DB motor neurons of wild-type animals (using the unc-129 promoter). Representative images (B), line scans (C) of active zones (identified by UNC-10/RIM fluorescence), and correlation coefficients (D) for UNC-10/RIM and UNC-13 fluorescence at synaptic puncta are shown. Line scans show normalized fluorescence values for UNC-10 (green) and UNC-13 (red). The UNC-10 trace is the averaged line scan from 20 puncta. The red traces represent UNC-13 line scans at 10 representative active zones. Scale bar indicates 1 μm. Values that differ significantly are indicated (***p<0.001). The number of animals analyzed is indicated for each genotype. Error bars indicate SEM.
Figure 2 with 1 supplement
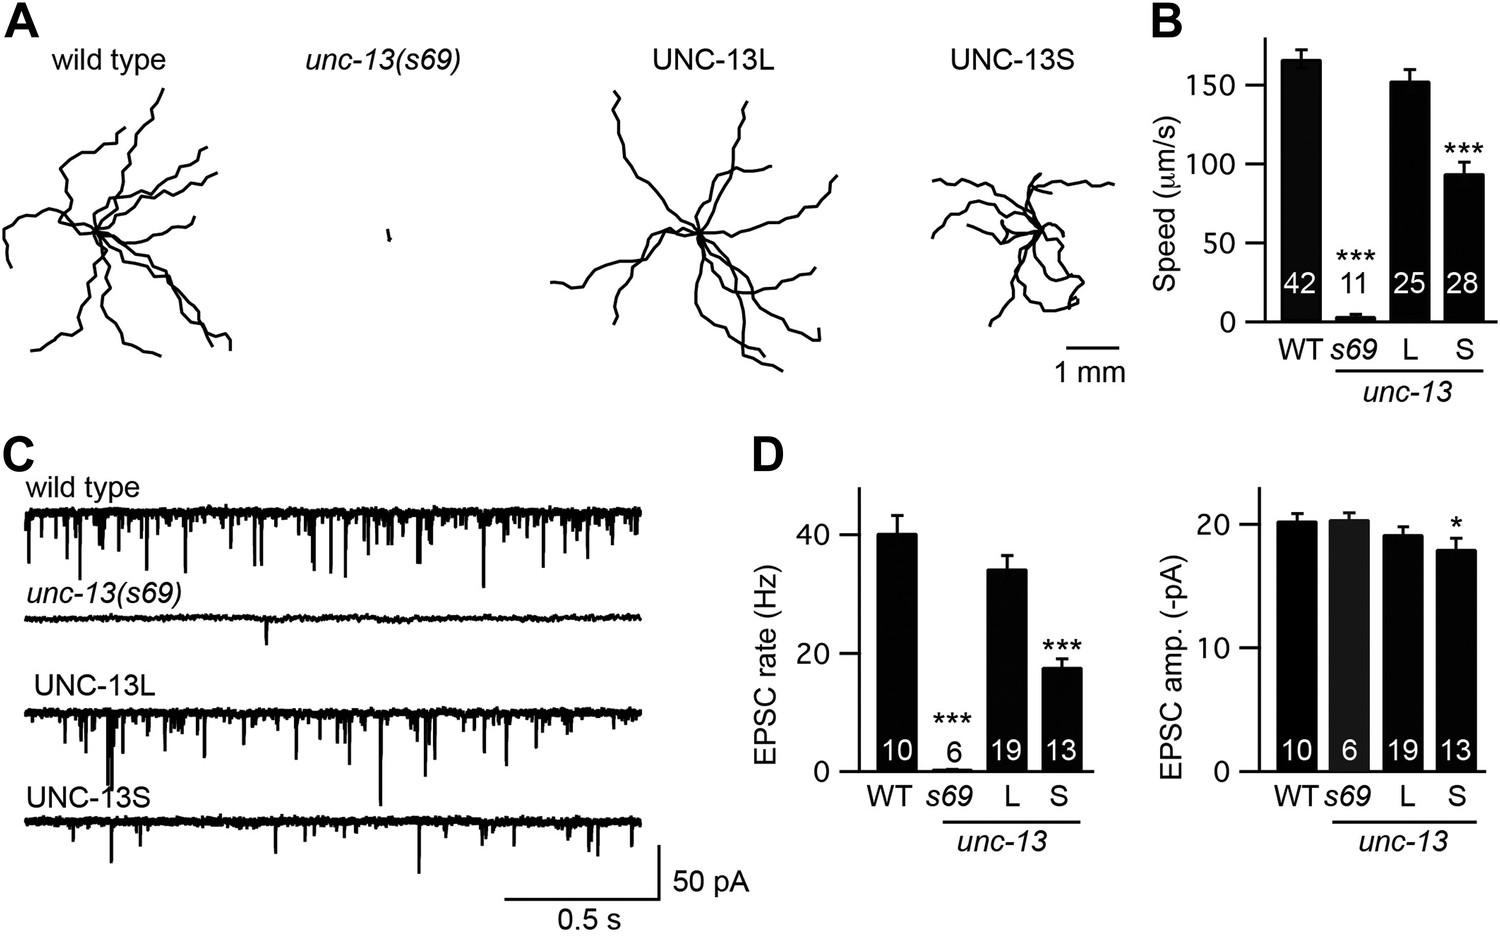
UNC-13L and UNC-13S both reconstitute locomotion behavior in unc-13 mutants.
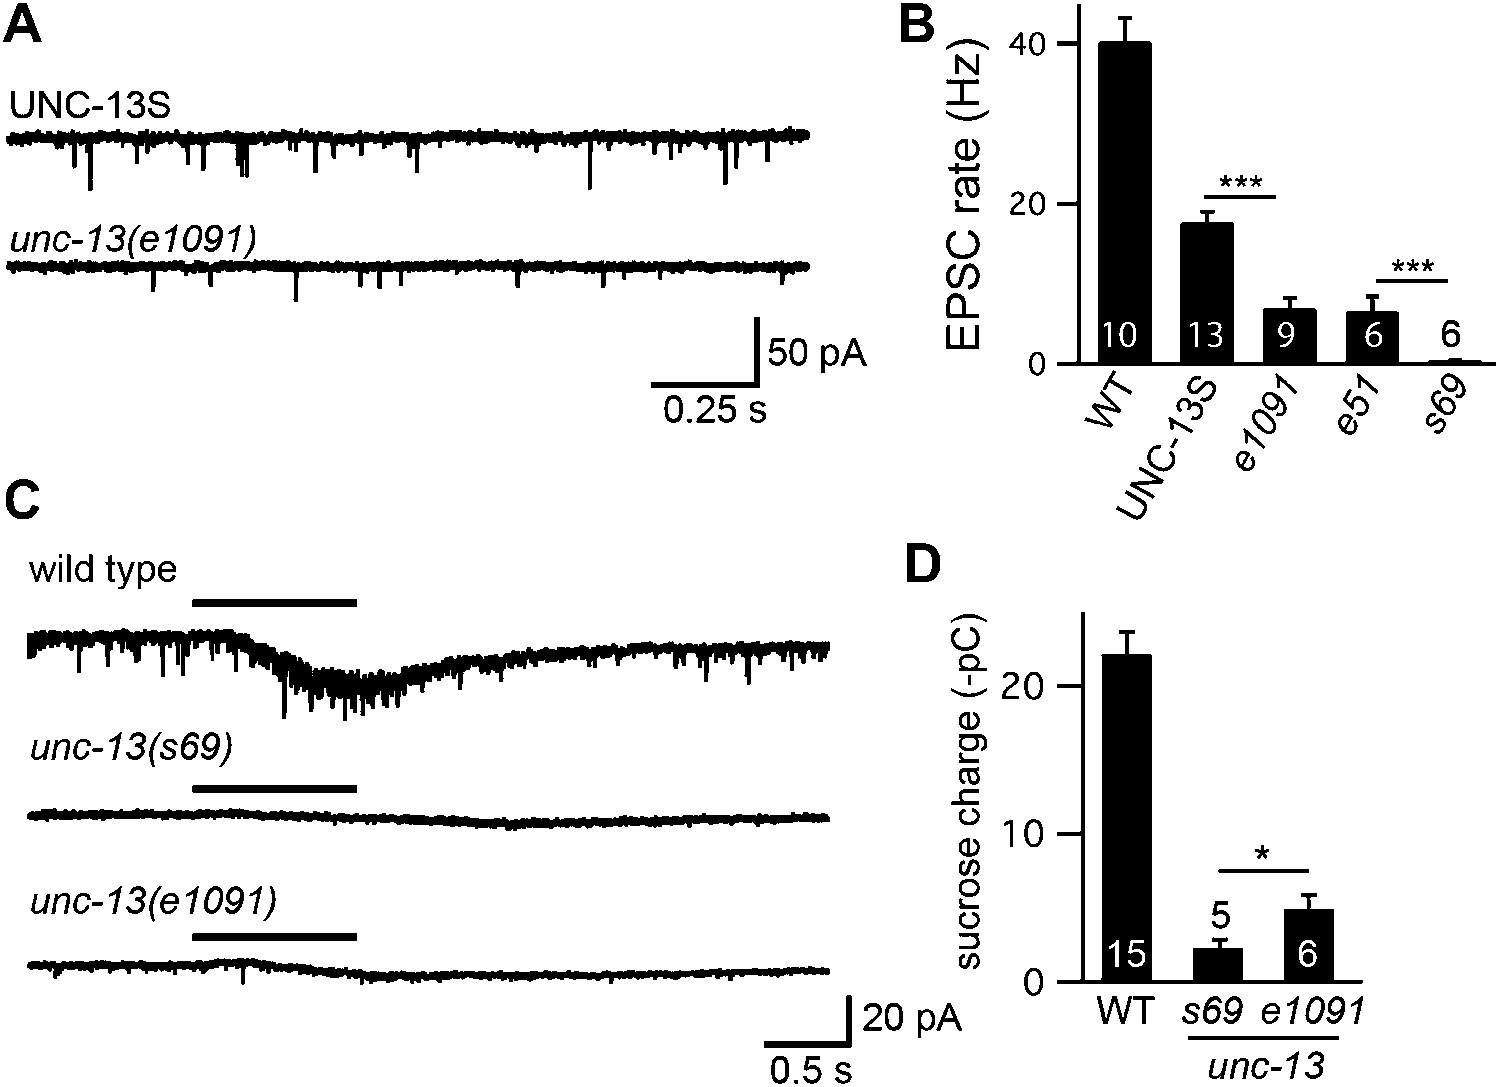
(A and B) Locomotion behavior was analyzed for the indicated genotypes. (A) Representative 20 s locomotion trajectories are shown (n = 10 animals for each genotype). The starting points for each trajectory were aligned for clarity. (B) Locomotion rates are compared. UNC-13L (KP6893) and UNC-13S (KP6899) refer to unc-13(s69) mutants containing the indicated transgenes. (C and D) Endogenous EPSCs were recorded from adult body wall muscles of the indicated genotypes. Representative traces (C) and summary data (D) are shown. Values that differ significantly from wild-type controls are indicated (***p<0.001, *p<0.05). The number of animals analyzed is indicated for each genotype. Error bars indicate SEM.
Figure 2—figure supplement 1
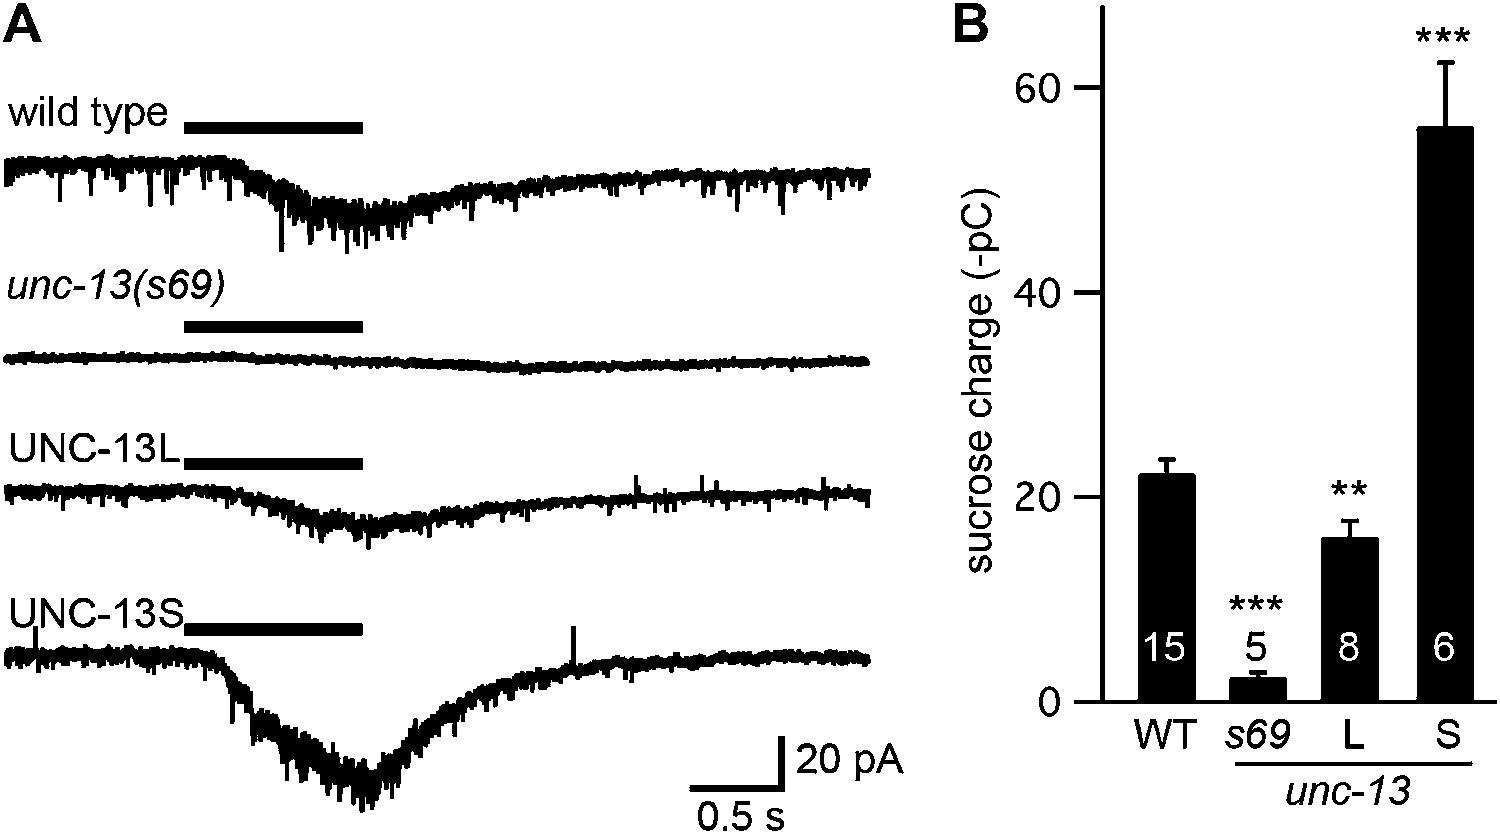
UNC-13L and UNC-13S both restore SV priming.
Sucrose-evoked EPSCs were recorded from adult body wall muscles of the indicated genotypes. Representative traces (A) and summary data (B) are shown. The bar above each trace indicates the 1 s application of sucrose. (B) The total synaptic charge transfer was measured for 1 s after initiation of the sucrose stimulus for each genotype. UNC-13L and UNC-13S refer to unc-13(s69) mutants containing the indicated transgene. Values that differ significantly from wild-type controls are indicated (***p<0.001, **p<0.01). The number of animals analyzed is indicated for each genotype. Error bars indicate SEM.
Figure 3 with 1 supplement
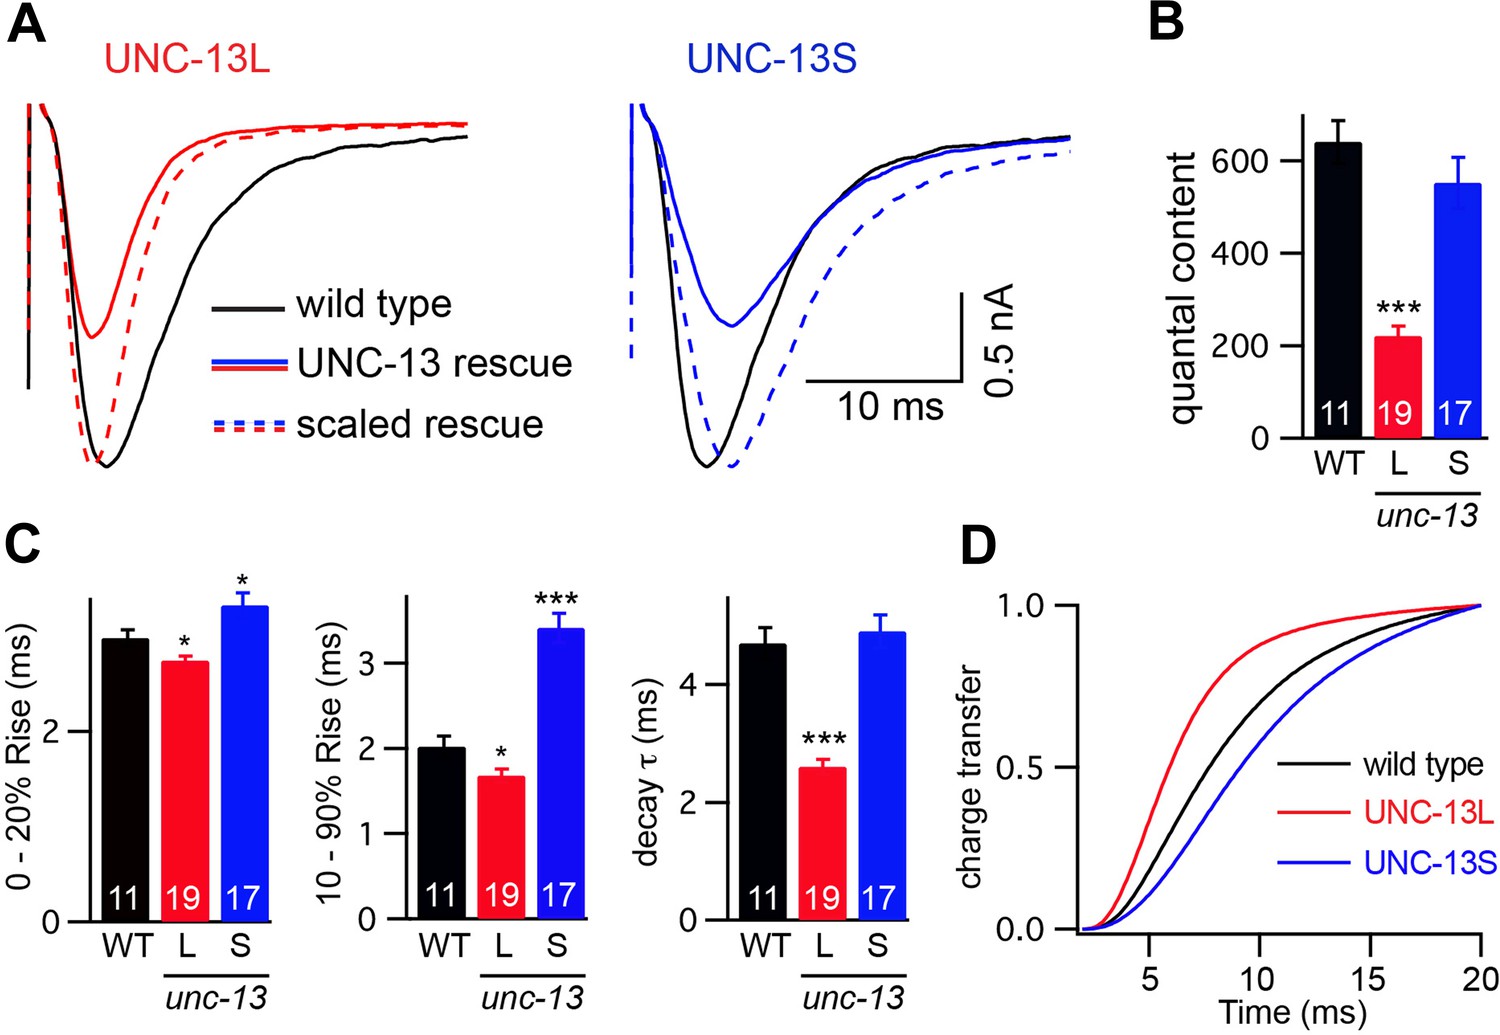
UNC-13L and UNC-13S mediate fast and slow release, respectively.
Stimulus-evoked EPSCs were recorded from adults body wall muscles of the indicated genotypes. Averaged traces (A), quantal content (B), latency (0–20% rise time), activation (10–90% rise time), decay kinetics (C), and the cumulative charge transfer (D) are shown. Quantal content was calculated as the ratio of the charge transfer occurring during an evoked response to that occurring during an endogenous EPSC. Values that differ significantly from wild-type controls are indicated (***p<0.001, *p<0.05). The number of animals analyzed is indicated for each genotype. Error bars indicate SEM.
Figure 3—figure supplement 1
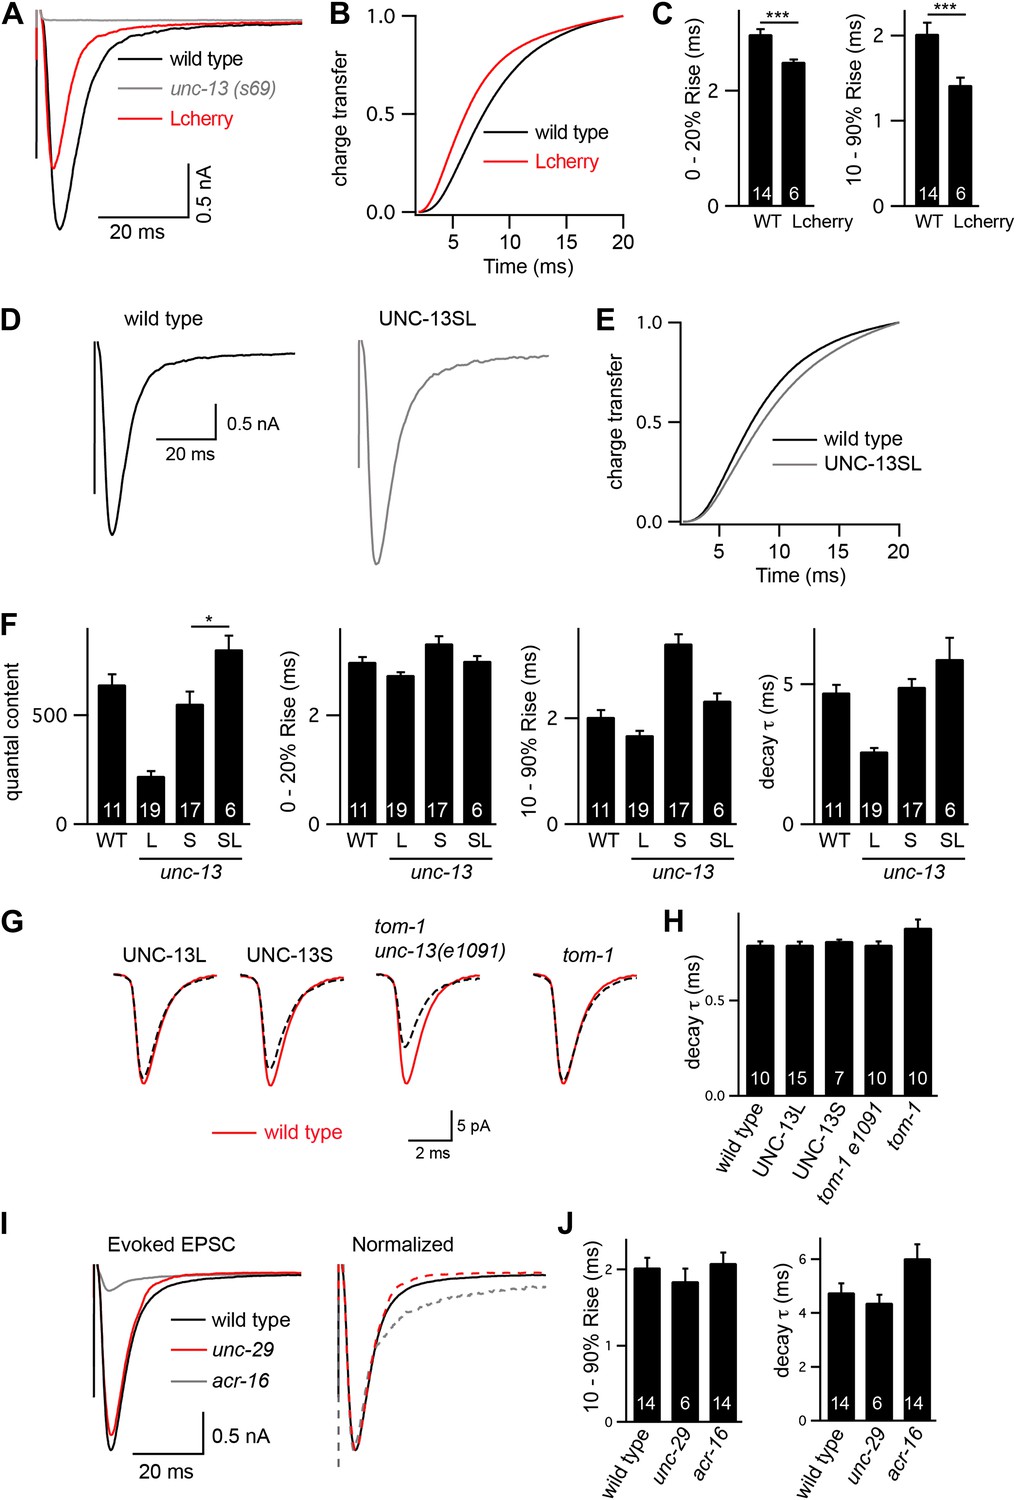
Controls for experiments shown in Figure 3.
(A–C) Rescue of unc-13(s69) by UNC-13L constructs containing a c-terminal mCherry tag. Stimulus-evoked EPSCs were recorded from body wall muscles of wild-type adults of the indicated genotypes. Averaged traces (A), cumulative charge transfer (B), and activation kinetics (C) are shown. mCherry-tagged UNC-13L-mediated evoked responses that have faster activation kinetics than wild-type controls. (D–F) Rescue of unc-13(s69) by coexpression of UNC-13L and UNC-13S constructs. Stimulus-evoked EPSCs were recorded from body wall muscles of wild-type adults of the indicated genotypes. Averaged traces (D), cumulative charge transfer (E), quantal content, activation, and decay kinetics (F) are shown. In strains coexpressing UNC-13S and UNC-13L, quantal content was slightly larger than in wild-type controls, whereas activation and decay kinetics were not significantly altered (G and H). Changes in the intrinsic kinetics of muscle ACh responses cannot account for changes in evoked EPSC kinetics. Endogenous EPSCs were recorded from the indicated genotypes. Averaged traces (G) and decay kinetics (H) are shown (I and J). Changes in the composition of postsynaptic ACh receptors cannot account for the change in evoked EPSC kinetics. Evoked EPSCs were recorded from the indicated genotypes. Averaged responses (I, left), normalized responses (I, right), and activation and decay kinetics (J) are shown. Mutants lacking homopentameric ACR-16 receptors and those lacking heteropentameric levamisole receptors (unc-29 mutants) were analyzed. Values that significantly differ from wild-type controls are indicated (***p<0.001, *p<0.05). The number of animals analyzed is indicated for each genotype. Error bars indicate SEM.
Figure 4 with 1 supplement
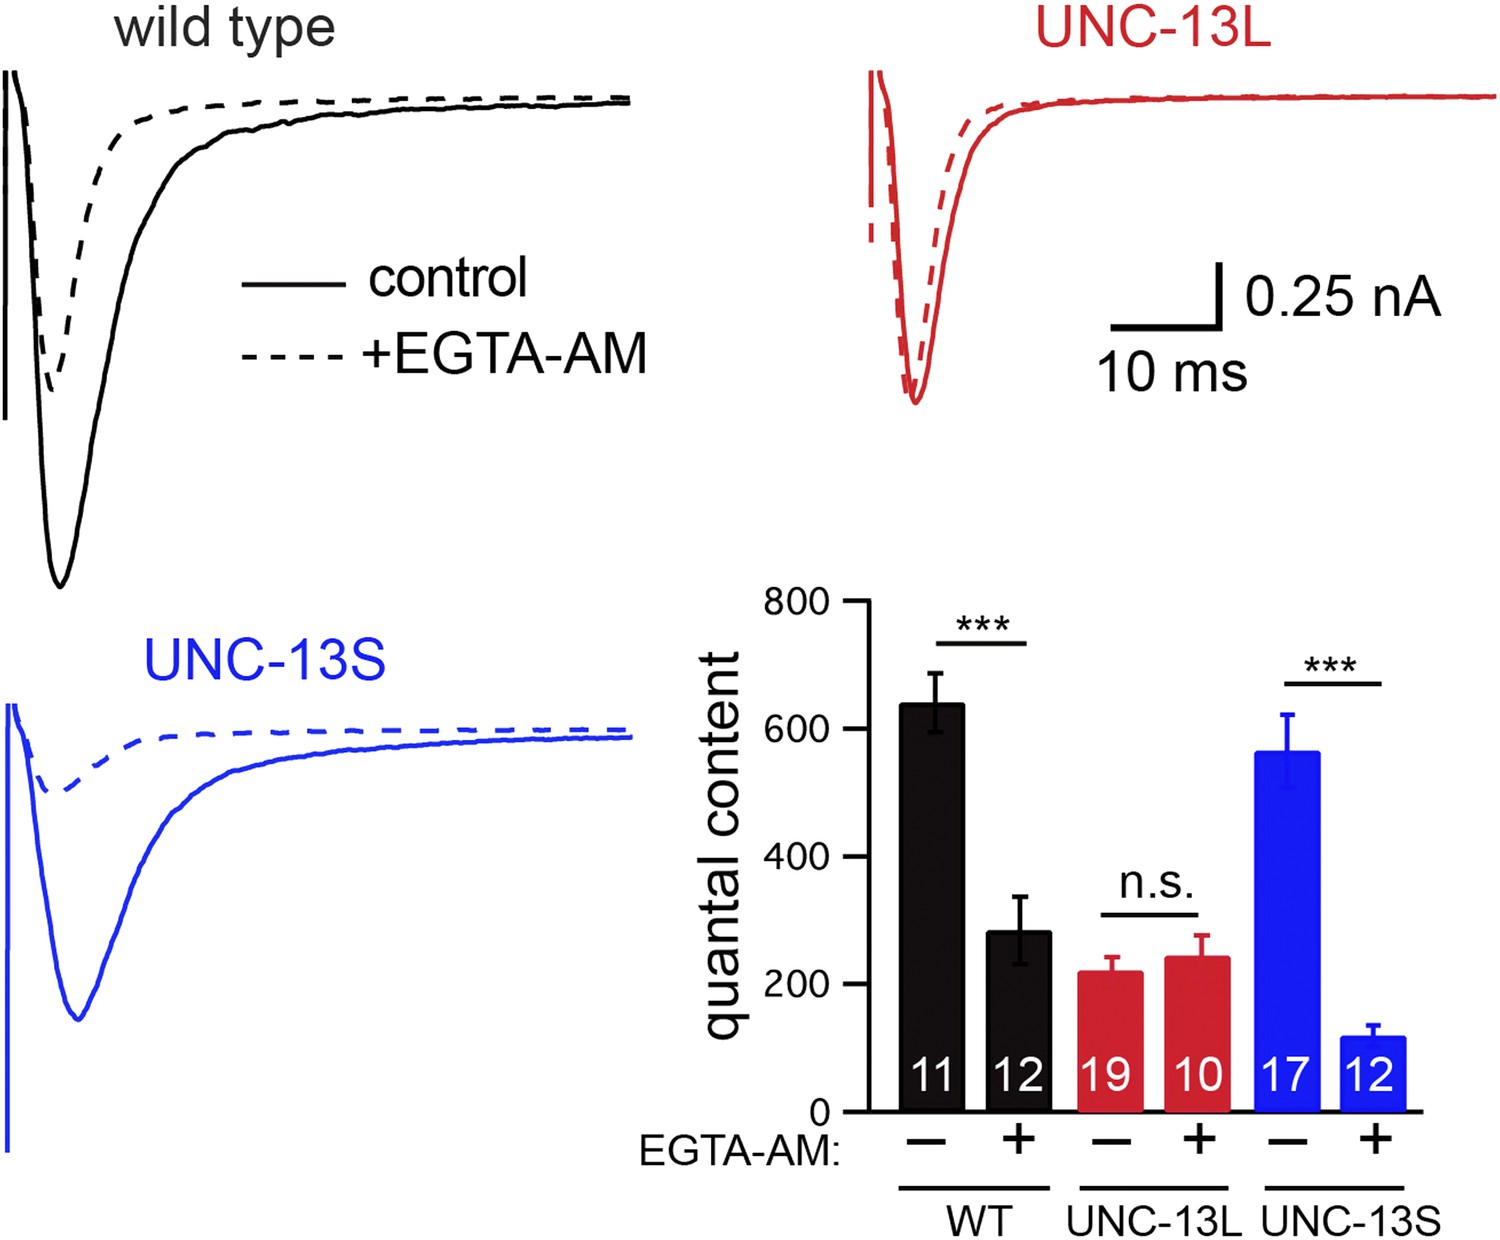
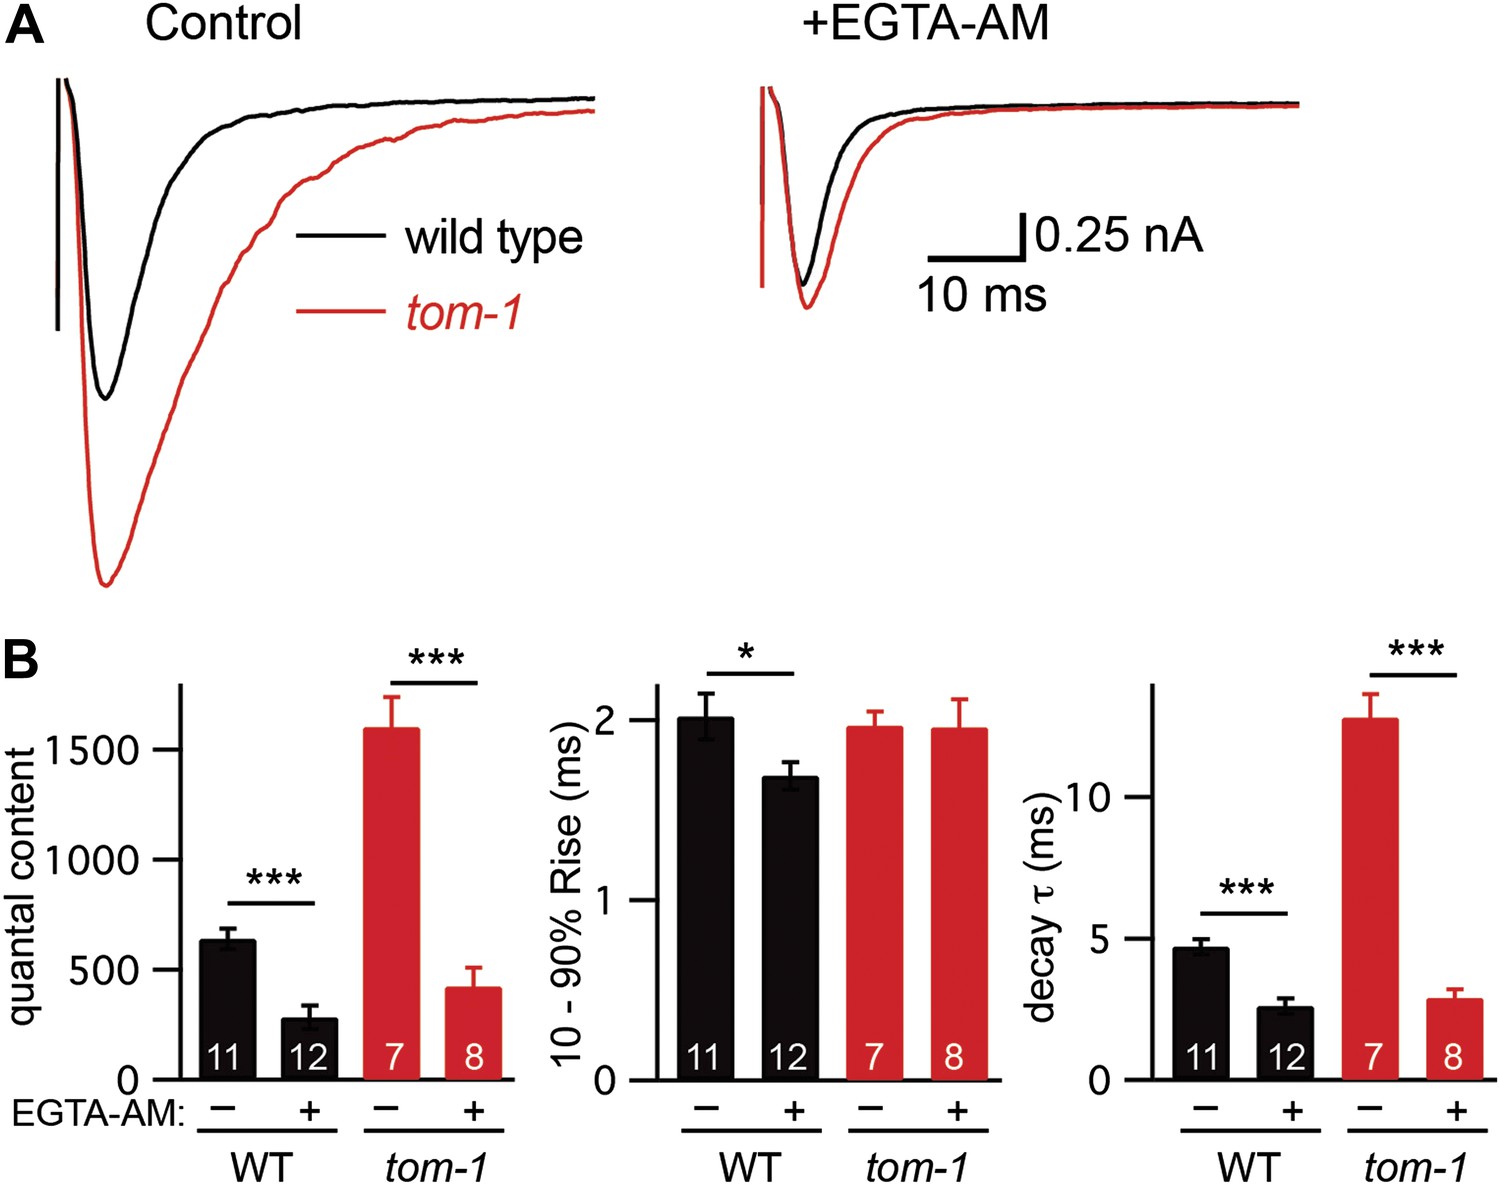
EGTA inhibits UNC-13S-mediated secretion but not that of UNC-13L.
The effect of EGTA-AM on evoked responses was analyzed for the indicated genotypes. Averaged traces and quantal content are shown in control saline and after EGTA-AM treatment. Values that differ significantly are indicated (***p<0.001; n.s., not significant). The number of animals analyzed is indicated for each genotype. Error bars indicate SEM.
Figure 4—figure supplement 1
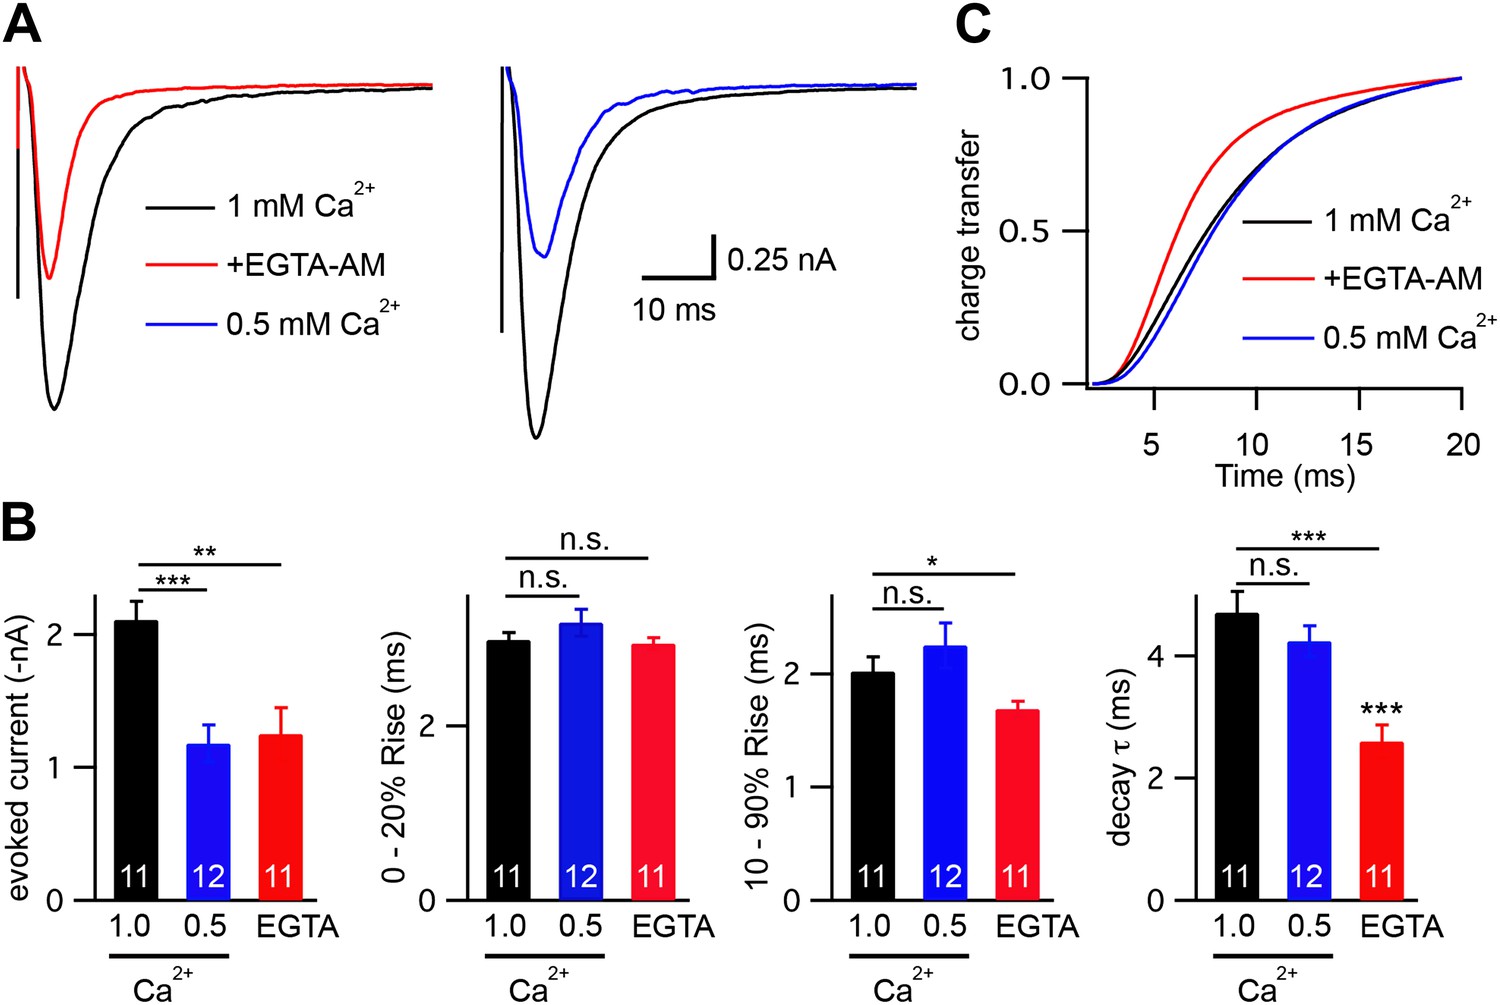
Changes in calcium influx cannot account for the altered evoked EPSC kinetics.
Stimulus-evoked EPSCs were recorded from wild-type body wall muscles in control saline (1.0 mM CaCl2), control saline with 40 μM EGTA-AM, and in saline with reduced extracellular calcium (0.5 mM CaCl2). Averaged traces (A), and summary data (B and C) are shown. (B) Amplitude, latency, activation, and decay kinetics are shown for the evoked responses in all three recording conditions. (C) Cumulative transfer of charge during evoked responses is plotted for the three recording conditions. Values that differ significantly are indicated (***p<0.001; **p<0.01; *p<0.05; n.s., not significant). The number of animals analyzed is indicated for each genotype. Error bars indicate SEM.
Figure 5 with 1 supplement
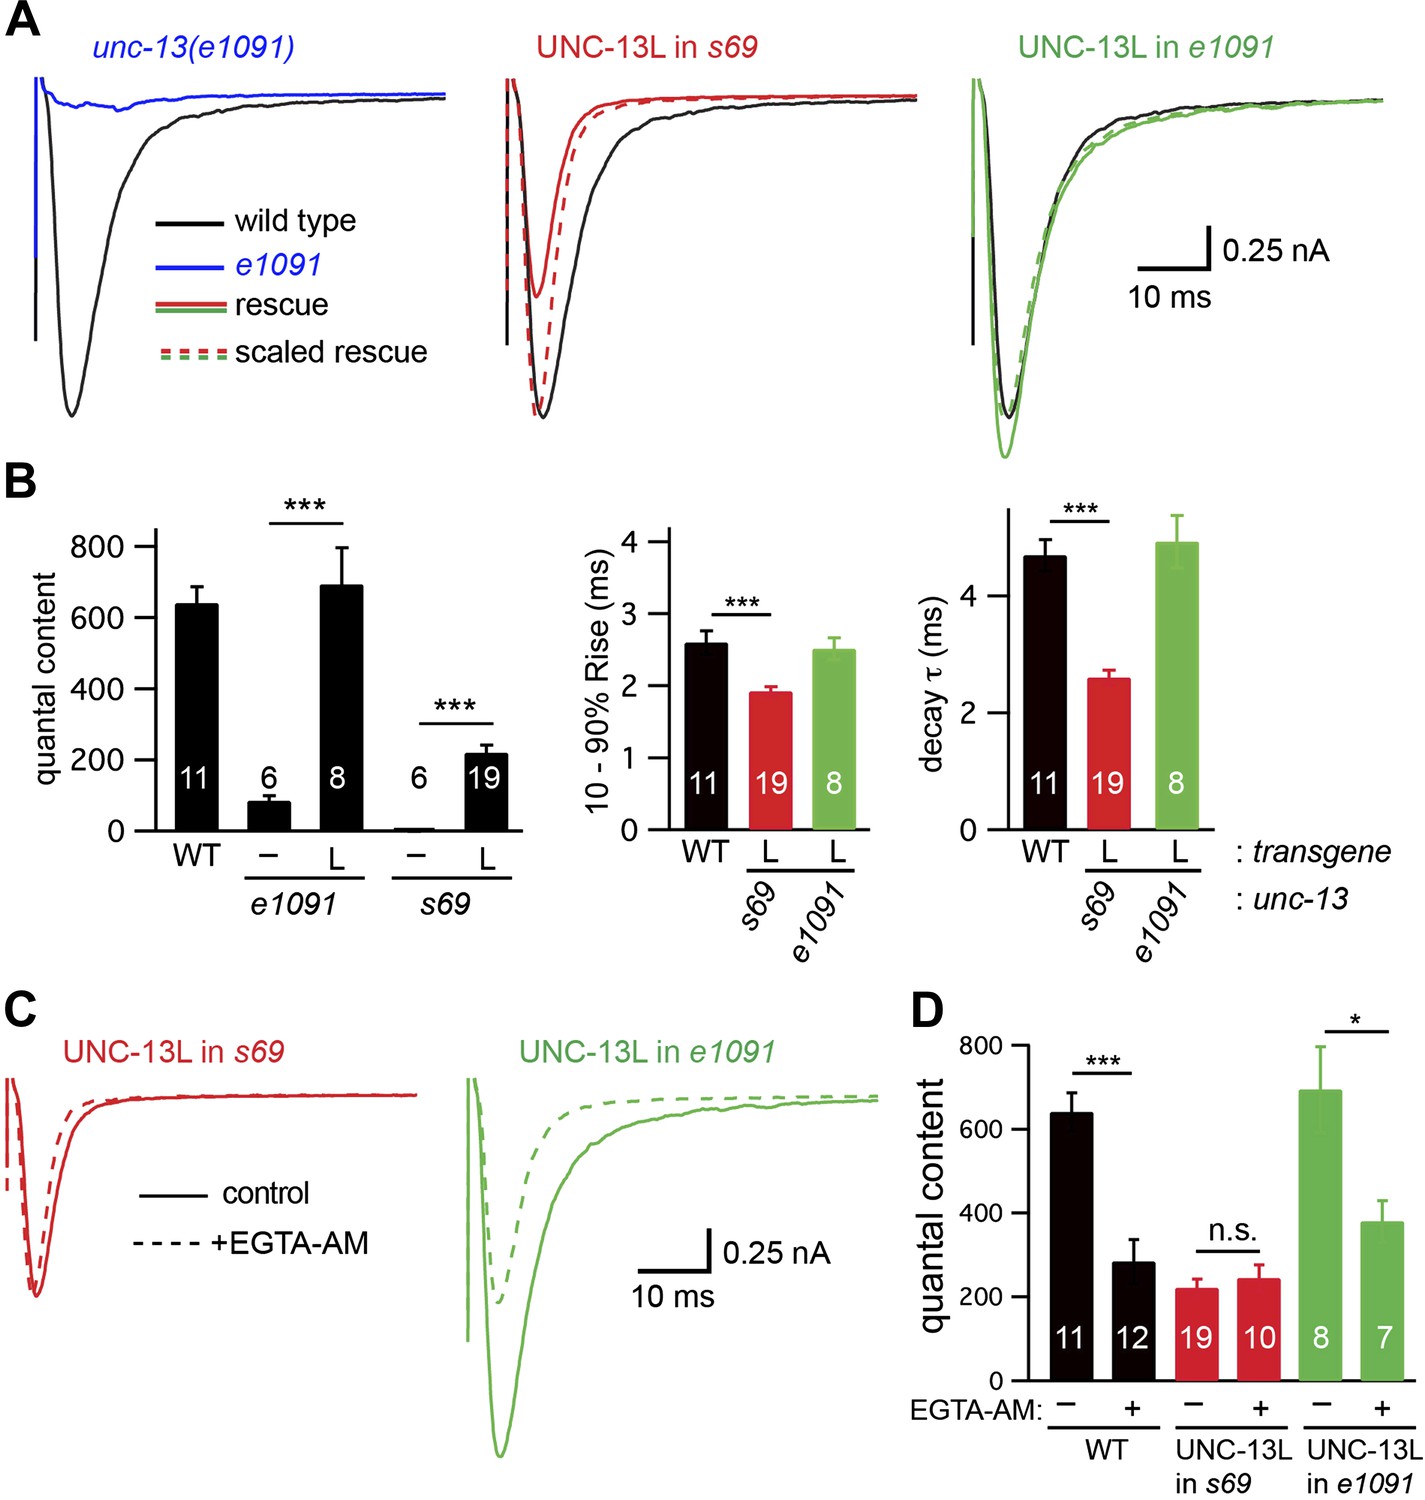
UNC-13L is required for the priming activity of endogenous UNC-13S.
Stimulus-evoked EPSCs (A and B) were recorded from adult body wall muscles of the indicated genotypes. Averaged responses (A), and summary data (B) for quantal content, activation and decay kinetics are shown. (C and D) Expression of UNC-13L in unc-13(e1091) [L−S+] mutants restores both EGTA sensitive and resistant forms of release. By contrast, UNC-13L expression in unc-13(s69) reconstitutes only the EGTA-resistant component of release. Evoked EPSCs were recorded in control saline and after EGTA-AM treatment. Averaged responses (C) and quantal content (D) are shown. Values that differ significantly are indicated (***p<0.001; *p<0.05; n.s., not significant). The number of animals analyzed is indicated for each genotype. Error bars indicate SEM.
Figure 5—figure supplement 1
UNC-13L is required for the priming activity of endogenously expressed UNC-13S.
Endogenous EPSCs (A and B) and sucrose-evoked EPSCs (C and D) were recorded from the indicated genotypes. Representative traces (A and C) and summary data (B and D) are shown. For sucrose responses, the bar above each trace indicates the 1 s application of sucrose. The total synaptic charge transfer was measured for 1 s after initiation of the sucrose stimulus for each genotype. Values that differ significantly (***p<0.001, *p<0.05). The number of animals analyzed is indicated for each genotype. Error bars indicate SEM.
Figure 6
Tomosyn inhibits slow release.
Stimulus-evoked EPSCs were recorded from body wall muscles in control saline and after the addition of EGTA-AM. Averaged traces (A) and summary data (B) for quantal content, activation, and decay kinetics are shown. Values that differ significantly are indicated (***p<0.001; n.s., not significant). The number of animals analyzed is indicated for each genotype. Error bars indicate SEM.
Figure 7 with 2 supplements
Tomosyn inhibits UNC-13S-mediated secretion.
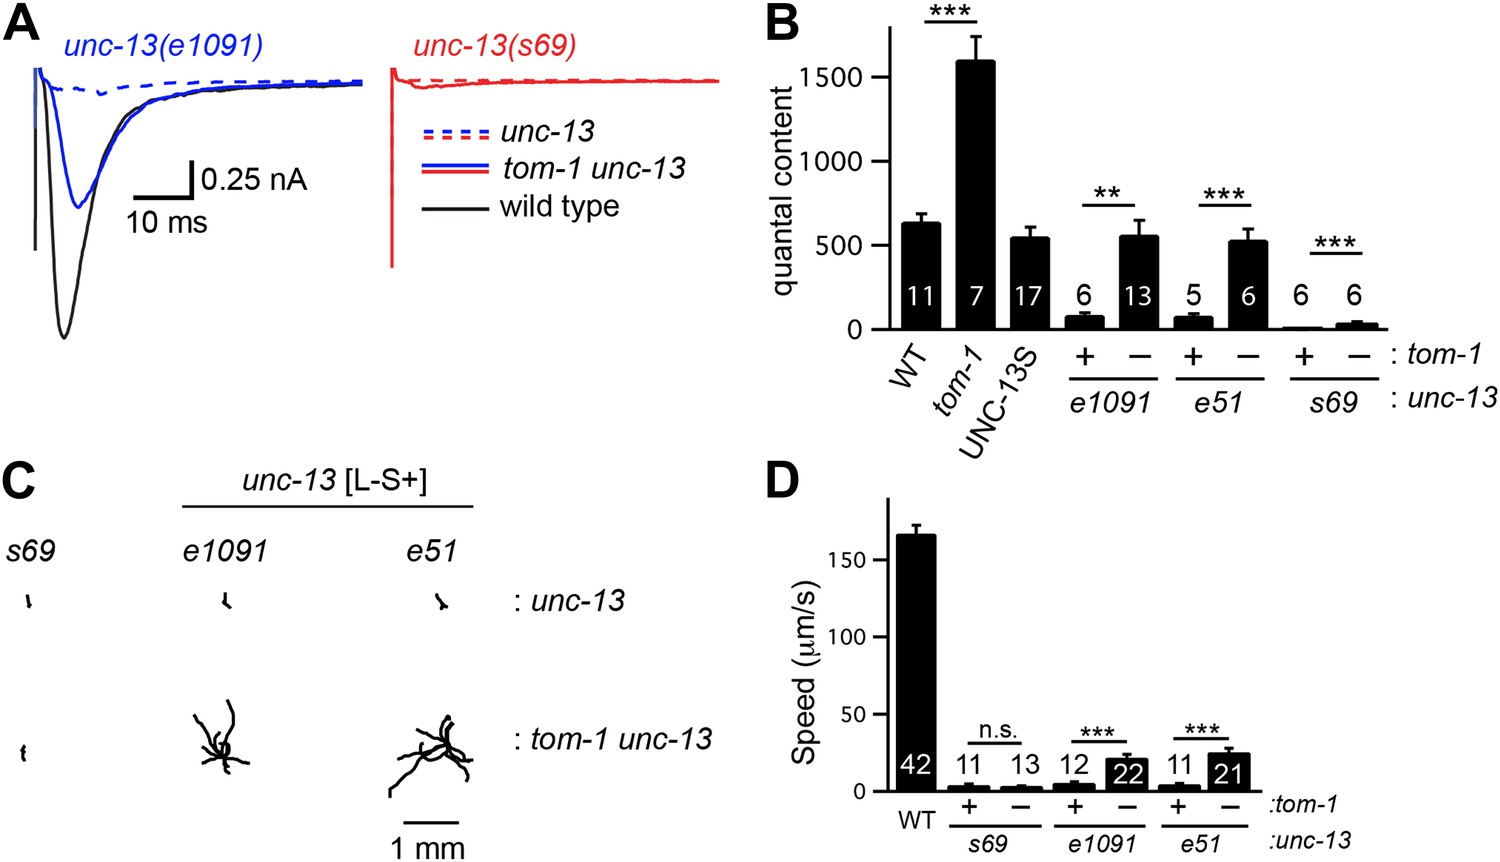
Inactivating TOM-1 Tomosyn in unc-13 [L−S+] (e1091) mutants restored ACh release (A and B) and locomotion behavior (C and D). (A and B) Stimulus-evoked EPSCs were analyzed for the indicated genotypes. Averaged traces (A) and quantal content (B) are shown. (C and D) Locomotion behavior was analyzed in the indicated strains. Representative 20 s locomotion trajectories are shown (n = 10 animals for each genotype) (C). The starting points for each trajectory were aligned for clarity. (D) Locomotion rates are compared for the indicated genotypes. Values that differ significantly are indicated (***p<0.001; **p<0.01; n.s., not significant). The number of animals analyzed is indicated for each genotype. Error bars indicate SEM.
Figure 7—figure supplement 1
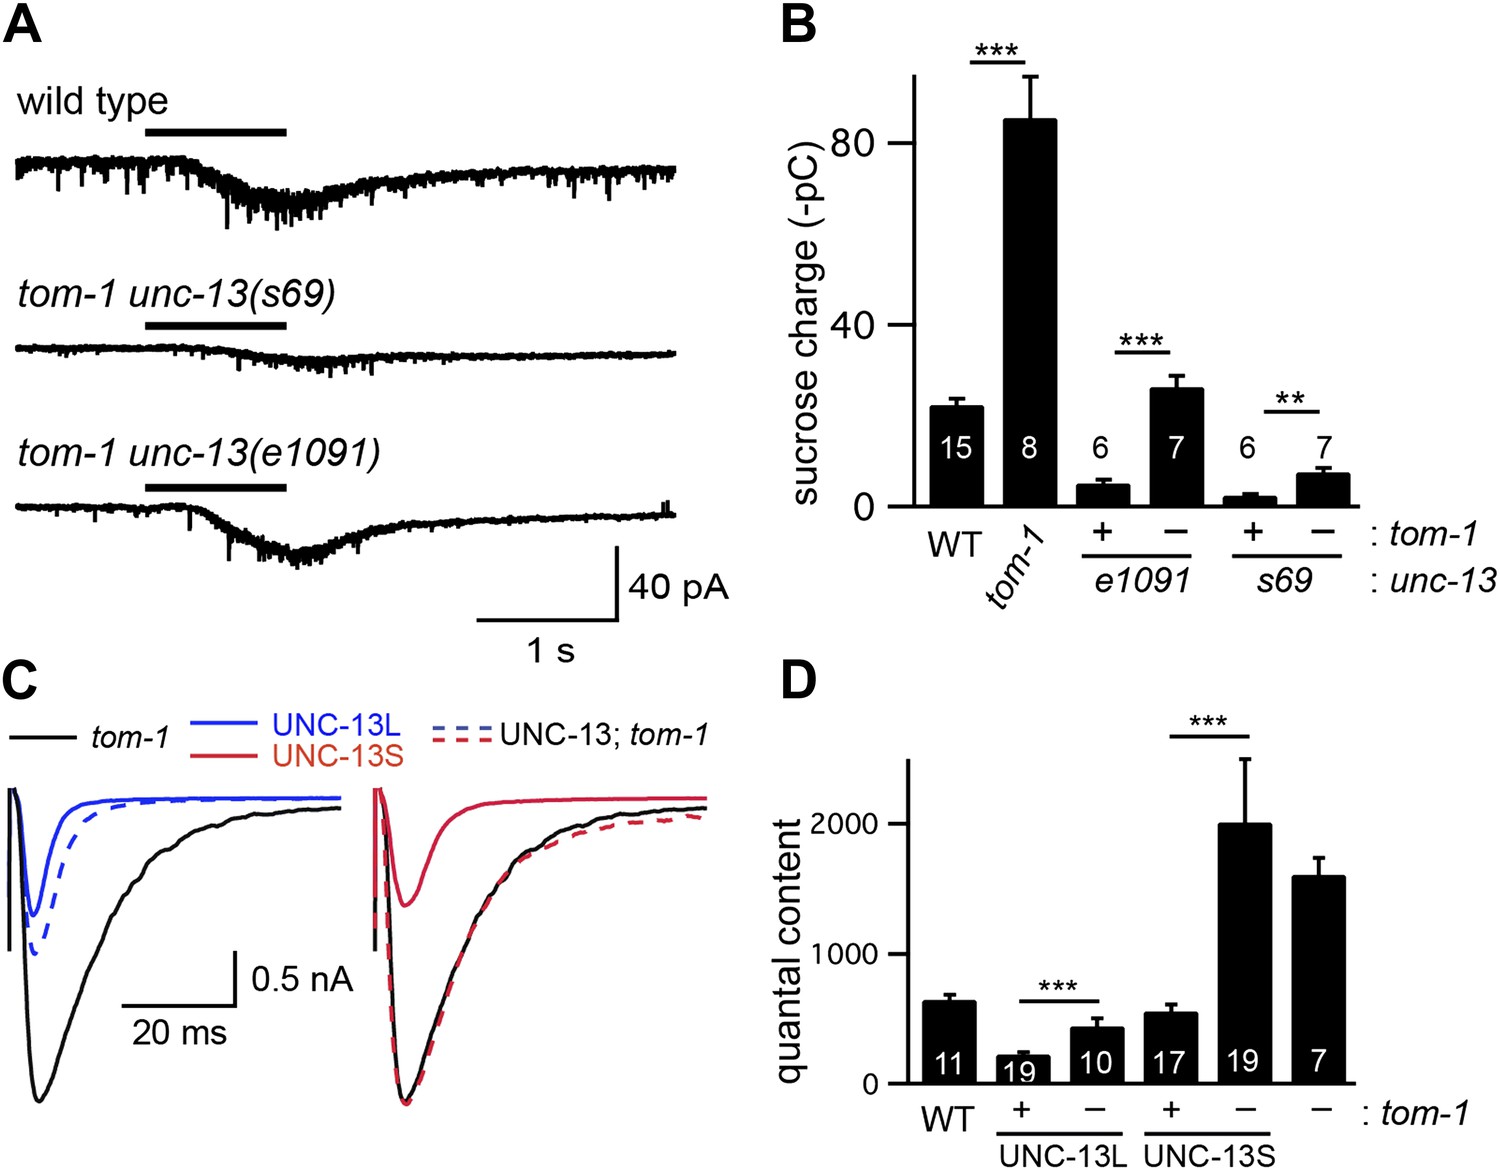
TOM-1 inhibits the priming activity of UNC-13S.
Sucrose-evoked EPSCs (A and B) and stimulus-evoked EPSCs (C and D) were recorded from the indicated genotypes. Representative traces of sucrose responses (A), averaged traces of evoked responses (C), and summary data (B and D) are shown. Values that differ significantly are indicated (***p<0.001; **p<0.01). The number of animals analyzed is indicated for each genotype. Error bars indicate SEM.
Figure 7—figure supplement 2
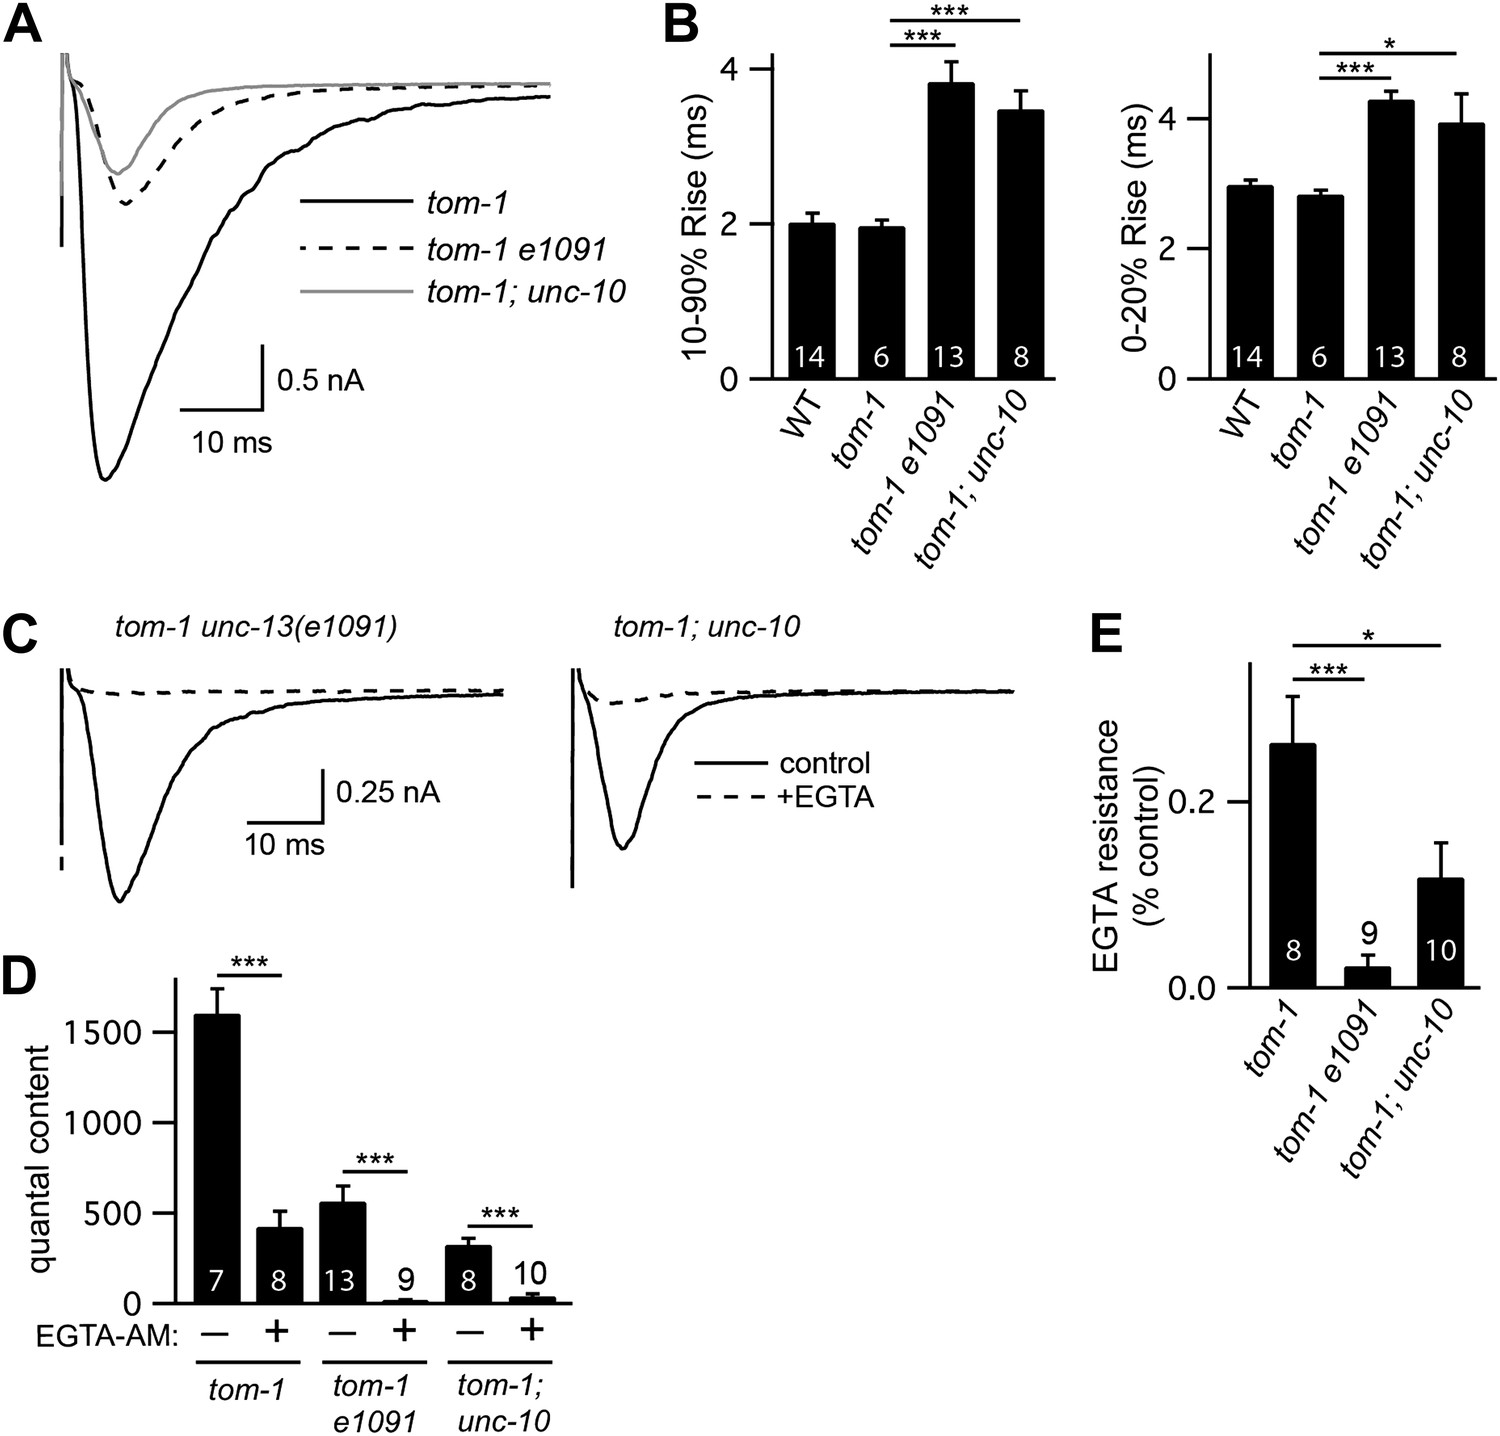
The latency of evoked responses is prolonged and calcium coupling is loosened in unc-13(e1091) [L−S+] and in unc-10 RIM mutants.
Stimulus-evoked EPSCs were recorded from body wall muscles in control saline and after the addition of EGTA-AM. Averaged traces (A and C) and summary data for activation kinetics and latency of release (B), quantal content (D), and EGTA resistance (E). Values that differ significantly are indicated (***p<0.001; *p<0.05). The number of animals analyzed is indicated for each genotype. Error bars indicate SEM.
Figure 8 with 1 supplement
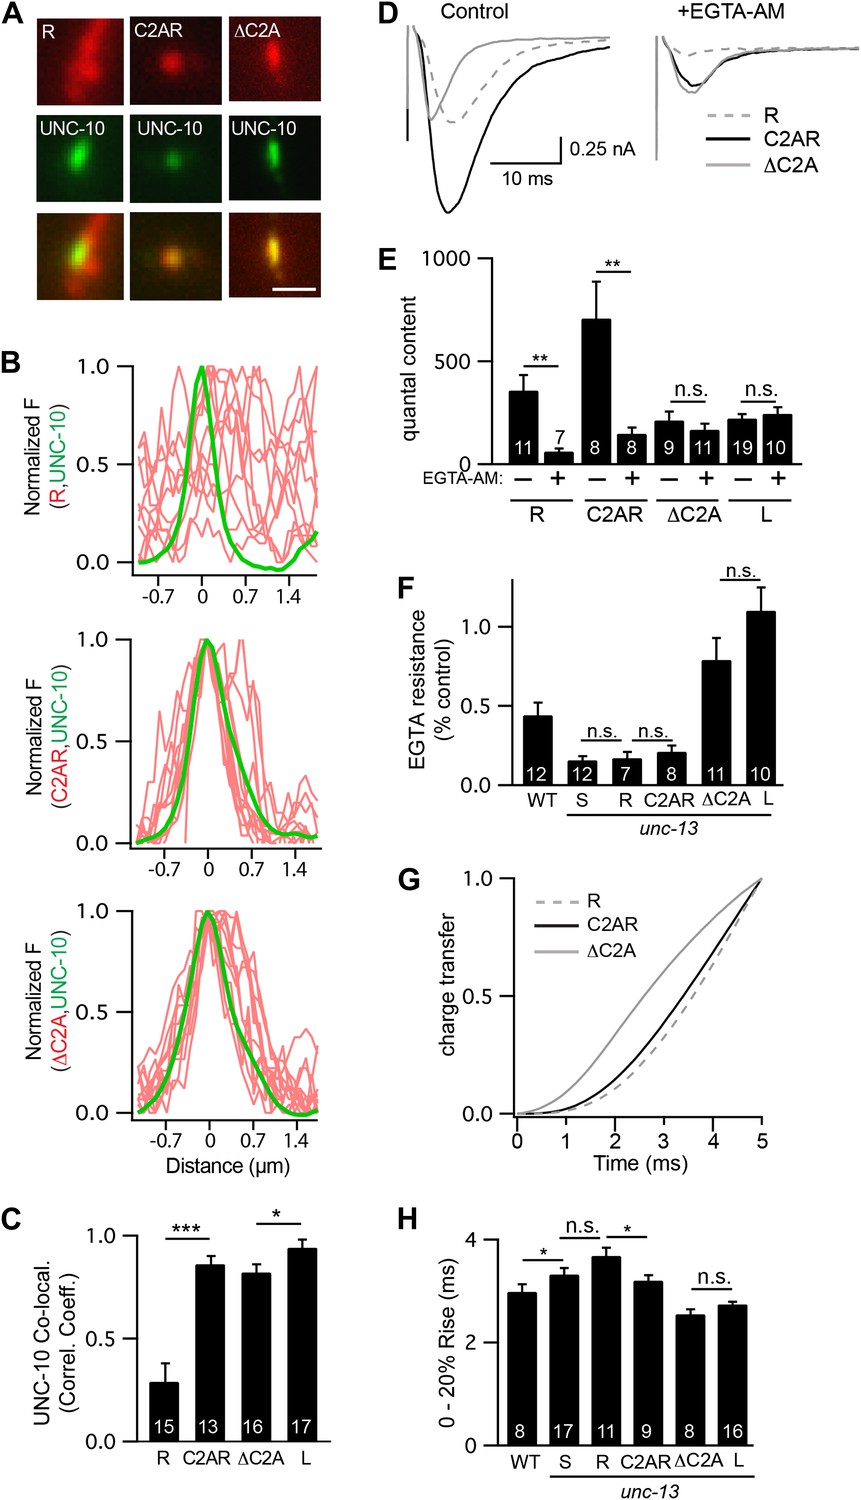
The C2A domain anchors UNC-13 at active zones and shortens the latency of release.
Fusing the C2A domain to the R region (C2AR) increased recruitment of UNC-13 to active zones, shortened the latency of release, but did not tighten the coupling of release to calcium entry. Deleting the C2A domain in full length UNC-13L (ΔC2A) modestly decreased targeting to active zones, did not lengthen the latency of release, and did not loosen the coupling of exocytosis and calcium entry. (A and C) The distribution of mCherry-tagged UNC-13R, C2AR, and ΔC2A at active zones (labeled with GFP-tagged UNC-10/RIM) are shown. All tagged proteins were expressed in DA and DB motor neurons of wild type animals (using the unc-129 promoter). Representative images (A), line scans (B), and correlation coefficients (C) for UNC-10/RIM and UNC-13 fluorescence at synaptic puncta are shown. Scale bar indicates 1 μm. (D–H) Stimulus-evoked EPSCs were recorded from body wall muscles in control saline and after the addition of EGTA-AM. Averaged traces (D) and summary data for quantal content (E), EGTA resistance (F), time course of initial evoked charge transfer (0–5 ms, G), and the latency of release (0–20% rise time, H) are shown. Values that differ significantly are indicated (***p<0.001; **p<0.01; *p<0.05; n.s., not significant). The number of animals analyzed is indicated for each genotype. Error bars indicate SEM.
Figure 8—figure supplement 1
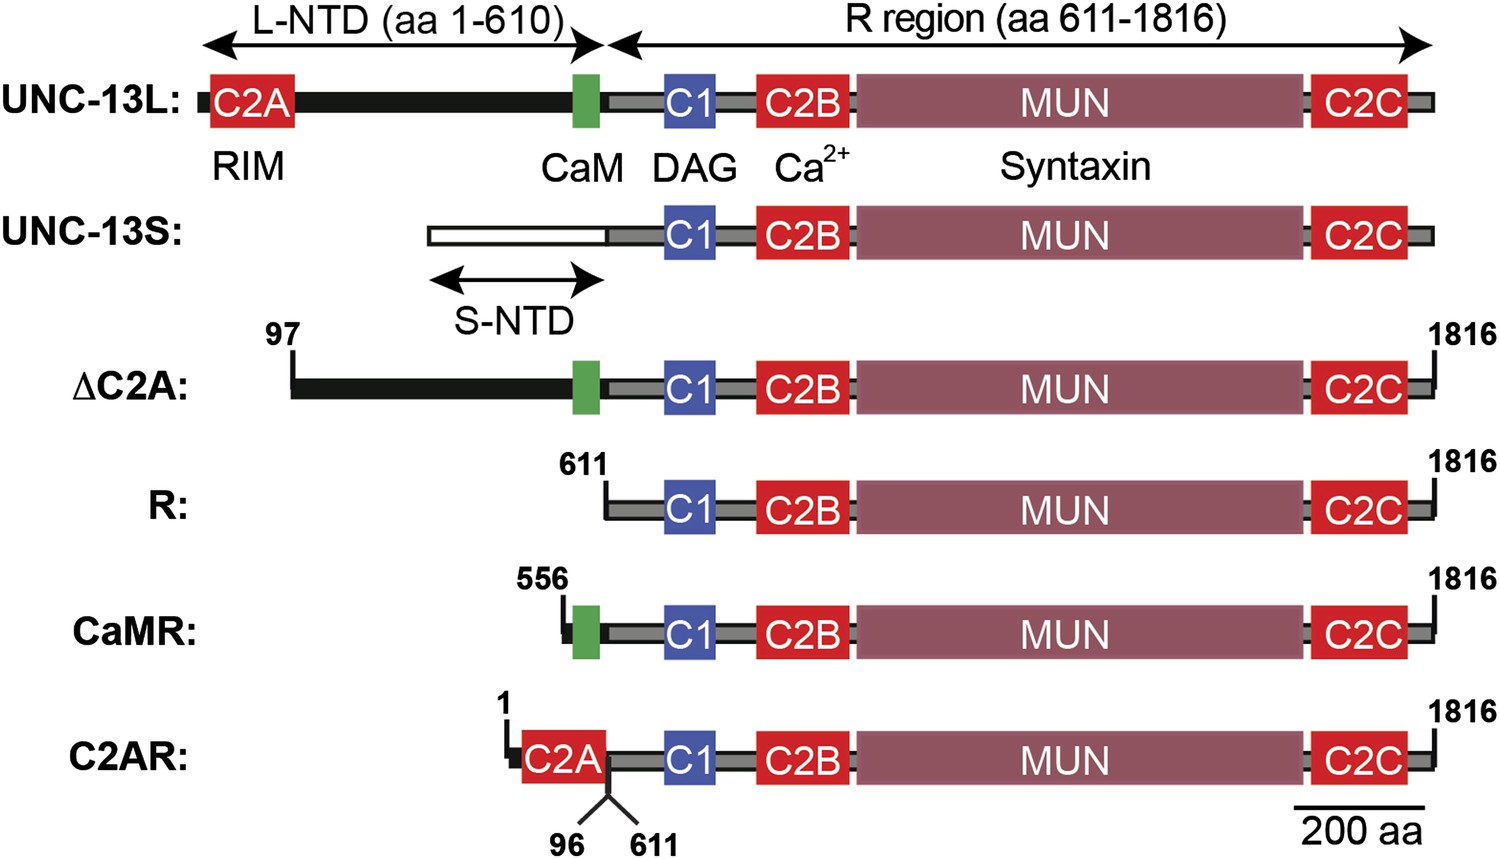
Chimeric UNC-13 proteins utilized in Figures 8 and 9.
The domain structure of UNC-13L, UNC-13S, ΔC2A, R, CaMR, and C2AR are illustrated. Ligands for each domain are indicated. Amino acid coordinates indicated refer to the UNC-13L cDNA sequence (ZK524.2e). Each isoform has a unique NTD. The L-NTD (610 aa) is encoded by exons 1–13 and contains a C2A domain (aa 1–96) and a predicted calmodulin binding site (green box, aa 556–610). The S-NTD (259 aa) is encoded by exon 14. The ΔC2A construct contains an N-terminal truncation of UNC-13L, lacking amino acids 1–96. The R construct contains the R domain (aa 611–1816, comprising C2A, C1, C2B, MUN, C2C domains). The CaMR construct contains a predicted CaM binding site in the L-NTD (aa 556–610) fused to the R domain (aa 611–1816). The C2AR construct contains the C2A domain (aa 1–96) fused to the R domain (aa 611–1816).
Figure 9
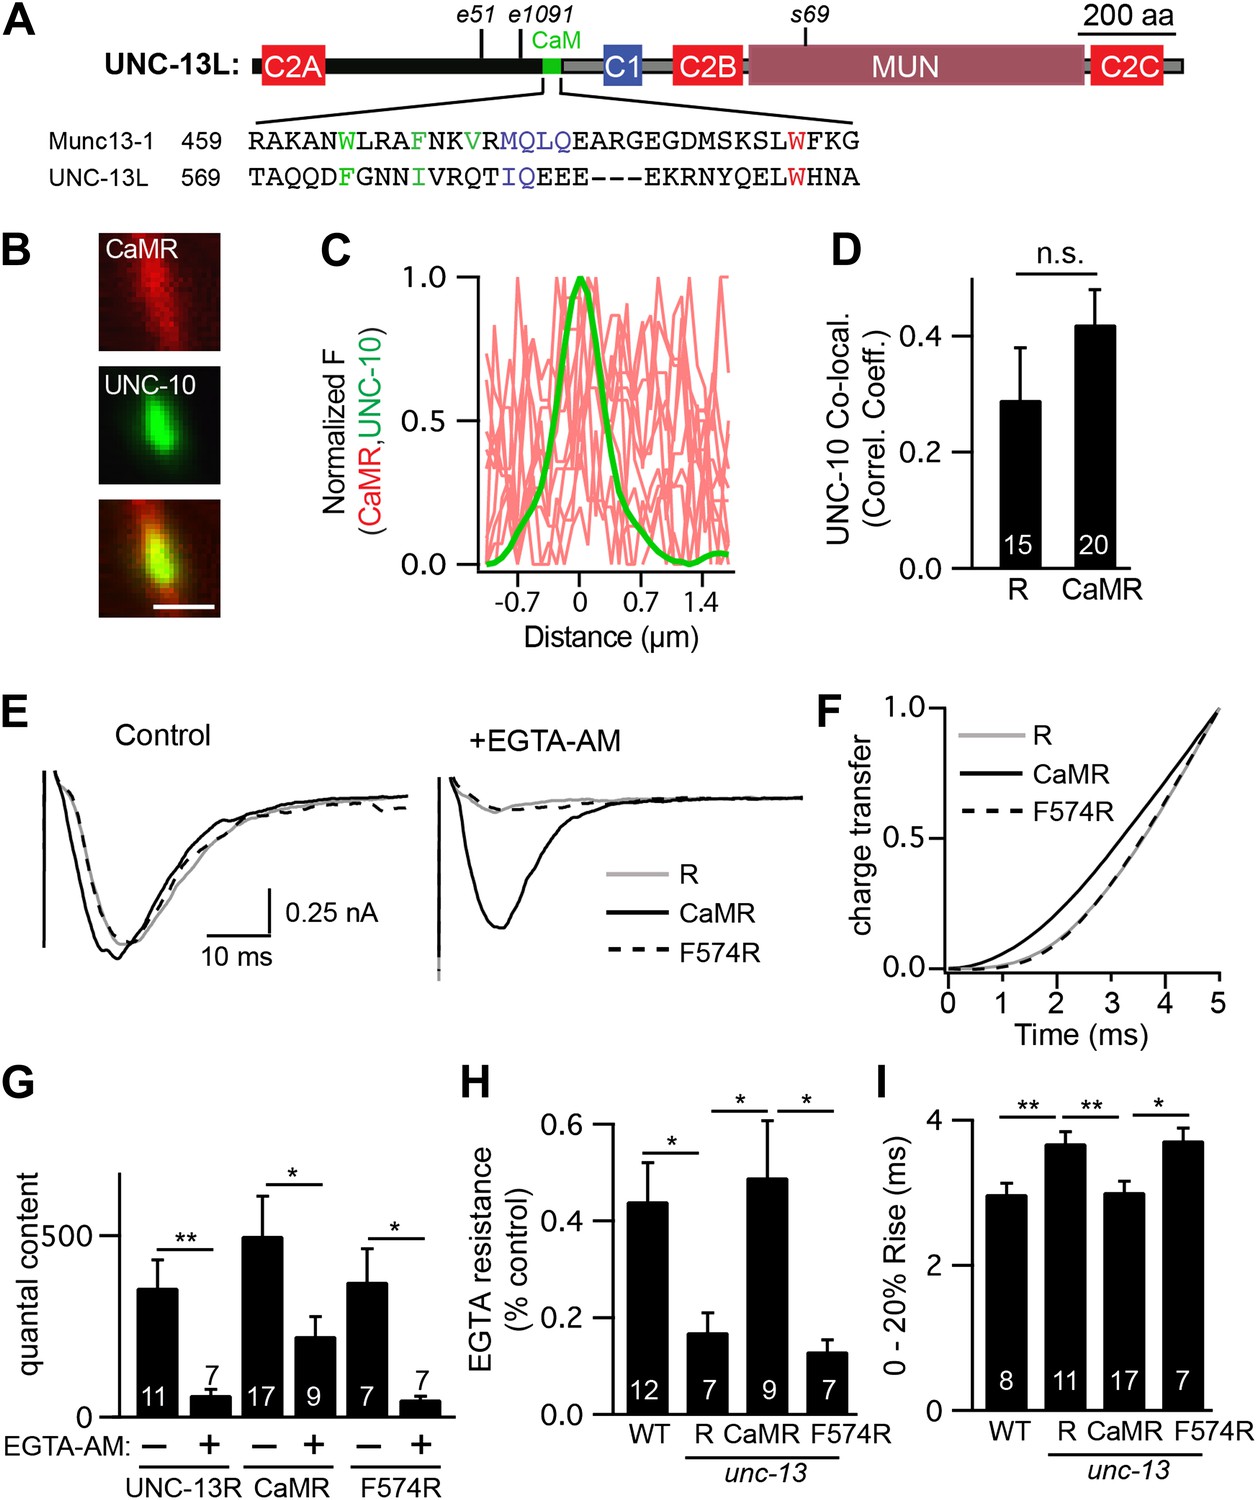
A predicted calmodulin-binding site in UNC-13L accelerates release.
The predicted calmodulin (CaM)-binding site of UNC-13L (residues 556–610) was fused to the R domain. CaMR had a diffuse axonal distribution, was poorly colocalized with UNC-10/RIM, but exhibited faster and more EGTA-resistant evoked ACh release. The effects of the CaM-binding site on release were eliminated by the F574R mutation, which is predicted to disrupt calmodulin binding (Junge et al., 2004). (A) Position of the putative CaM-binding site in UNC-13L and its alignment with the rat Munc13-1 CaM-binding site sequence are shown. Hydrophobic residues anchoring the C-terminal (green) and N-terminal (red) lobes of CaM, and predicted apo-calmodulin binding sites (blue) are indicated (Rodriguez-Castaneda et al., 2010; Lipstein et al., 2012). (B–D) The distribution of mCherry-tagged CaMR at active zones (labeled with GFP-tagged UNC-10/RIM) are shown. Tagged proteins were expressed in DA and DB motor neurons of wild-type animals (using the unc-129 promoter). Representative images (B), line scans (C), and correlation coefficients (D) for UNC-10/RIM and CaMR fluorescence at synaptic puncta are shown. Scale bar indicates 1 μm. (E and H) Stimulus-evoked EPSCs were recorded from body wall muscles in control saline and after the addition of EGTA-AM. Averaged traces (E) and summary data for time course of initial evoked charge transfer (0–5 ms, F), quantal content (G), EGTA resistance (H), and the latency of release (0–20% rise time, I) are shown. Values that differ significantly are indicated (**p<0.01; *p<0.05; n.s., not significant). The number of animals analyzed is indicated for each genotype. Error bars indicate SEM.
Download links
A two-part list of links to download the article, or parts of the article, in various formats.
Downloads (link to download the article as PDF)
Open citations (links to open the citations from this article in various online reference manager services)
Cite this article (links to download the citations from this article in formats compatible with various reference manager tools)
UNC-13L, UNC-13S, and Tomosyn form a protein code for fast and slow neurotransmitter release in Caenorhabditis elegans
eLife 2:e00967.
https://doi.org/10.7554/eLife.00967


