A deletion polymorphism in the Caenorhabditis elegans RIG-I homolog disables viral RNA dicing and antiviral immunity
- Wellcome Trust/Cancer Research UK Gurdon Institute, University of Cambridge, United Kingdom
- University of Cambridge, United Kingdom
- Centre National de la Recherche Scientifique, UMR 8197, France
- Institut National de la Santé et de la Recherche Médicale U 1024, France
Figures
Figure 1 with 2 supplements
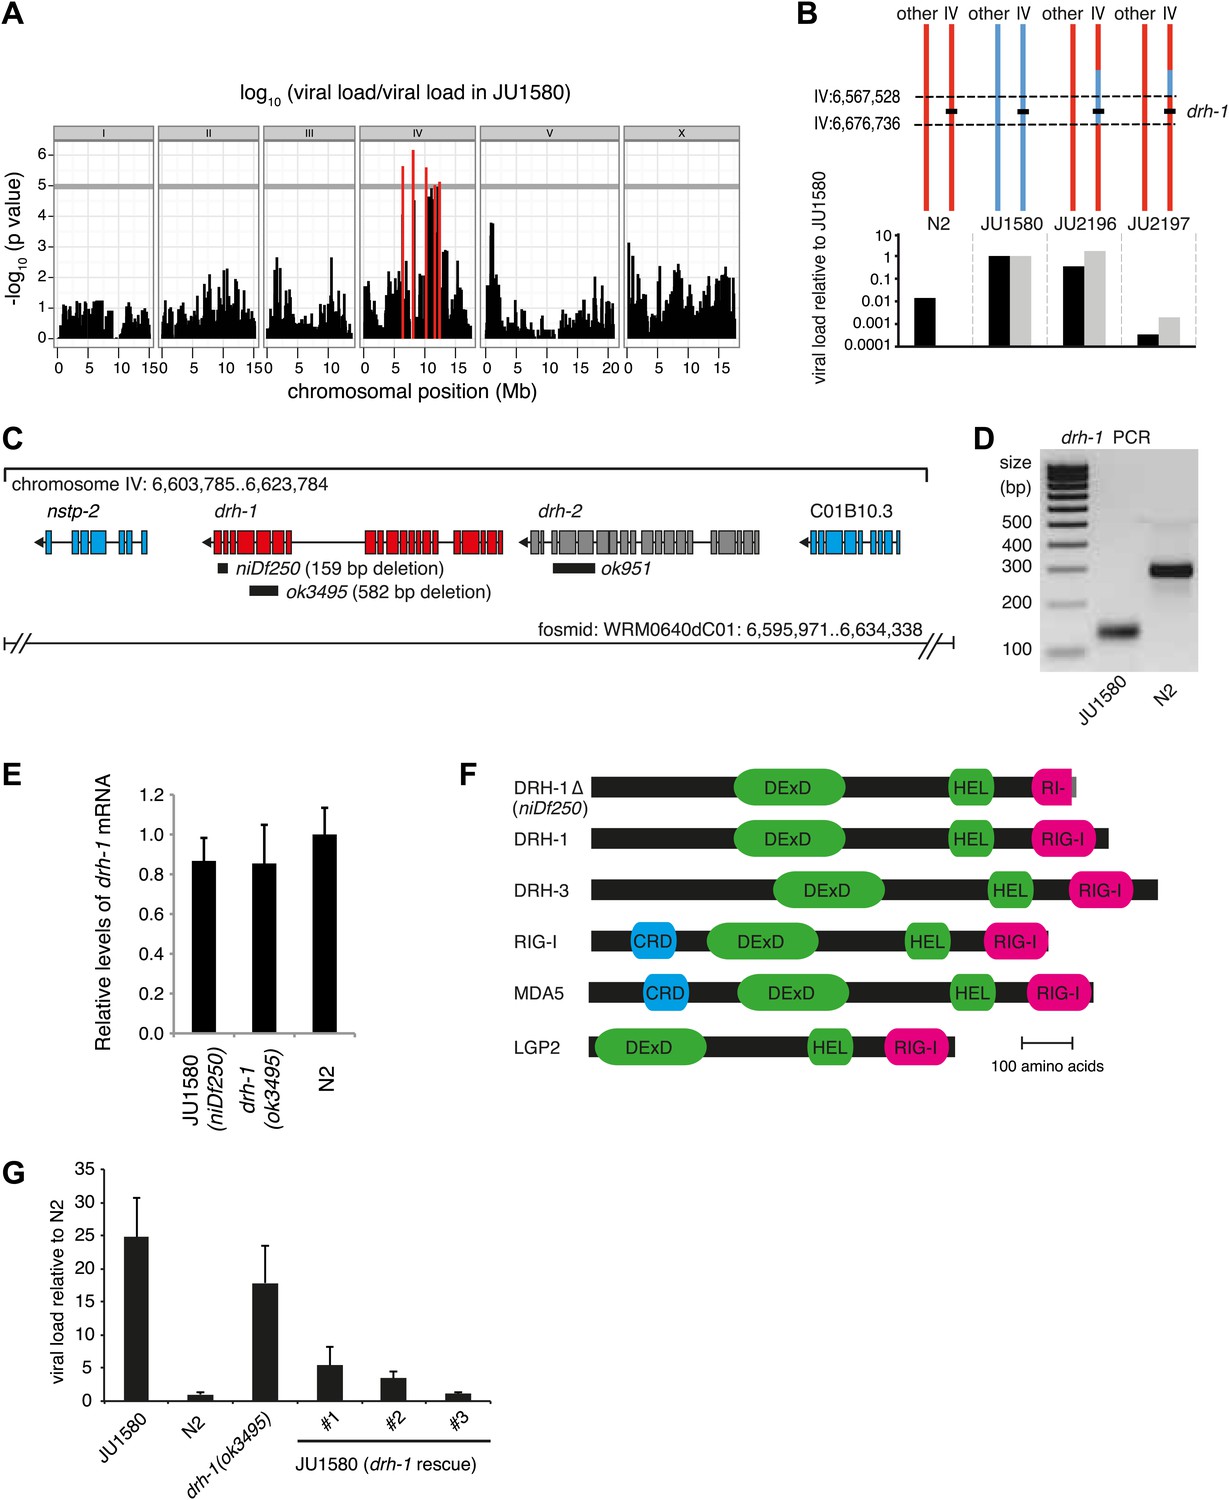
A deletion polymorphism in drh-1 is a major determinant of Orsay virus sensitivity in wild isolates of C. elegans.
(A) Genome-wide association analysis of Orsay virus sensitivity in 97 wild isolates of C. elegans. The mapped trait is the viral load of animals, measured by qRT-PCR on the Orsay virus RNA2 genome after 7 days of infection, using three independent infection experiments. The horizontal grey line is a Bonferroni-corrected threshold of significance at p=0.05. Peaks reaching above this threshold are colored in red. (B) Fine mapping of the candidate region causative for virus hypersensitivity observed in JU1580 animals. The genotypes of chromosome IV and other chromosomes are represented for parental (N2 and JU1580) and informative recombinant (JU2196 and JU2197) strains. Regions in red or blue are identical to N2 or JU1580, respectively. The inferred candidate region is delimited by dotted lines. Below each genotype are viral load measured by qRT-PCR of Orsay virus RNA2, in two independent infections (black and grey bars) and normalized to JU1580. (C) Diagram of the drh-1 locus. Positions of deletion alleles and a rescuing fosmid are indicated. (D) PCR analysis of niDf250 deletion in N2 and JU1580 strains. (E) drh-1 mRNA level in different strains (as indicated), measured by RT-qPCR. (F) Diagram of C. elegans and human RIG-I like genes. DeXD = Pfam:DEAD, Hel = Pfam:Helicase_C, RIG-I = Pfam:RIG-I_C-RD, CRD = Pfam:CARD. (G) Viral load in different strains (as indicated), measured by RT-qPCR of the Orsay virus RNA1 genome after 4 days of infection. JU1580 (drh-1 rescue) refers to JU1580 strains carrying three independent transgenic lines (SX2375, SX2376, SX2377). Transgenes include the fosmid WRM0640dC01 and a co-injection marker, they were integrated into the genome using X-rays. Error bars represent the standard error of the mean (SEM) of five biological replicates.
Figure 1—figure supplement 1
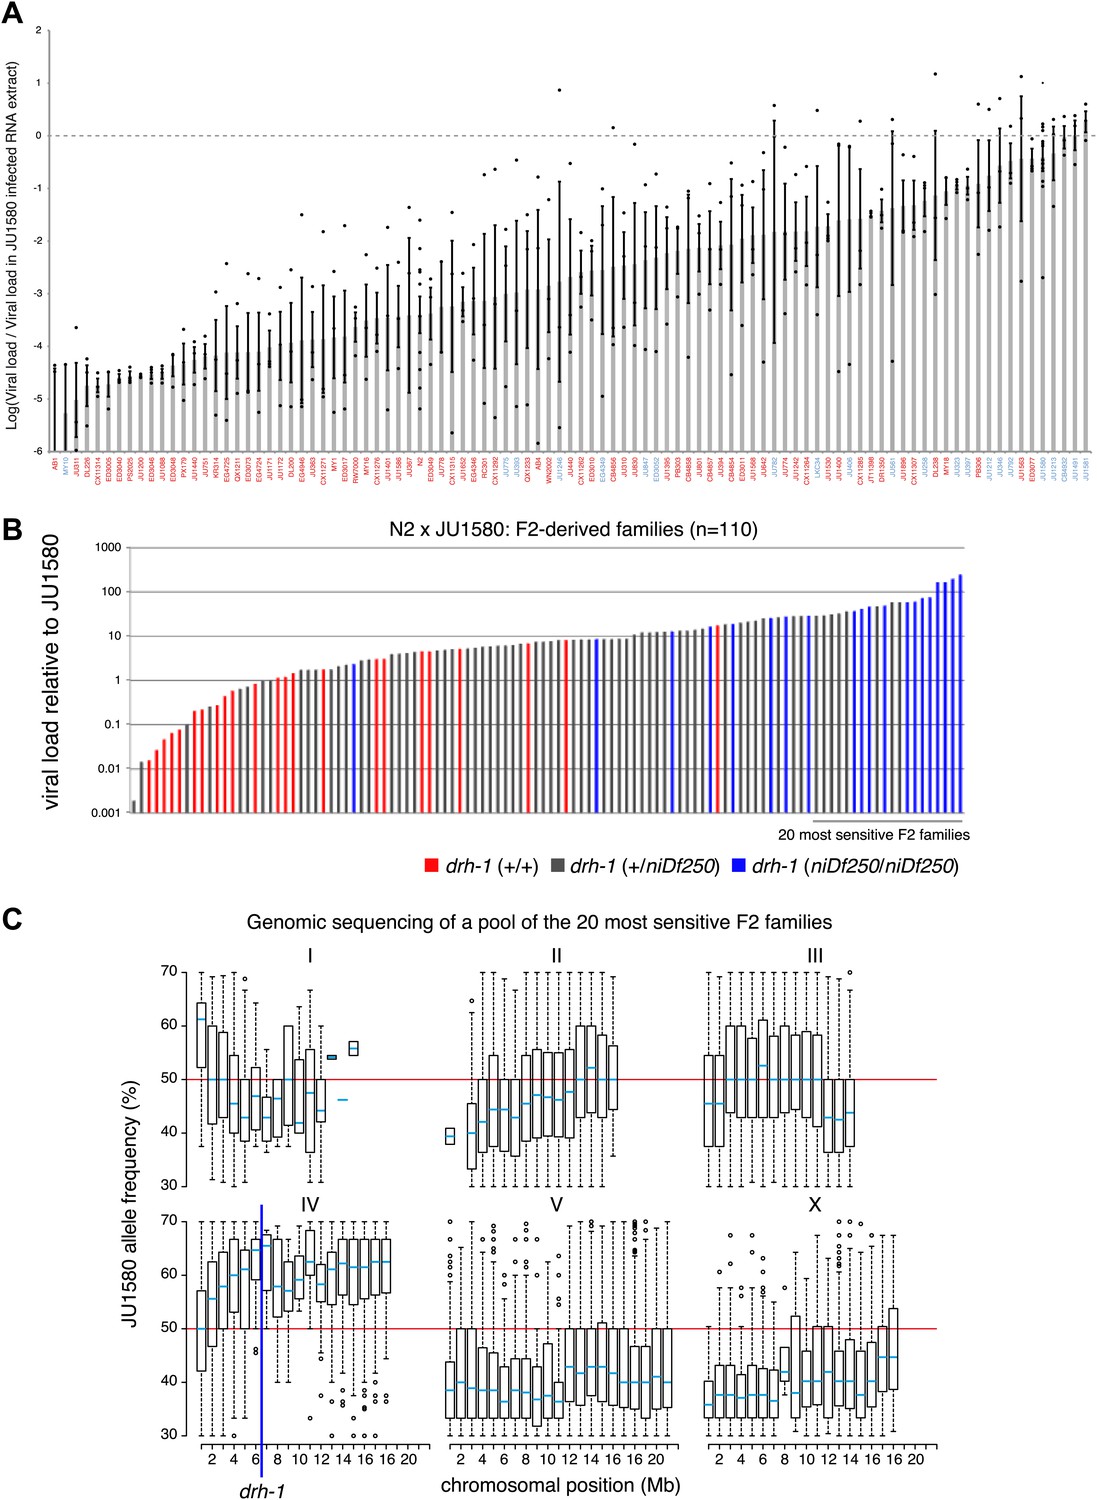
Variation in the ability of the Orsay virus to replicate in C. elegans.
(A) For each of the 97 wild isolates listed on the horizontal axis, the mean of the logarithm and standard error of the RT-qPCR values on the viral RNA1 assayed 7 days post infection at 23°C are reported. For a given strain, the value of each replicate is represented as a dot. Isolates labeled in blue or red carry the niDf250 or the N2 allele of drh-1, respectively. (B) To investigate whether the viral susceptibility of JU1580 was linked to drh-1, we crossed N2 and JU1580 and allowed the F1 progeny to self-fertilize. Each line thus generated will carry a different combination of N2 and JU1580 SNPs allowing the separation of the drh-1 mutation from any unlinked additional differences in genetic background. After two generations of self-fertilization we then infected these lines and assayed both for sensitivity to infection and for the presence of the JU1580 drh-1 deletion. We saw good correlation between increased viral sensitivity and the drh-1 deletion (p=2.9×10⁻⁸, Wilcoxon test). (C) Distribution of JU1580 SNPs in recombinant lines from B. A pool of 20 sensitive recombinant lines was selected from a total of 110 independent F2 lines and subjected to high-throughput sequencing. Only average SNP frequencies between 20% and 70% were chosen to exclude false SNP calls. This showed that viral sensitivity was linked to chromosome IV. Red lines indicate an average SNP frequency of 50%. The blue line indicates position of the niDf250 deletion.
Figure 1—figure supplement 2
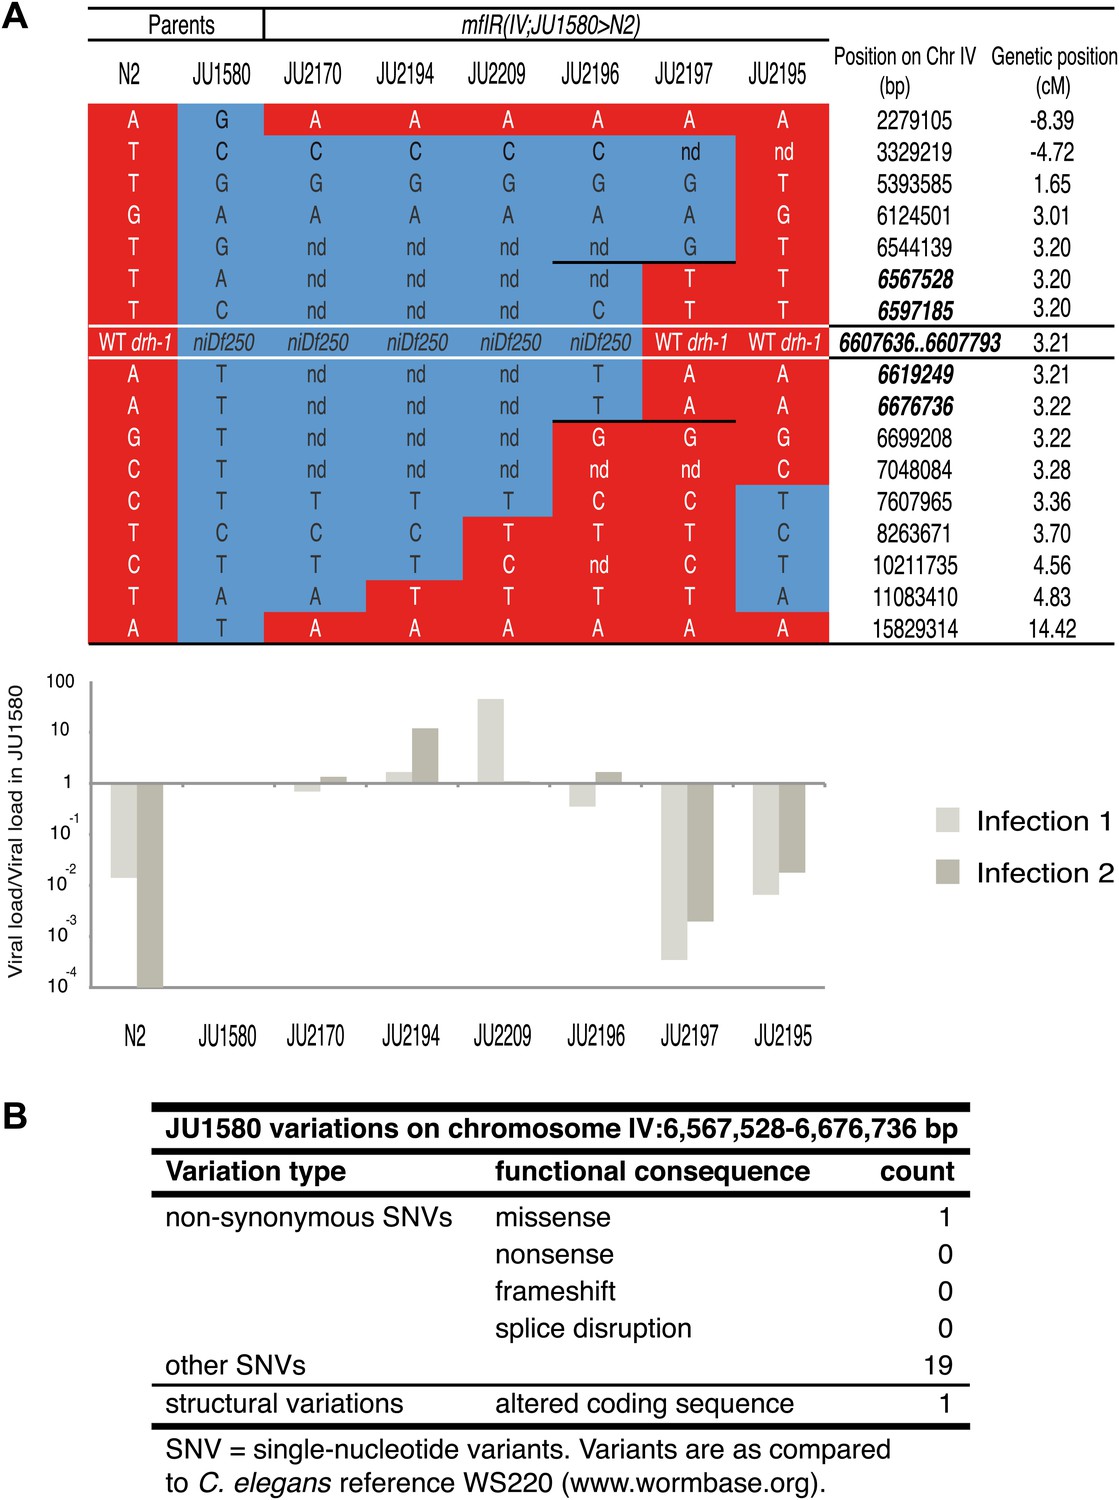
Genotype and sensitivity to the Orsay virus of recombinants in the chromosome IV region.
(A) Genotype at 17 loci (16 SNPs and the drh-1 allele) along chromosome IV of the six introgressed and recombinant lines and their parents (N2 and JU1580). Chromosomal segments from N2 or JU1580 are represented in red or blue, respectively. The chromosomal positions of loci in the new candidate region are in bold italic. The viral load of each strain over that in JU1580 is represented below as in Figure 1B, for two replicate infections. (B) Summary of genetic differences between N2 and JU1580 in a 155 kb region on chromosome IV (6,567,528-6,676,736) based on resequencing of JU1580. Only differences predicted to result in altered function were considered.
Figure 2 with 2 supplements
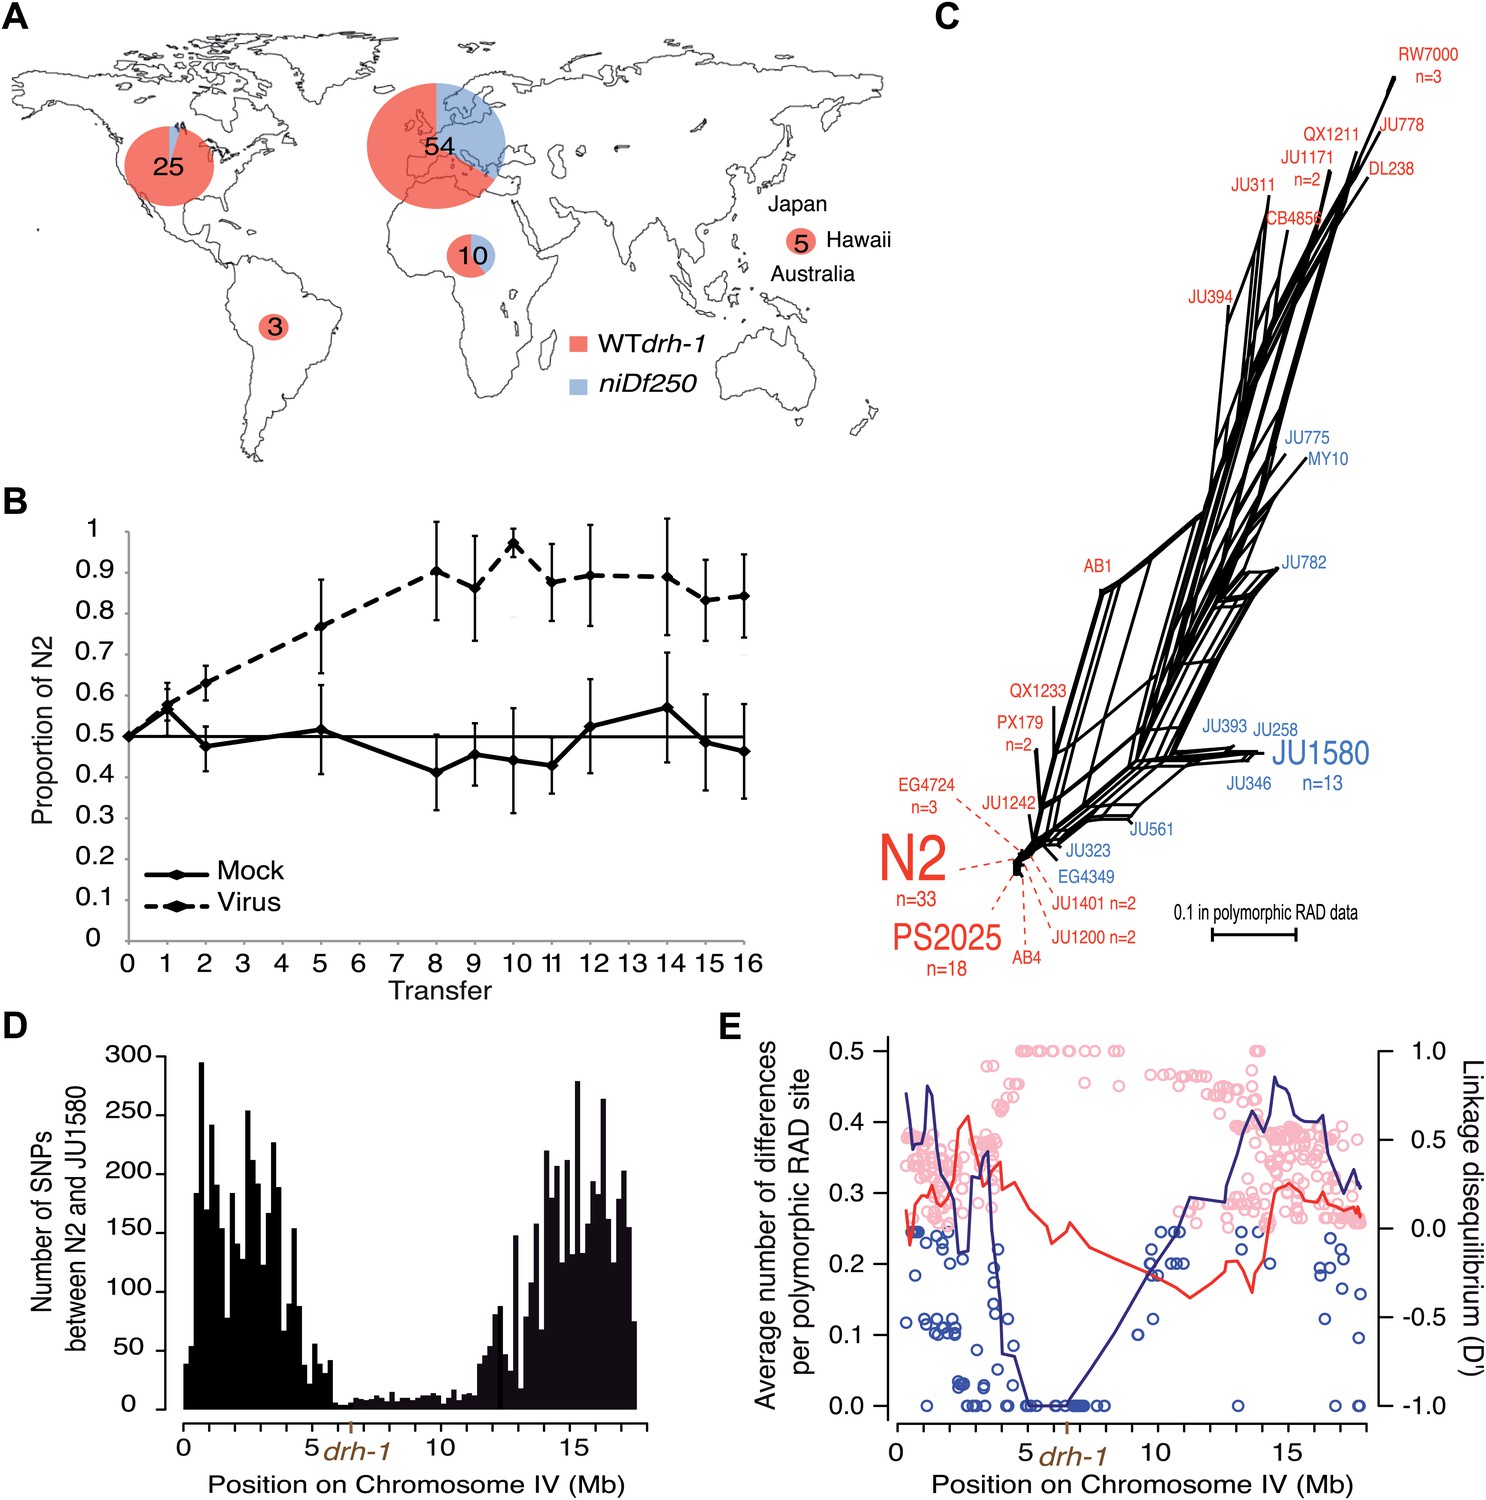
Geographic distribution and evolutionary genetic context of drh-1 alleles.
(A) Geographic distribution of drh-1 alleles. The respective frequencies of the niDf250 and N2 alleles of drh-1 are represented for each world region in blue and red, respectively, based on genotyping of the 97 wild isolates. (B) Competition experiment between the N2 reference and the JU2196 introgression line. In the absence of the Orsay virus, the proportion of the N2 genotype remains close to 50% throughout the experiment (48.6 ± 5.3%). In the presence of the Orsay virus, the proportion of the N2 genotype increases and appears to stabilize around 90% after nine transfers (88.1 ± 4.6%). The presence of the virus has a significant effect (linear model, p=1.6 × 10⁻⁴). Error bars represents standard deviation. (C) Neighbor-network of the 97 isolates in the chromosome IV central region associated with Orsay virus sensitivity. Only one isolate per haplotype is represented; font size is relative to the number (n) of isolates sharing this haplotype. Haplotypes in blue or red carry the niDf250 allele of drh-1, respectively. (D) Distribution of SNPs along chromosome IV between N2 and JU1580, based on JU1580 whole-genome sequencing. (E) Molecular diversity (left y axis scale) is plotted along chromosome IV for isolates carrying the niDf250 or the N2 allele as blue or red lines, respectively. Linkage Disequilibrium D′ values (right y axis scale) between polymorphic RAD sites along chromosome IV and the niDf250 or N2 alleles of drh-1 are represented with blue or red circles, respectively.
Figure 2—figure supplement 1
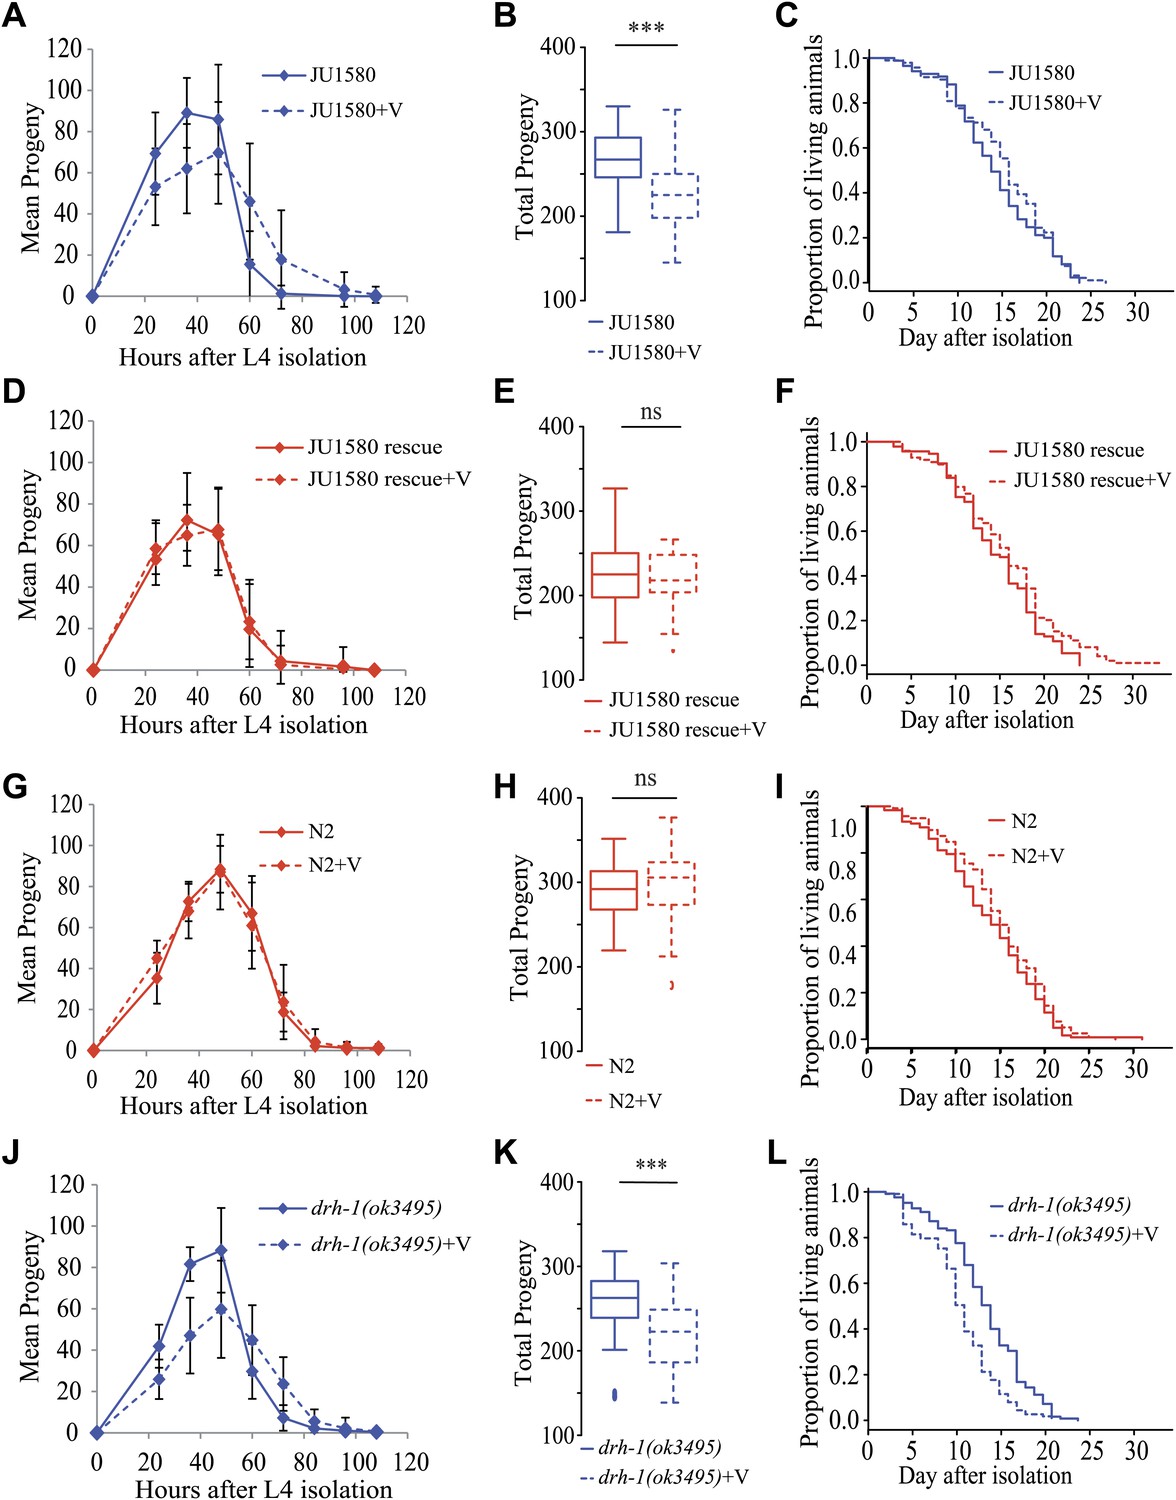
Infection by the Orsay virus has an effect on progeny production of drh-1 deleted strains and on longevity of the drh-1(ok3495) mutant.
(A) Dynamics of progeny production of JU1580 in the absence or presence of the Orsay virus (n = 40 animals). (B) Total progeny production in the same experiment. (C) Survival curves in the absence or presence of virus (n = 130 animals). (D–F) Idem with the SX2377 strain (JU1580 rescue). (G–I) Idem with the N2 strain. (J–L) Idem with the RB2519 strain (the rde-1(ok3495) mutant). JU1580 animals and drh-1(ok3495) mutants show a significant delay in progeny production in the presence of the virus (linear model, p=0.049 and p=7.5 × 10⁻⁴, respectively), as well as a decrease in total progeny production (Wilcoxon rank test, p=1.6 × 10⁻⁴ and p=1.2 × 10⁻⁴, respectively). The N2 and SX2377 strains with the intact drh-1 gene do not show this viral sensitivity. Concerning longevity, the drh-1(ok3495) mutant has a significantly reduced lifespan in the presence of the virus (logrank test, p=5.2 × 10⁻⁴), but the JU1580 isolate does not (p=0.85). Strains only carrying deleted versions of drh-1 are represented in blue while strains carrying the N2 drh-1 are represented in red. ***: p<0.001.
Figure 2—figure supplement 2
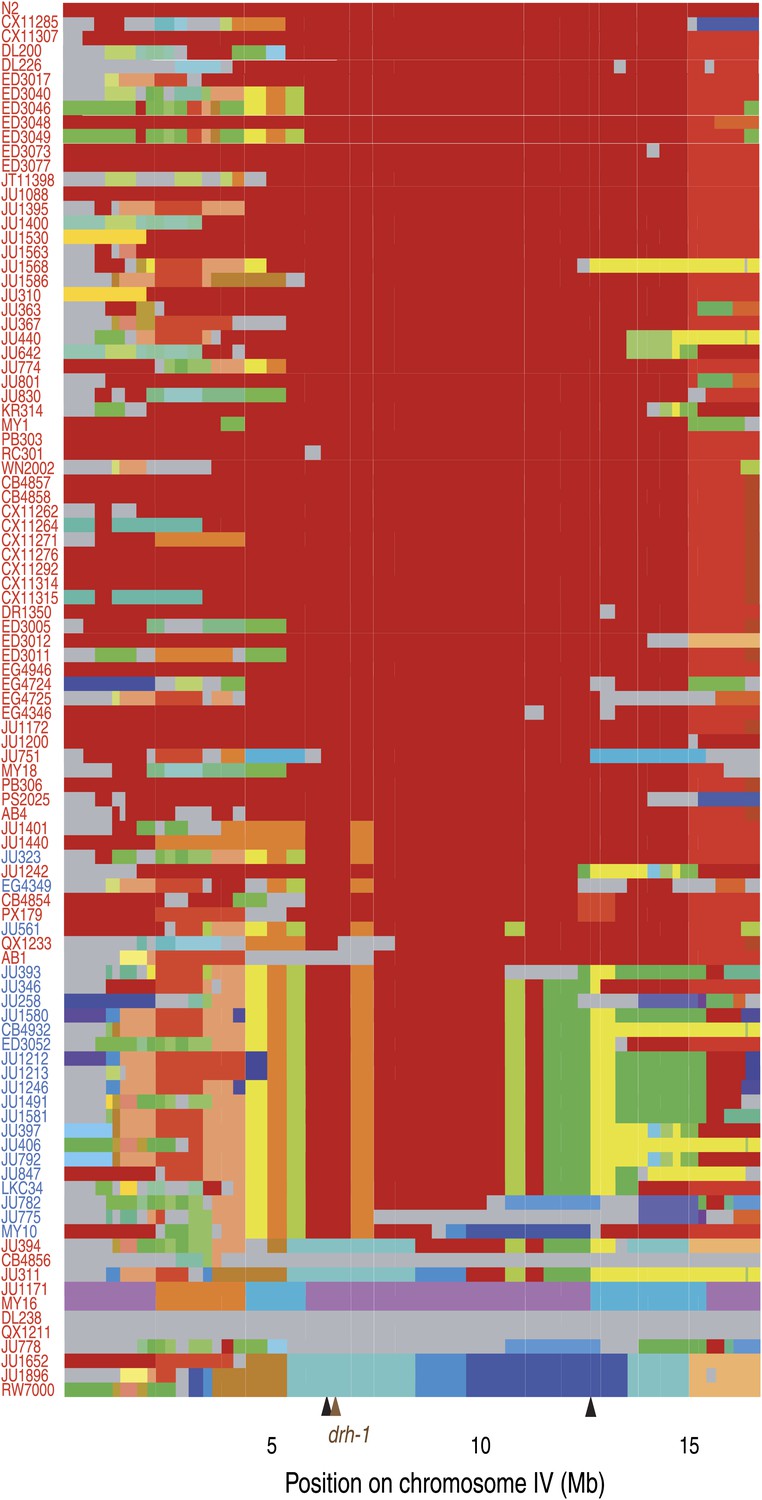
Chromosome IV haplotypes for the 97 isolates (modified from Supplemental Figure 7 in Andersen et al., 2012).
Each row represents one of the 96 isolates, ordered from the less divergent (top) to the most divergent (bottom) from N2 for the region associated with Orsay virus sensitivity (IV:6,388,961 to IV:12,408,993; between black arrows). All clones that share a given region of a chromosome are shown with the same color in that region (N2 is in red). Haplotypes unique to a single isolate are colored in gray. Isolates in blue or red carry the niDf250 or N2 allele of drh-1, respectively.
Figure 3 with 3 supplements
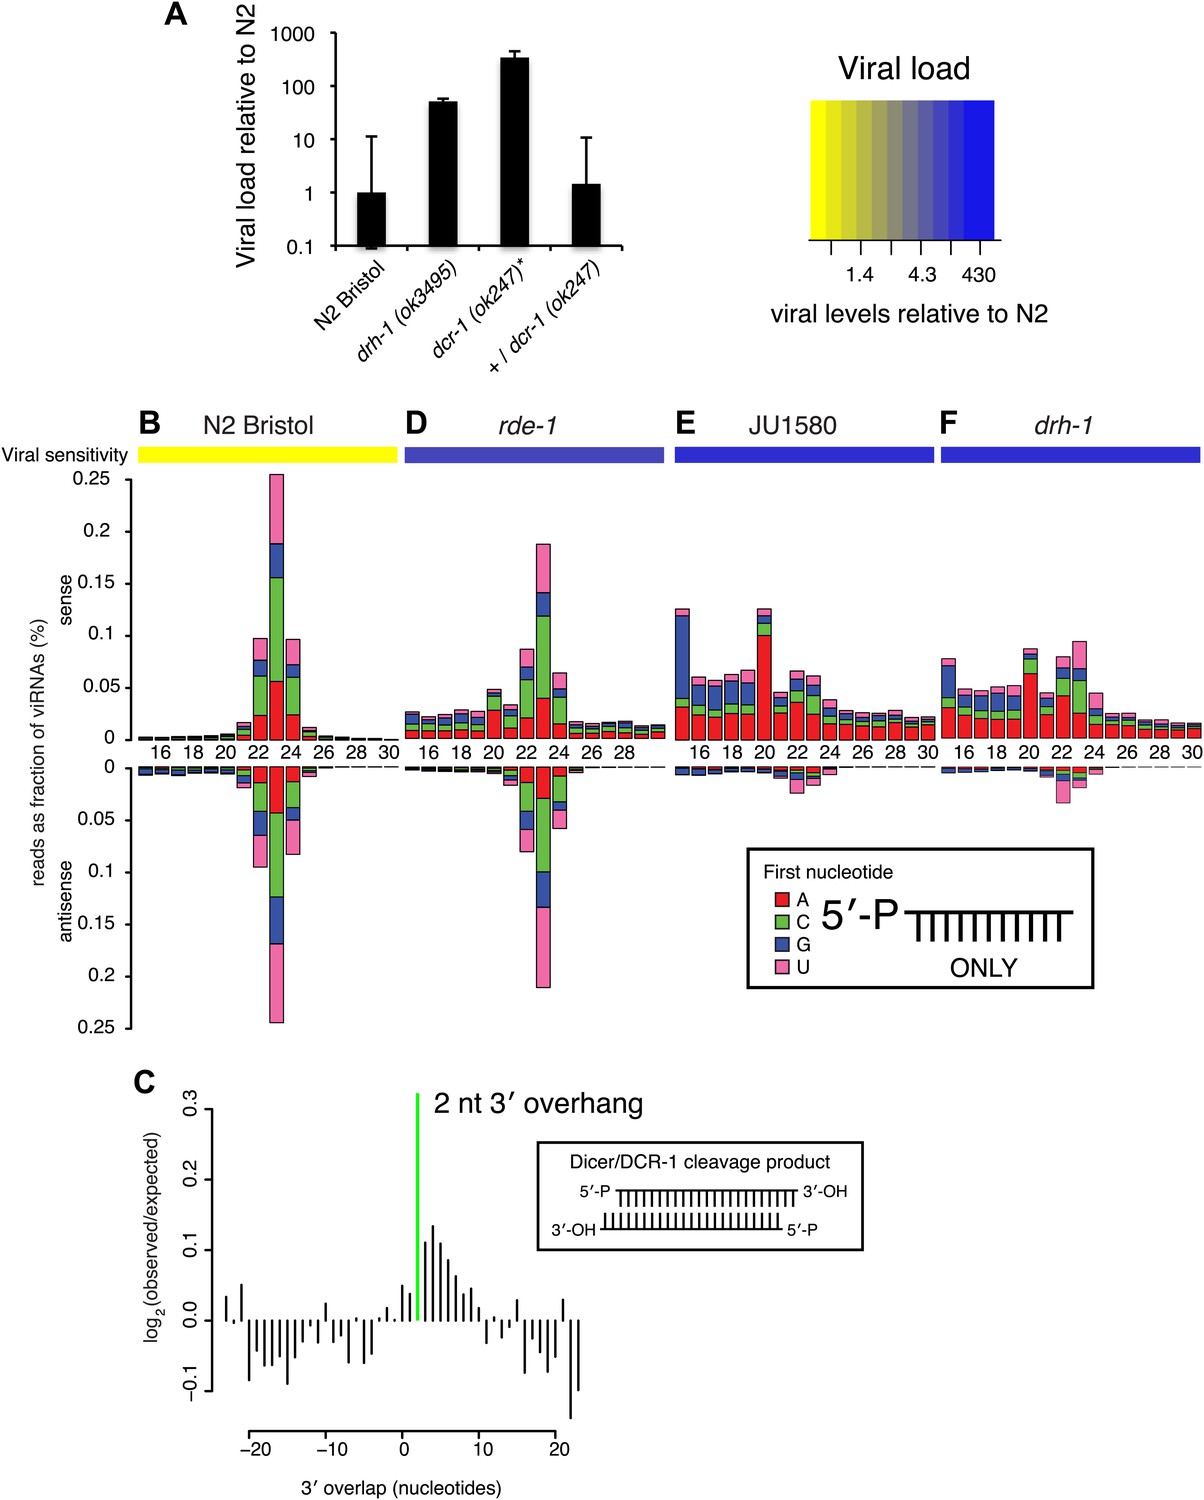
DRH-1 is required for the Orsay antiviral response and primary viRNA generation.
(A) qRT-PCR analysis of viral load after 4 days of infection with the Orsay virus. *, dcr-1 mutants are sterile, data shown are homozygous mutant animals from heterozygous mothers. (B) Primary viRNA populations in strains as indicated. 5′ dependent small RNA sequencing captures only primary siRNAs with a 5′ monophosphate. Data are grouped as sense or antisense and according to length and the identity of the first nucleotide. From the same samples viral load was measured by qRT-PCR of the Orsay virus RNA1 genome after four days of infection (heatmap, see also Figure 3A and Figure 3—figure supplement 1B). (C) Analysis of phasing of 23 nt primary viRNAs generated in infected N2 animals. The x axis shows the length of the overhang in nucleotides, either 5′ (negative numbers) or 3′ (positive numbers), for each pair of sequences that map to overlapping regions on opposite strands. A value of 0 represents a pair of viRNAs with perfect complementarity that would form blunt ends. The y axis shows the number of times each particular overhang was observed relative to the number of times that such an overhang would be expected if overhangs were random. Green bar indicates the 2 nt 3′ overhang. (D–F) same as in (B).
Figure 3—figure supplement 1
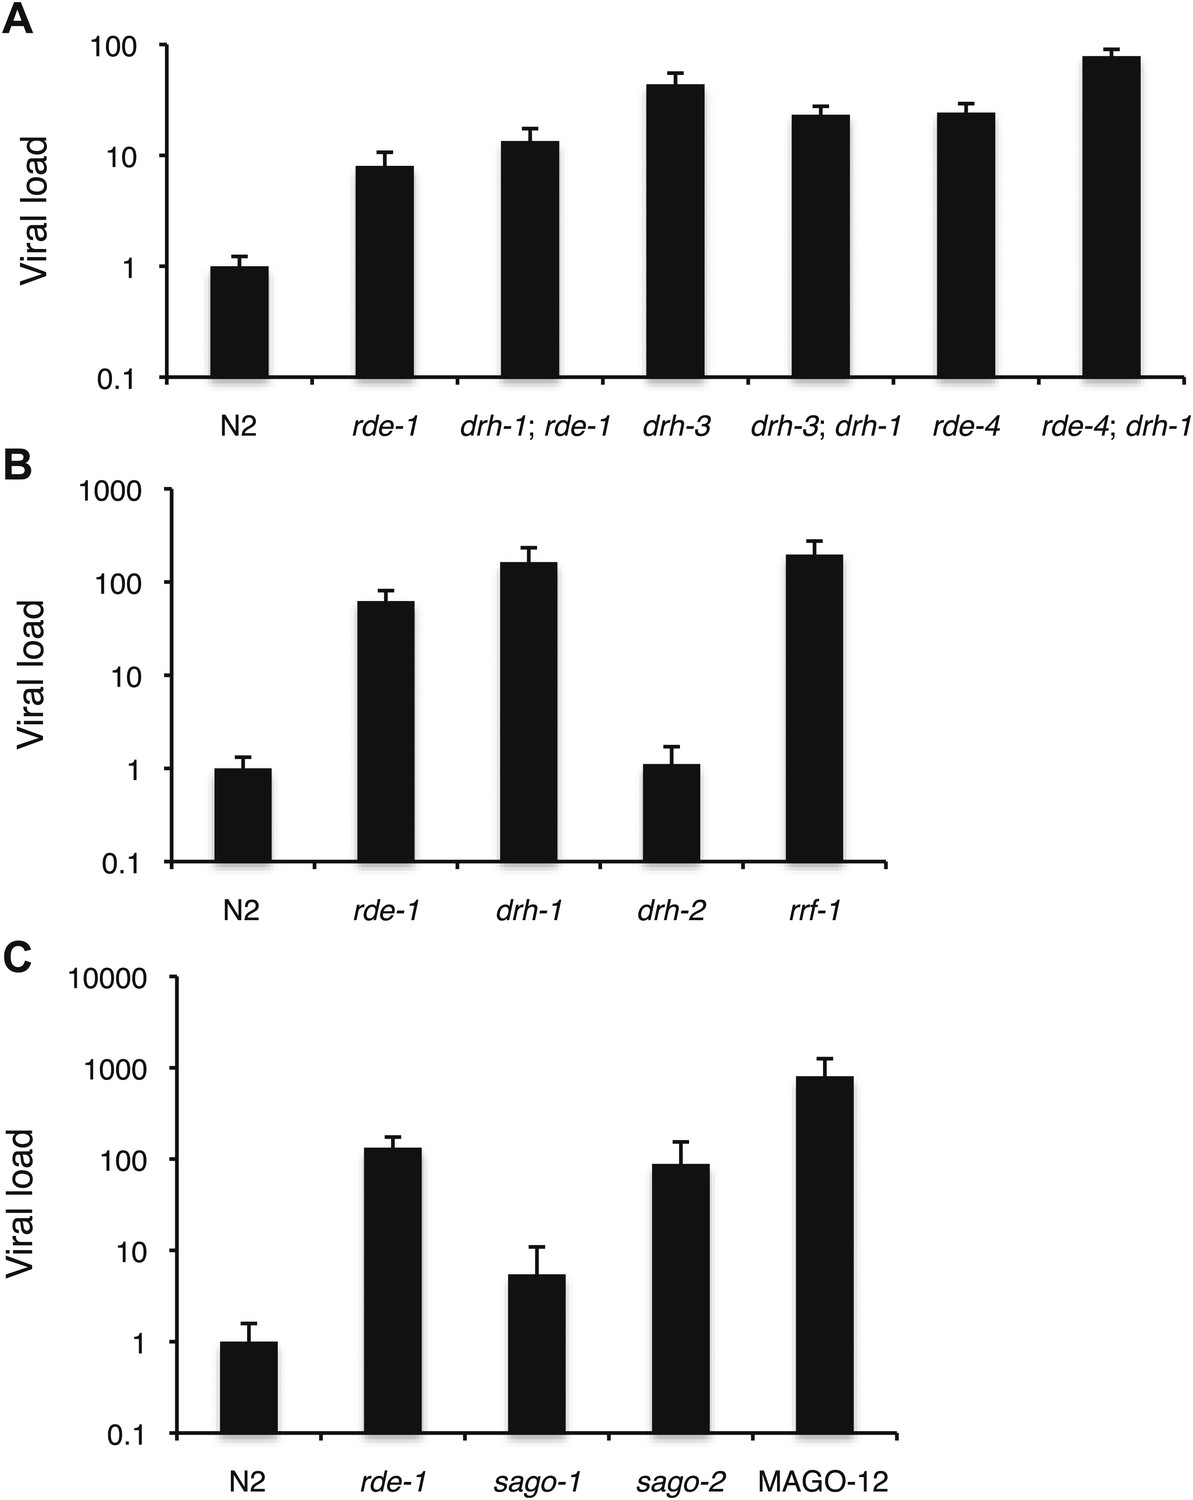
Viral sensitivity in a number of mutants of small RNA pathway genes.
(A–C) RT-qPCR analysis of viral levels after 4 days of infection with the Orsay virus. Different panels refer to different sets of experiments using different stocks of virus. Note that sago-2 appears to be highly sensitive to viral infection.
Figure 3—figure supplement 2
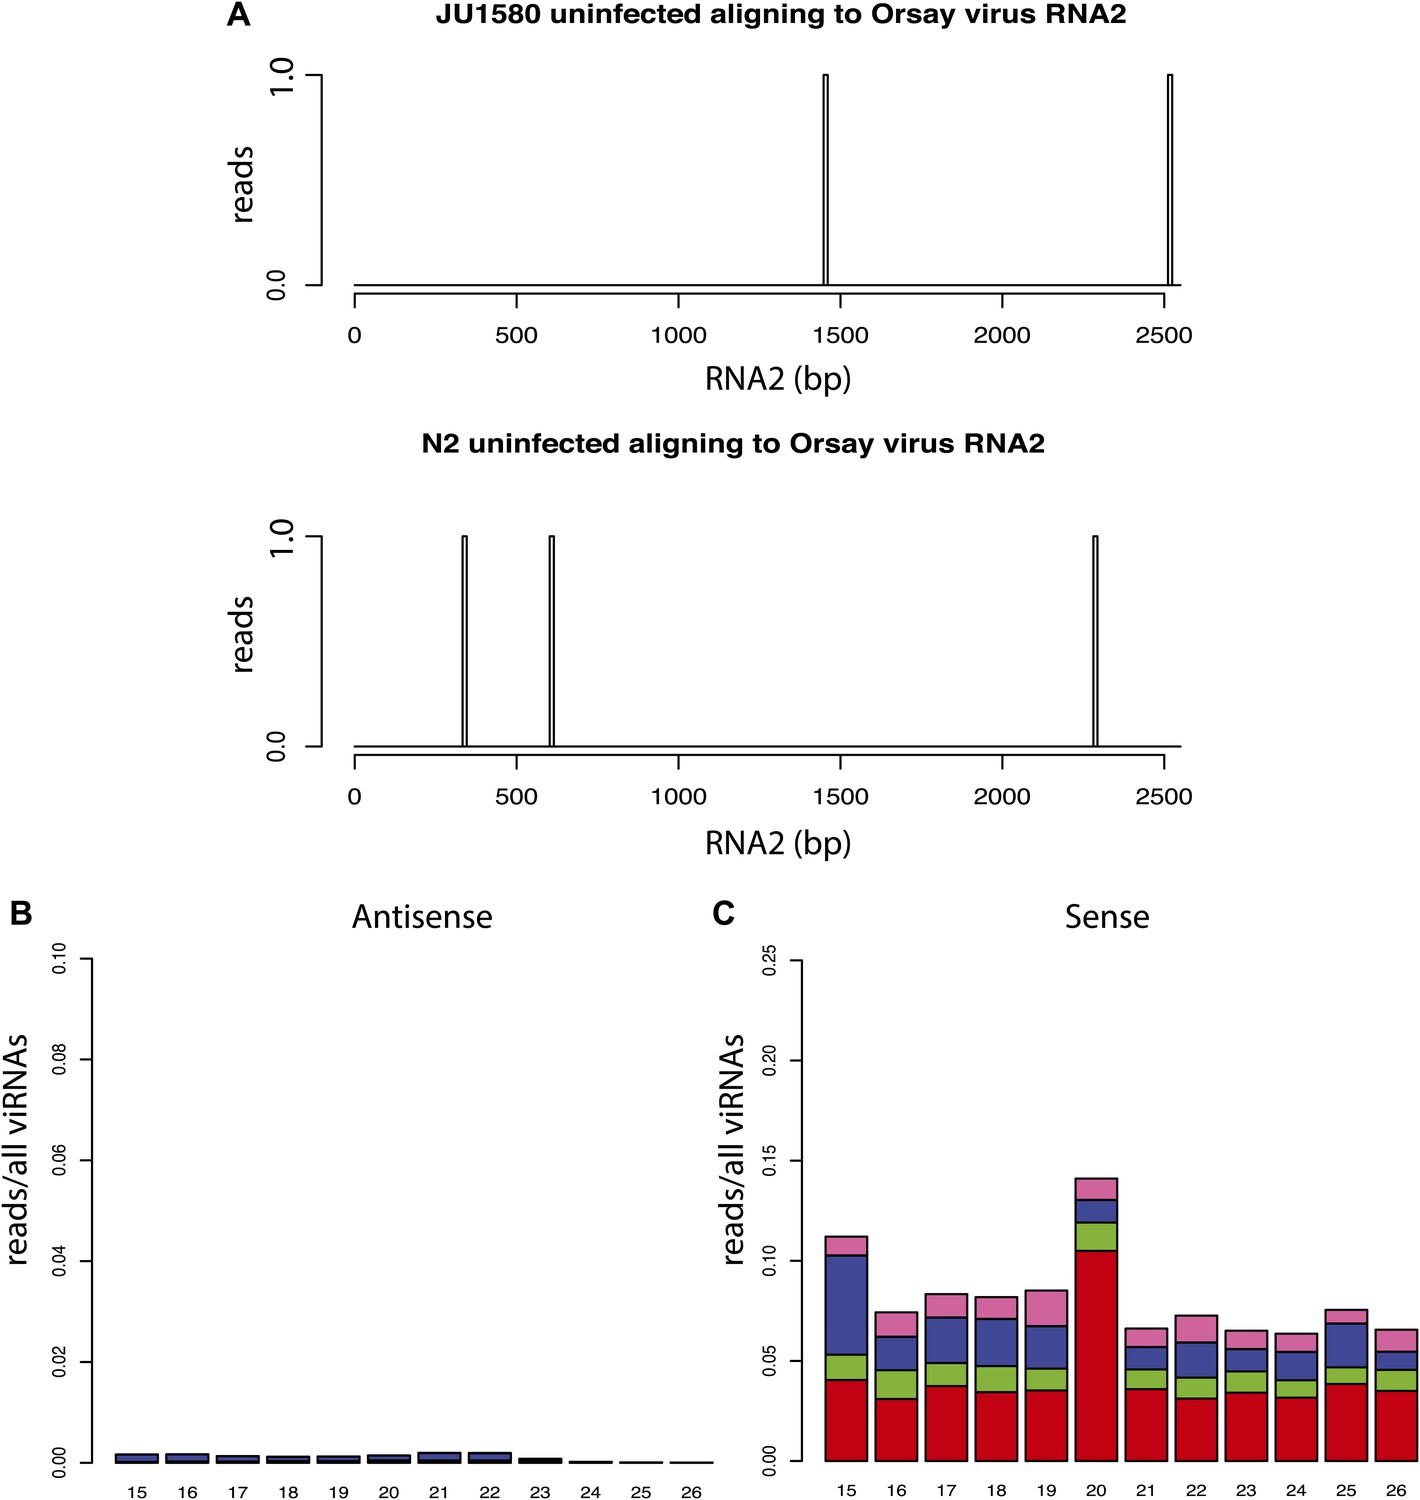
Additional small RNA sequencing controls.
(A) Virtually no small RNAs in libraries prepared from uninfected animals align to the viral genome. All reads aligning to RNA2 of the Orsay genome with up to one mismatch are shown. (B and C) 5´ dependent small RNA sequencing of infected drh-1; rde-4 double mutants (compare to Figure 4K).
Figure 3—figure supplement 3
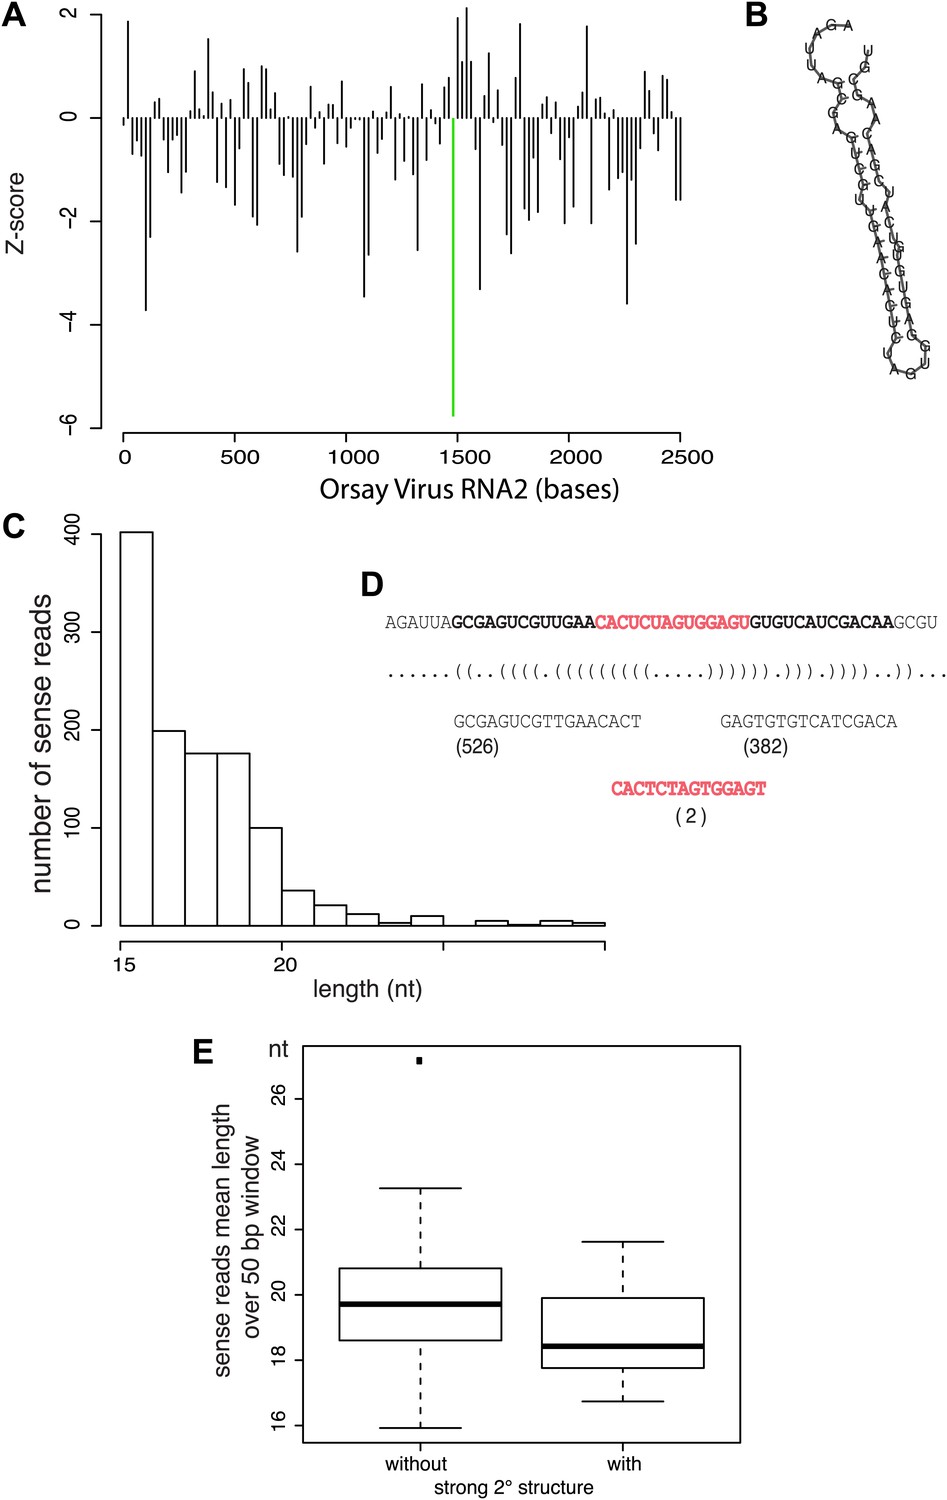
Relationship between antiviral small RNAs and predicted secondary structure within the viral genome.
(A) Profile of the strength of predicted secondary structures for each 50 bp sliding window in 20 bp steps across the viral genome, as measured by the Z-score of the RNA-fold free energy compared to 100 random shuffles of the sequence. Thus negative values represent a stronger structure (more negative free energy) than random. The region with the strongest predicted structure is highlighted by a green bar. (B) Predicted minimum free energy structure of the region highlighted in (A). (C) Distribution of read lengths for JU1580 small RNAs mapping to the viral genome anywhere within this region. (D) Detailed analysis of the reads mapping within the selected region indicating the number of reads that come from the predicted arms and loop of the hairpin shown in (B). (E) Boxplot of read lengths for JU1580 small RNAs mapping either to regions with weak predicted secondary structures, or to regions with strong predicted secondary structures. The difference between unstructured or structured regions is statistically significant (p=0.03, Wilcoxon unpaired test).
Figure 4 with 4 supplements

DRH-1 acts upstream of a 22G secondary siRNA pathway.
(A–M) Primary and secondary viRNA populations in strains as indicated. 5′ independent small RNA sequencing captures 5′ primary siRNAs (5′ monophosphate) and secondary siRNAs (5′ triphosphate). Data are grouped as sense or antisense and according to length and the identity of the first nucleotide. From the same samples viral load was measured by RT-qPCR of the Orsay virus RNA1 genome after 4 days of infection (heatmap, see also Figure 3A and Figure 3—figure supplement 1).
Figure 4—figure supplement 1
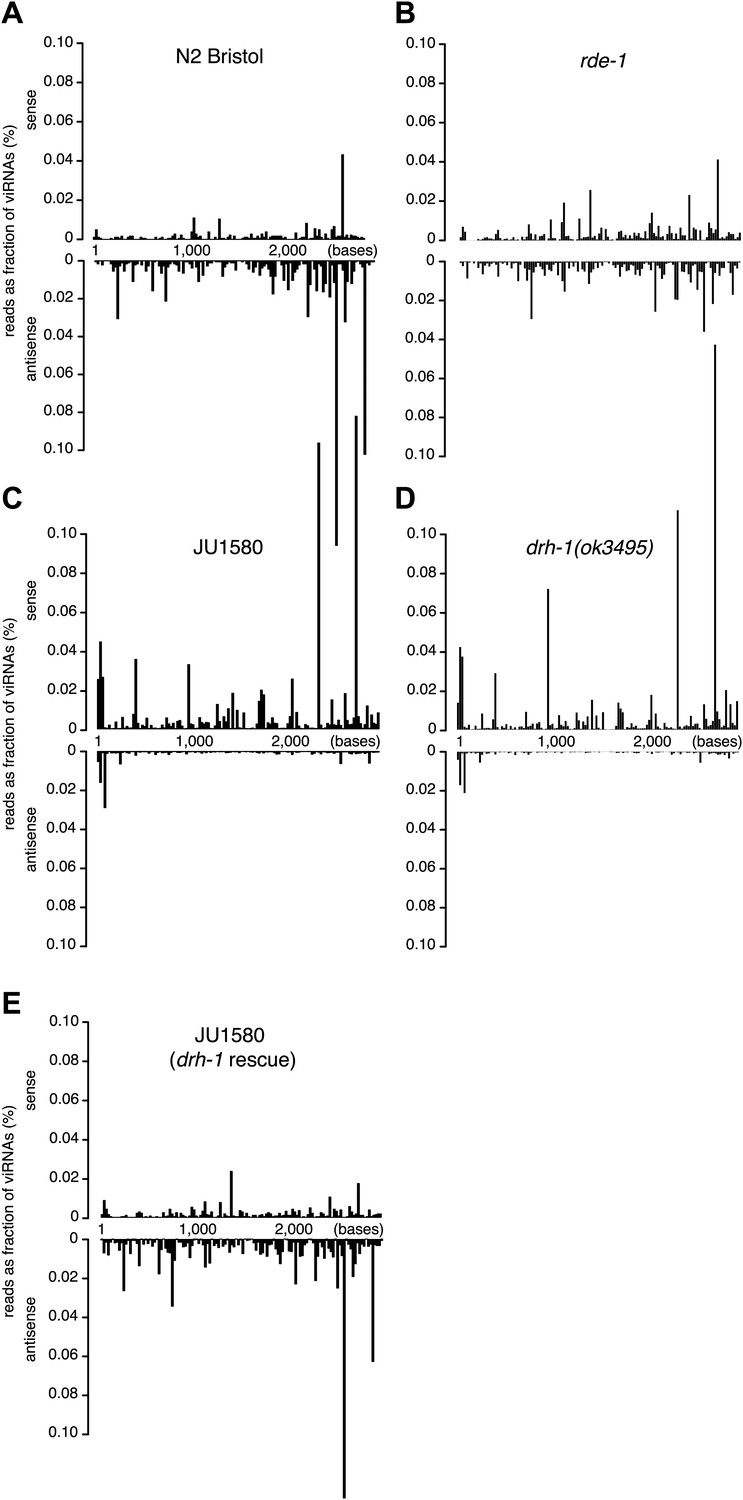
Distribution of viRNAs along the Orsay genome.
(A–E) Small RNAs (primary and secondary siRNAs from 5′ independent sequencing) were mapped to Orsay RNA2 genomic sequence in strains indicated. JU1580 (drh-1 rescue) in panel (E) refers to SX2375.
Figure 4—figure supplement 2
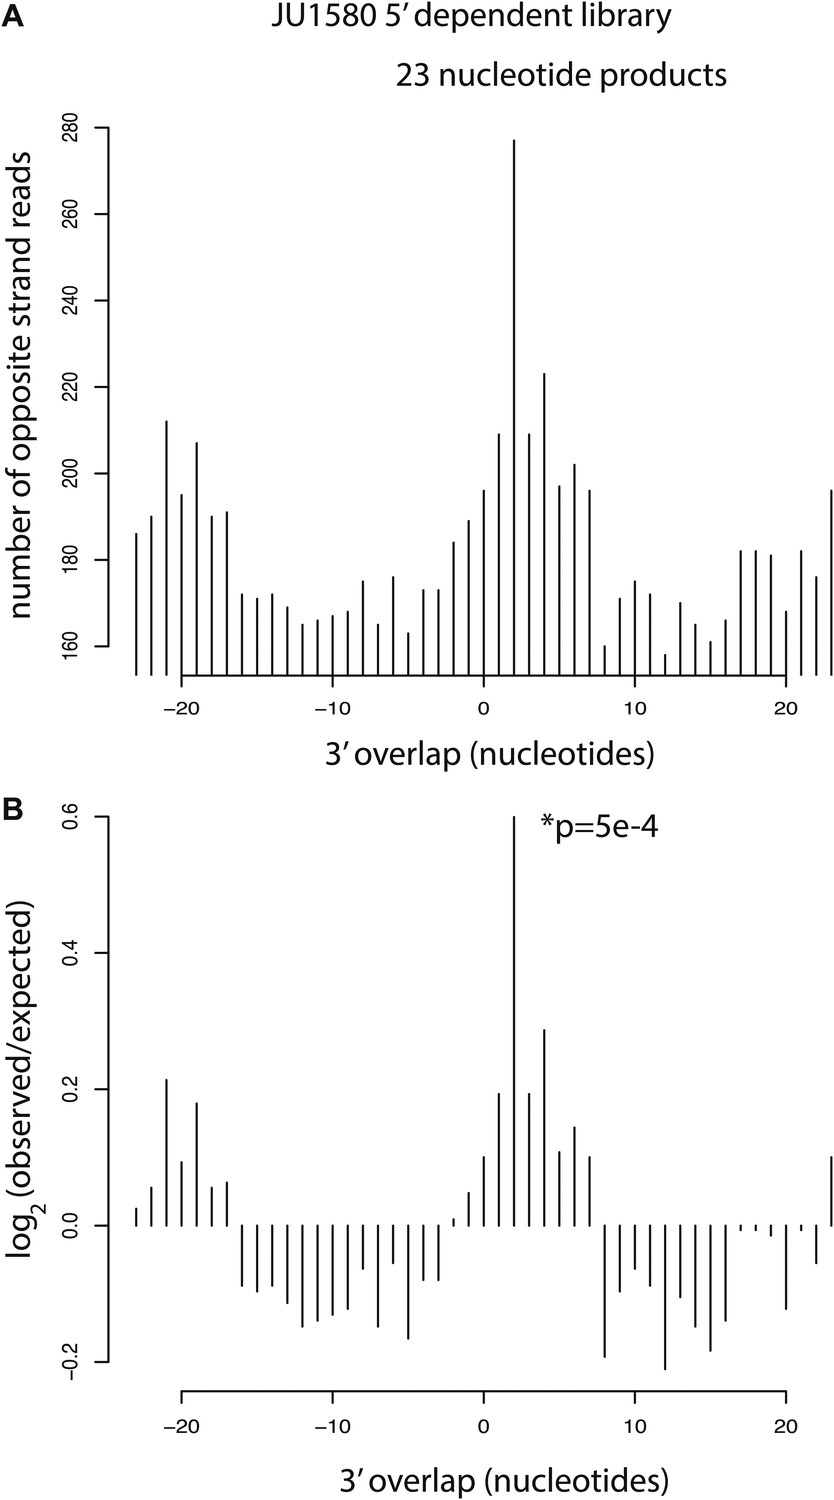
Analysis of residual Dicer products in JU1580 mutants.
(A) Number of 23 nucleotide long reads showing 3´ overlap as indicated on the x axis. (B) log2 observed/expected showing enrichment for a 2 nucleotide 3´ overlap. The p value is for a χ2 test against a uniform distribution.
Figure 4—figure supplement 3
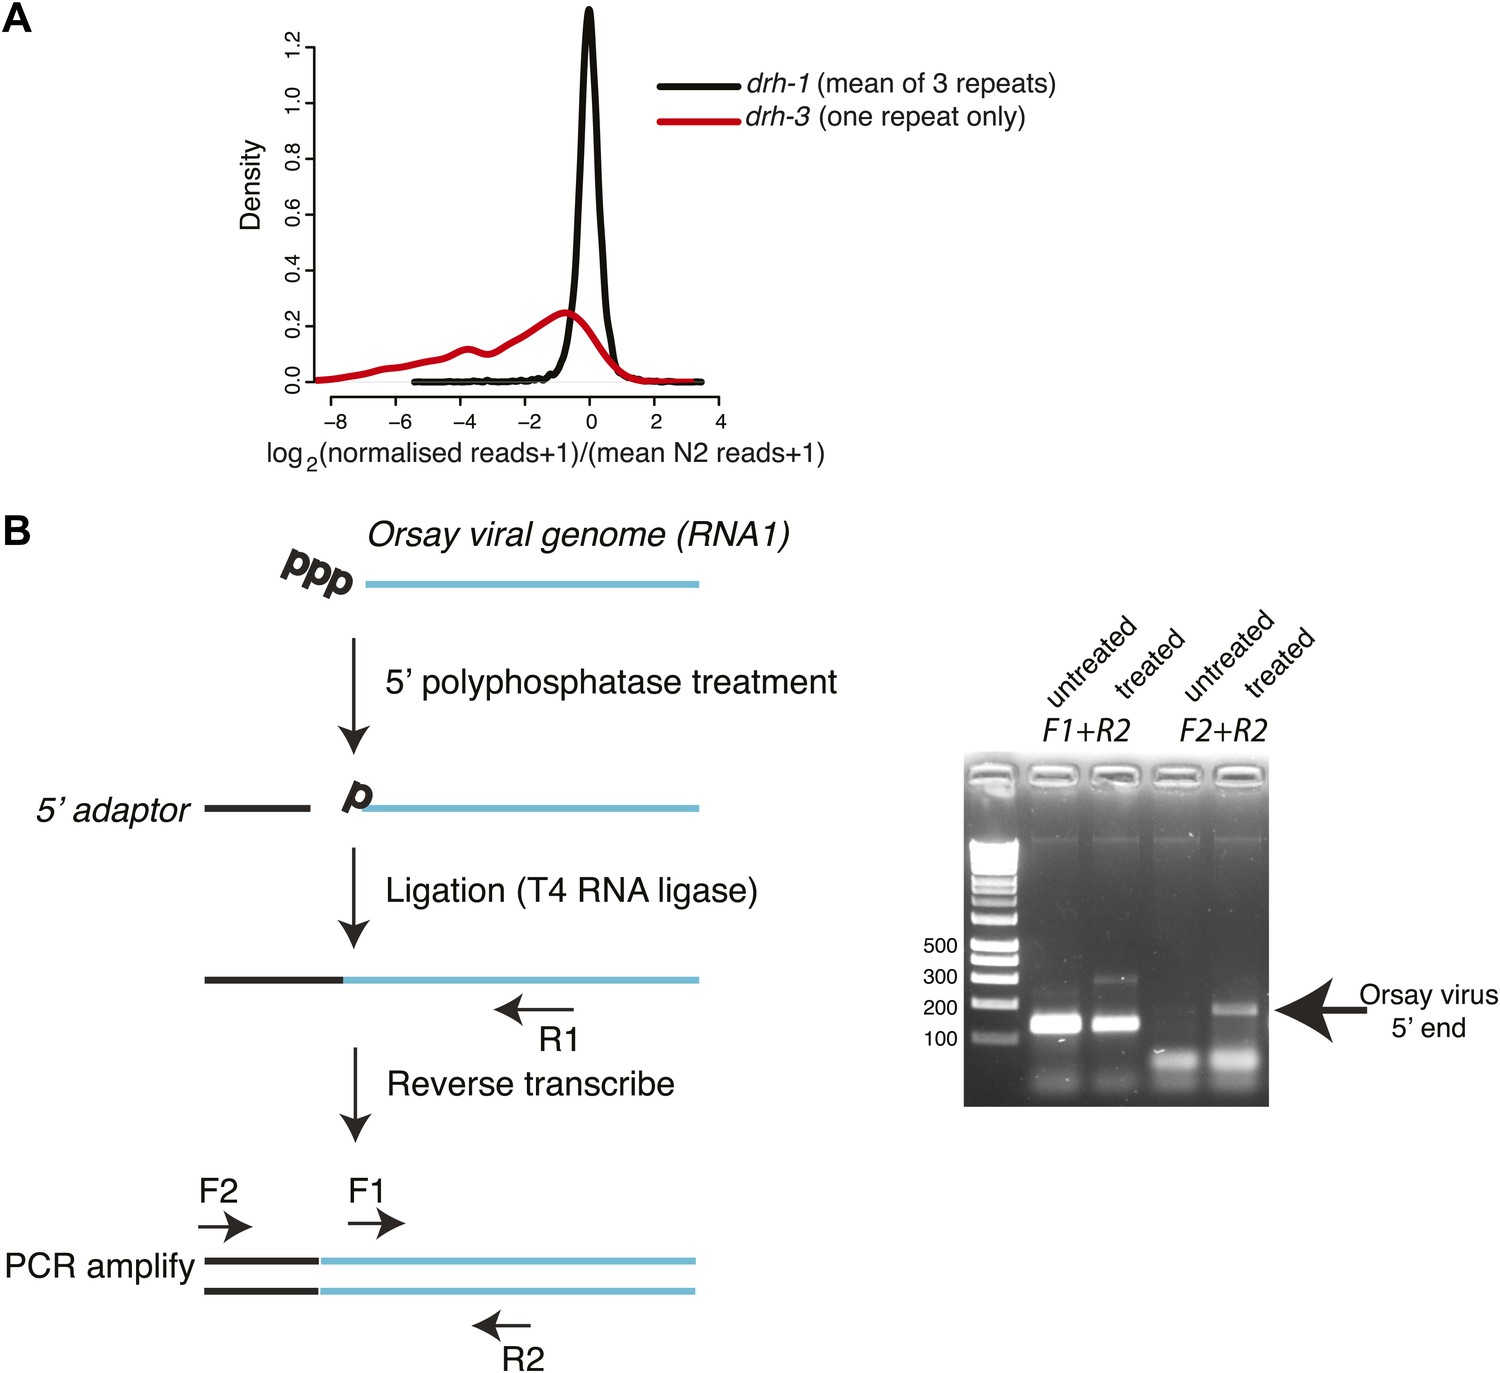
Analysis of 22G-RNAs mapping to endogenous loci.
(A). Endogenous 22G secondary siRNAs mapping to genes in drh-1 and drh-3 mutants compared to wild-type (N2) animals. All 22G siRNAs mapping to non-overlapping protein-coding genes for which at least 10 reads could be detected in at least one repeat of N2 sequencing are shown. Reads for each protein-coding gene were scaled so that each library was directly comparable by multiplying the number of reads by the ratio of the total size of the library to the size of the largest N2 library. 1 read was then added to allow the log2 of the number of reads to be taken. The density plot shows the distribution of differences of normalized reads averaged over 3 repeats of each of drh-1 mutants and N2. The distribution of differences of drh-3 to N2 obtained using the same methods is shown for comparison. (B) 5´ RACE analysis of the Orsay viral genome. The left-hand panel shows the method used to asses whether the 5´ end of the virus carries a triphosphate or not. Primer pairs used for PCR are shown—F1 is a positive control annealing within the viral sequence and F2 is adaptor specific. The right-hand panel shows amplification with the primer pairs as indicated in the left-hand panel.
Figure 4—figure supplement 4
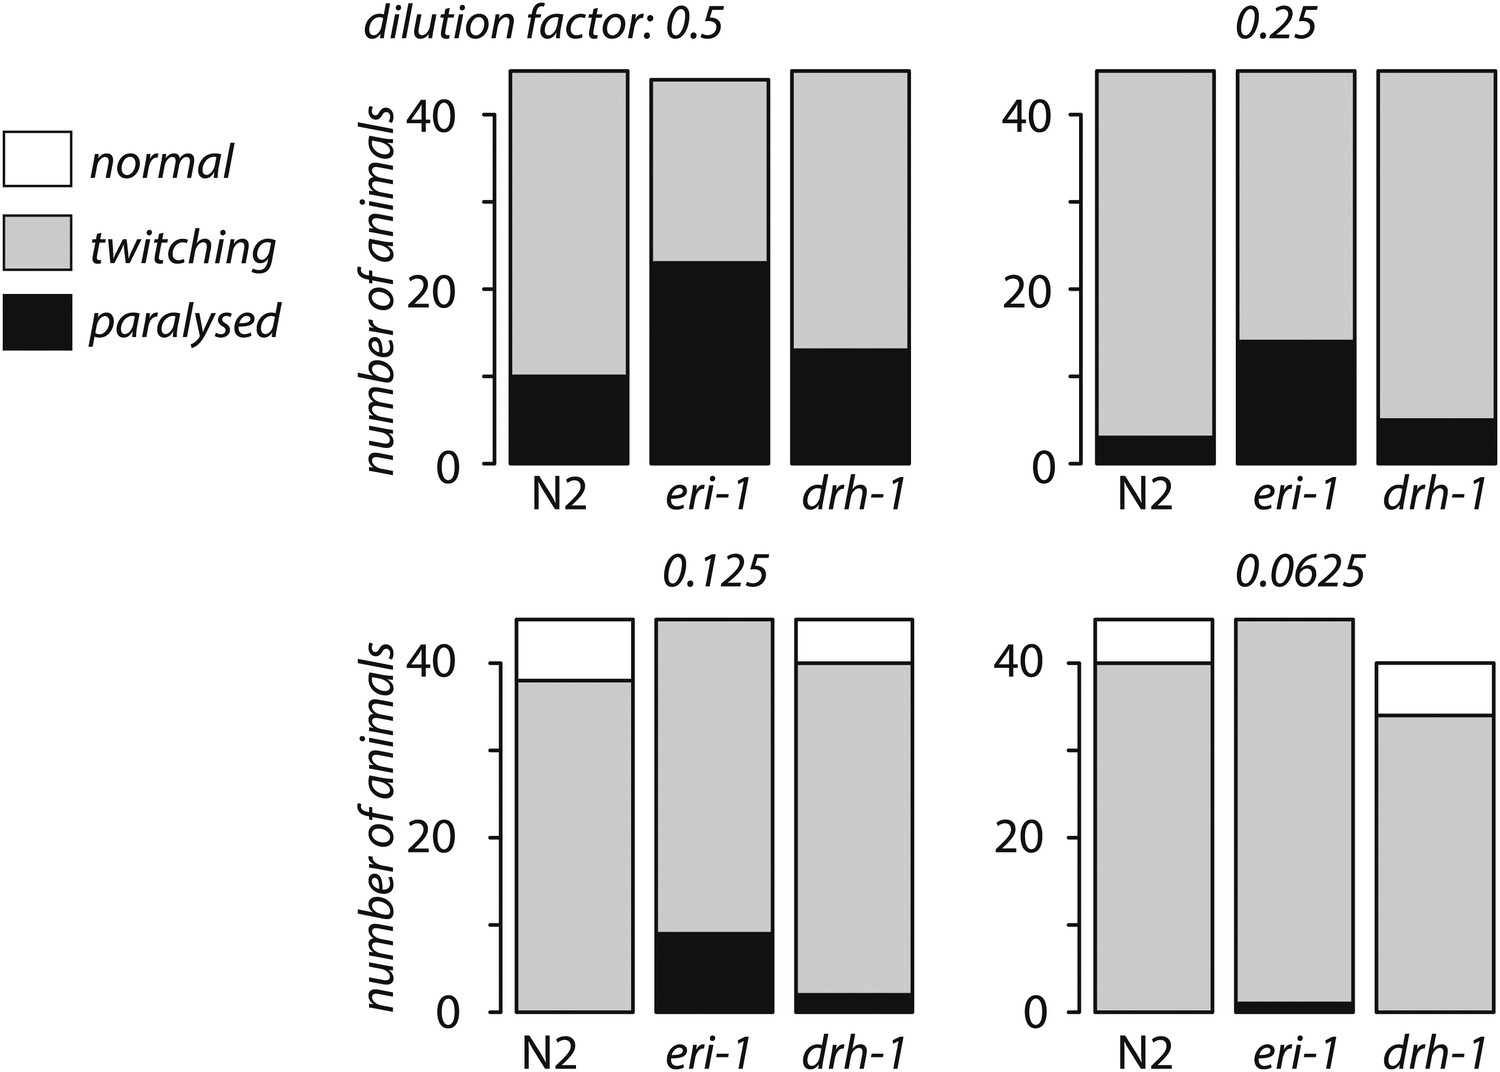
drh-1 mutants are not hypersensitive to RNAi.
The bar chart shows the number of L4 stage animals displaying either paralysis, twitching or no phenotype after feeding on RNAi E. coli for four days is shown for serial dilutions of unc-22 RNAi E. coli with E. coli expressing an empty vector control. No twitching was observed in any strain when the empty vector RNAi alone was used. We observed enhanced RNAi in eri-1 vs N2 (p<1 x 10⁻⁴, Fisher's exact test) for every dilution but no difference N2 vs drh-1 (p<0.1, Fisher's exact test) at any dilution.
Figure 5

Model: DRH-1 triggers a hierarchical antiviral RNAi pathway.
Upon infection of the N2 C. elegans strain by the Orsay virus, DRH-1 recruits DCR-1 and its partner RDE-4 to the viral dsRNA replication intermediate. DCR-1 cleaves the viral genome into 23 nt viRNA duplexes with a 2 nt 3′ overhang. Duplex viRNAs are incorporated into the Argonaute protein RDE-1 and one strand is lost to give rise to primary viral siRNAs (primary viRNAs). Primary viRNAs and RDE-1 recruit an RdRP complex to the viral genome to synthesize secondary viral siRNAs, which act to silence viral transcripts or inhibit virus replication. The antiviral RNAi pathway is dependent on the SAGO-2 secondary Argonaute protein (Figure 3—figure supplement 1C). The antiviral RNAi pathway has parallels to the exogenous RNAi pathway and the endogenous RNAi pathway thought to recognize aberrant endogenous transcripts (Gu et al., 2009). A complex of DRH-1, DCR-1 and RDE-4 has previously been observed in whole animal lysates (Tabara et al., 2002; Duchaine et al., 2006; Thivierge et al., 2012). We refer to this complex as the Viral Recognition Complex (ViRC). ERI, other ERI factors. ERIC, ERI Complex.
Author response image 1
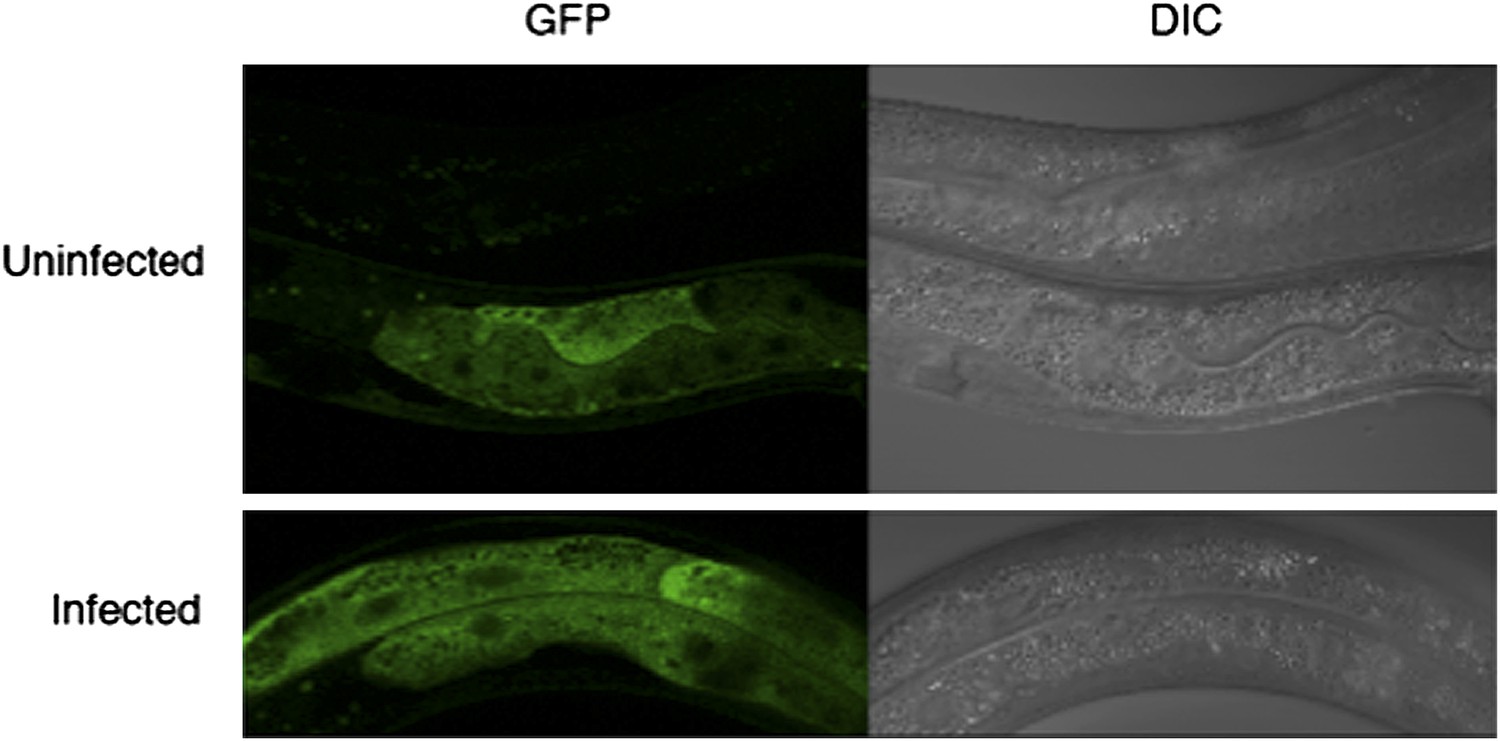
Assessing the subcellular localization of GFP in drh-1 mutant animals carrying a sur-5::drh-1::gfp transgene as an extra-chromosomal array.
Infections were carried out as described in Materials and methods. As the transgene is extrachromosomal, it is lost in some animals (top animal, top panel). We do not observe a change in GFP intensity or localization upon infection with the Orsay virus.
Tables
Table 1
Evolution of Dicer and RIG-I family proteins
| helicase + RIG-I structures in species | Dicer | ||||
|---|---|---|---|---|---|
| Cnidaria | Nematostella vectensis | 2 | 1 | ||
| Bilateria | Protostomia | Polyzoa | |||
| Platyzoa | Schmidtea mediterranea | 0 | 1 | ||
| Kryptochozoa | |||||
| Mollusca | Aplysia californica | 0 | 1 | ||
| Annelida | Platynereis dumerilii | 0 | 1 | ||
| Ecdysozoa | Drosophila melanogaster | 0 | 2 | ||
| Trichinella spiralis | 2 | 1 | |||
| Caenorhabditis elegans | 3 | 1 | |||
| Deuterostomia | Branchiostoma floridae | 2 | 1 | ||
| Meleagris gallopavo | 3 | 1 | |||
| Taeniopygia guttata | 3 | 1 | |||
| Gallus gallus | 2 | 1 | |||
| Homo sapiens | 3 | 1 |
-
Presence of Dicer and RIG-I family proteins in selected animals. Data were obtained from Pfam (version 26.0) (Finn et al., 2010) (pfam.sanger.ac.uk). RIG-I family proteins were identified by having both helicase domains and the RIG-I C-terminal domain (Pfam: PF11648). Available sequence data is sparse for some clades and absence of data might not be sufficient evidence for absence of genes.
Additional files
-
Supplementary file 1
(A) Table 1: Strains used in this study. (B) Table 2: Oligonucleotides used in this study.
- https://doi.org/10.7554/eLife.00994.020
Download links
A two-part list of links to download the article, or parts of the article, in various formats.
Downloads (link to download the article as PDF)
Open citations (links to open the citations from this article in various online reference manager services)
Cite this article (links to download the citations from this article in formats compatible with various reference manager tools)
A deletion polymorphism in the Caenorhabditis elegans RIG-I homolog disables viral RNA dicing and antiviral immunity
eLife 2:e00994.
https://doi.org/10.7554/eLife.00994


