Three-color single molecule imaging shows WASP detachment from Arp2/3 complex triggers actin filament branch formation
- Brandeis University, United States
- Howard Hughes Medical Institute, University of Texas Southwestern Medical Center, United States
- New England Biolabs, United States
Figures
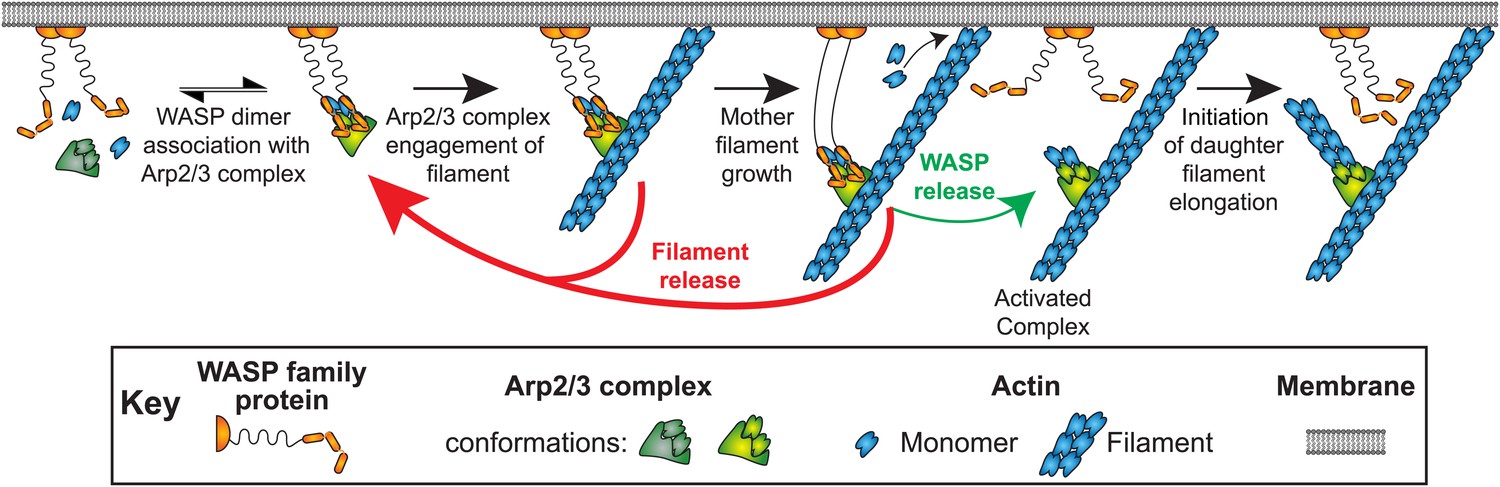
Figure 1
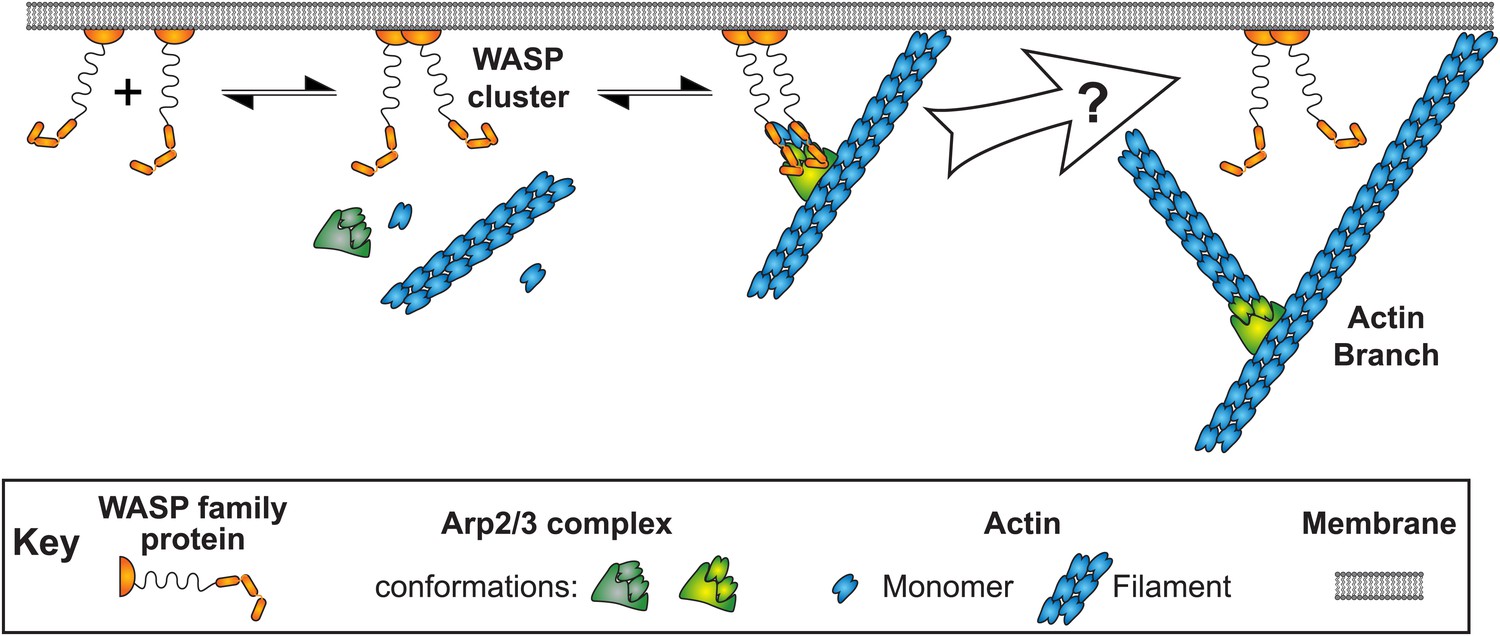
Pathway of Arp2/3 complex mediated actin branch formation activated by WASP protein dimers on the inside surface of a cell membrane, as deduced from previous studies.
Within the white arrow Arp2/3 complex is activated by VCA, detaches from the membrane and initiates daughter filament elongation. The order of these steps and how they are coordinated remains unclear.
Figure 2 with 4 supplements
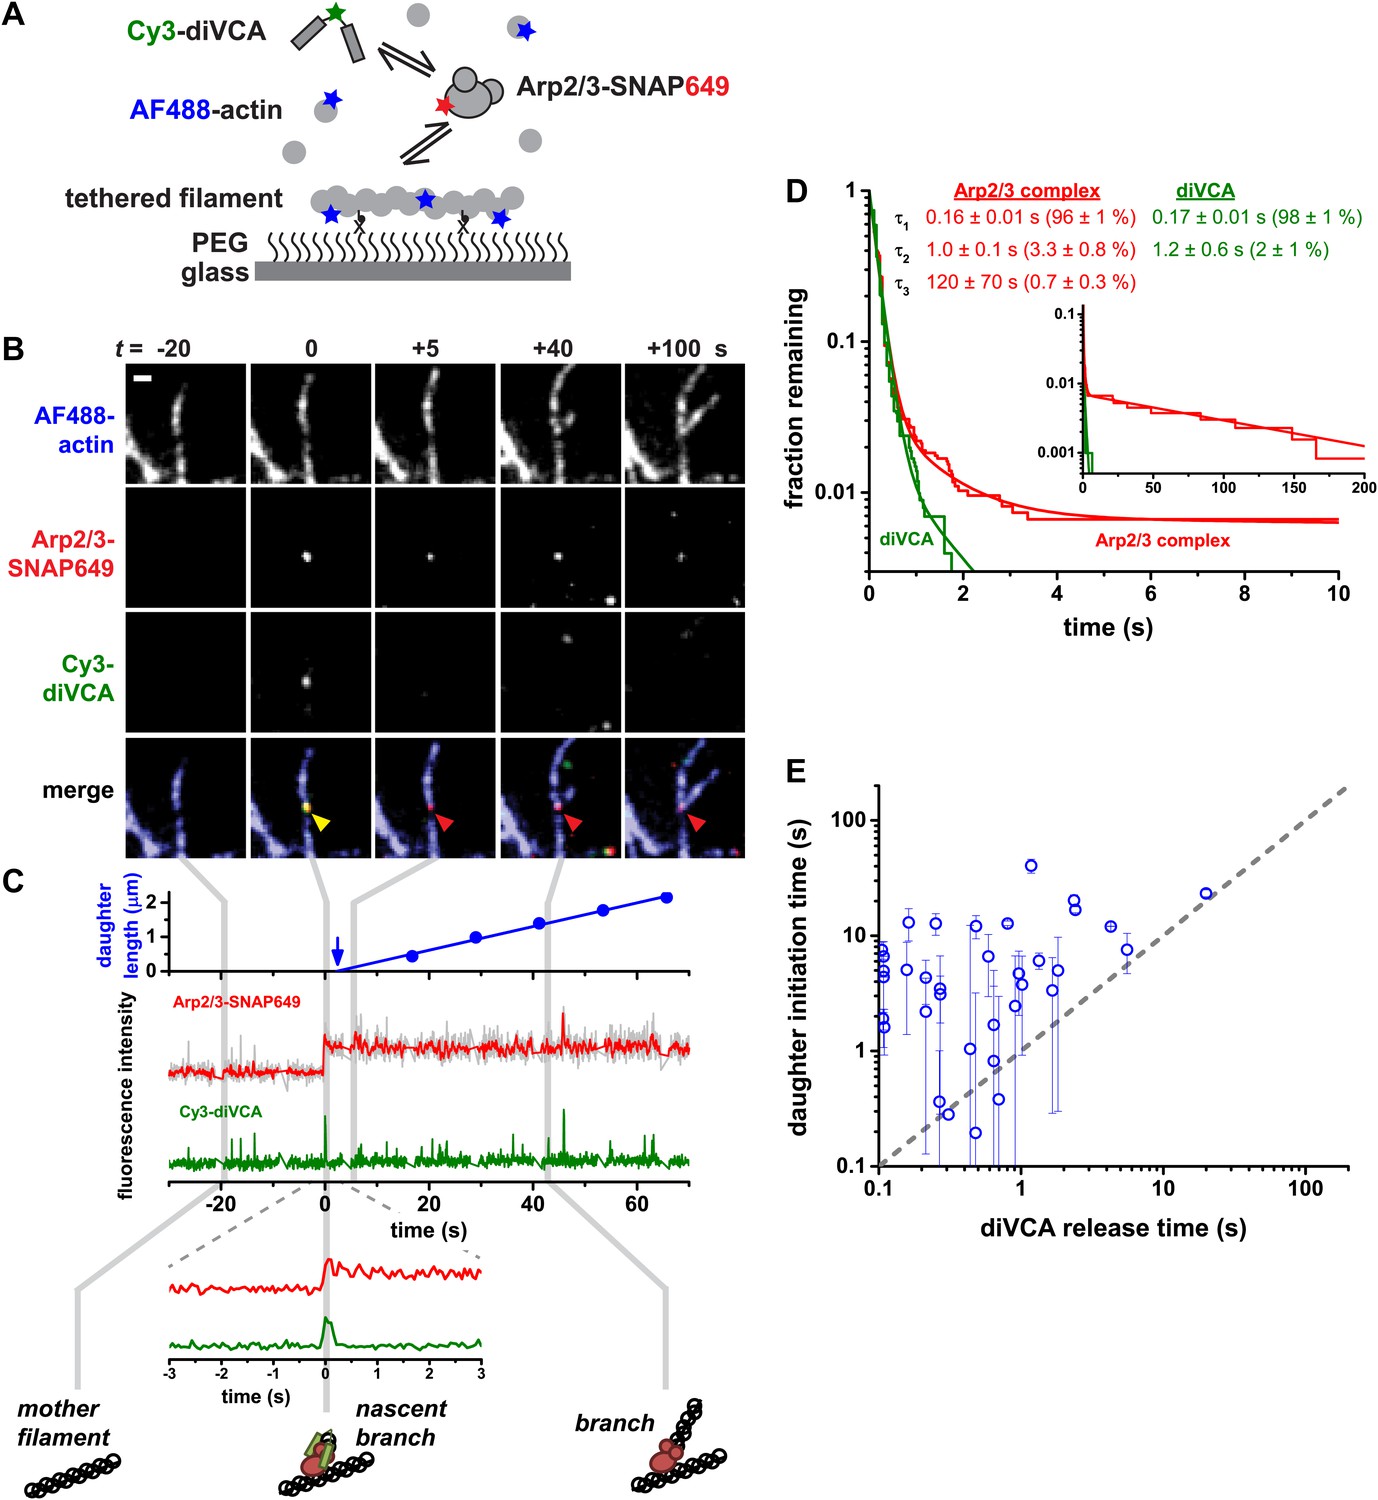
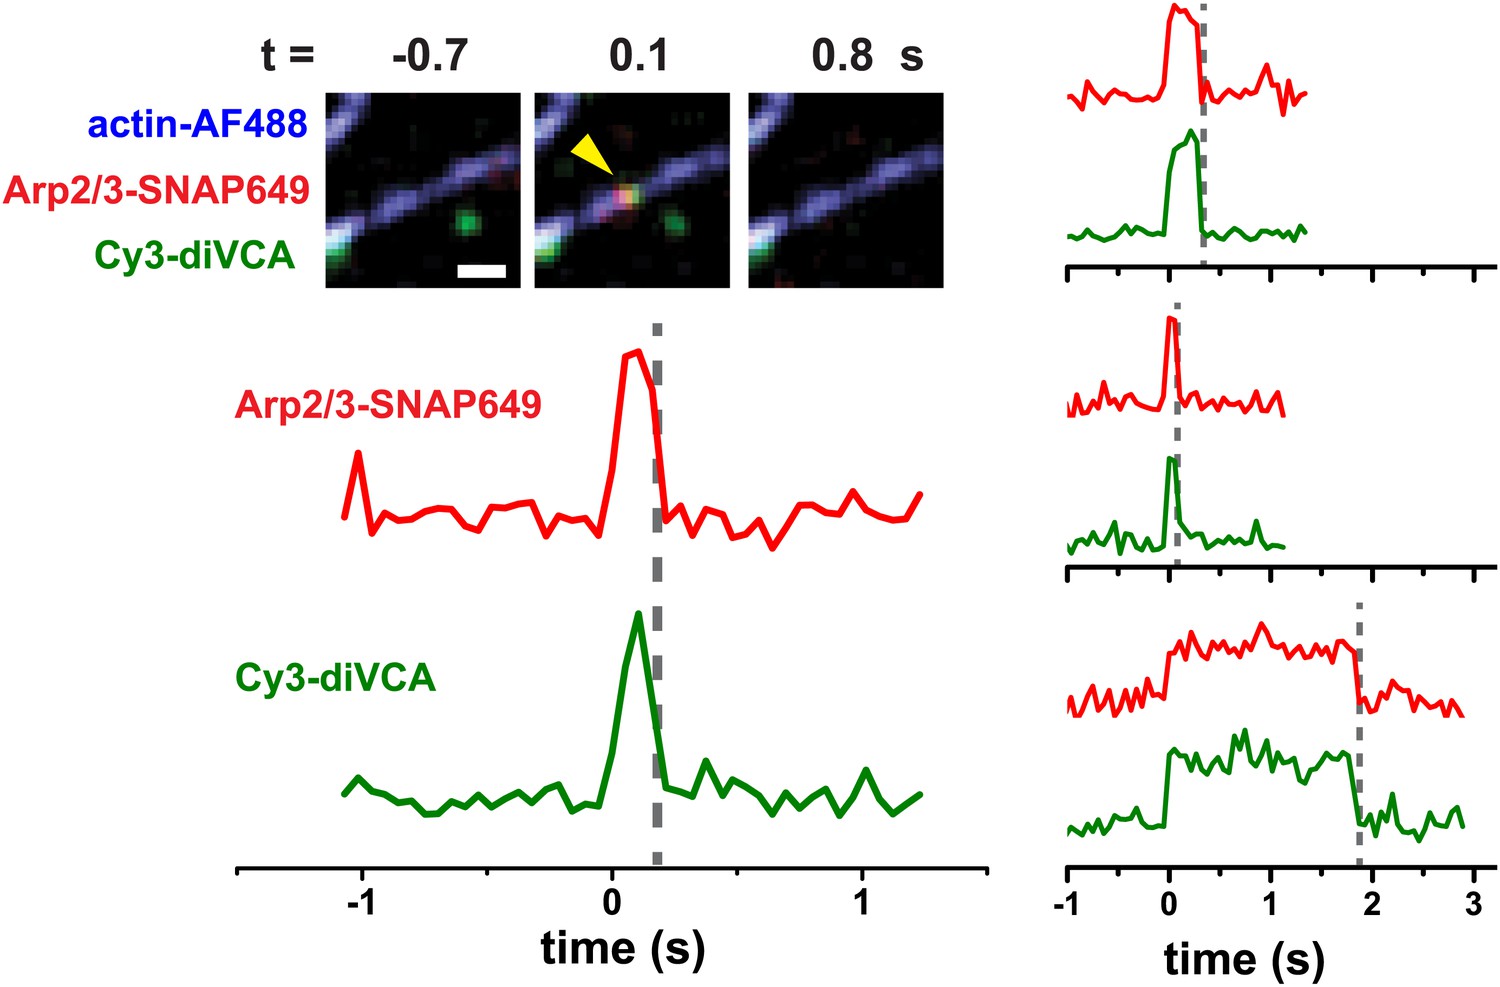
Rapid release of dimeric VCA from the nascent branch precedes nucleation.
(A) Design of an experiment to observe diVCA-activated branch nucleation by Arp2/3 complex on the sides of surface-immobilized actin filaments. Blue, green and red stars denote fluorescent dye labels AlexaFluor 488 (AF488), Cyanine 3 (Cy3), and Dy649 that are excited with blue, green, and red lasers, respectively. (B) Image sequence of the same microscope field of view taken at each of the three dye wavelengths (rows) at five selected time points (t; columns). Images record the colocalization of an individual Arp2/3 complex and diVCA molecule at t = 0 (yellow arrowhead) followed by nucleation and growth of a daughter filament at that location (red arrowhead). Solution contained 5 nM Cy3-diVCA, 5 nM SNAP-tagged Arp2/3 complex labeled with Dy649 (Arp2/3-SNAP649), and 1 µM actin, 10% AF488-labeled. Bar: 1 μm. See Video 1. (C) Recordings of daughter filament length and branch site fluorescence intensities from the nucleation event in B. Arrow marks the time of daughter filament nucleation estimated by extrapolating the daughter length fit line to zero length (Smith et al., 2013). Plot at bottom is a magnified view showing that Arp2/3 complex and diVCA labels appear simultaneously (t = 0) followed by rapid release of diVCA (t = 0.2 s). (D) Cumulative lifetime distributions of Arp2/3 complex and diVCA on filament sides after binding of an Arp2/3-diVCA complex to the filament (N = 752). Smooth lines indicate two- (diVCA) or three-exponential (Arp2/3 complex) fits yielding the indicated fit parameters (‘Materials and methods’). Main plot shows the data for time <10 s; inset shows the full distribution with the exception of one outlier. (E) Comparison of the time (±S.E.) of daughter filament initiation with the time of diVCA release from the nascent branch in individual branch nucleation events by diVCA-Arp2/3 complexes.
Figure 2—figure supplement 1
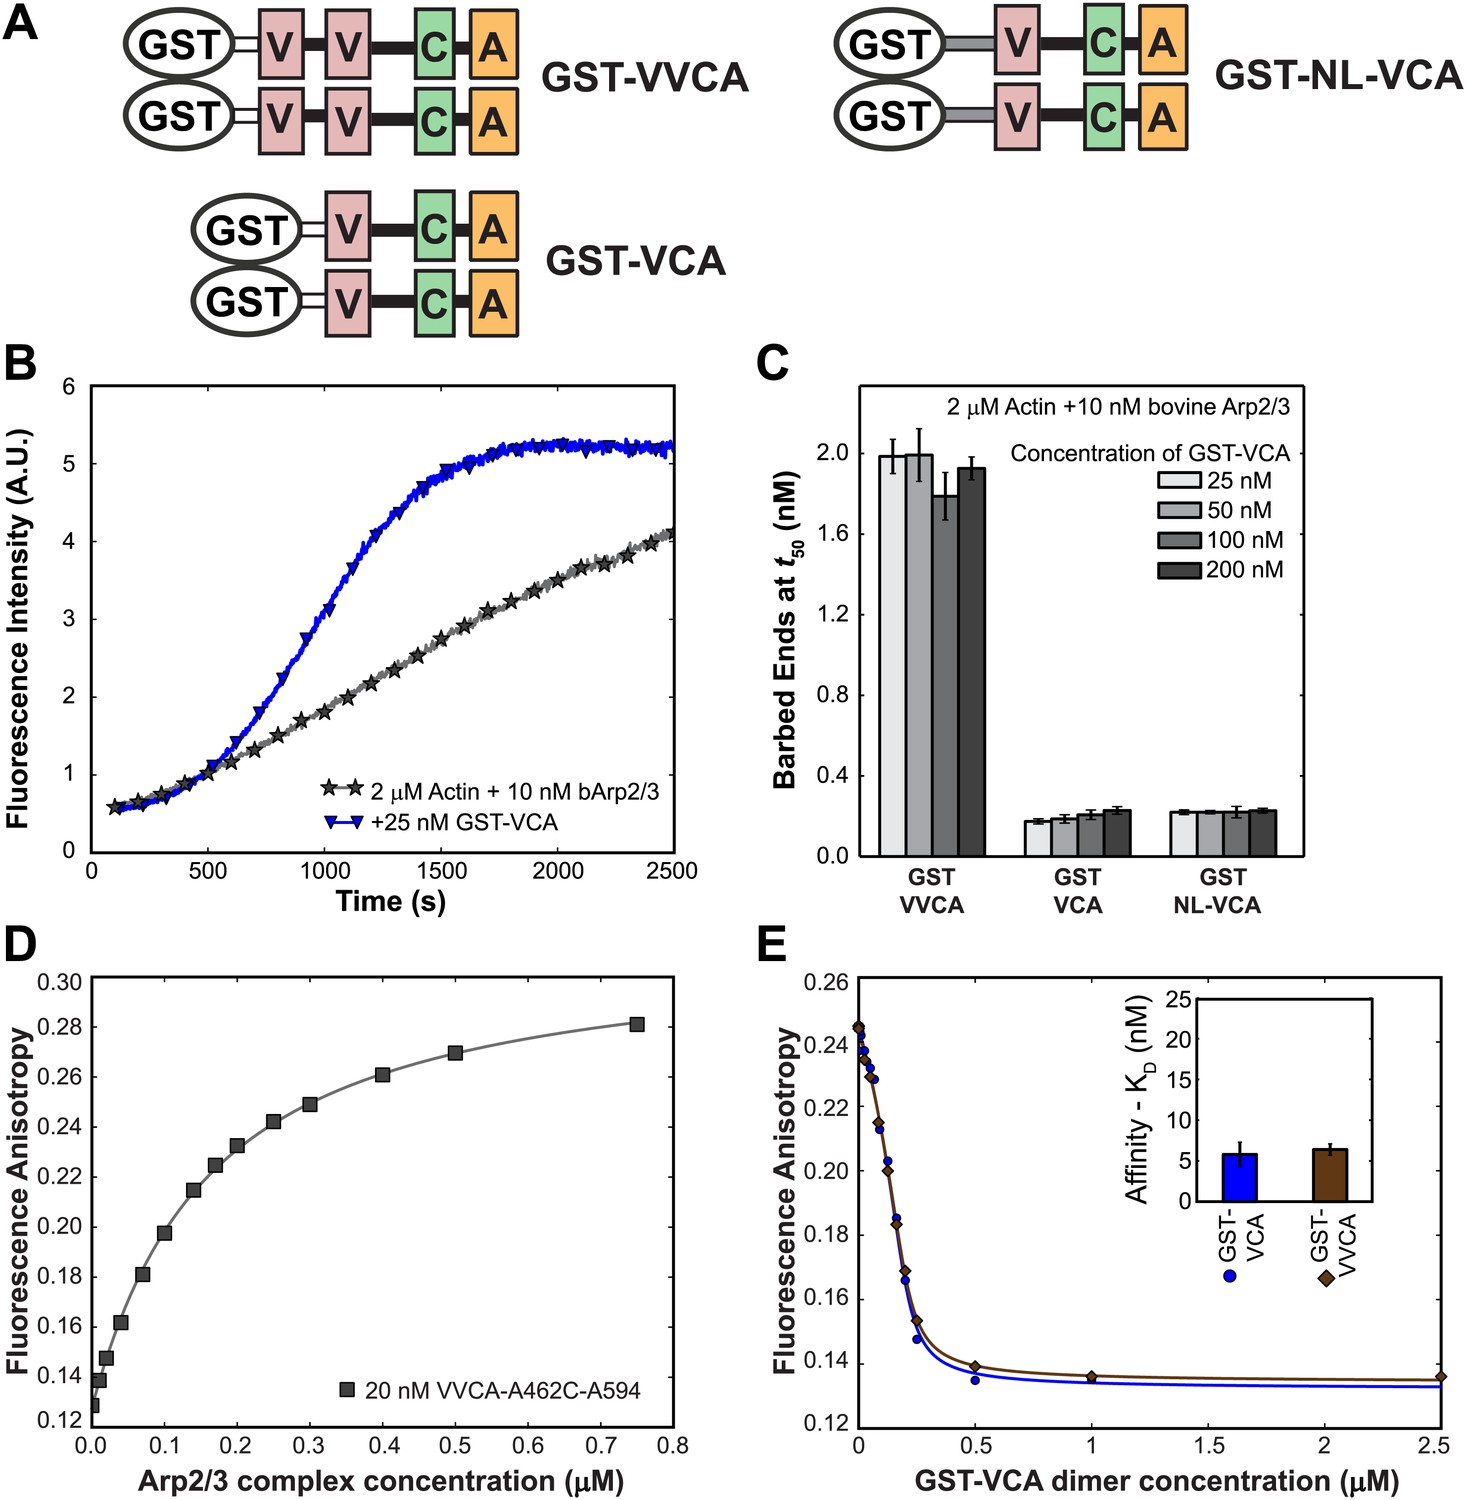
N-WASP VCA dimers bind tightly to Arp2/3 complex and stimulate its actin nucleation activity.
(A) Schematic of Glutathione-S-transferase (GST) fusions with N-WASP VCA-containing domains. N-terminal GST-fusions, which are naturally tight dimers, were made to VVCA (N-WASP residues 393–505), VCA (residues 432–505), and NL-VCA (NL [gray] is a sequence, residues 420-–430, found N-terminal to the human WASP VCA). (B) GST-VCA stimulates actin polymerization by Arp2/3 complex. Records indicate pyrene actin fluorescence increase due to filament polymerization 2 µM actin, 10% pyrene-labeled and bovine Arp2/3 complex, with or without GST-VCA. (C) GST-VVCA is more active at saturation than is GST-VCA. Bars indicate the number (±S.E.) of actin filament barbed ends present at the midpoint of polymerization assays like those shown in B. The concentration series show that stimulation by all constructs saturates at or below 25 nM and that dimer with two V domains per subunit (GST-VVCA) is more active that the single V domain construct (GST-VCA) even when an extended linker is incorporated into the latter (GST-NL-VCA). (D) A dye-labeled, single cysteine mutant N-WASP VVCA-A462C-AF594 binds to bovine Arp2/3 complex, as determined by fluorescence anisotropy (points). Fit to a direct binding isotherm yields KD = 150 ± 5 nM (68% C.I.). (E) Binding of GST-VVCA and GST-VCA to bovine Arp2/3 complex (200 nM). Points indicate interference with binding of VVCA-A462C-AF594 in a fluorescence anisotropy assay like that in D caused by addition of the indicated amount of unlabeled competitor GST-VCA or GST-VVCA. Fits to a competition-binding isotherm (lines) yield the dissociation equilibrium constants (±S.E.) shown in the inset.
Figure 2—figure supplement 2
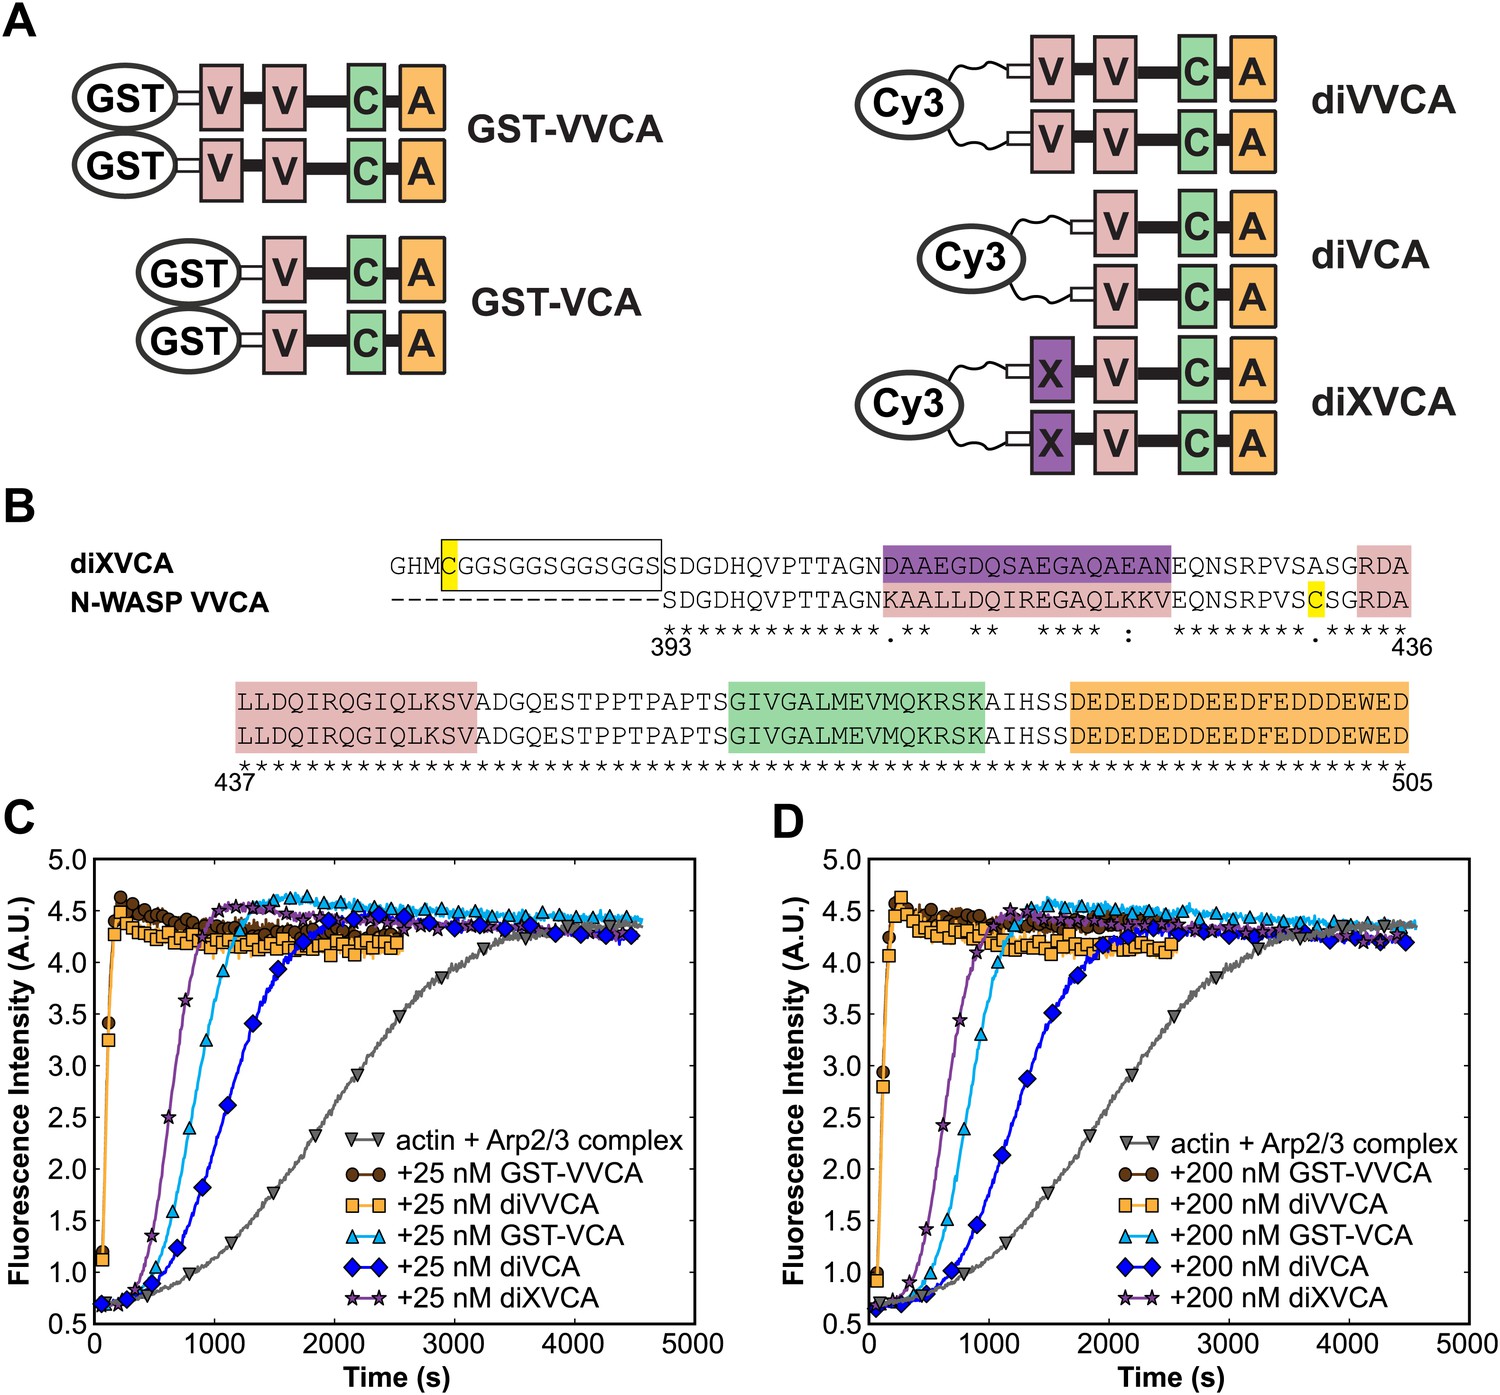
VCA dimers crosslinked through Cy3 stimulate Arp2/3 to a similar extent as GST-VCA dimers.
(A) Schematics of N-WASP VVCA and VCA dimers made via fusion to GST (as in Figure 2—figure supplement 1) or by covalent crosslinking of single-cysteine mutant subunits with a bis-maleimide Cy3. The diXVCA material is similar to diVVCA but has the first V domain mutated at several sites to reduce binding to actin. (B) Sequence alignment of the diXVCA construct with wild-type N-WASP VVCA (residues 393–505 of human N-WASP). White rectangle, C(GGS)4 linker; X, V, C, and A domains are indicated in the same colors as in A. Cys residues are highlighted; the C431A mutation was made so that the XVCA peptide has only a single cys to react with the Cy3 bis-maleimide crosslinker. (C and D) Pyrene-actin fluorescence records (as in Figure 2—figure supplement 1B) indicating rates of actin filament polymerization in the presence of 10 nM yeast Arp2/3 complex and 2 μM rabbit muscle actin supplemented with 25 nM (C) or 200 nM (D) of the indicated VCA dimers. The records show that diXVCA is of somewhat higher nucleation activity (maximum slope) than diVCA, but the insertion of the X domain sequence does not increase the activity to the levels seen for diVVCA. Thus, the length and nature of the linkage between the two VCA segments in the dimer may have a subtle effect on the activity, but is not the origin of large difference in activity between diVCA and diVVCA. This reduced activity of the diVCA construct, together with the significant basal branch nucleation activity of S. cerevisiae Arp2/3 complex in the absence of WASP proteins (Wen and Rubenstein, 2005; Smith et al., 2013) likely contribute to the modest (∼twofold; see text) activation of branch formation by di-VCA we observe.
Figure 2—figure supplement 3
Arp2/3 complex and diVCA usually bind to and release from filaments as a unit when no daughter filament is formed.
Left: Merged images (Figure 2B) and fluorescence intensity records (Figure 2C) showing an example of simultaneous binding (t = 0) and release (dashed vertical line) of diVCA and Arp2/3 complex on an actin filament. Right: Three more examples. Experimental conditions were the same as in Figure 2. Bar: 1 µm.
Figure 2—figure supplement 4
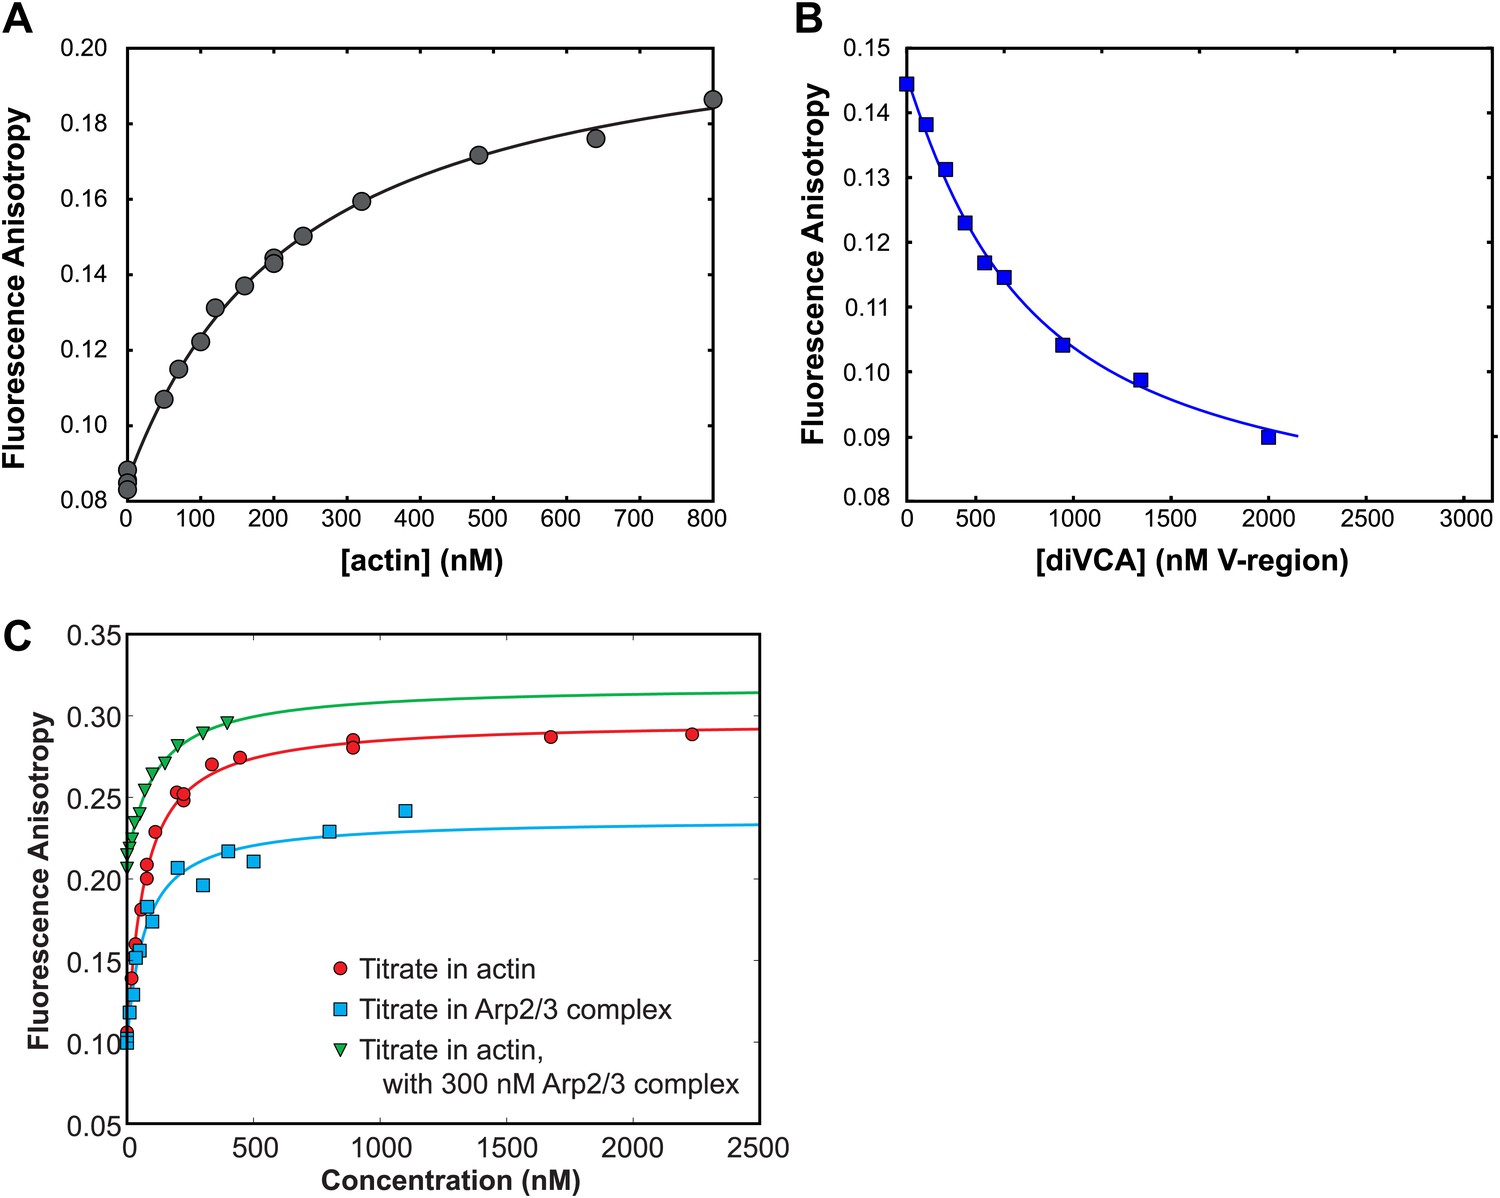
Association with Arp2/3 complex does not affect binding of VCA to actin.
(A) Binding, measured using fluorescence anisotropy (points), during titration of rabbit muscle actin into 20 nM VCA-AF488. Fit to a binding isotherm (line) yielded KD 220 ± 10 (68% C.I.) nM. (B) Competition binding experiment to determine the KD of diVCA for actin. Fluorescence anisotropy of 20 nM VCA-AF488 was monitored in the presence of 150 nM rabbit muscle actin, and the indicated concentration of diVCA. Fit to a competition binding isotherm (line) yielded KD 340 ± 60 nM (see text). (C) Binding affinity of non-polymerizable actin (‘Materials and methods’) for VCA is minimally perturbed by the presence of yeast Arp2/3 complex. Fluorescence anisotropy of 10 nM of VCA-AF594 was measured in the presence of increasing concentrations of non-polymerizable actin (red circles), yeast Arp2/3 complex (blue squares), or non-polymerizable actin in the presence of 300 nM yeast Arp2/3 complex (green inverted triangles). Fits to single site binding isotherms (lines) yielded KD 70 ± 10 nM, 65 ± 4 nM, and 105 nM ± 15 nM, respectively. Changes in anisotropy are expected to be dominated by the binding of actin, as the fluorophore location is proximal to the N-terminus of the V domain, and away from the Arp2/3 complex binding motifs. Increased fluorescence anisotropy in the presence of both Arp2/3 complex and actin indicates that both species can bind simultaneously.
Figure 3
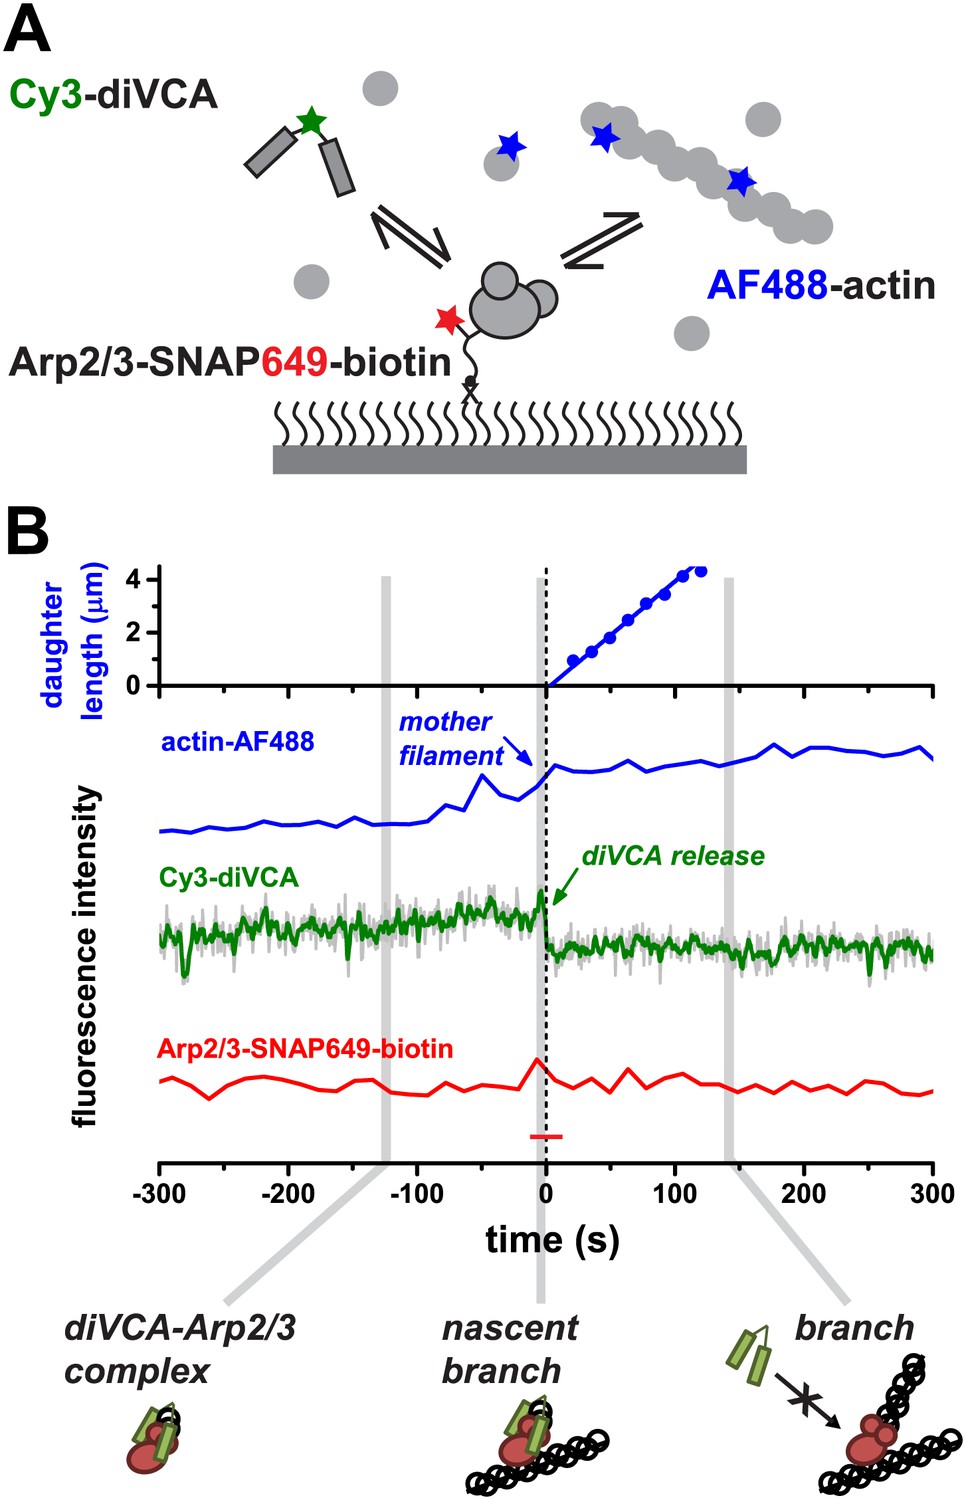
VCA dimers form long-lived complexes with Arp2/3 complex before filament binding but not after branch formation.
(A) Experimental design to observe diVCA binding and nucleation of actin filaments on immobilized Arp2/3 complexes. Arp2/3-SNAP was tethered to the slide surface via a bi-functional SNAP substrate that incorporated both a Dy649 dye and a biotin-terminated PEG chain; we monitored binding of fluorescently labeled diVCA and actin filaments from solution. (B) Example record showing the length of a nucleated daughter filament and the fluorescence intensity from actin (blue) and diVCA (green) at an individual tethered Arp2/3 complex molecule. The solution contained 1 μM actin (10% AF488 labeled) and Cy3-diVCA (2 nM). Fluorescence from the tethered Arp2/3 complex (red trace) remained steady and above background (red dash) throughout. Schematics show the inferred complexes present at the indicated times. Time zero is the time of diVCA release.
Figure 4 with 2 supplements
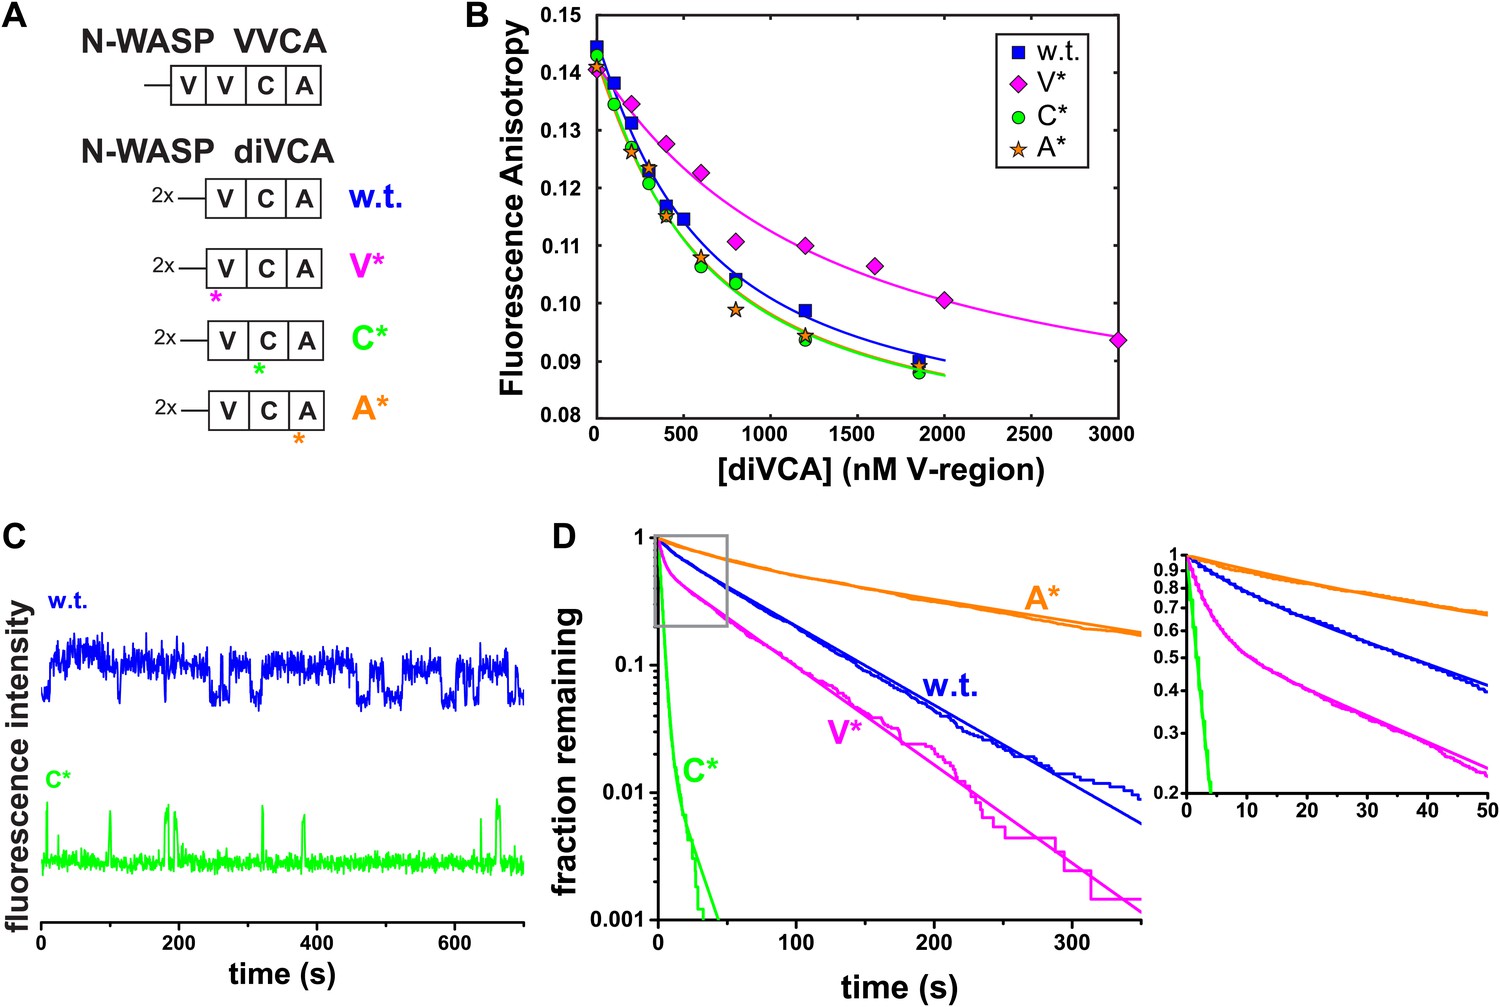
diVCA mutations alter the stability of Arp2/3 complex-diVCA-actin monomer assemblies.
(A) Arrangement of V, C, and A domains in native N-WASP and in the diVCA constructs used in this study (w.t. is wild-type). Asterisks mark the domains bearing targeted mutations (substitution of one or two residues, or a three-residue deletion; Figure 4—figure supplement 1A) in the three mutant constructs. (B) Fluorescence anisotropy detected binding of AF488-labeled N-WASP VCA with rabbit muscle actin, in the presence of competitor wild-type (same data as in Figure 2—figure supplement 4B) or mutant Cy3-diVCA constructs (symbols). Data were fit (lines) with competition binding isotherms incorporating the coupled equilibria (‘Materials and methods’) yielding KD values 340 ± 60 (S.E.) nM for wild-type diVCA, 660 ± 80 nM for diVCA-V*, 260 ± 40 nM for diVCA-C*, and 250 ± 40 nM for diVCA-A*. (C) Example Cy3-diVCA fluorescence intensity records recorded on individual tethered Arp2/3 complexes (Figure 3): Cy3-diVCA wild-type or C* mutant (0.5 nM) molecules binding and dissociating in the presence of 1 μM actin monomers but no filament. (D) Cumulative lifetime distributions of diVCA-Arp2/3 complexes in the presence of monomeric actin observed in records like those in B. Smooth lines are biexponential fits (Table 1). Inset is a magnified view of the indicated data range.
Figure 4—figure supplement 1
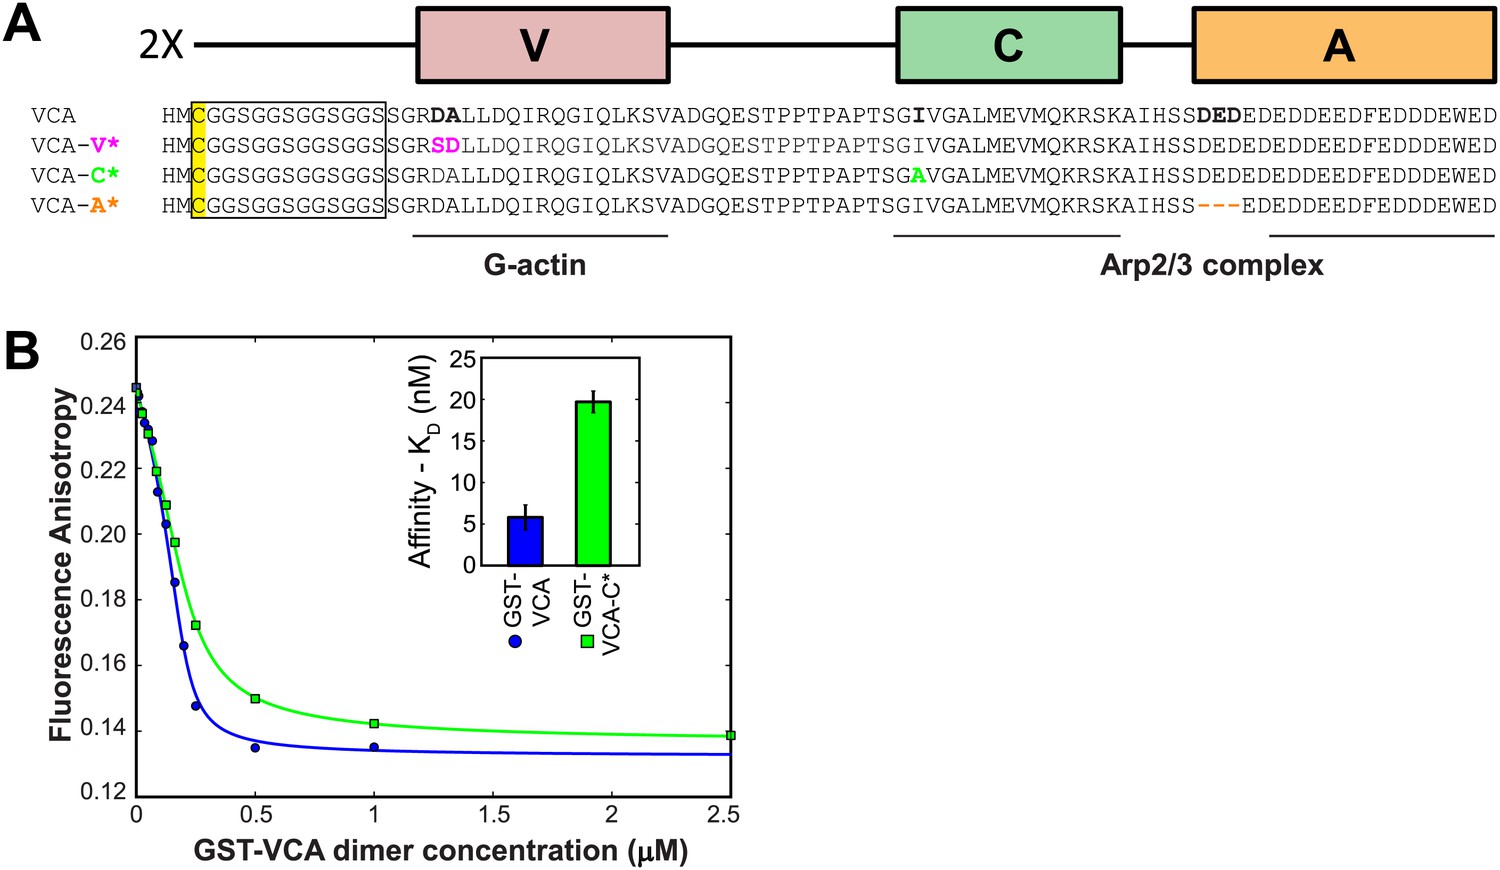
Design of the diVCA mutant constructs and characterization of Arp2/3 complex binding by the diVCA-C* mutant.
(A) Sequence alignments showing the substitution (colored residues) and deletion (dash) mutations in the diVCA mutant constructs. Lines mark the regions of VCA that interact with G-actin and with Arp2/3 complex. The C(GGS)4 linker and the cys residue used to react with Cy3 bis-maleimide are marked. (B) Binding of GST-VCA and GST-VCA-C* to bovine Arp2/3 complex assessed by a competition assay. Conditions and analysis as in Figure 2—figure supplement 1E; blue curve is repeated from that panel. The fits reveal KD values (68% C.I.) indicating that GST-VCA-C* has a ∼fourfold weaker affinity for Arp2/3 complex than does GST-VCA (inset).
Figure 4—figure supplement 2
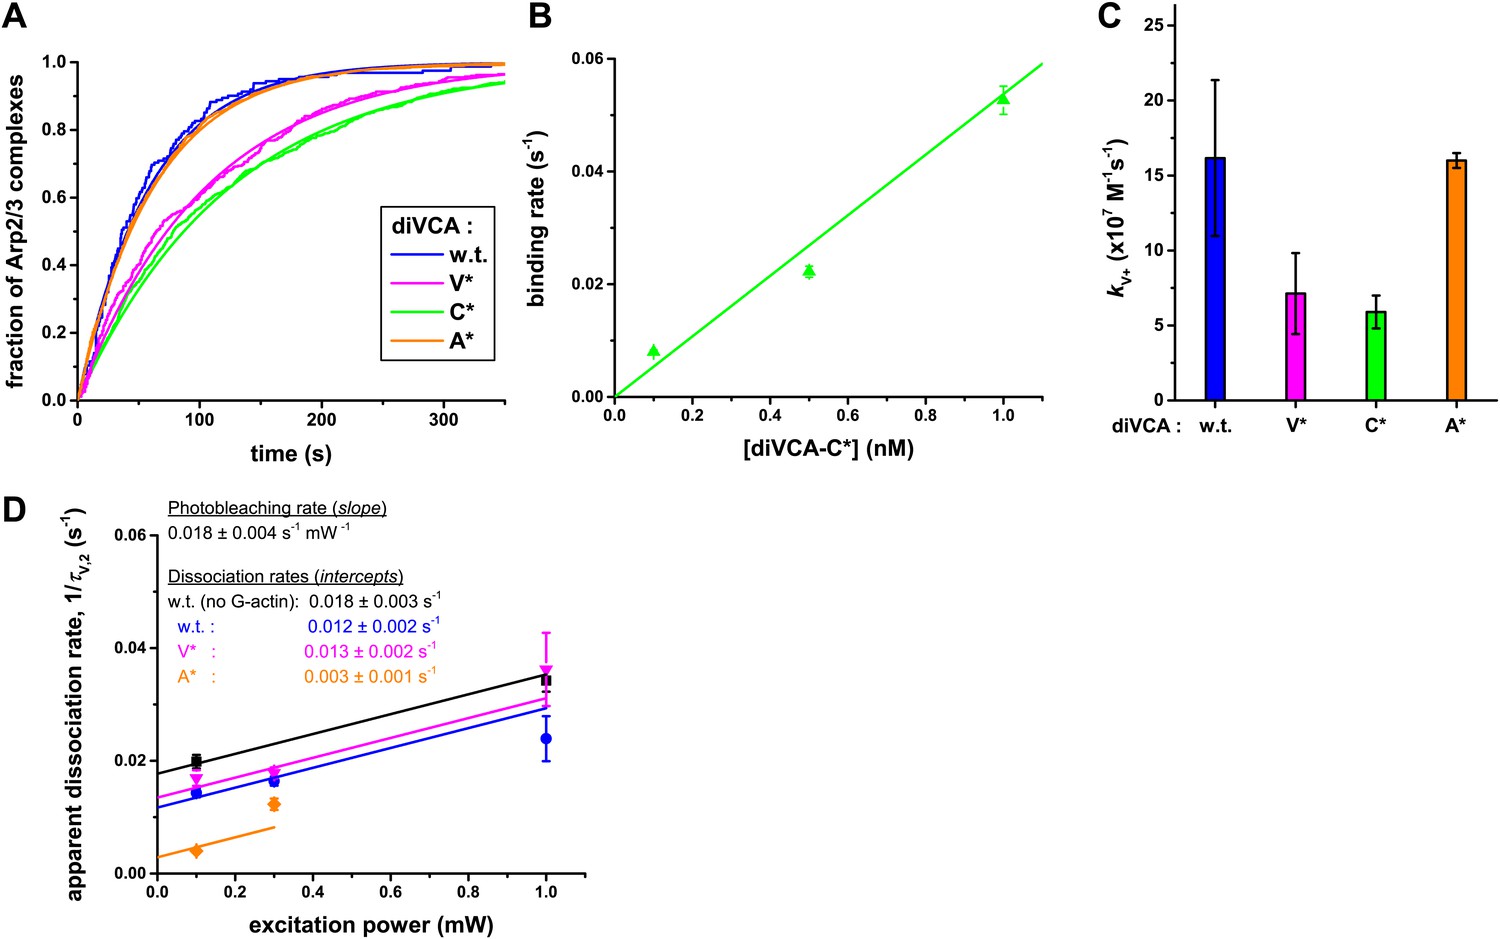
Single molecule analysis of wild-type and mutant diVCA binding to and dissociating from tethered Arp2/3 complex.
(A)–(C) Binding rate measurements. (A) Example curves from single experiments showing the cumulative distribution of the lifetimes of Arp2/3 complexes unoccupied by diVCA constructs. diVCA constructs were present at 0.1 nM; other conditions as in Figure 4D. Fitting to a single exponential function (smooth curves) yielded binding rates. (B) Measured binding rates (±S.E.) were proportional to diVCA-C* concentration. (C) Second order binding rate constants, kV+ (±S.E.), calculated from experiments like those in A (Table 1) at diVCA construct concentrations in the range 0.1–1.0 nM. (D) The effect of photobleaching on the slow component (τV,2; Table 1) of the lifetime distributions for association of diVCA constructs with tethered Arp2/3 complex (Figure 4D). Experiments were performed over a range of excitation green laser powers and the dependence of the observed dissociation rate (1/τV,2; ±S.E.) on power was globally fit to quantify the photobleaching rate (slope) and the photobleaching-corrected dissociation rates for each diVCA construct (intercepts). The τV,1 and τV,2 values reported in Table 1 were taken from experiments at the weakest laser powers and were equal within experimental error to the values obtained after photobleaching correction.
Figure 5 with 3 supplements
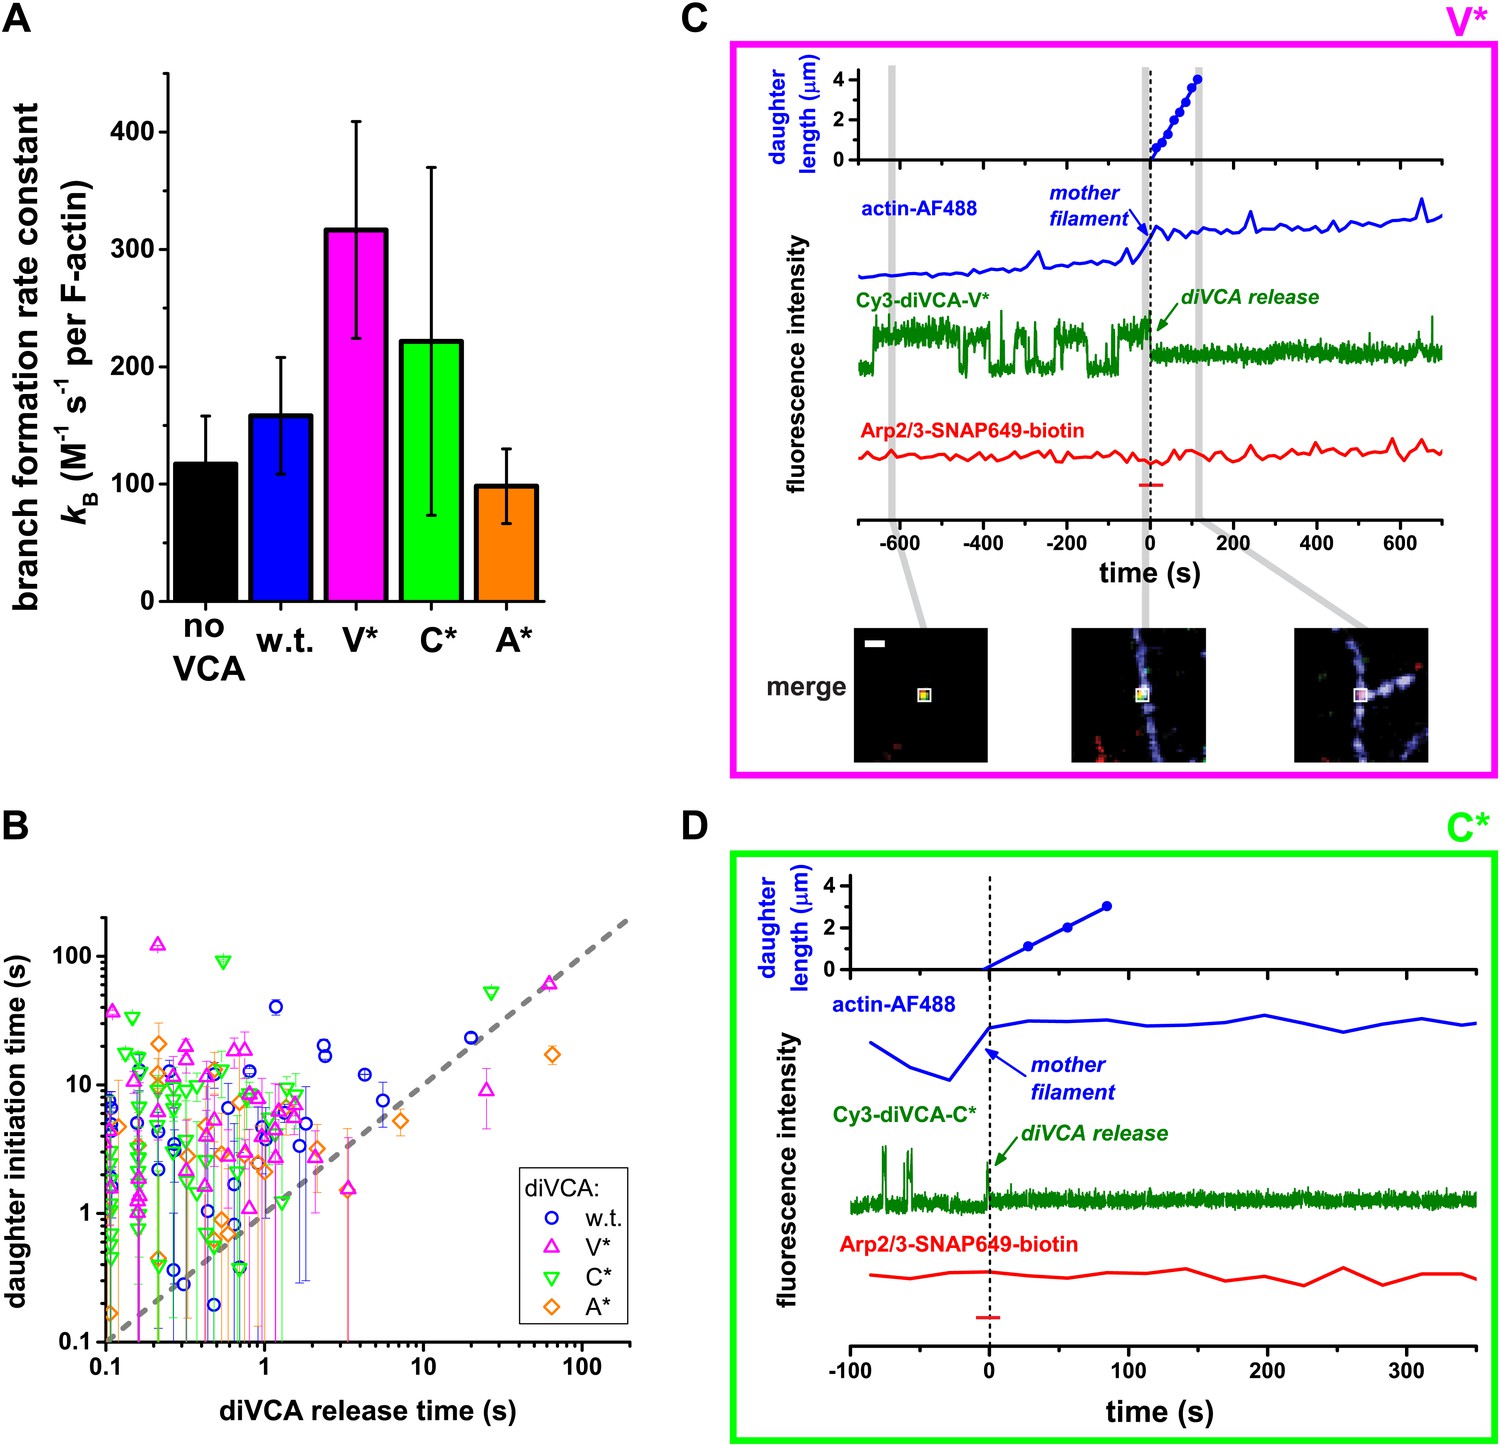
diVCA constructs differ in the rate but not the pathway of activity in stimulating branch formation.
(A) Rate (±S.E.) of initiation of daughter filament growth by Arp2/3 complex in the absence or presence of diVCA wild-type and mutant constructs. kB, the second order rate constant for the appearance of branches on existing filaments, per subunit, was calculated from observations of branch formation on existing filaments, as in Figure 2 (‘Materials and methods’). (B) Comparison of the time (±S.E.) of daughter filament initiation with the time of diVCA release from the nascent branch for wild-type (data replotted from Figure 2E) and mutant constructs (Figure 5—figure supplement 3). (C and D) Example records showing the length of a nucleated daughter filament and the fluorescence intensity from actin, diVCA, and individual tethered Arp2/3 complex molecules, as in Figure 3. Mutant Cy3-diVCA was 0.5 nM V* in C, or 1.0 nM C* in D. The merged fluorescence images in C were recorded at the indicated times and the white squares mark the area from which the fluorescence was integrated to produce the intensity records. Scale bar, 1 µm. Both mutants bound readily to tethered Arp2/3 prior to but not after branch formation.
Figure 5—figure supplement 1
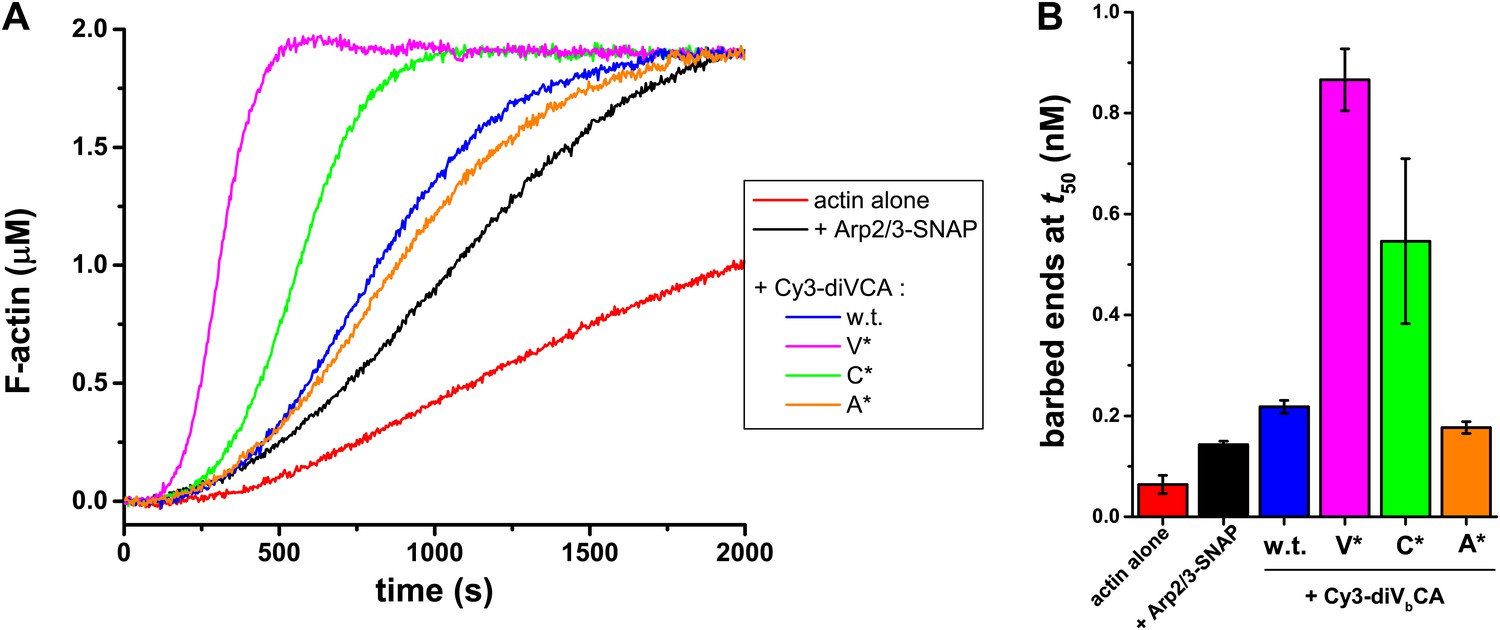
Analysis of diVCA mutant activities in bulk actin polymerization assays.
(A) Stimulation of actin filament assembly by 10 nM Arp2/3-SNAP complex activated by 25 nM wild-type or mutant diVCA constructs. Plots show records of pyrene fluorescence in assays containing 2 µM actin, 5% pyrene-labeled. (B) Actin nucleation activities from the data in A and a replicate experiment (mean ± S.D.; ‘Materials and methods’).
Figure 5—figure supplement 2
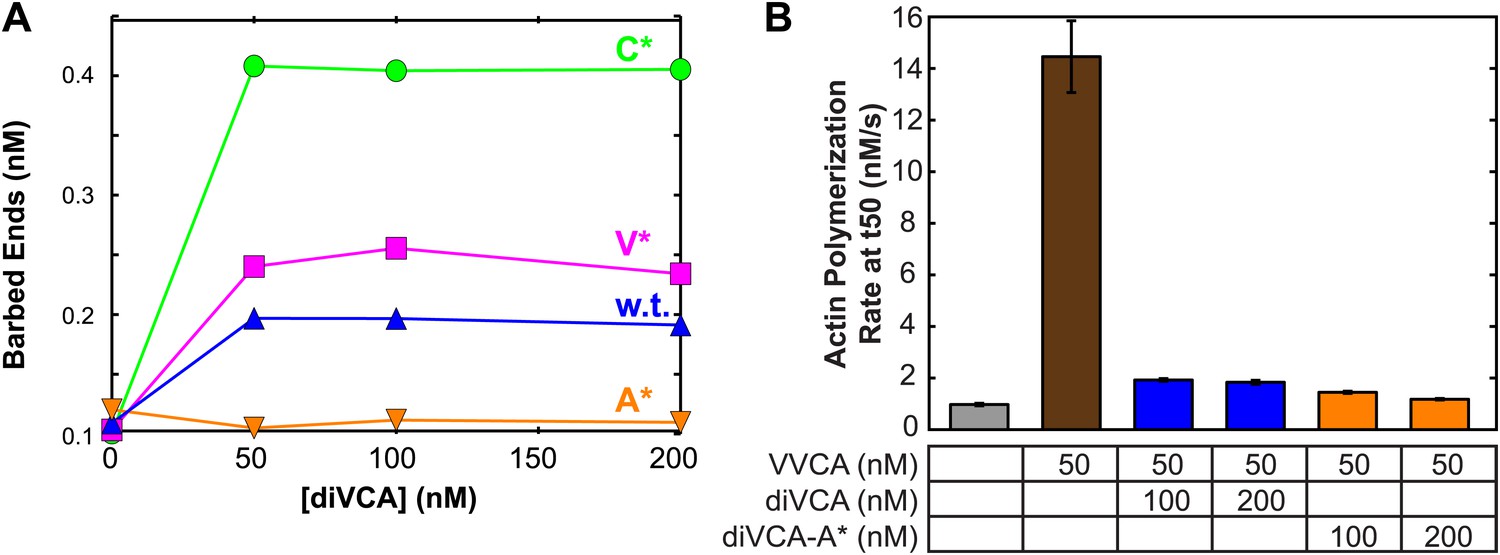
Saturation of stimulation of Arp2/3 complex actin nucleation activity by diVCA constructs.
(A) Actin nucleation activity measured as in Figure 5—figure supplement 1 with 10 nM yeast Arp2/3 complex and specified diVCA construct concentrations. Activity saturates above 50 nM for three constructs; for diVCA-A* activity is too low to detect saturation in this assay. (B) Saturation of diVCA and diVCA-A* in competing with stimulation of actin nucleation by VVCA. Mean values from 3–4 replicate measurements. Error bars indicate S.E.
Figure 5—figure supplement 3
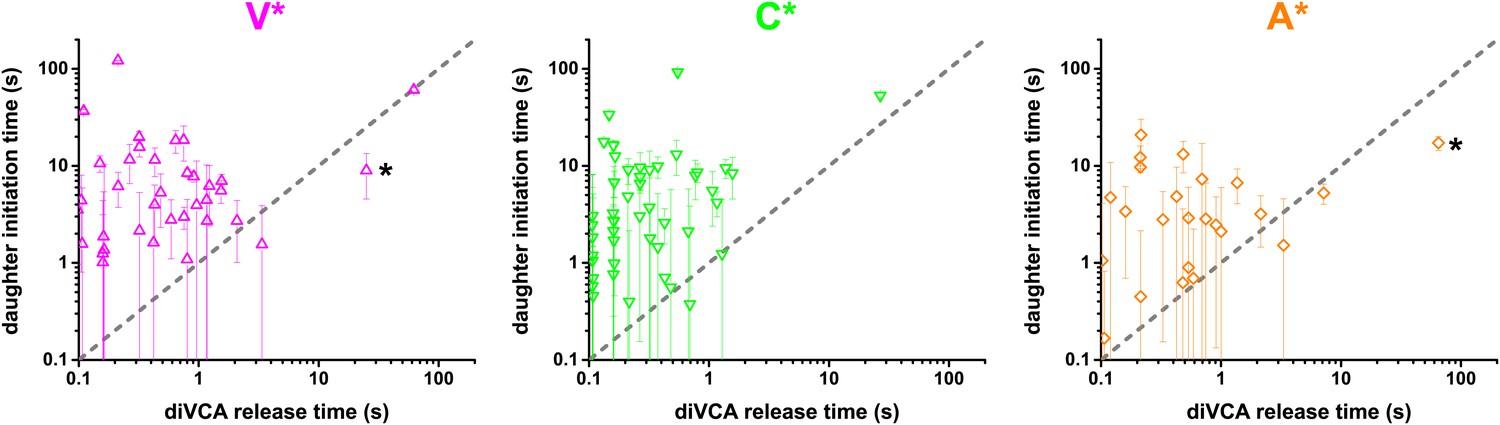
Relationship relation between diVCA release from the nascent branch and daughter filament initiation for each of the three mutant diVCA constructs.
These panels show the data presented in Figure 5B replotted separately to make the error bars more visible. V*, C*, and A* data sets contain 41, 49, and 27 observations, respectively, where the measured daughter initiation time was >0.1 s. Asterisks mark two observations in which daughter filament initiation occurred significantly before disappearance of the diVCA fluorescent spot. We speculate that in these rare events the diVCA molecule may have become irreversibly crosslinked at or near the branch junction and that spot disappearance is caused by dye photobleaching, not by diVCA release. Consistent with this explanation, both of these outliers show uncharacteristically long diVCA release times.
Figure 6 with 1 supplement
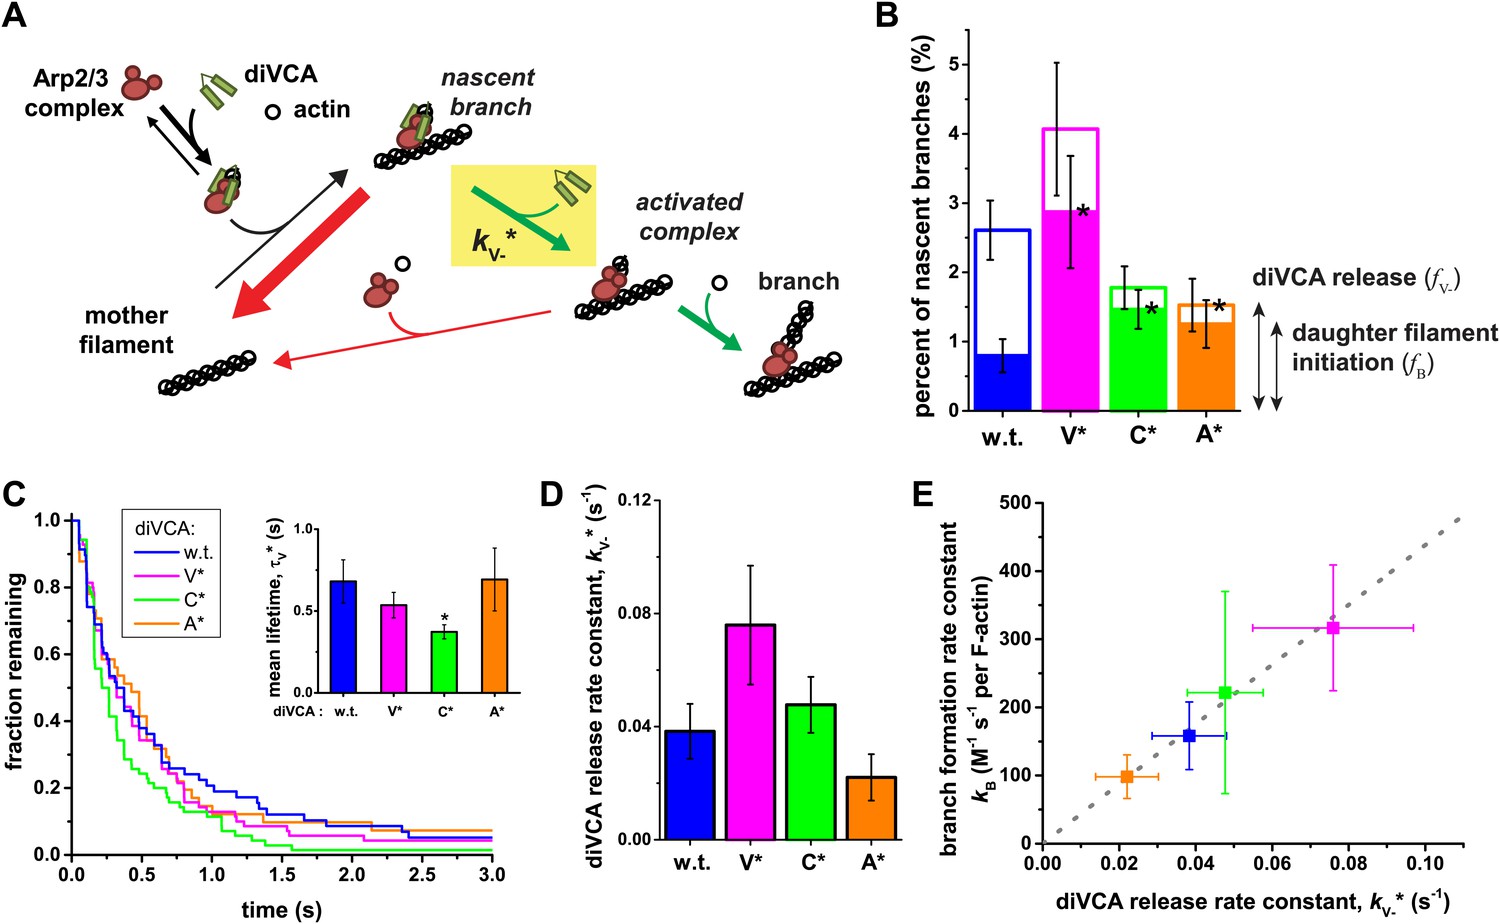
Release of diVCA from nascent branches is rare and limits the rate of daughter nucleation.
(A) Schematic mechanism of diVCA stimulated branch formation (see text). The key activation step, release of diVCA from the nascent branch, is highlighted. (B) Classification of nascent branch fates observed in single molecule experiments (e.g., Figure 2B and C; Figure 2—figure supplement 3). Overall bar height indicates the fraction (±S.E.) of nascent branches that release diVCA leaving behind a filament-bound Arp2/3 complex. Filled bar height shows the fraction (±S.E.) of nascent branches that nucleate a daughter filament. (C) Cumulative lifetime distributions of diVCA molecules on the subset of filament-bound Arp2/3 complexes observed to produce branches in single-molecule experiments. Inset: mean lifetimes (±S.E.). (D) Rate constants (±S.E.) for diVCA dissociation from the nascent branch, calculated from the mean lifetimes in C and release efficiencies in B. (E) Correlation between the rate constant of diVCA-stimulated Arp2/3 complex branch nucleation (from Figure 5A) and the rate constant of diVCA release from the nascent branch (from D). Correlation coefficient r = 0.9928 is unlikely to arise by coincidence (p=0.0045). Dotted line is a linear fit constrained to pass through the origin.
Figure 6—figure supplement 1
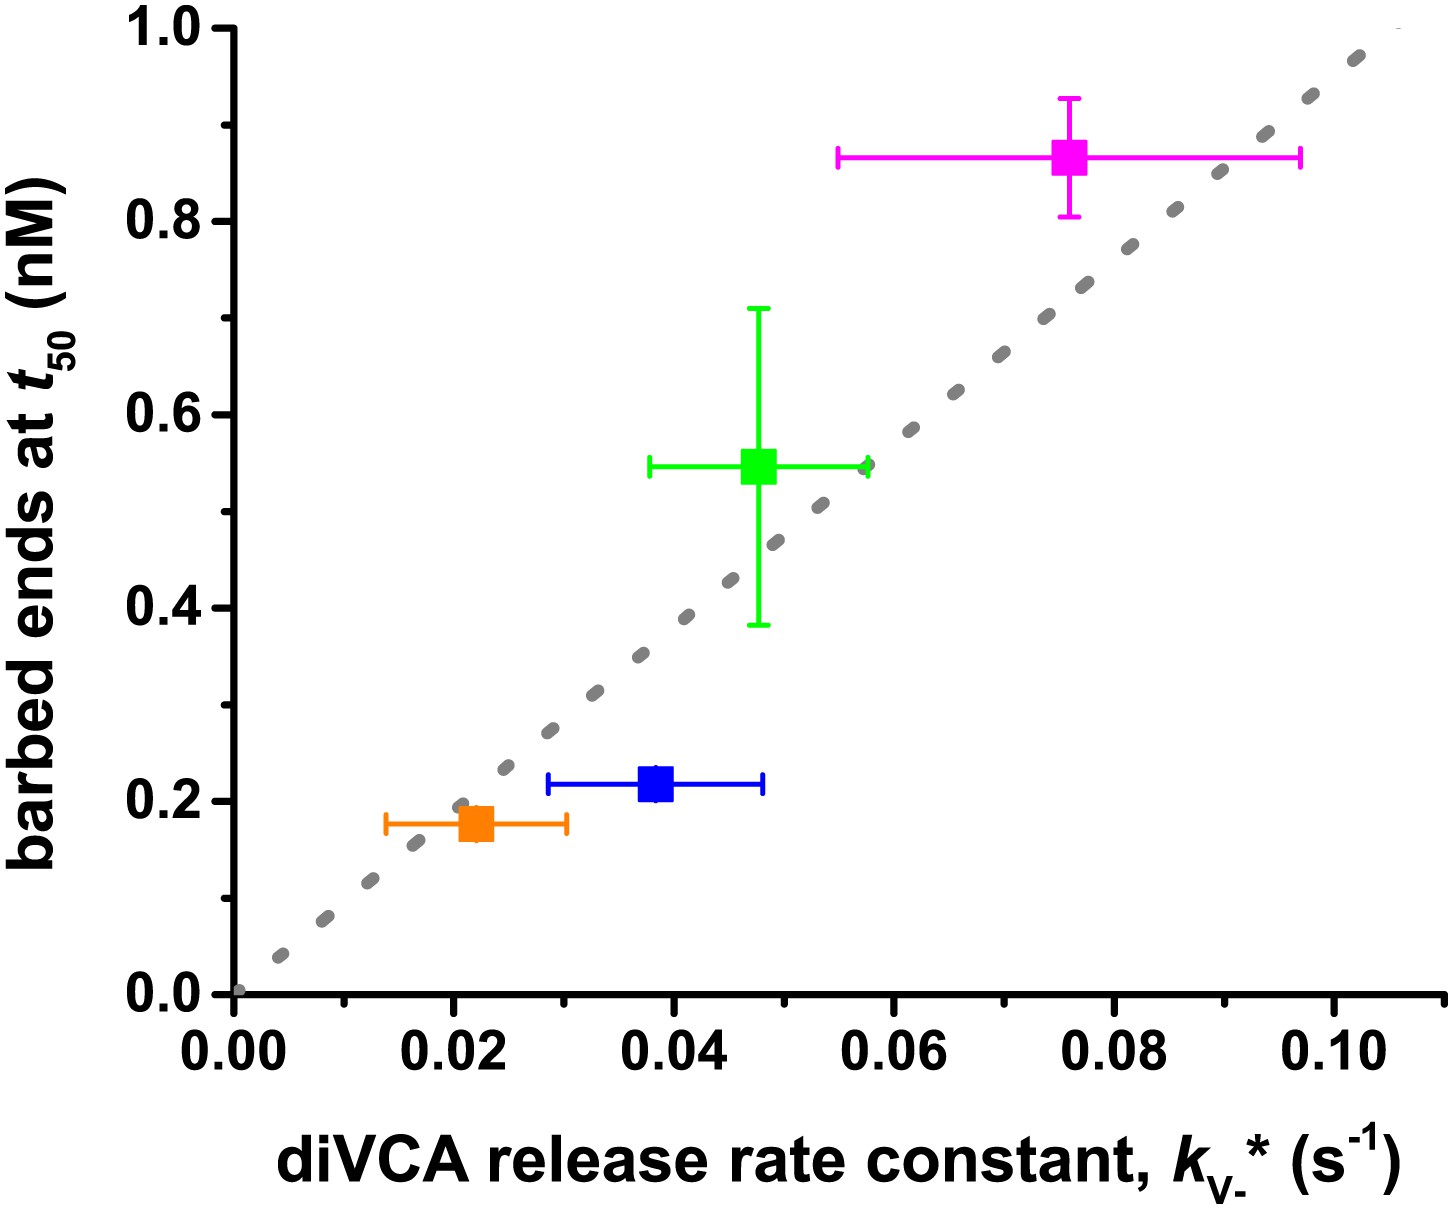
Correlation between the actin nucleation activity of Arp2/3 activated by wild-type and mutant diVCA constructs (from Figure 5—figure supplement 1B) and the rate constant of diVCA release from the nascent branch (from Figure 4F).
Dotted line is a linear fit constrained to pass through the origin. The correlation coefficient r = 0.9598 is unlikely to be coincidental (p=0.027; ‘Materials and methods’). Error bars indicate S.E.s.
Figure 7
Model of WASP-Arp2/3 complex stimulated actin branch formation at cell membranes (see text).
https://doi.org/10.7554/eLife.01008.021Videos
Video 1
The diVCA-stimulated actin branch formation event shown in Figure 2B–C.
Red: Arp2/3-SNAP649 (5 nM in solution); green: Cy3-diVCA (5 nM); blue: actin-AF488 (1 µM, 10% labeled). Arp2/3 complex and diVCA images were recorded every 0.05 s; actin images were recorded every ∼12 s. Playback rate: real time. Bar: 1 μm. Many diVCA-Arp2/3 complexes are observed to transiently associate with actin filaments. One such nascent branch complex (yellow arrowhead) releases diVCA shortly after it appears, leaving Arp2/3 complex stably associated with the mother filament (red arrowhead), where it subsequently initiates daughter filament elongation.
Tables
Table 1
Colocalization kinetics and activities of diVCA and Arp2/3 complex
| no VCA | diVCA w.t. | diVCA V* | diVCA C* | diVCA A* | |
|---|---|---|---|---|---|
| Arp2/3 complex off filament (Figure 4D, Figure 4—figure supplement 2) | |||||
| N (groups) | 5 | 3 | 3 | 1 | |
| kV+ (107 M−1 s−1) | 16±5 (SEM) | 7±3 (SEM) | 6±1 (SEM) | 16±1 (SE) | |
| NV | 1528 | 957 | 1339 | 1262 | |
| τV1 (s) | 8±1 | 3.6±0.4 | 2.4±0.1 | 40±10 | |
| AV1 | 24±3% | 42±2% | 98±2% | 28±9% | |
| τV2 (s) | 61±3 | 56±3 | 14±6 | 250±30 | |
| Arp2/3 complex on filament (Figure 6B) | |||||
| NA | 715 | 877 | 407 | 1089 | 597 |
| kA+ (104 M−1 s−1) | 2.0±0.3 | 2.1±0.3 | 1.3±0.2 | 2±1 | 0.8±0.2 |
| fAV | 0.83±0.09 | 0.7±0.1 | 0.59±0.08 | 0.7±0.1 | |
| fV− | 0.026±0.004 | 0.041±0.009 | 0.018±0.003 | 0.015±0.004 | |
| fB | 0.006±0.002 | 0.008±0.002 | 0.029±0.008 | 0.015±0.003 | 0.013±0.003 |
| Arp2/3 complex at branch sites (Figure 5A, Figure 6C–E) | |||||
| NB | 57 | 69 | 69 | 40 | |
| τV* (s) | 0.7±0.1 | 0.54±0.08 | 0.37±0.04 | 0.7±0.2 | |
| kV* (s−1) | 0.04±0.01 | 0.08±0.02 | 0.05±0.01 | 0.022±0.008 | |
| kB (M−1 s−1) | 120±40 | 160±50 | 320±90 | 200±100 | 100±30 |
-
Parameter descriptions:
-
N = number of groups of observations used to calculate binding rate of diVCA to isolated Arp2/3 complexes.
-
kV+ = second order rate constant for diVCA binding to Arp2/3 complexes.
-
NV = number of observations of diVCA on isolated Arp2/3 complexes.
-
τV1 = first characteristic lifetime of diVCA on isolated Arp2/3 complexes.
-
AV1 = percent of diVCA that dissociate from Arp2/3 complexes with time constant τV1.
-
τV2 = second characteristic lifetime of diVCA on isolated Arp2/3 complexes.
-
NA = number of observations of Arp2/3 complexes on the sides of select filaments.
-
kA+ = second order rate constant for Arp2/3 complex binding filament sides (per filament subunit).
-
fAV = fraction of Arp2/3 complexes that bind filament sides coincident with diVCA.
-
fV- = fraction of diVCA-Arp2/3-filament complexes that release diVCA.
-
fB = fraction of diVCA-Arp2/3-filament complexes that nucleate a daughter filament.
-
NB = number of observations of branch formation from diVCA-Arp2/3-filament complexes.
-
τV* = mean lifetime of diVCA on nascent branches.
-
kV* = rate constant for diVCA release from the nascent branch.
-
kB = second order rate constant for branch formation (per mother filament subunit).
Download links
A two-part list of links to download the article, or parts of the article, in various formats.
Downloads (link to download the article as PDF)
Open citations (links to open the citations from this article in various online reference manager services)
Cite this article (links to download the citations from this article in formats compatible with various reference manager tools)
Three-color single molecule imaging shows WASP detachment from Arp2/3 complex triggers actin filament branch formation
eLife 2:e01008.
https://doi.org/10.7554/eLife.01008


