Bub3 reads phosphorylated MELT repeats to promote spindle assembly checkpoint signaling
- Max Planck Institute of Molecular Physiology, Germany
- IFOM—The FIRC Institute of Molecular Oncology, Italy
- University Duisburg-Essen, Germany
Figures
Figure 1 with 1 supplement
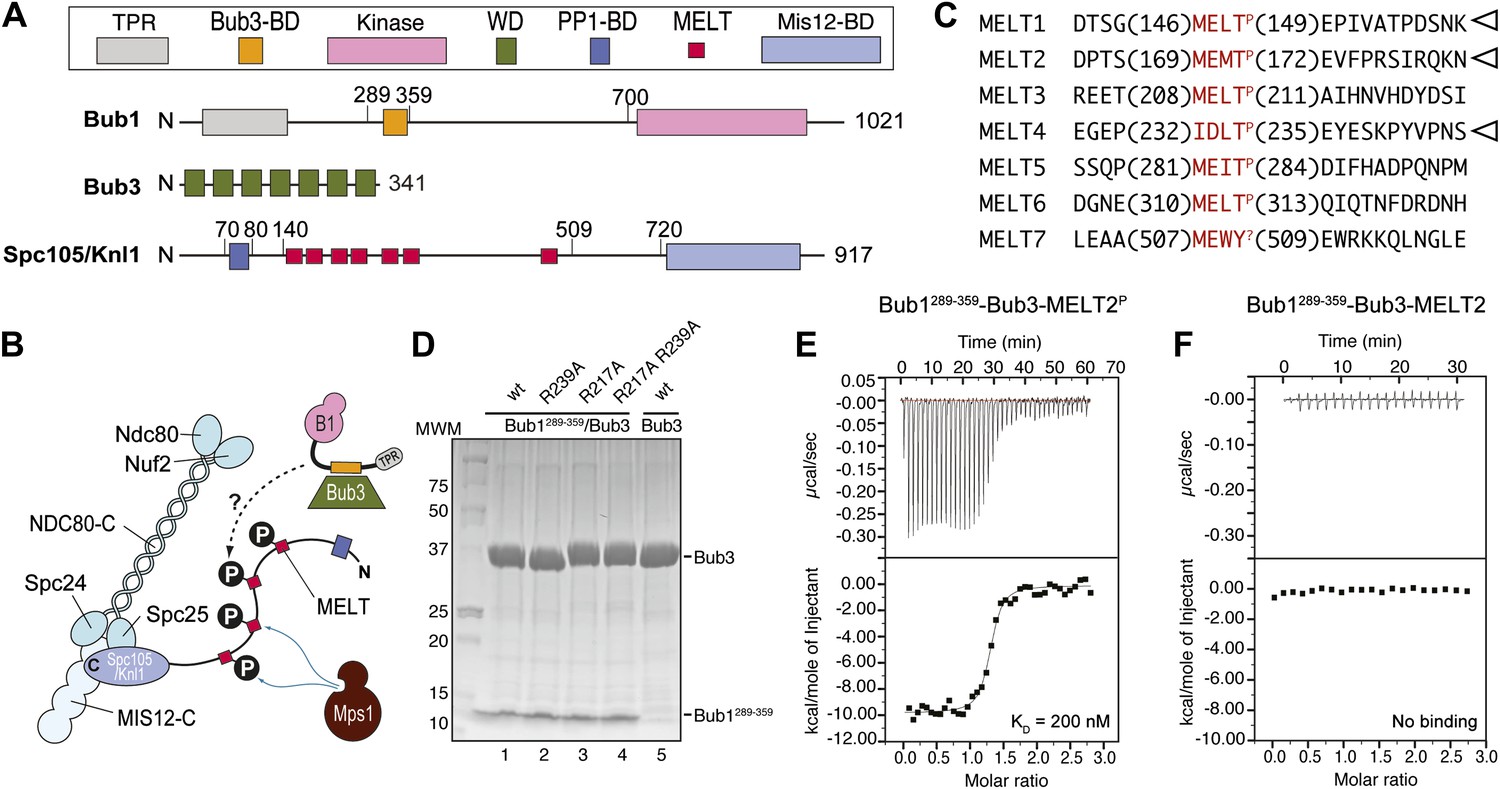
Reconstitution of the interaction of Bub1-Bub3 with MELTP motifs.
(A) Schematic description of the domain and motif organization of the main players discussed in this paper. (B) The KMN network (shown in different tones of blue) consists of the Ndc80 complex (NDC80-C), the Mis12 complex (MIS12-C, also known as MIND complex), and Spc105/Knl1 (which also associates with Ydr532cp/Zwint, not shown here). Mps1 phosphorylates the MELT repeats of Spc105/Knl1 to promote the recruitment of the Bub1–Bub3 complex. A Bub3-binding domain of Bub1 is shown in orange. (C) Sequence of MELT repeats in Spc105/Knl1 of S. cerevisiae. Arrowheads indicate MELT repeats previously shown to be phosphorylated by Mps1 in vitro (London et al., 2012). The MELT motifs are shown in red. (D) Purified Bub3, Bub1289–359–Bub3, and mutants thereof discussed in the text were separated by SDS-PAGE after purification. (E) Isothermal titration calorimetry (ITC) analysis of the interaction of Bub1289–359–Bub3 with a synthetic peptide corresponding to the phosphorylated version of the second MELTP peptide (MELT2P) shown in C. (F) ITC analysis, with the unphosphorylation version of the same peptide (MELT2), shows no binding.
Figure 1—figure supplement 1
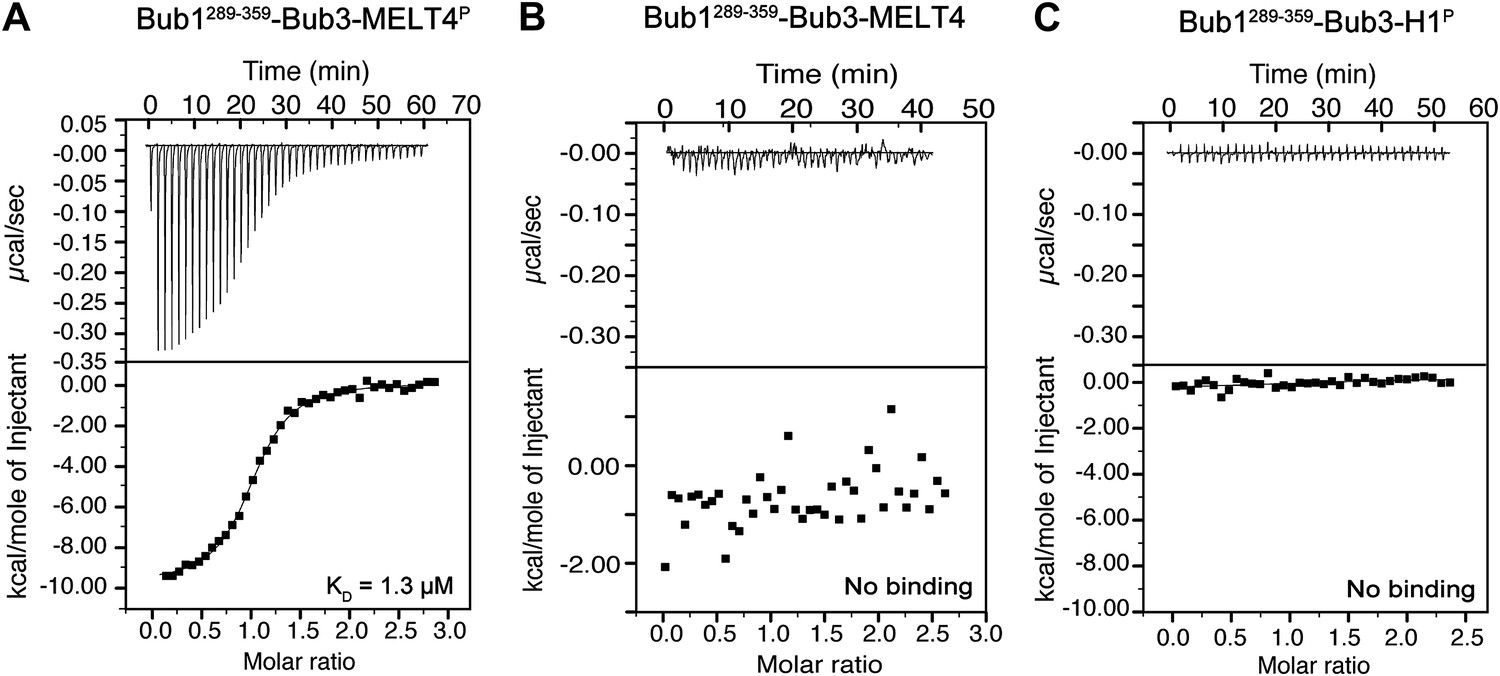
Additional calorimetry experiments.
(A) Isothermal titration calorimetry (ITC) analysis of the interaction of Bub1289–359–Bub3 with a synthetic peptide corresponding to the fourth MELTP peptide shown in Figure 1C. (B) ITC analysis with the unphosphorylation version of the same peptide shows no binding. (C) ITC analysis of the interaction of Bub1289–359–Bub3 with a synthetic peptide with sequence GGGPATPPKKAKKL, which encompasses a segment of histone H1 that is phosphorylated by cyclin-dependent kinase activity.
Figure 2 with 2 supplements
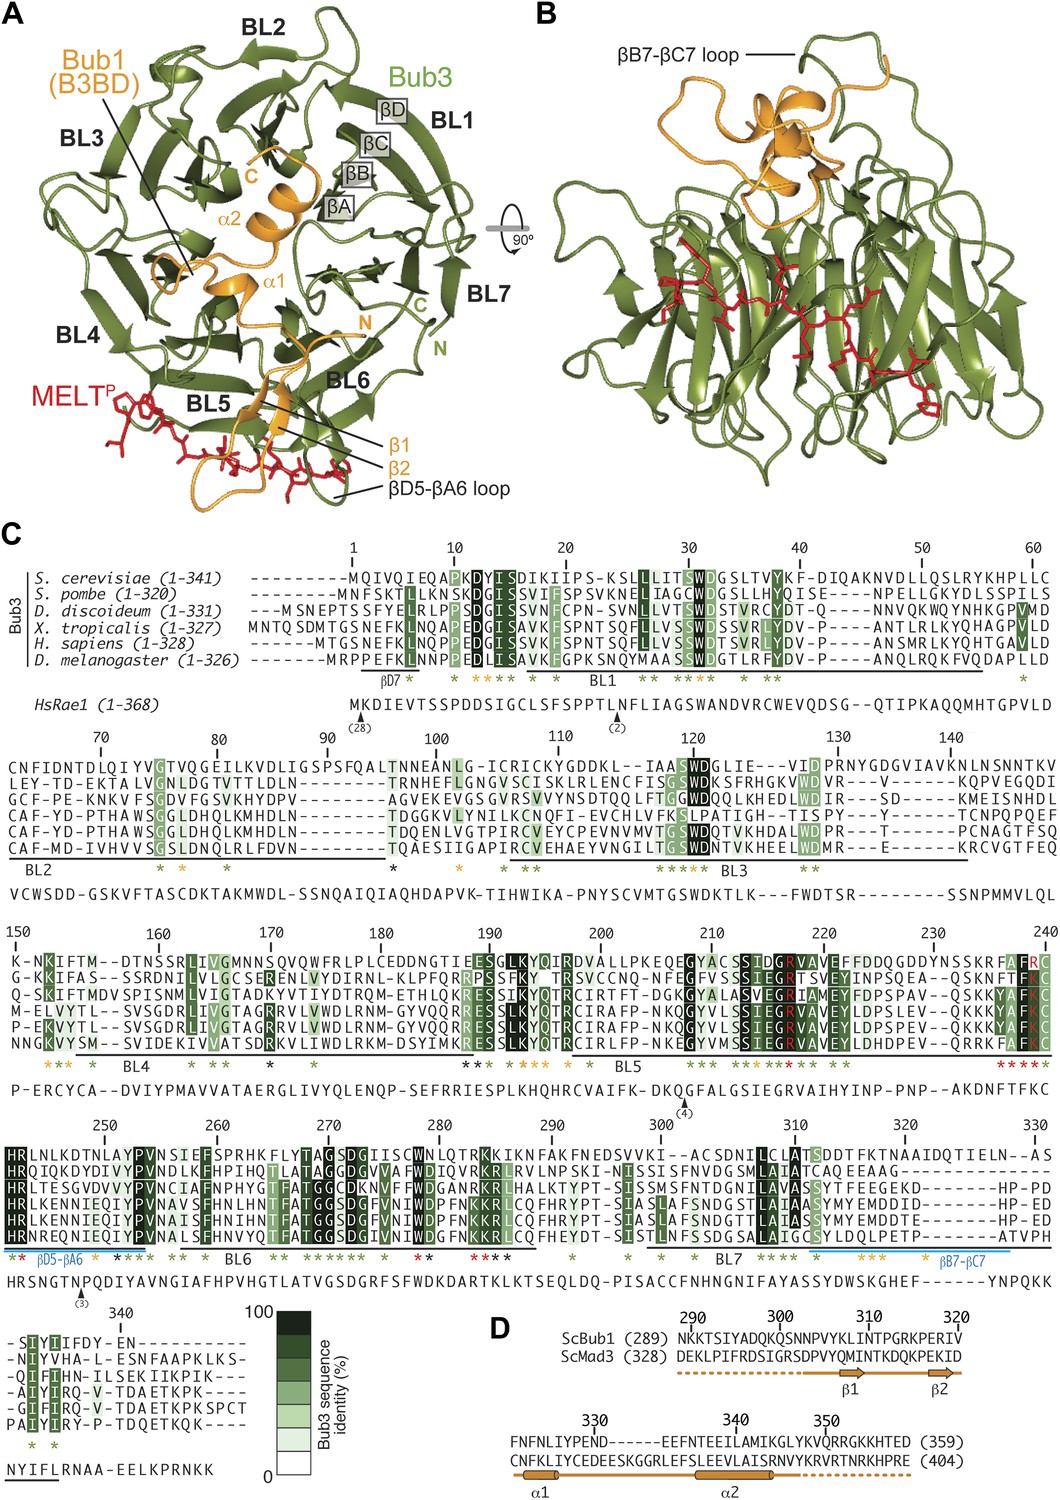
Structure and conservation of the Bub1–Bub3 complex.
(A) Top view of the Bub1289–359–Bub3-MELTP ternary complex. N and C indicate the N- and C-terminus, respectively. (B) Side view of the ternary complex. (C) Sequence alignment of Bub3 from the indicated species. The presented alignment was extracted from a much larger alignment consisting of more than 40 Bub3 sequences from distant eukaryotes (Vleugel et al., 2012). The indicated levels of conservation were derived from the larger alignment. Green asterisks indicate residues predicted, on structural ground, to be important for the stability of the Bub3 propeller. Orange asterisks point to residues that interact with Bub1. Red asterisks point to residues that interact with the MELTP peptide. Black asterisks point to conserved residues of uncertain function. BL = blade. (D) Mapping of secondary structure elements on the sequence of the Bub3-binding domain of Bub1.
Figure 2—figure supplement 1
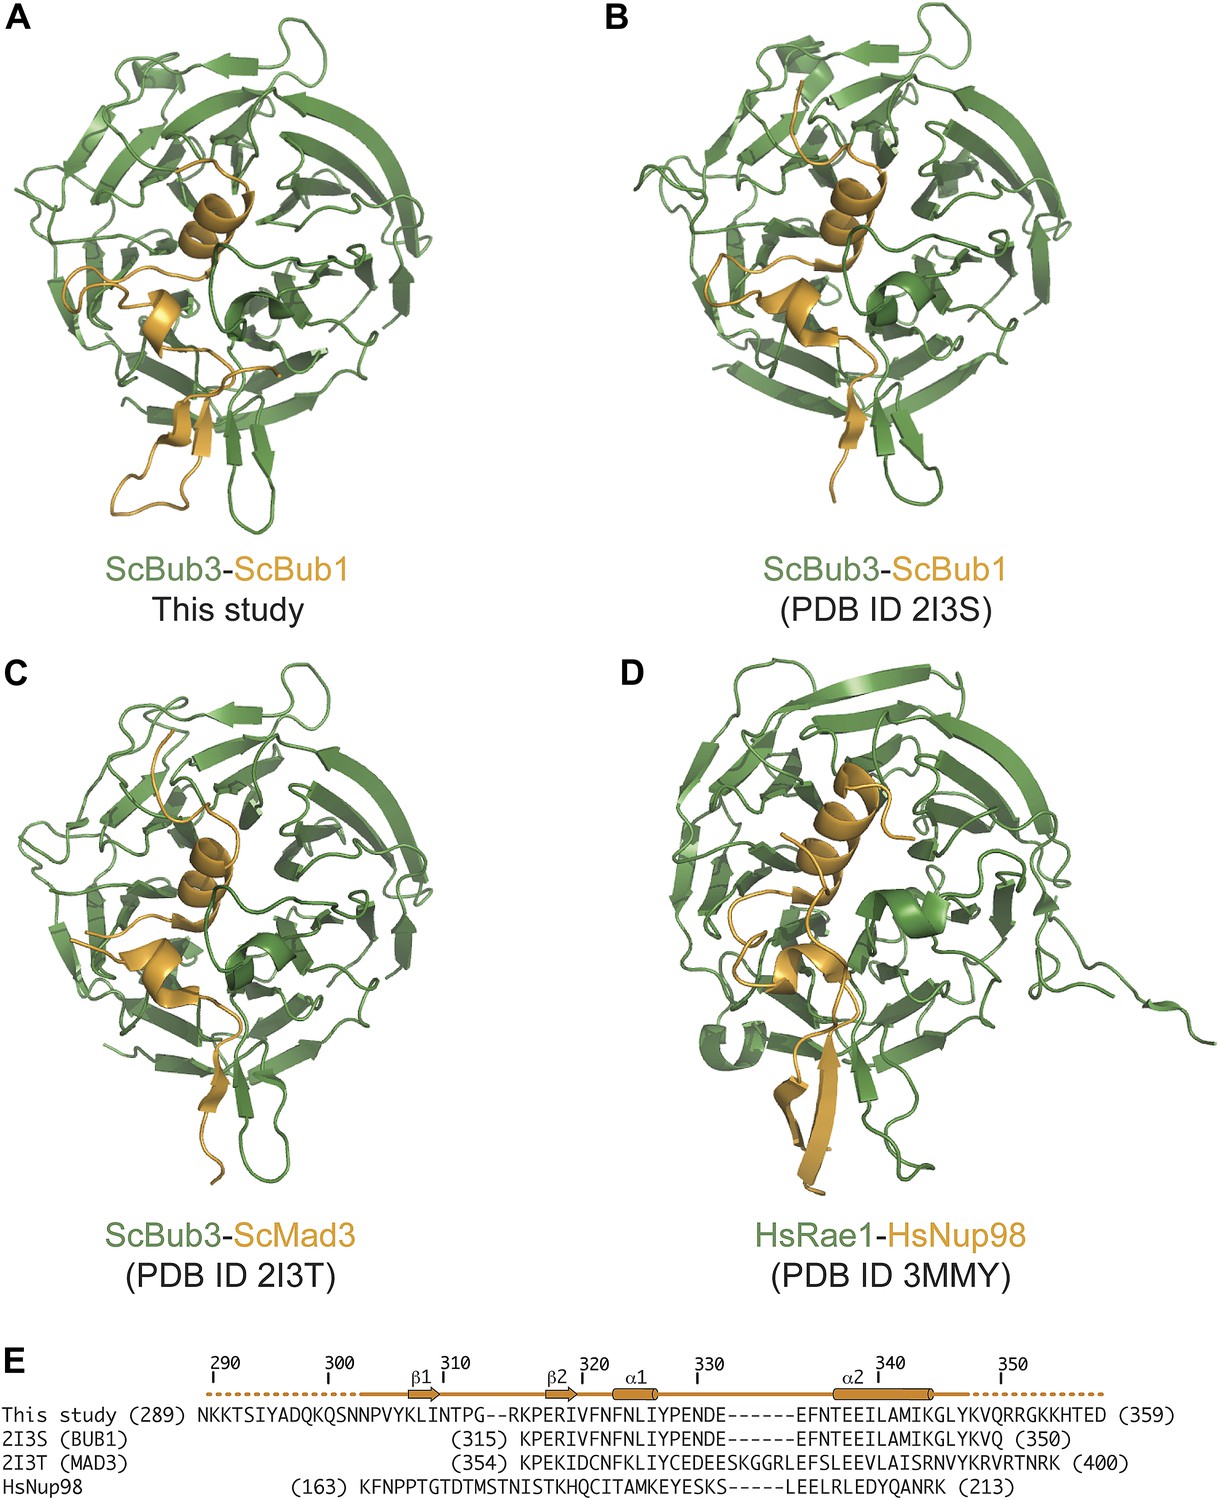
Comparison of Bub3–Bub1 and Bub3–Mad3 structures with Rae1-Nup98.
(A) Cartoon representations of the Bub1–Bub3-MELTP complex (the MELT peptide was omitted for clarity) shows that the β1 strand of the Bub3-binding domain of Bub1 pairs with the β2 strand in the ‘roof’ domain. (B) Crystal structure of the Bub1315–356:Bub3 complex from Saccharomyces cerevisiae (Larsen et al., 2007). The region corresponding to the β1 strand was absent from this construct (see panel E). (C) Crystal structure of the Mad3354–401:Bub3 complex (Larsen et al., 2007). Also in this case, the sequence encoding the β1 strand was missing. (D) Crystal structure of the Nup98-Rae1 complex shows a striking similarity with the Bub1–Bub3 structure. A sequence alignment for the Rae1 and Bub3 sequences is shown in Figure 2C. (E) Sequence alignment of GLEBS motifs is included in the different crystal structures.
Figure 2—figure supplement 2

Composite omit maps of the region corresponding to the phospho-MELT peptide.
(A) The panel shows the region around chain C. (B) The panel shows the region around chain F. In both cases, maps were calculated with Fourier coefficients 2mF0-DFc and contoured to 1.5σ, and clipped to limit the map to the region around the respective chain.
Figure 3 with 3 supplements

The interface between Bub1–Bub3 and MELTP.
(A) The MELTP peptide (here shown with carbon atoms in light gray color) orients transversally to the blades but its main chain amide and carbonyl groups form several hydrogen bonds with the main chain of the outermost strands of three consecutive blades, blades four to six. (B) Details of the interaction around MELTP sequence. The boxed regions are enlarged in panels C and D. (E–H) Surface representation of sequence conservation (resulting from the alignment discussed in the legend of Figure 2C) shows a dramatic concentration at the interface with MELTP.
Figure 3—figure supplement 1
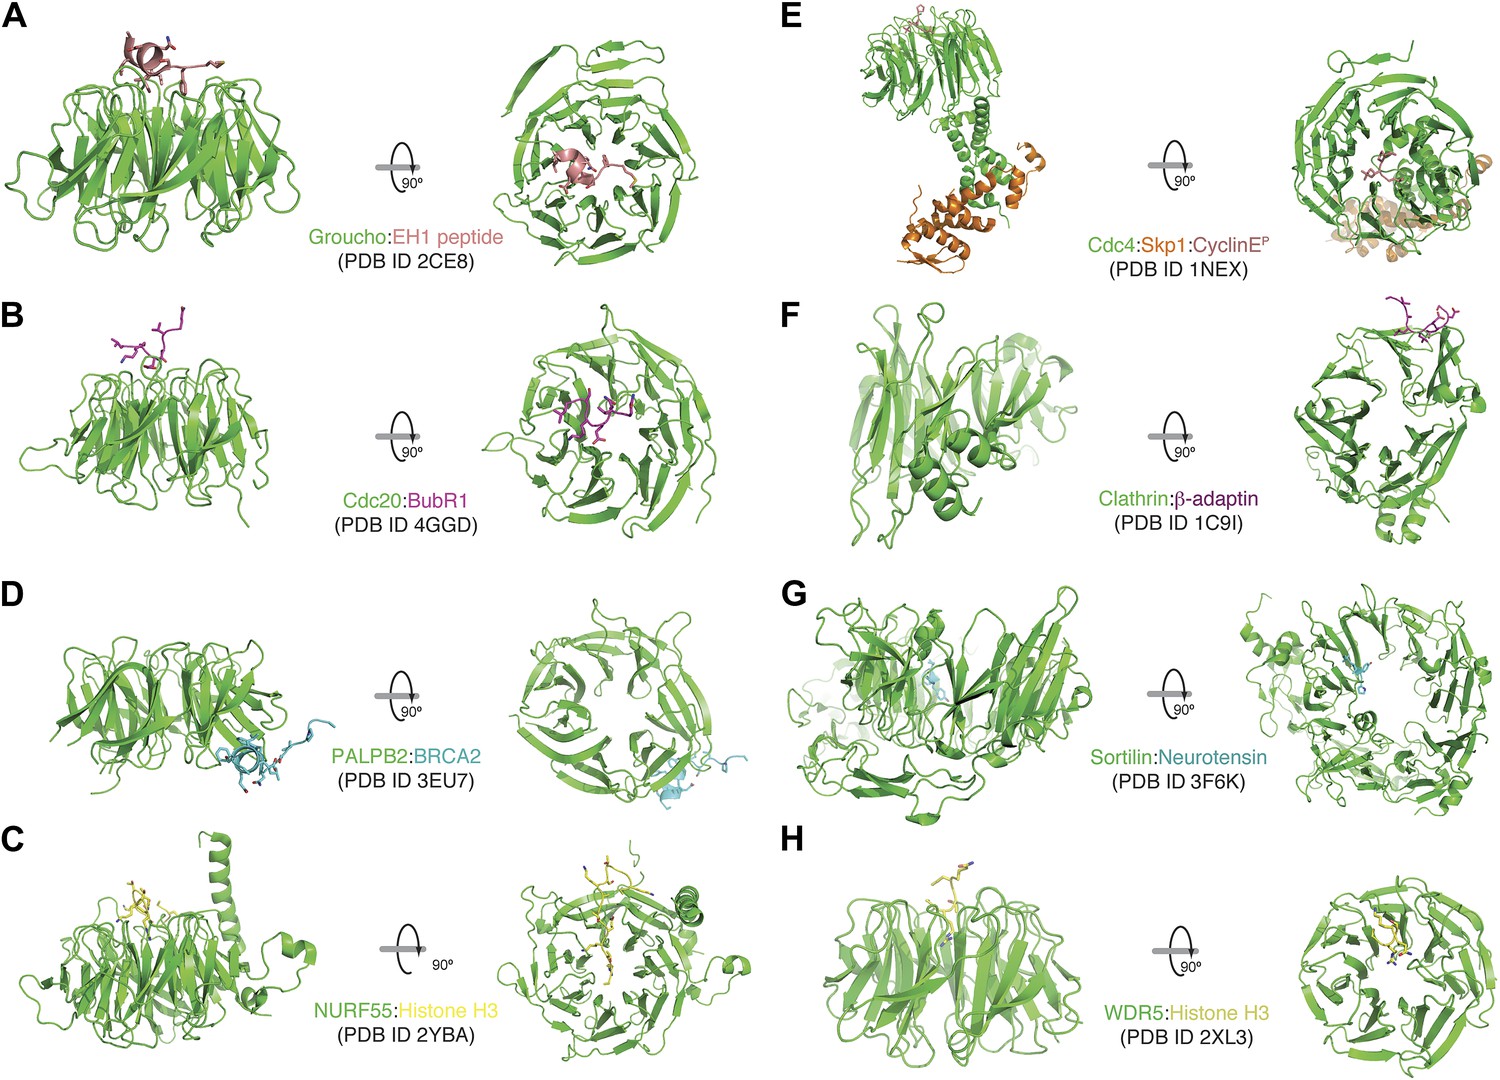
A collection of modes of ligand binding by β-propellers.
(A–H) We manually scanned the PDB for β-propeller structures in complex with peptide ligands. Each interaction is shown with a side and a top view. The molecular species involved and the corresponding PDB code are indicated. Of note, the Cdc4-Skp1-Cyclin E complex contains a phosphorylated Cyclin E peptide. It binds to the top of the Cdc4 β-propeller domain, not on the side as in Bub3.
Figure 3—figure supplement 2
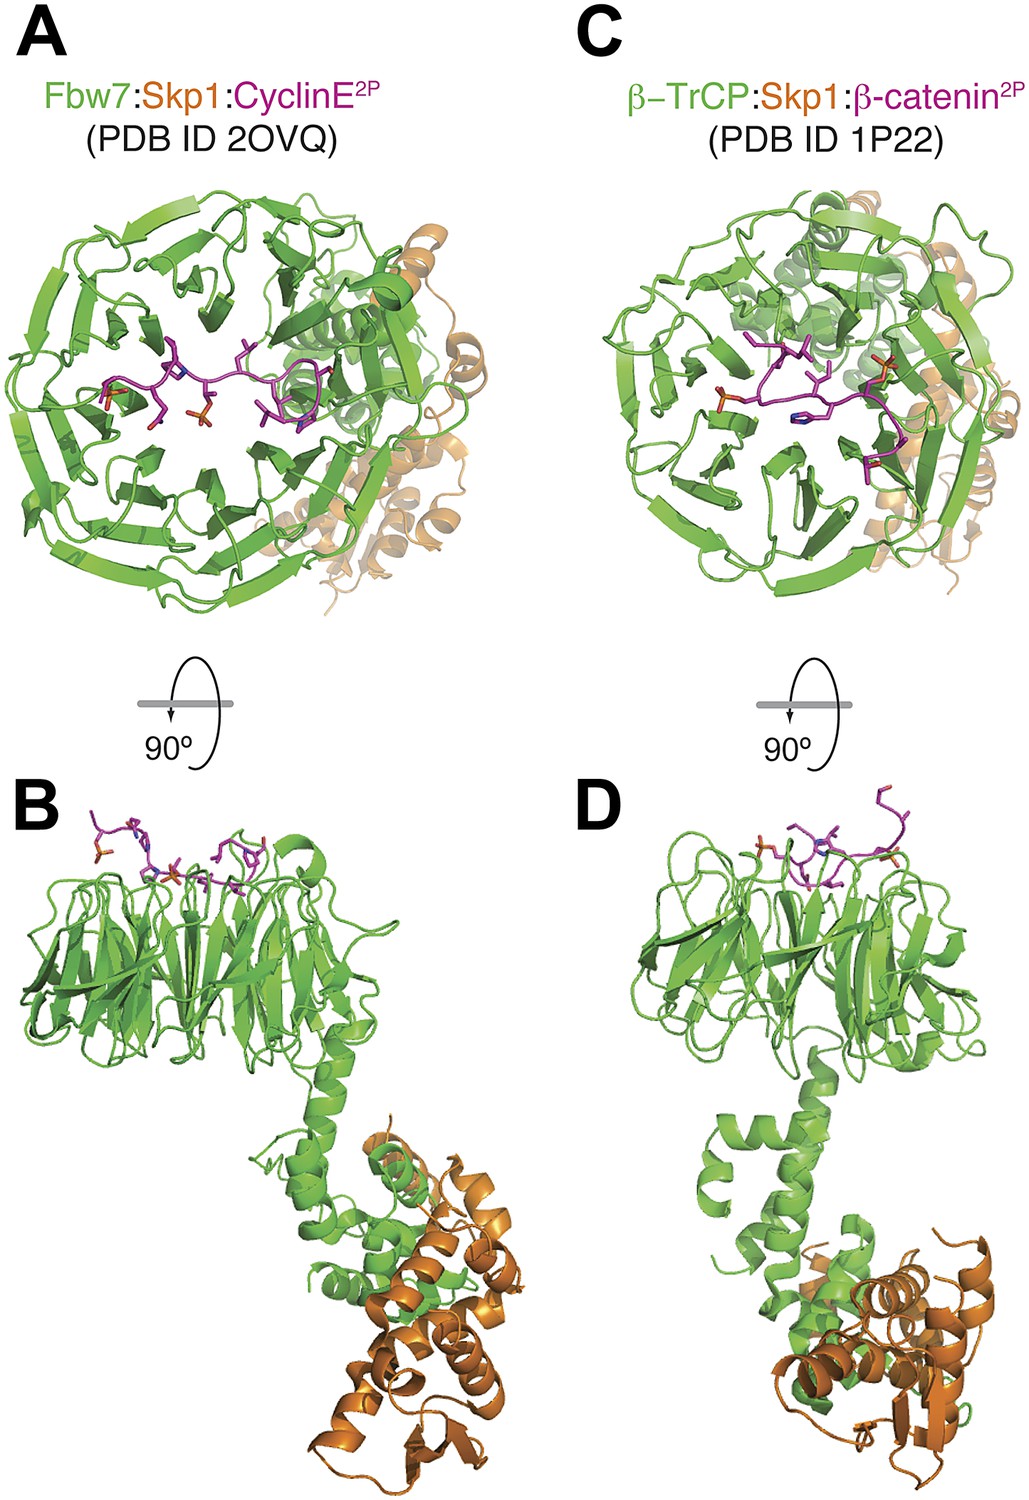
Mode of binding of phosphopeptides from Cyclin E and β-catenin to the β-propellers of Fbw7 and β-TrCP.
(A and B) Top and side view of the Fbw7/Skp1/Cyclin E2P complex. The di-phosphorylated peptide is accommodated on a binding site that involves the top surface of the 8-bladed WD40 β-propeller domain of Fbw7 (Hao et al., 2007). (C and D) Top and side view of the β-TrCP/Skp1/β-catenin2P complex. Also in this case, a di-phosphorylated peptide is accommodated on a binding site that involves the top surface of the 7-bladed β-propeller domain of β-TrCP (Wu et al., 2003). The scale of figures in panels B and D is smaller in comparison to the models in A and C.
Figure 3—figure supplement 3
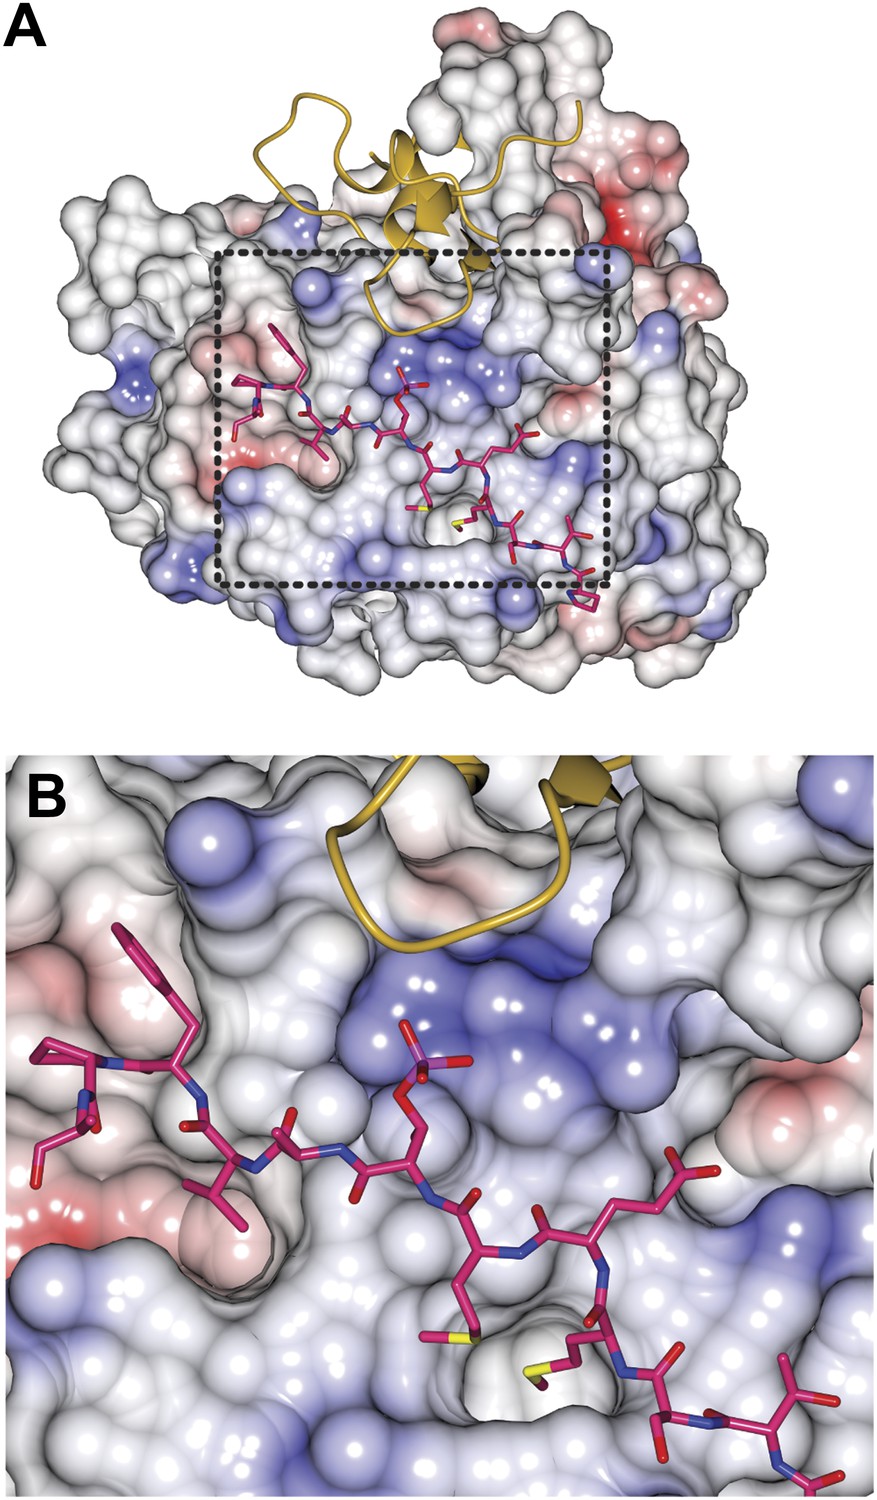
Electrostatics on the Bub3 surface at the MELTP interface.
(A) The charge distribution around the MELTP binding site of Bub3 is shown to be highly positive. The electrostatic potential at the surface (in units of Volts) was displayed within boundaries of −1.0 to 1.0. (B) A close-up of the MELT-binding region boxed in A.
Figure 4
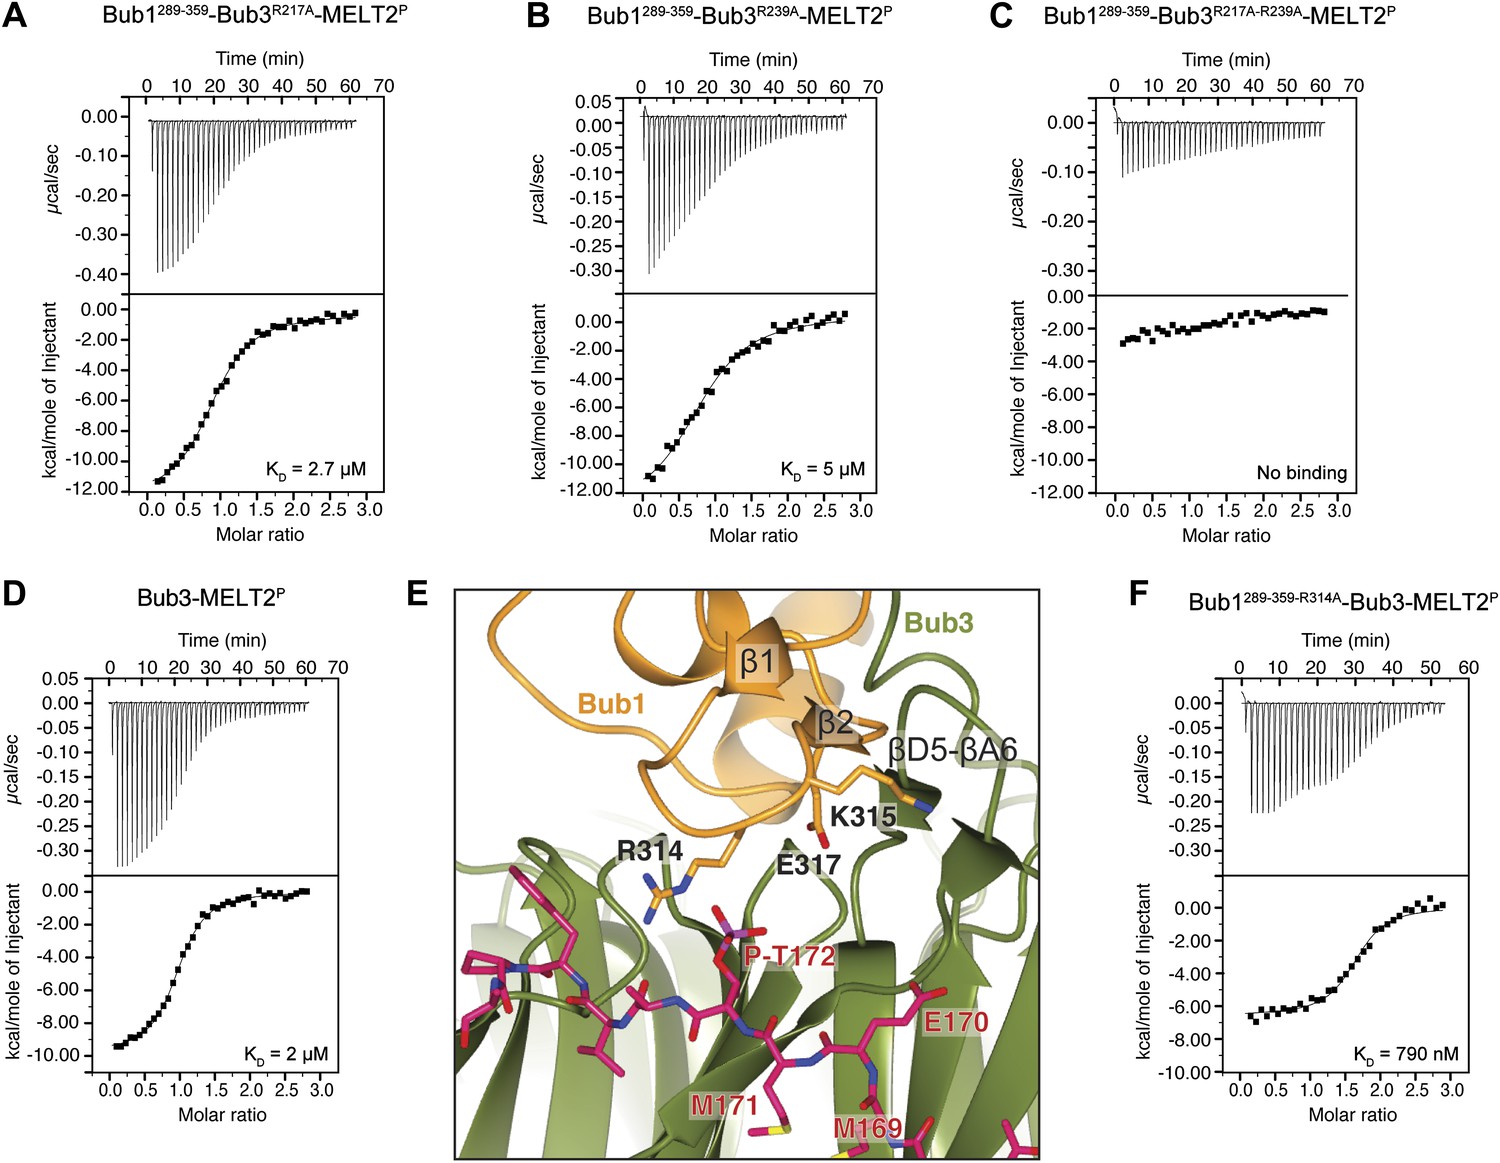
Biochemical validation of the interaction.
(A) ITC analysis of the interaction of Bub1289–359–Bub3R217A with a synthetic peptide encompassing the MELT2P sequence. (B–D) ITC experiments with the MELT2P peptide and Bub1289–359–Bub3R239A, Bub1289–359–Bub3R217A–R239A double mutant, and Bub3, respectively. (E) Close-up of the MELTP binding site indicating possible roles of the Bub3-binding motif of Bub1. The amino acid sequence of the Bub3-binding domain of Bub1 is reported in Figure 2D. (F) ITC experiment with the MELT2P peptide and the Bub1289–359–R314A–Bub3 complex.
Figure 5 with 2 supplements
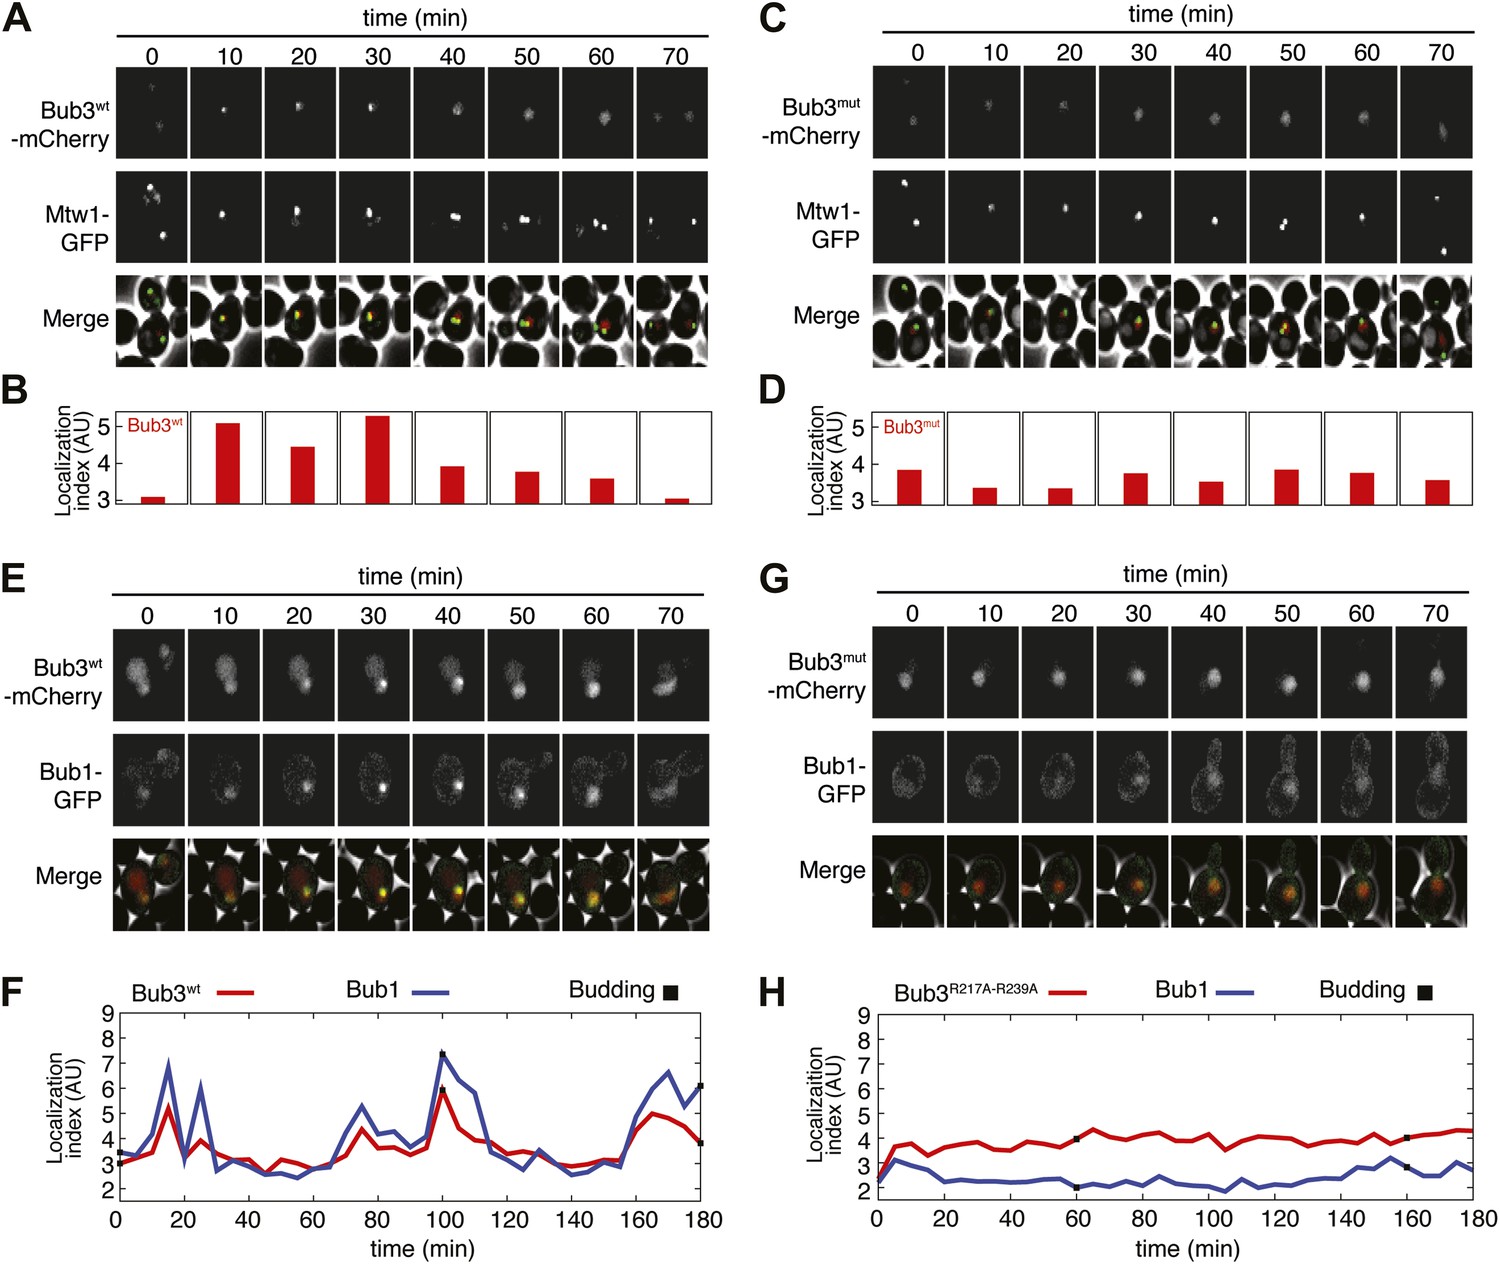
Mutant Bub3 does not localize to kinetochores and mislocalizes Bub1.
(A) Live S. cerevisiae cells expressing wild type Bub3-mCherry and Mtw1-GFP where filmed to assess kinetochore localization of the fluorescent proteins (Video 1). Selected frames are shown. (B) A localization index was calculated as discussed in ‘Materials and Methods’. High values of the index indicate recruitment of Bub3-mCherry to kinetochores. (C) As in panel A, but using cells expressing Bub3R217A–R239A-mCherry. (D) Localization index for Bub3R217A–R239A-mCherry. The localization index for the Bub3 mutant fluctuates around the value of 3.7, which we identify as corresponding to ‘perfect delocalization’ (‘Materials and methods’). (E) Selected frames from Video 3 demonstrating kinetochore localization of Bub3-mCherry and Bub1–GFP. (F) Peaks in the localization index indicate the timing of kinetochore recruitment of Bub3-mCherry and Bub1–GFP during subsequent cell cycles. Red and blue curves report localization of Bub3-mCherry and Bub1–GFP, respectively. The time of initiation of budding is marked by black squares. The diagram extends to three budding events. There is excellent correlation of the Bub1 and Bub3 signal, indicative of co-localization. (G) Bub3R217A–R239A-mCherry does not localize to kinetochores (Video 2). Bub1–GFP fails to localize to kinetochores in Bub3R217A–R239A-mCherry cells (selected frames from Video 4), in agreement with the role of Bub3 in kinetochore recruitment of Bub1 (Gillett et al., 2004). (H) The localization index for Bub3R217A–R239A-mCherry and Bub1–GFP is flat, close the numerical value corresponding to delocalization in wild type cells.
Figure 5—figure supplement 1
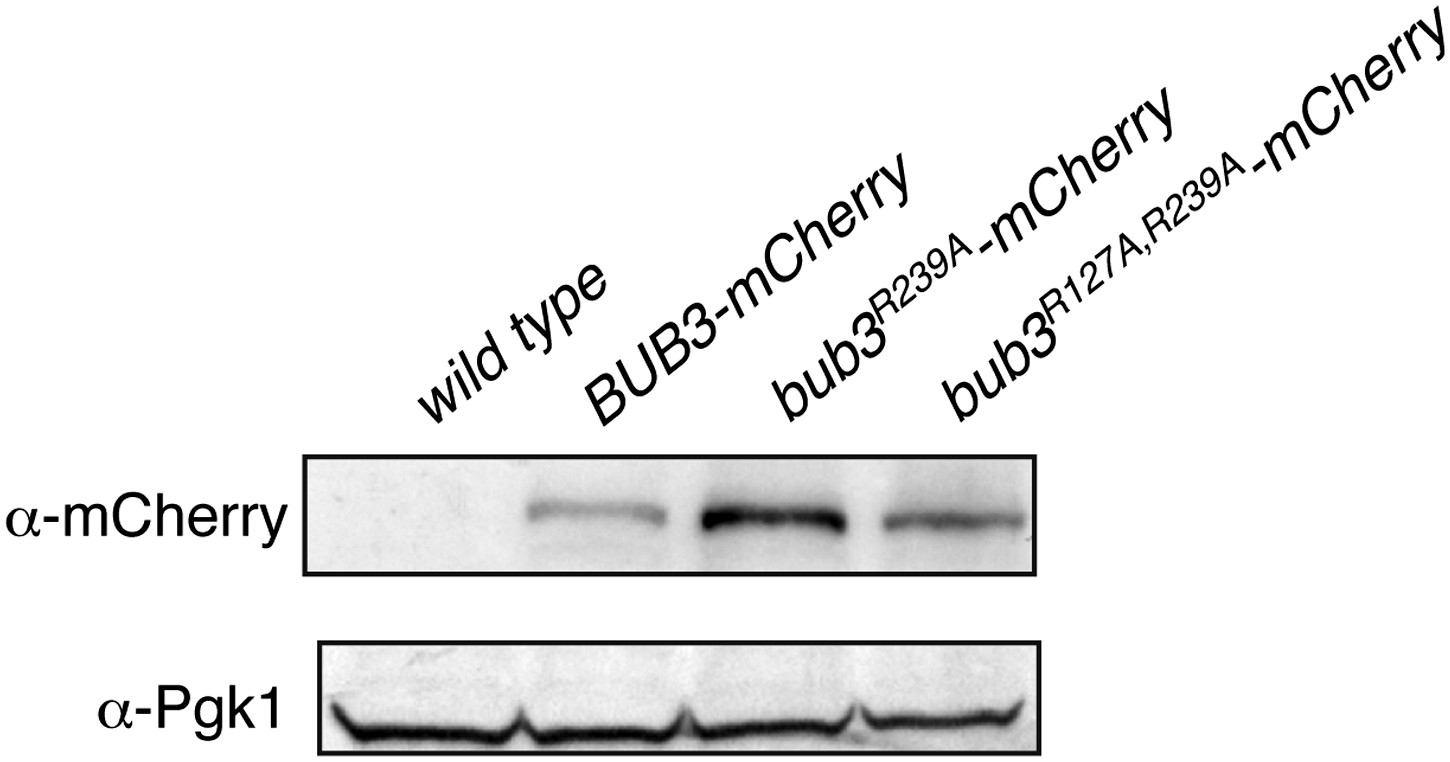
Expression levels of Bub3 and Bub3 mutants in bub3Δ Saccharomyces cerevisiae’s cells.
Western blotting of total cell lysates with an anti-mCherry antibody was used to detect the expression of the Bub3-mCherry construct in bub3Δ cells. TCA extracts where carried out according to (Mariani et al., 2012). Pgk1 was used as loading control.
Figure 5—figure supplement 2
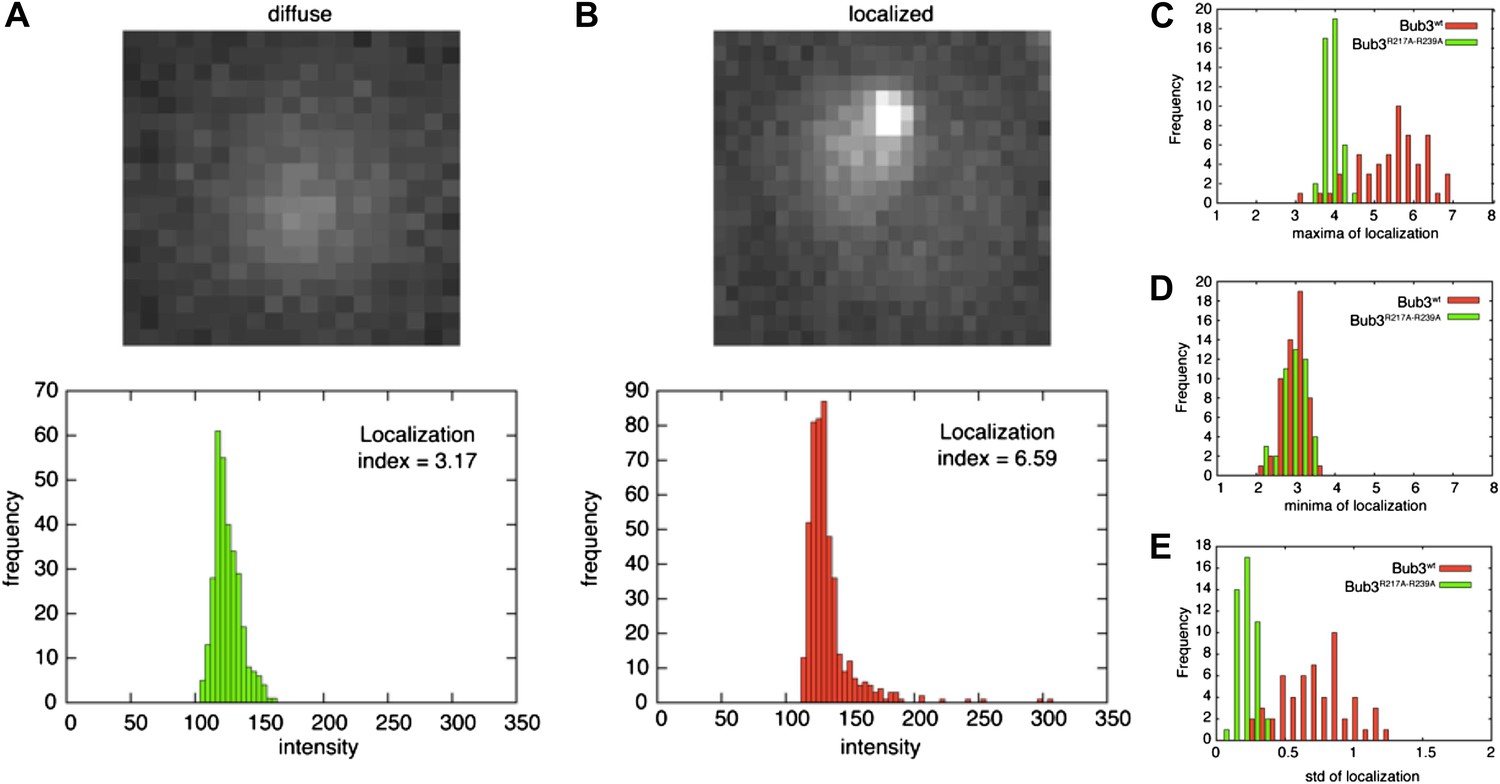
Validation of the localization index.
(A) The overall intensity distribution for a diffuse fluorescent protein describes a Gaussian. In this case, the localization index defined in ‘Materials and methods’ adopts a value of ∼3.7. (B) When the fluorescent protein is kinetochore-localized, the distribution is skewed-Gaussian, with a more extended right tail. In this case, our measure for localization is larger than ∼3.7. When the localization index assumes values that are significantly higher than ∼3.7, we observed the fluorescent protein to be localized to kinetochores, as confirmed by co-localization with Mtw1 (Figure 5). (C–E) distribution of maxima (C), minima (D), and standard deviation (E) of the localization index of Bub3wt-mCherry or Bub3R217A–R239A-mCherry over an entire cell cycle (i.e., the time between two budding events).
Figure 6
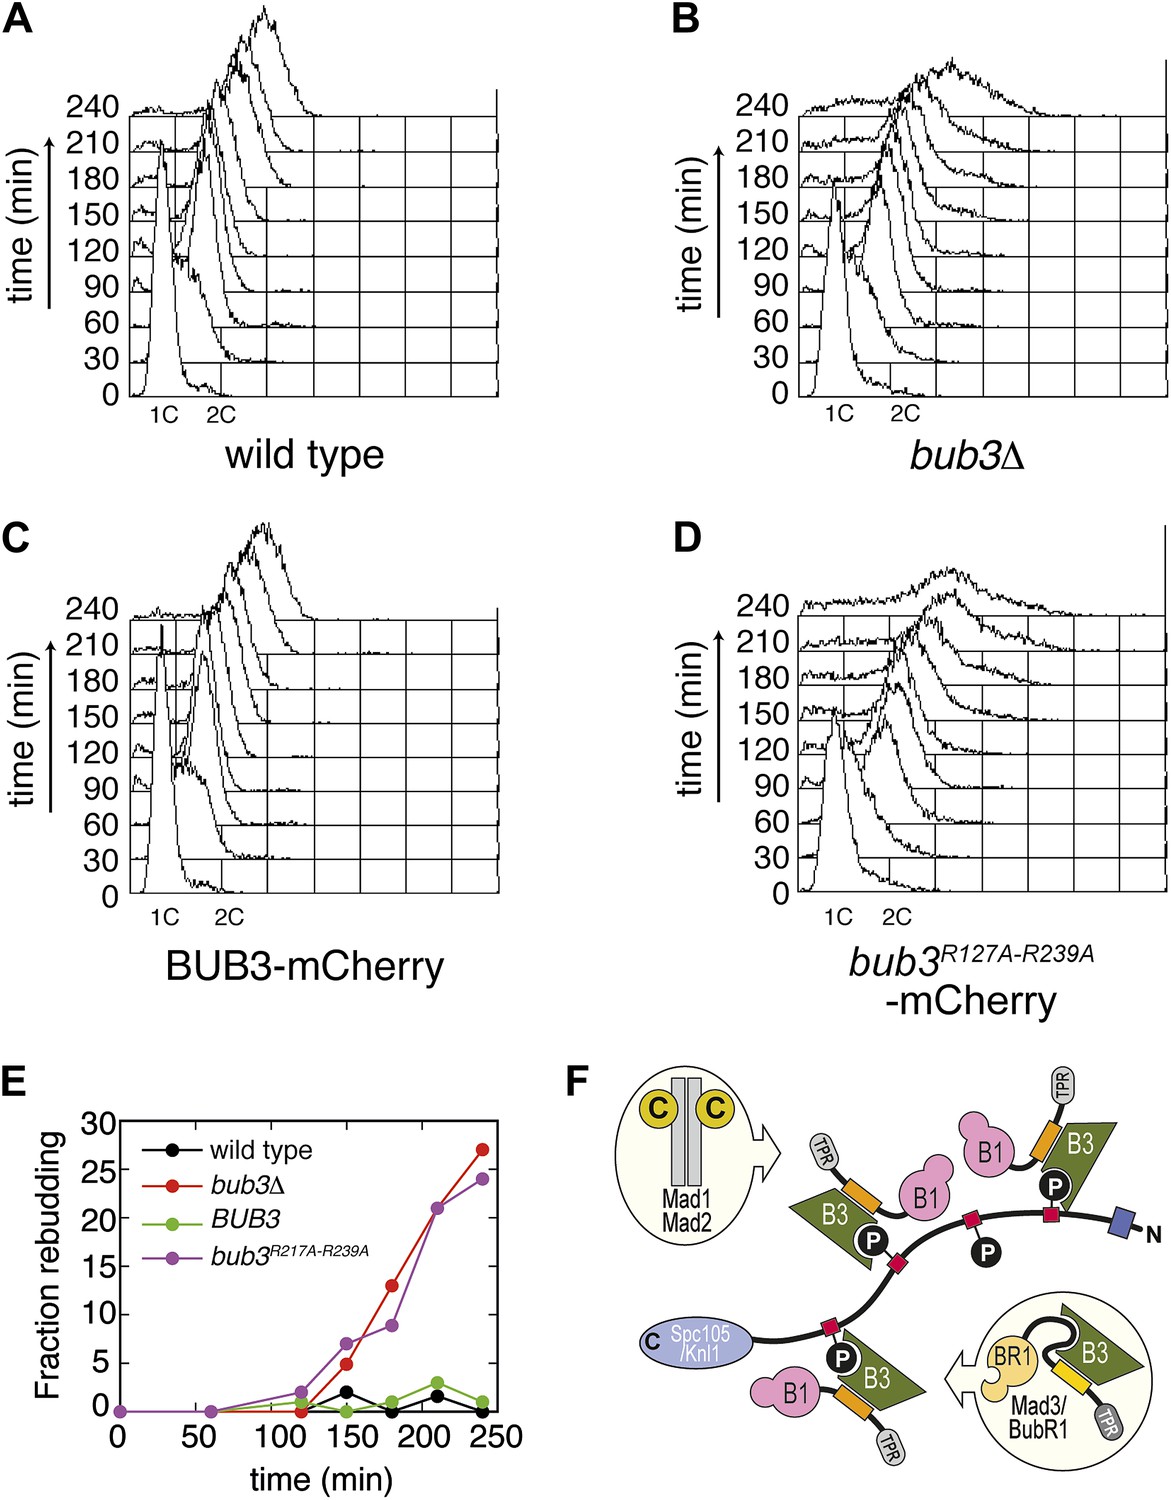
Mutant Bub3 cannot sustain the checkpoint.
(A) G1-arrested wild type S. cerevisiae cells were released in the cell cycle in the presence of nocodazole. FACS analysis at the indicated time points shows that cells first undergo DNA replication and subsequently arrest with 2C DNA content, indicative of mitotic checkpoint arrest. (B) bub3Δ cells are checkpoint deficient, fail to arrest, and re-replicate they DNA. (C) A functional checkpoint is re-established upon expression of wild type Bub3 in bub3Δ cells. (D) Bub3R217A–R239A is unable to restore a functional checkpoint when expressed in bub3Δ cells. Panels A–D report experiments that were carried out at the same time and at least twice. (E) Re-budding in the presence of nocodazole was taken as an independent indication of checkpoint deficiency. Wild type cells, and bub3Δ cells reconstituted with wild type Bub3 were able to maintain the checkpoint arrest and did not re-bud during the time of observation. Conversely, bub3Δ cells and cells reconstituted with Bub3R217A–R239A re-budded, indicative of checkpoint failure. (F) The binding affinity of Bub1–Bub3 for individual MELTP is high. This predicts that multiple Bub1–Bub3 complexes may become bound to a single Spc105/Knl1 molecule. Mad3/BubR1 requires Bub1 for kinetochore recruitment, indicating that it is not able to target autonomously to kinetochores. Because Mad3/BubR1 is, like Bub1, constitutively bound to Bub3, it is plausible that Mad3/BubR1 suppresses the MELTP-binding activity of Bub3. Whether this occurs, and how, are purely speculative at this time.
Videos
Video 1
Localization of Mtw1-GFP (left) and Bub3wt-mCherry (right) in replicating S. cerevisiae’s cells.
https://doi.org/10.7554/eLife.01030.017
Video 2
Localization of Mtw1-GFP (left) and diffuse localization of Bub3R217A–R239A-mCherry (right) in replicating S. cerevisiae’s cells.
https://doi.org/10.7554/eLife.01030.018
Video 3
Localization of Bub1-GFP (left) and Bub3wt-mCherry (right) in replicating S. cerevisiae’s cells.
https://doi.org/10.7554/eLife.01030.019
Video 4
Diffuse localization of Bub1–GFP (left) in replicating S. cerevisiae’s cells expressing Bub3 R217A–R239A-mCherry (right).
https://doi.org/10.7554/eLife.01030.020Tables
Table 1
Data collection and refinement statistics
| Data collection | |
| Wavelength (Å) | 1.21 |
| Resolution range (Å) | 46.8–1.95 (2–1.95) |
| Space group | C2 |
| Unit cell | a = 138.7; b = 57.9; c = 118.7; α = 90 β = 102.5 γ = 90 α = γ = 90° β = 102.5° |
| Total reflections | 438568 |
| Unique reflections | 66488 |
| Multiplicity | 6.6 (6.3) |
| Completeness (%) | 98.70 (88.81) |
| Mean I/sigma (I) | 14.15 (3.09) |
| Wilson B-factor | 26.16 |
| Rsym | 0.069 (1.023) |
| CC(1/2)* | 99.9 (87.3) |
| Refinement | |
| R-factor | 0.1726 (0.2552) |
| R-free | 0.1916 (0.2864) |
| Number of atoms | 6412 |
| Macromolecules | 6052 |
| Metal ions | 2 |
| Water | 358 |
| Protein residues | 775 |
| Average B-factor | 36.40 |
| Macromolecules | 36.00 |
| Solvent | 42.20 |
| Geometry | |
| RMS (angles, Å) | 0.89 |
| RMS (bonds, °) | 0.006 |
| Ramachandran favored (%) | 97 |
| Ramachandran outliers (%) | 0 |
| MolProbity score† | 1.29 (99th percentile) |
-
Statistics for the highest-resolution shell are shown in parentheses.
-
*
Percentage of correlation between intensities from random half-datasets (Karplus and Diederichs, 2012).
-
†
MolProbity score combines the clashscore, rotamer, and Ramachandran evaluations into a single score, normalized to be on the same scale as X-ray resolution (Chen et al., 2010).
Table 2
Strains used in this study (all in W303 background)
| Name | Relevant genotype |
|---|---|
| yAC1 | MATa |
| yAC411 | MATa, bub3::LEU2 |
| yAC1990 | MATa, bub3::LEU2 trp1::BUB3R127A/R239A-3Cherry::TRP1 |
| yAC2036 | MATa, bub3::LEU2 trp1::BUB3R239A-3Cherry::TRP1 |
| yAC2048 | MATa, bub3::LEU2 trp1::BUB3R127A/R239A-3Cherry::TRP1 |
| yAC2072 | MATa, bub3::LEU2 trp1::BUB3R127A/R239A-3Cherry::TRP1, MTW1-GFP::TRP1 |
| yAC2110 | MATa, bub3::LEU2 trp1::BUB3-3Cherry::TRP1, MTW1-GFP::TRP1 |
| yAC2090 | MATa, bub3::LEU2 trp1::BUB3-3Cherry::TRP1, BUB1-GFP::TRP1 |
| yAC2091 | MATa, bub3::LEU2 trp1::BUB3R127A/R239A-3Cherry::TRP1, BUB1-GFP::TRP1 |
Download links
A two-part list of links to download the article, or parts of the article, in various formats.
Downloads (link to download the article as PDF)
Open citations (links to open the citations from this article in various online reference manager services)
Cite this article (links to download the citations from this article in formats compatible with various reference manager tools)
Bub3 reads phosphorylated MELT repeats to promote spindle assembly checkpoint signaling
eLife 2:e01030.
https://doi.org/10.7554/eLife.01030


