Sgol2 provides a regulatory platform that coordinates essential cell cycle processes during meiosis I in oocytes
- University of Oxford, United Kingdom
- University of Washington, United States
- University of Bayreuth, Germany
- Instituto de Biología Molecular y Celular del Cáncer (CSIC-USAL), Spain
Figures
Figure 1
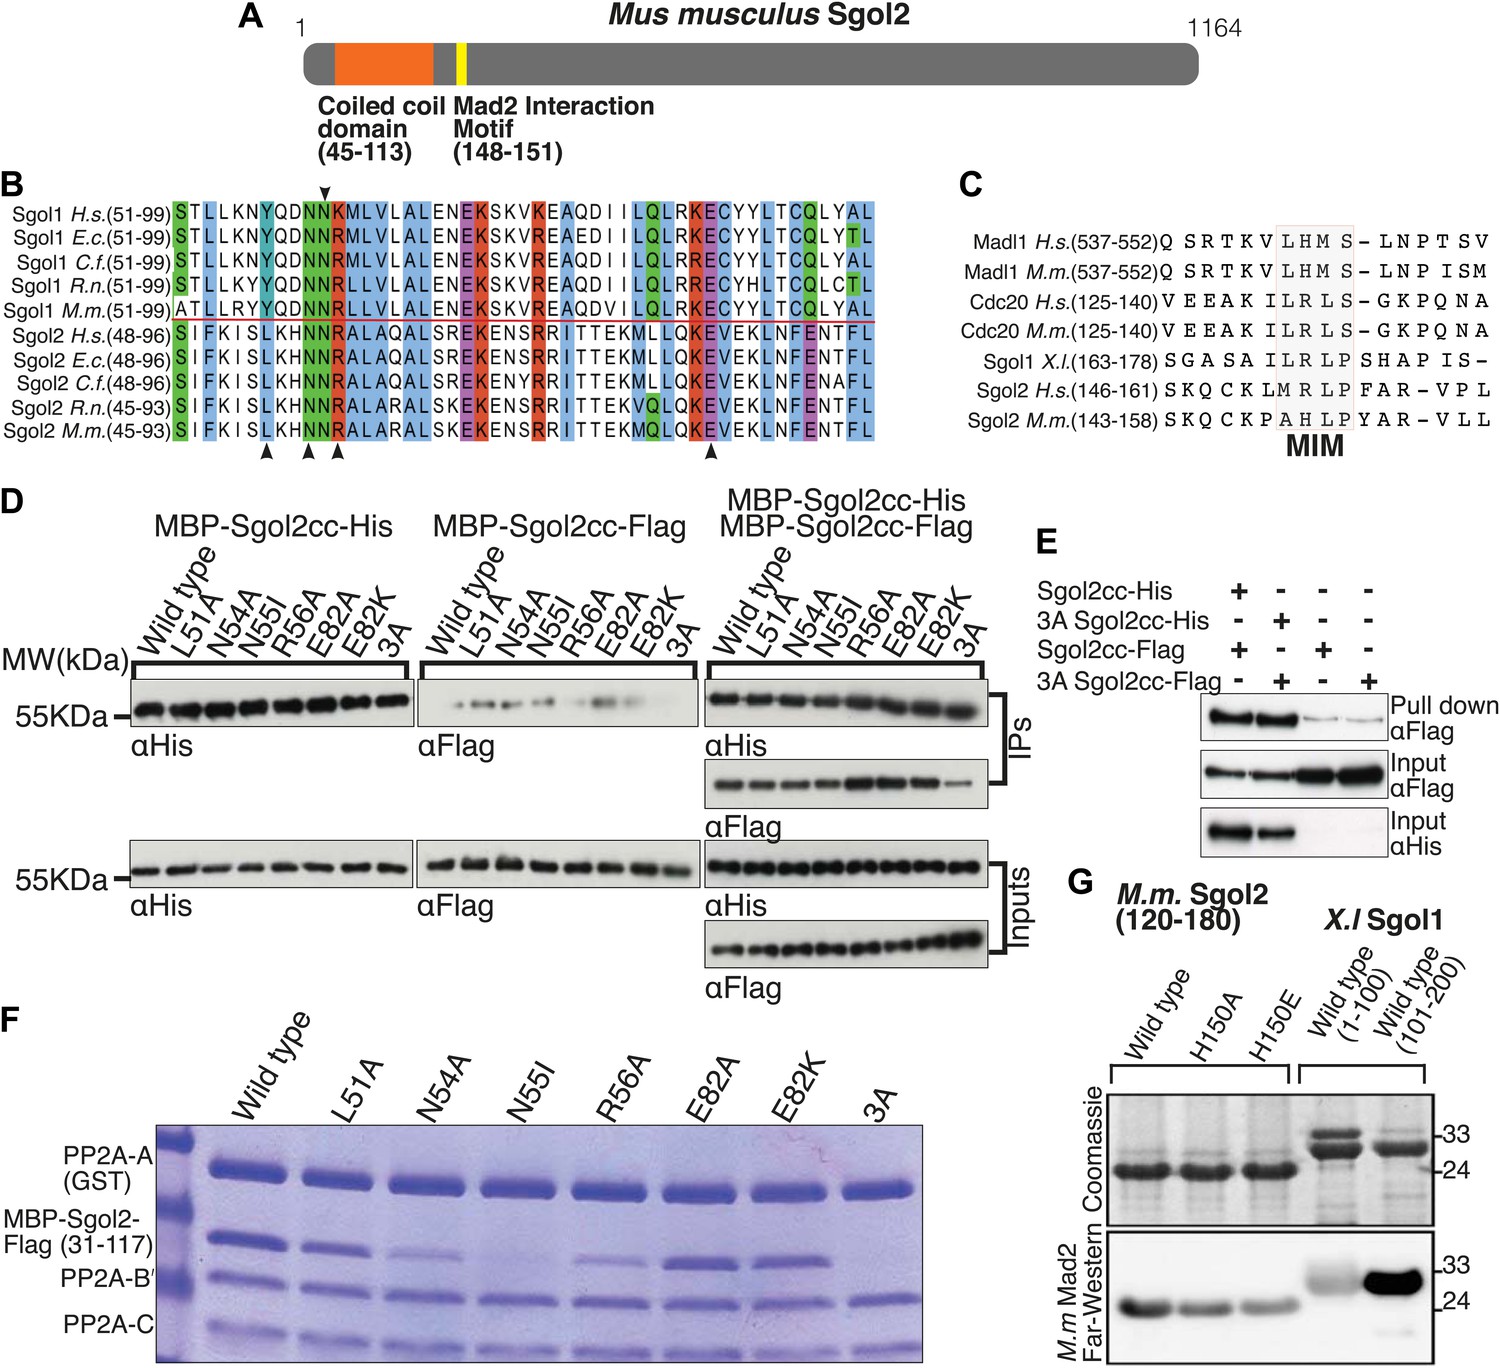
Sgol2 binds to PP2A and Mad2 through coiled coil domain and Mad2 Interaction Motif (MIM), respectively.
(A) Schematic diagram indicating relative positions of the coiled coil domain and the MIM sequence in M. musculus Sgol2 (not drawn to scale). (B) Sequence alignment of the coiled coil domains of Sgol1 and Sgol2 from different vertebrate species. Arrowheads below the alignment indicate conserved residues (L51, N54, R56, and E82) in the coiled coil domain of Sgol2 mapping onto binding sites between PP2A and Sgol1. The conserved asparagine residue (N55 in mSgol2), important for maintaining the interaction surface of the coiled coil domain, is marked by an arrowhead above the alignment. (C) Sequence alignment of conserved MIM (Mad2 Interaction Motif) in Sgol2, Mad1, and Cdc20 from Xenopus, human and mouse origin. (D) Dimerization assay of coiled coil domains from wild type and mutant Sgol2. The Flag-tagged MBP-Sgol2cc (31–117) was pulled down by the His-tagged MBP-Sgol2cc (31–117) with the same substitution. Homodimerisation was assessed by the relative abundance of each form in the IP by western blots. (E) Co-immunoprecipitation assay of MBP-Sgol2cc from wild type and 3A mutant are shown to validate the homodimerisation of coiled coil domains. MBP-Sgol2cc-Flag and MBP-Sgol2cc-His were expressed either independently, or co-expressed. After His-tag pull-down, each fraction was separated on a 12% SDS-PAGE and analyzed by immunoblotting with anti-Flag and anti-His antibodies. Input was resolved on a 12% SDS-PAGE. (F) The in vitro binding assay of PP2A A(GST-tagged), B’, and C subunits with wild type MBP-mSgol2cc-Flag and variants thereof. After GST pull down, eluates were resolved by SDS-PAGE and Coomassie stained. (G) Sgol2 and Mad2 binding assay. Sgol2 fragment spanning amino-acid (aa) residues 120–180 with wild type and mutant MIM sequences were assessed for Mad2 interaction by far-western blot. Fragments from Xenopus Sgol1, with and without MIM domain, were used as positive and negative controls.
Figure 2
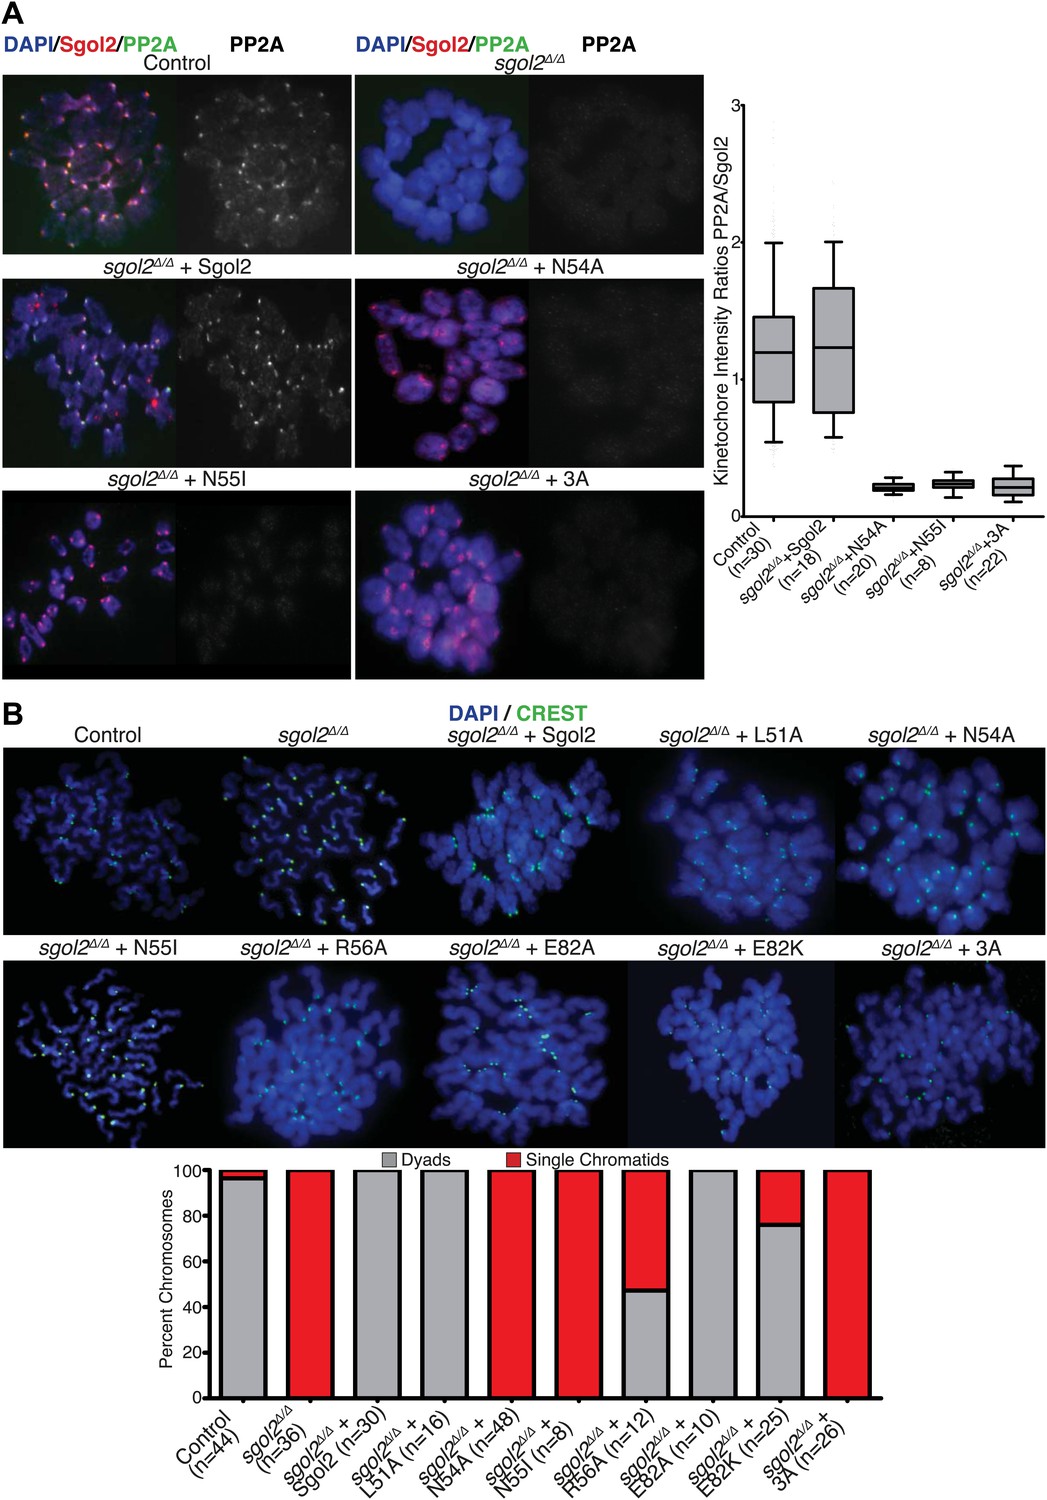
Sgol2-PP2A interaction is required to recruit PP2A to kinetochores and protect centromeric cohesion at the first meiotic division.
(A) GV oocytes were harvested in the presence of IBMX. Microinjections were performed at GV stage in M2 medium supplemented with IBMX. Oocytes were then cultured in IBMX-free medium for about 6 hr, corresponding to metaphase I stage. Chromosome spreads were prepared and stained with DAPI (blue), Sgol2 (red), and PP2A-C (green). Box and whisker plot shows fluorescence intensity ratios of PP2A and Sgol2 at kinetochores. Upper and lower bars indicate 95th and 5th percentiles, respectively. Numbers of oocytes examined are indicated (n). (B) Oocytes harvested at GV stage were matured in M16 medium for up to 24 hr. Chromosome spreads prepared from oocytes that have extruded the first polar body were stained with DAPI (blue) to visualize DNA and CREST (green) to mark centromeres. Frequencies of dyads and single chromatids were quantified.
Figure 3
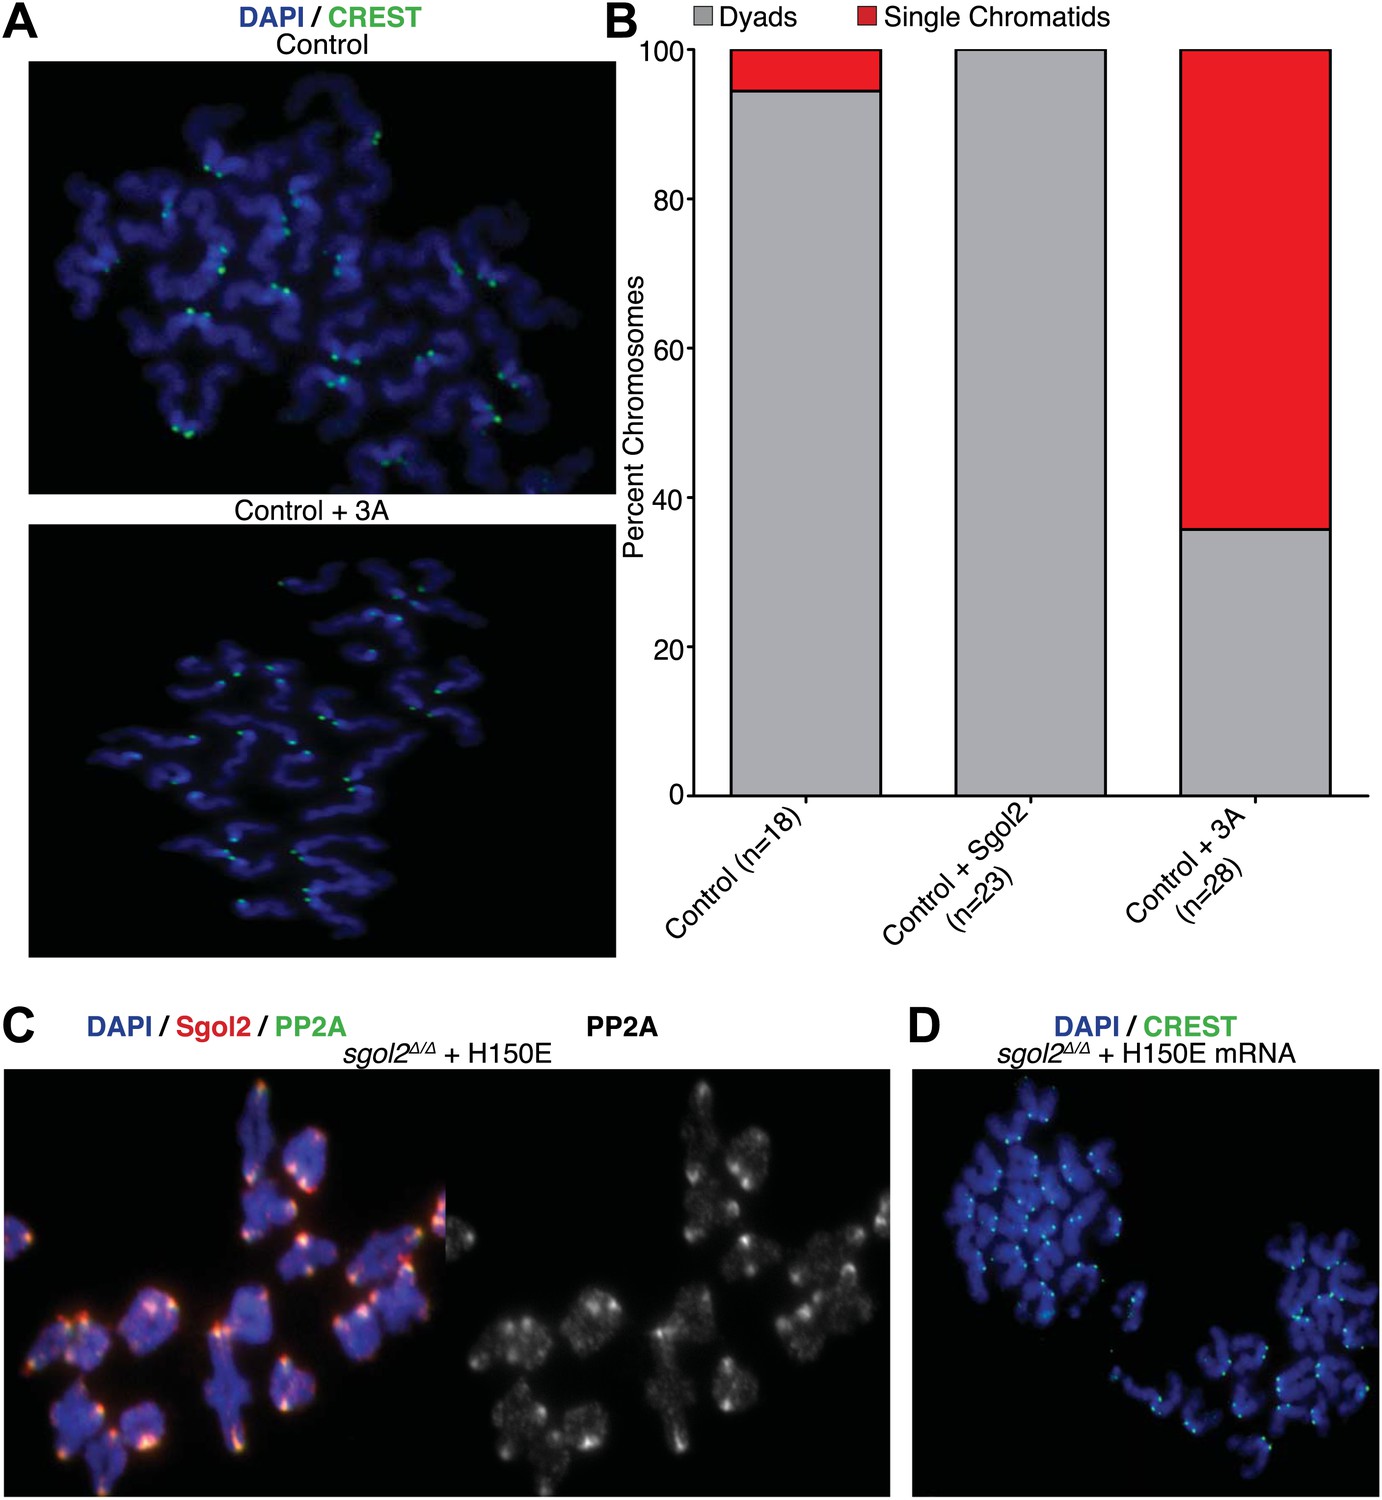
Sgol2-PP2A, but not Sgol2-Mad2, interaction is required to protect centromeric cohesion at the first meiotic division.
(A) Oocytes harvested at GV stage from wild type (control) mice were microinjected with wild type or 3A mutant Sgol2 mRNA in M2 medium supplemented with IBMX. After releasing the oocytes in M16 medium without IBMX, chromosome spreads were prepared from metaphase II-arrested oocytes and stained with DAPI (blue) and CREST (green). (B) Frequencies of dyads and single chromatids observed on metaphase II-stage chromosome spreads. Numbers of oocytes examined are indicated (n). (C) Metaphase I localization of Sgol2 (red) and PP2A-C (green) on chromosomes from sgol2Δ/Δ oocytes microinjected with H150E Sgol2 mRNA. (D) DAPI (blue) and CREST (green) stained chromosome spreads prepared from metaphase II-stage oocytes.
Figure 4 with 3 supplements
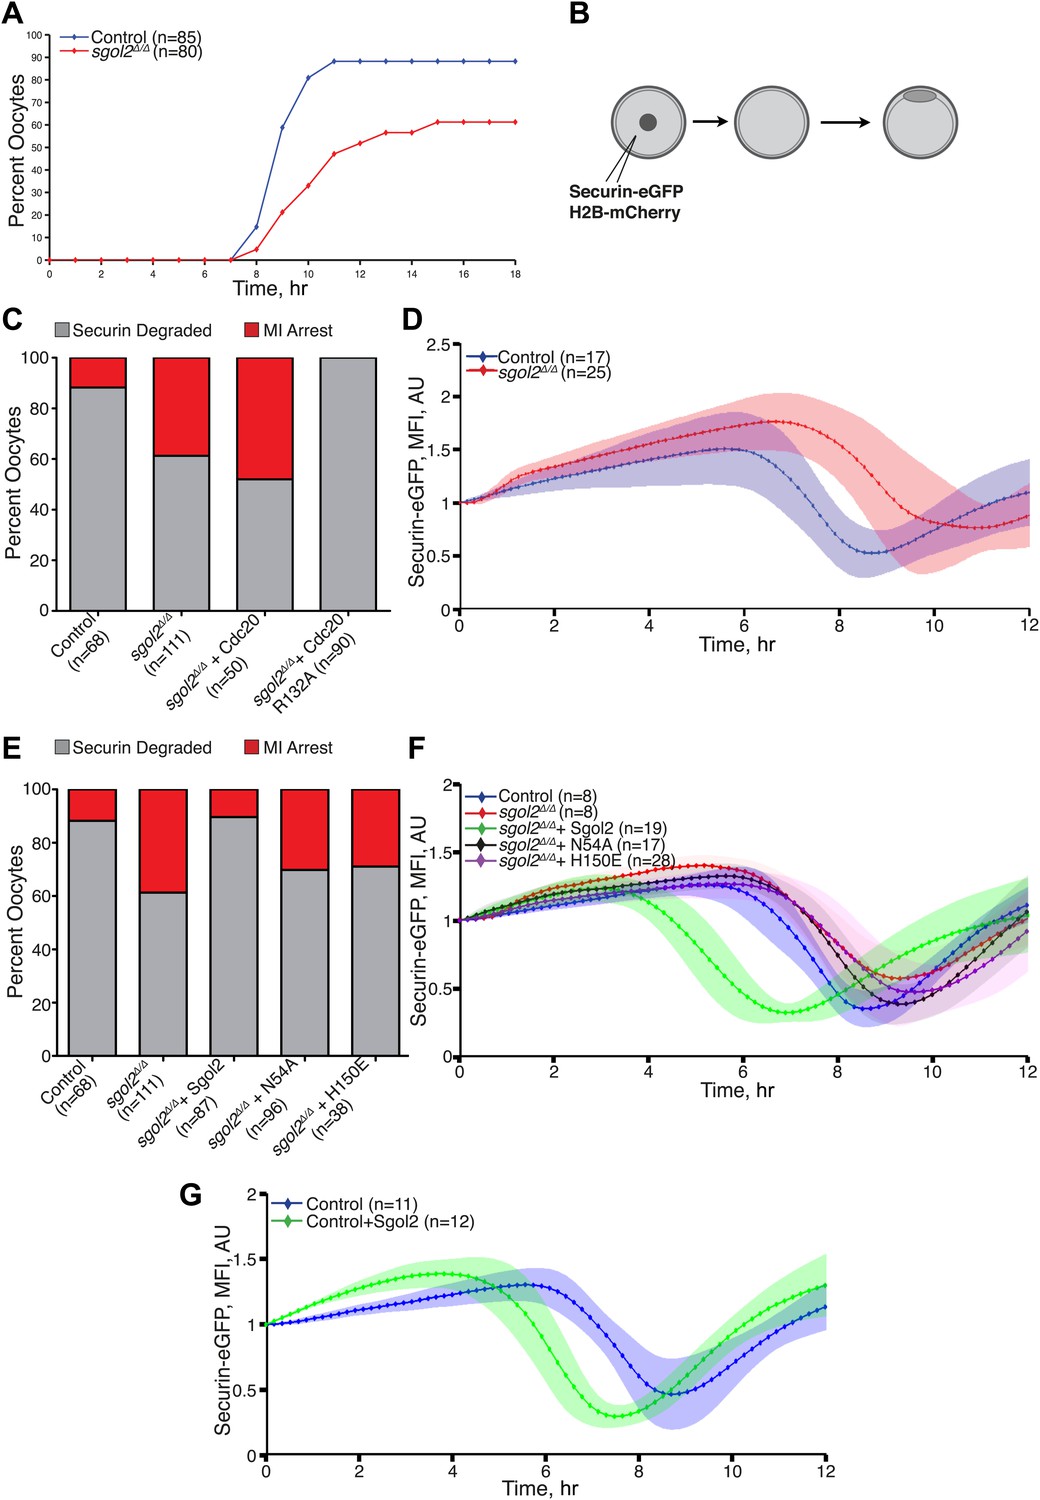
Sgol2 silences spindle assembly checkpoint through its interactions with PP2A and Mad2.
(A) Kinetics of the first polar body extrusion (PBE) of oocytes cultured in vitro. Numbers of oocytes examined are indicated (n). (B) Oocytes were microinjected with indicated mRNAs at the GV stage. Chromosome movements and kinetics of Securin-eGFP were visualized by time-lapse confocal microscopy. (C) Frequencies of oocytes that destroyed Securin-eGFP, hence activated APC/CCdc20, at the metaphase-anaphase transition are shown. SAC was inactivated by expressing a dominant-negative version of the APC/C activator Cdc20 (Cdc20–R132A) that cannot be bound by Mad2. (D) Data represent the mean and standard deviations of Securin-eGFP mean fluorescence intensity levels in sgol2Δ/Δ (red) and litter mate control (blue) oocytes at each time point. Values from individual oocytes were normalized relative to that at GVBD (0 hr), and mean and standard deviations of the population are plotted in arbitrary units, (AU), against time. Securin-eGFP curves from individual oocytes are shown in Figure 4—figure supplement 1. (E) Securin-eGFP destruction was used as a marker for APC/C activation. Control and Sgol2 knockout are compared to sgol2Δ/Δ oocytes microinjected with indicated Sgol2 mRNA. (F) GV-normalized mean and standard deviations of Securin-eGFP levels are plotted against time for the indicated groups of oocytes. Securin-eGFP curves from individual oocytes are displayed in Figure 4—figure supplement 2. (G) Microinjection of Sgol2 mRNA accelerates APC/CCdc20 activation in wild type oocytes. Mean and standard deviations of the time course measurements of Securin-eGFP mean fluorescence intensity are displayed. Securin-eGFP curves from individual oocytes are shown in Figure 4—figure supplement 3.
Figure 4—figure supplement 1
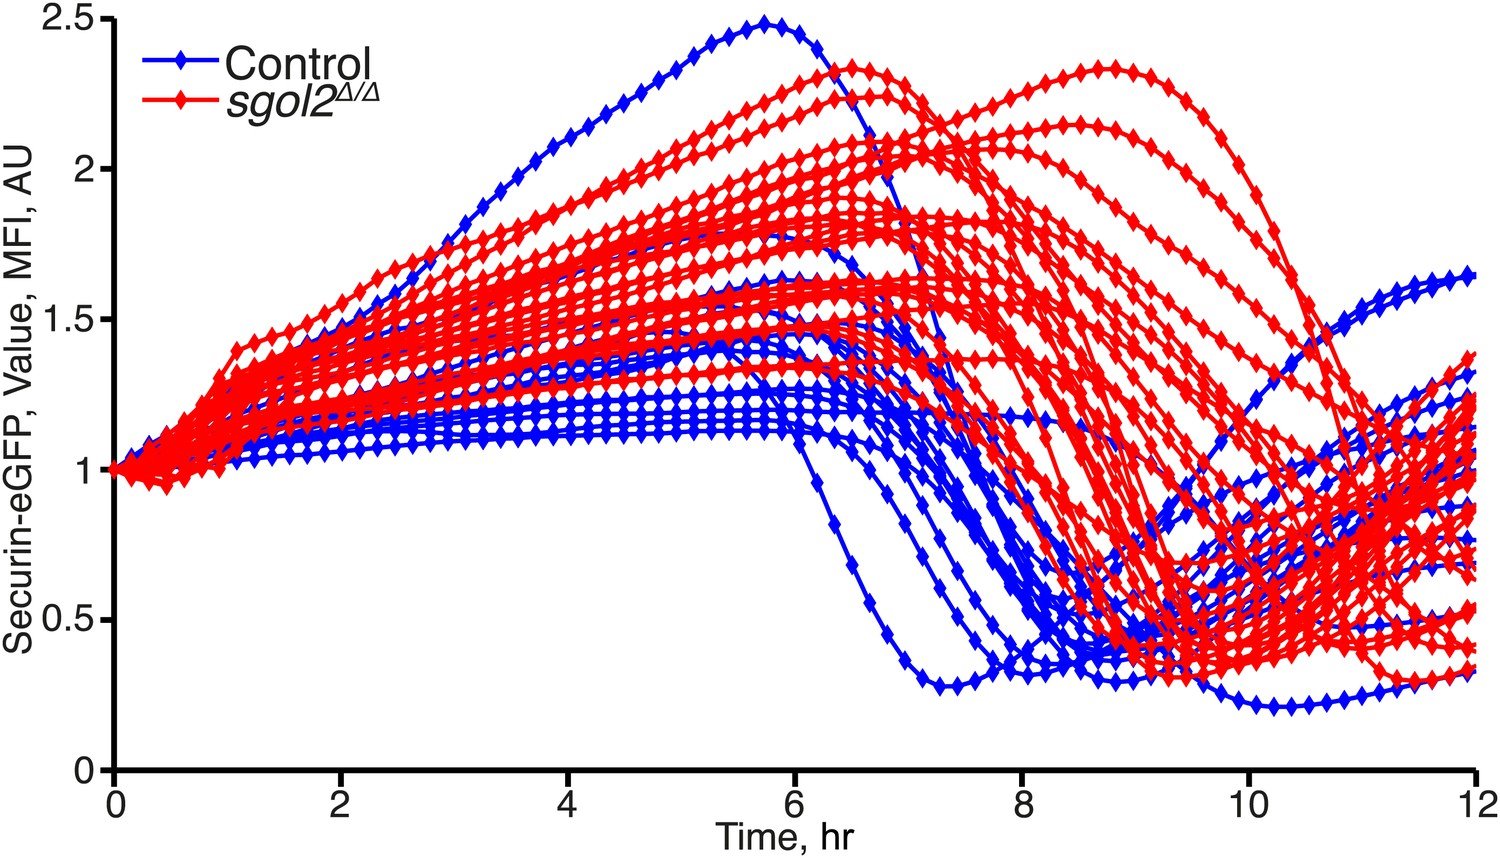
Time course measurements of Securin-eGFP mean fluorescence intensity in control and Sgol2 knockout oocytes.
https://doi.org/10.7554/eLife.01133.007
Figure 4—figure supplement 2
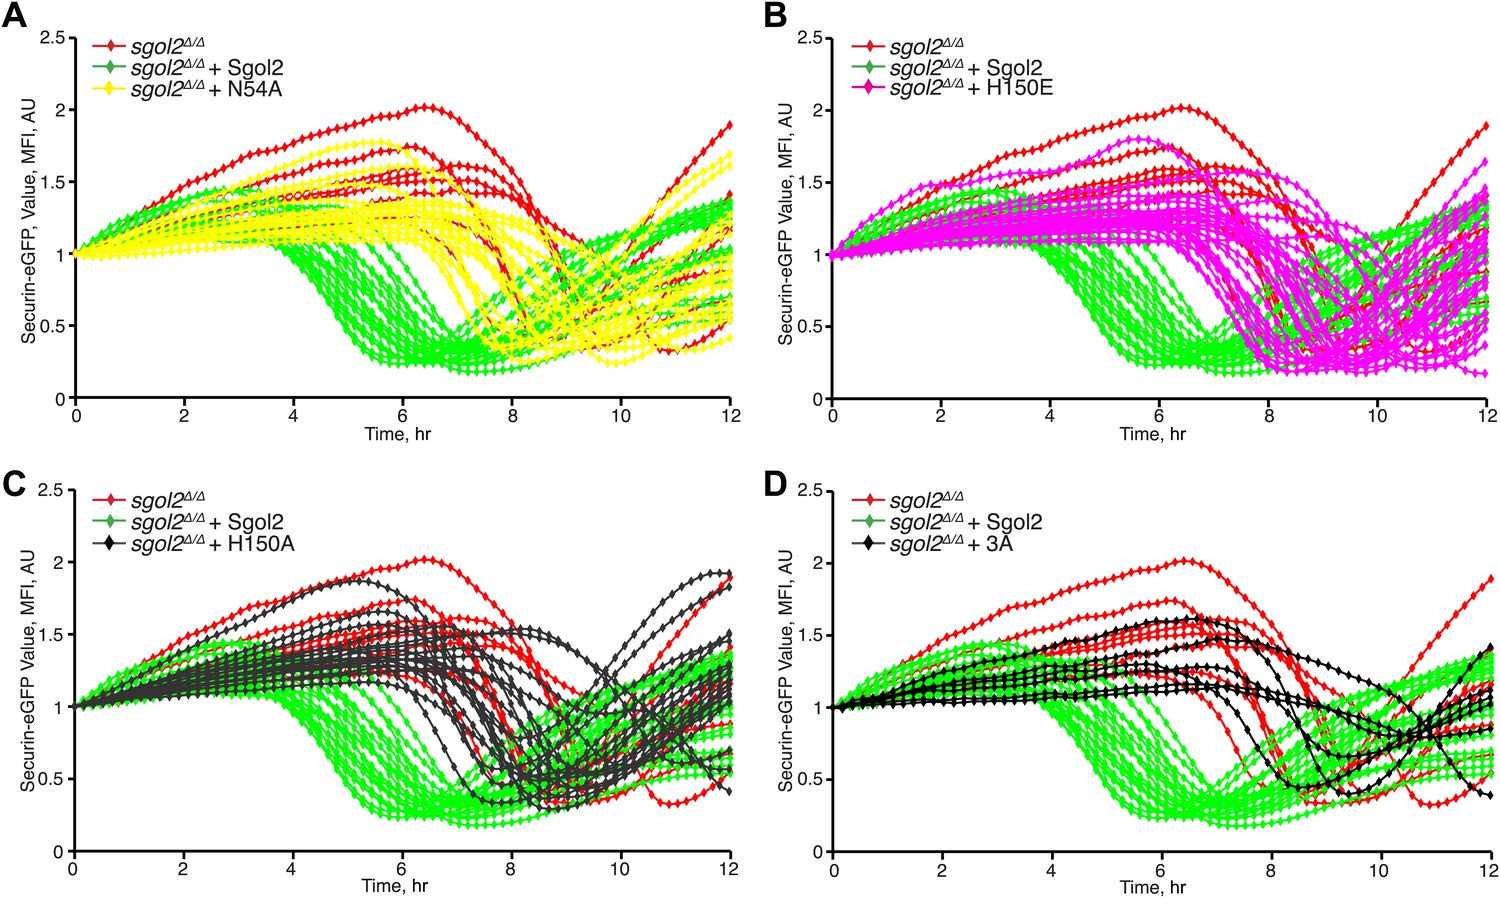
Comparison of Securin-eGFP mean fluorescence intensity curves in Sgol2 knockout oocytes and sgol2Δ/Δ oocytes expressing the indicated form of Sgol2Δ/Δ mRNA.
https://doi.org/10.7554/eLife.01133.008
Figure 4—figure supplement 3
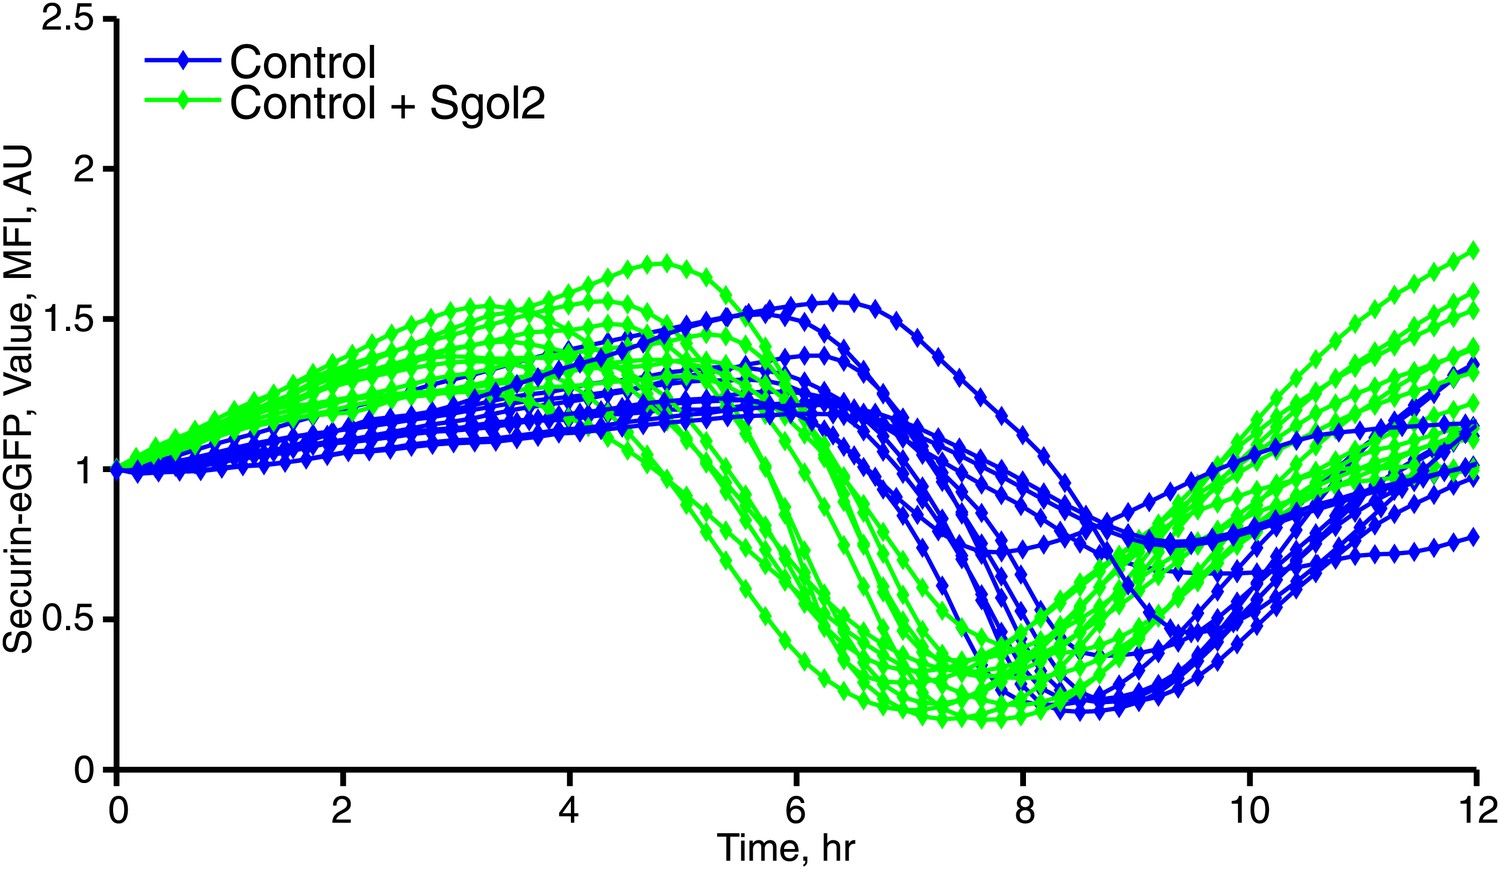
Microinjection of Sgol2 mRNA accelerates APC/CCdc20 activation in wild type oocytes.
Time course measurements of Securin-eGFP mean fluorescence intensity from individual oocytes.
Figure 5 with 2 supplements
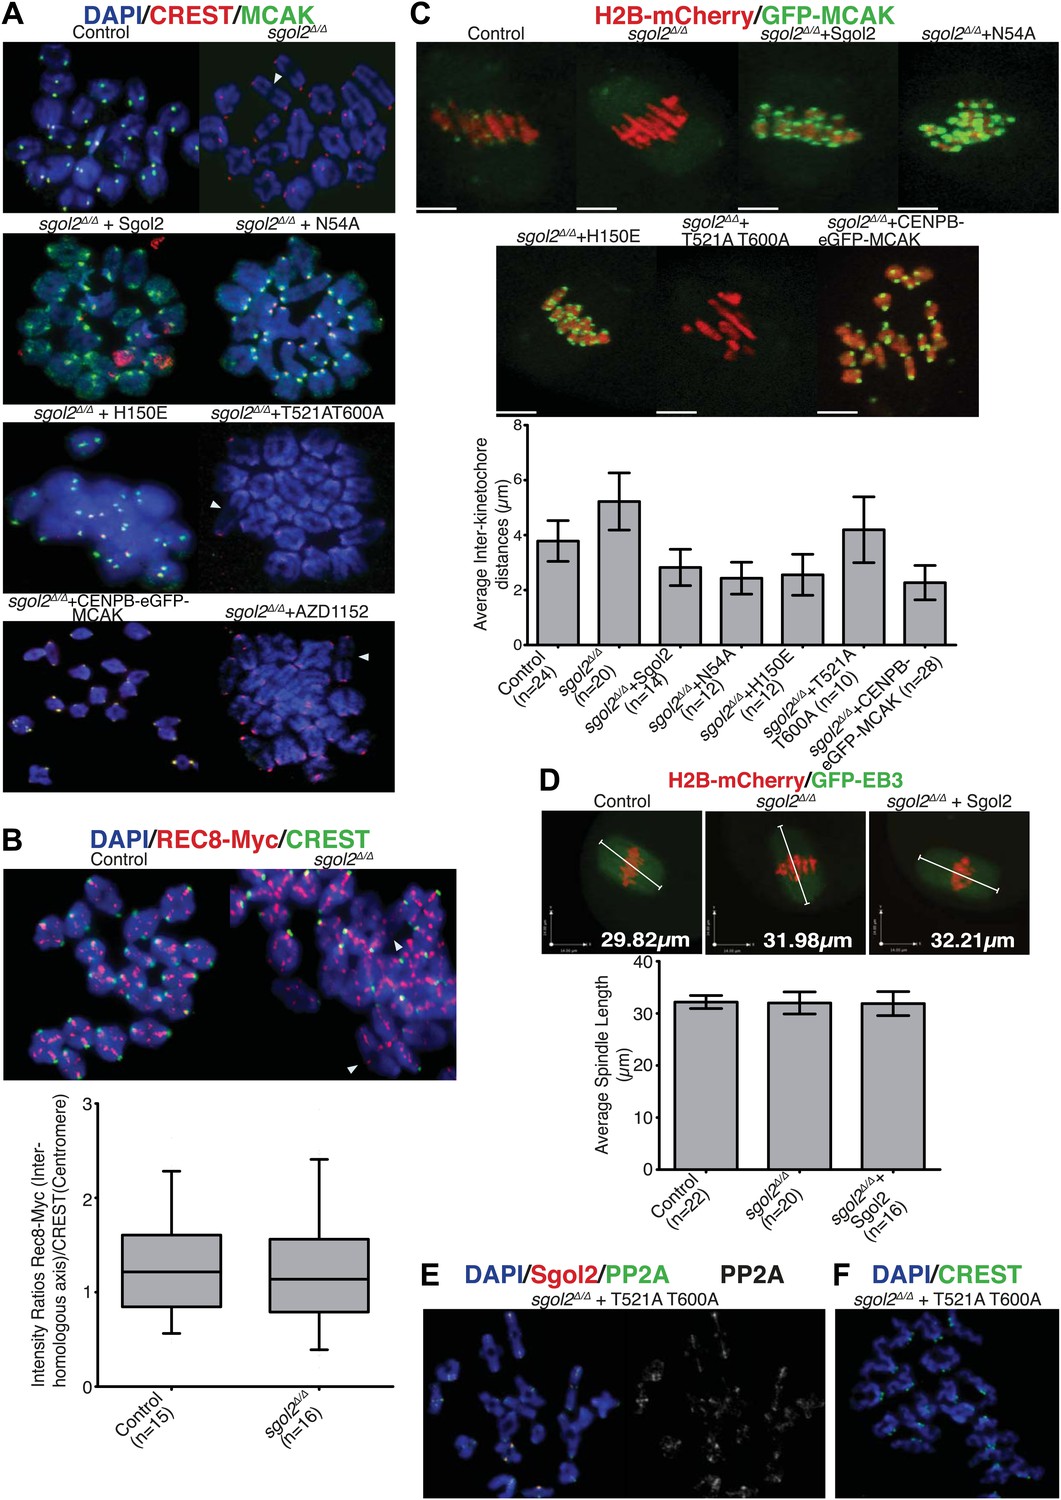
Sgol2, by recruiting MCAK to kinetochores, maintains inter-kinetochore distances between homologous chromosomes.
(A) GV stage oocytes were harvested and microinjected in M2 medium supplemented with IBMX. Release from IBMX resulted in GVBD and at 6–7 hr post-GVBD chromosome spreads were prepared. Slides were stained with DAPI (blue), CREST (Red), and MCAK (green). Arrowheads indicate distally attached bivalent chromosomes. (B) Sgol2 targeted mice were crossed to (Tg)Rec8-Myc females to generate control and sgol2Δ/Δ expressing the Rec8-myc BAC transgene. Chromosome spreads were prepared at 6–7 hr post-GVBD and were stained with DAPI (blue), CREST (green), and c-Myc (Red). Intensity ratios of Rec8-Myc (on inter-kinetochore axes) and CREST (at centromeres) were calculated. (C) Representative Z-projected confocal microscopy images and average (±SDs) inter-kinetochore distance measurements from metaphase I stage oocytes expressing H2B-mCherry (chromosomes, red) and GFP-MCAK (green). Scale bars represent 5 μm. (D) Z-projected (12 slices 1.5 μm apart) live-cell confocal images and spindle length measurements (±SDs) from metaphase I stage oocytes expressing EB3-GFP (microtubule plus ends, green) and H2B-mCherry (chromosomes, red). Scale bar is 14 μm. (E) Metaphase I localization of Sgol2 (red) and PP2A-C (green) on chromosomes from sgol2Δ/Δ oocytes microinjected with T521A T600A Sgol2 mRNA. (F) DAPI (blue) and CREST (green) stained chromosome spreads prepared at metaphase II-stage from sgol2Δ/Δ oocytes microinjected at GV stage with T521A T600A Sgol2 mRNA.
Figure 5—figure supplement 1
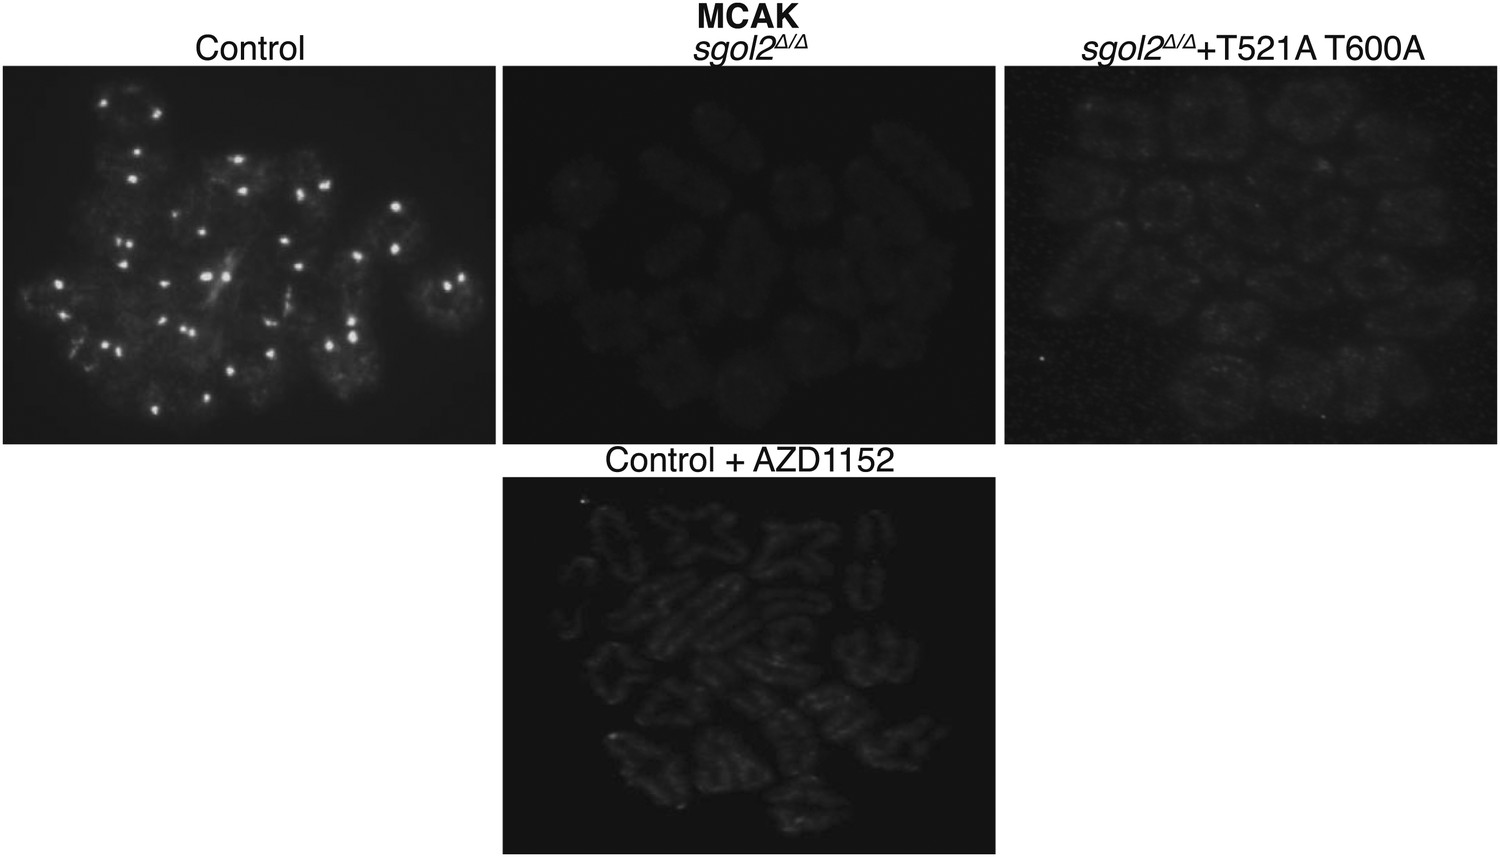
GV oocytes were harvested in M2 medium supplemented with IBMX.
Oocytes were then cultured in IBMX-free M16 medium for about 6–7 hr, corresponding to metaphase I-stage. To inhibit Aurora B/C kinase activity oocytes were cultured in M16 medium supplemented with AZD1152 (100 nM). Representative chromosomes spreads from indicated groups of oocytes at metaphase I-stage showing MCAK localization are displayed.
Figure 5—figure supplement 2
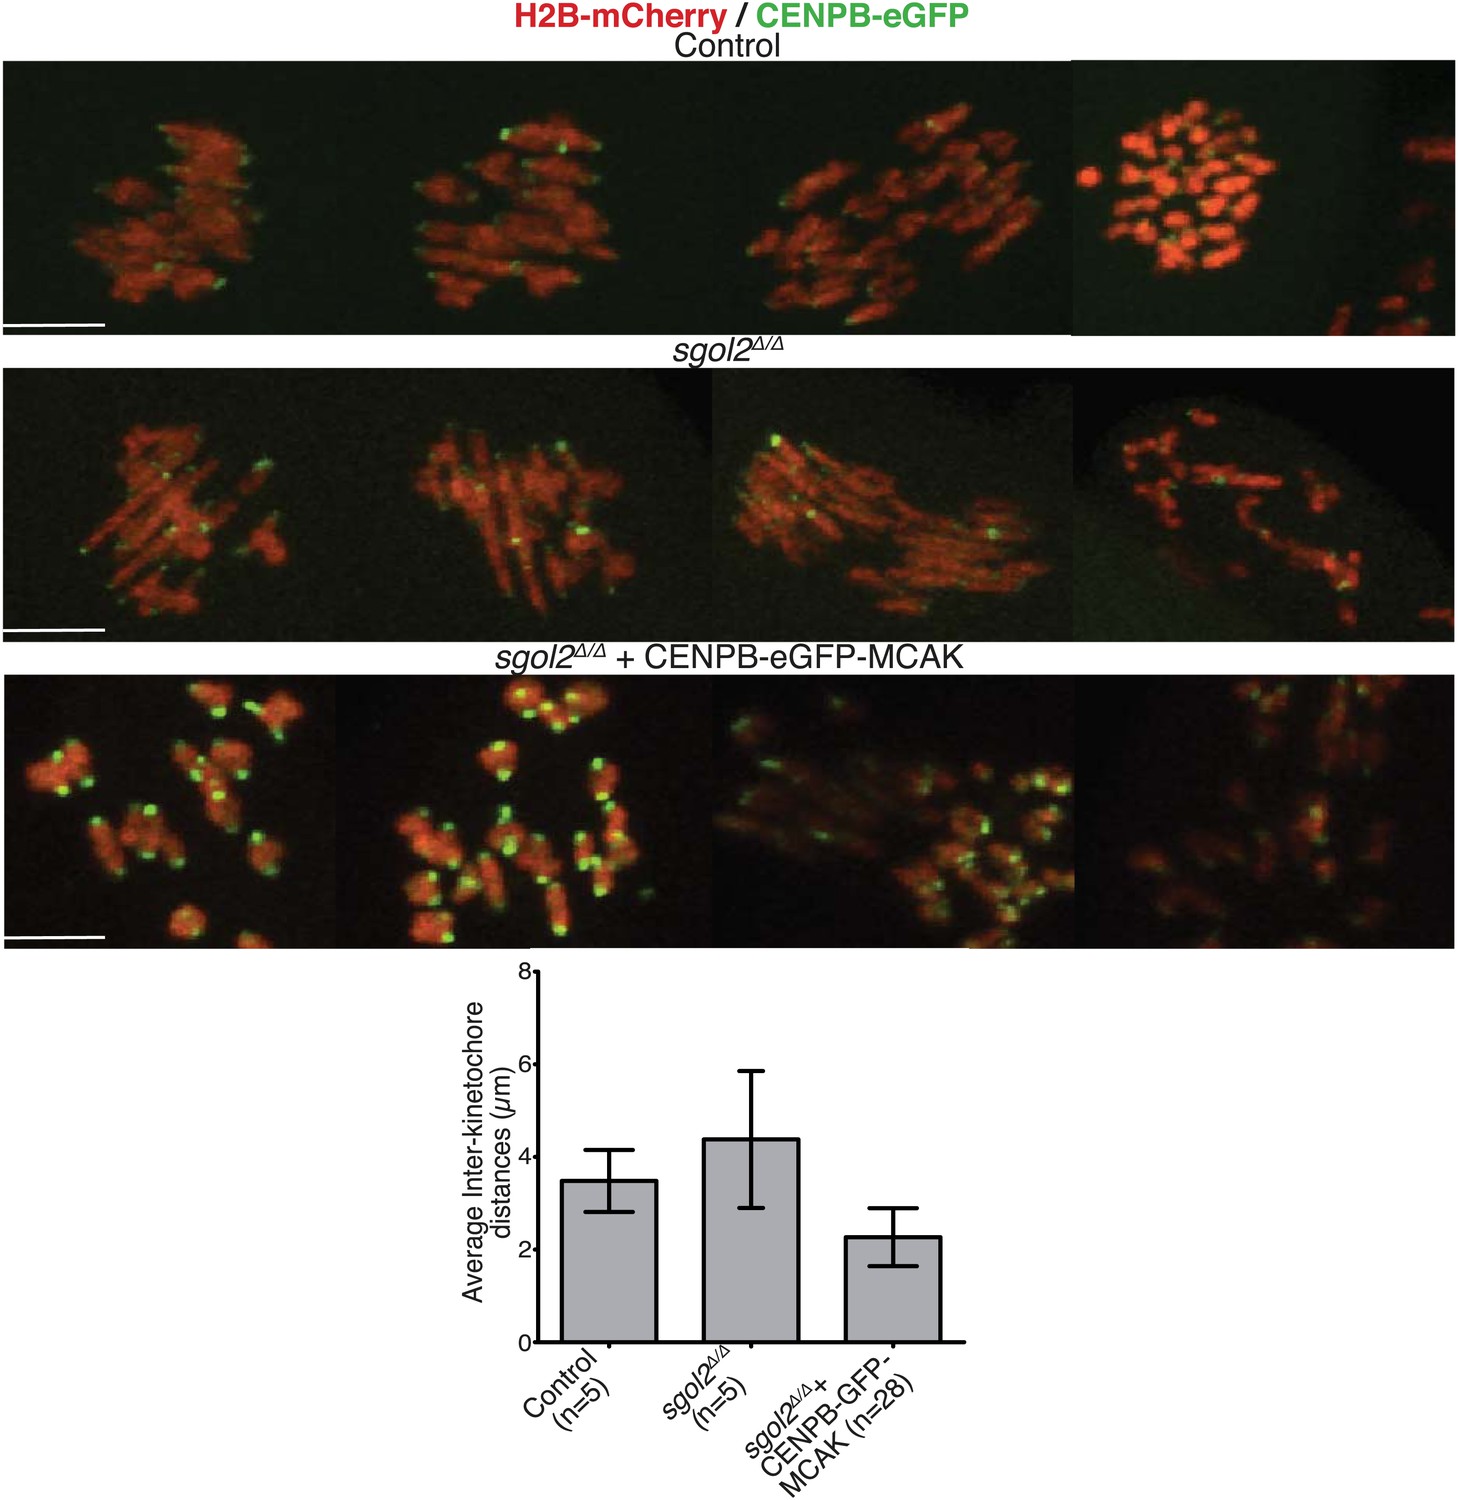
Oocytes harvested at GV stage were microinjected with either CENPB-eGFP or CENPB-eGFP fused to MCAK mRNA.
Time-lapsed confocal microscopy images from metaphase I-stage are displayed. Scale bars represent 5 μm.
Figure 6 with 1 supplement

Sgol2 assists in bi-orientation of bivalent chromosomes on the metaphase plate.
Time-lapse confocal microscopy images from oocytes expressing H2B-mCherry and GFP-MCAK. Representative images from litter-mate control, sgol2Δ/Δ, sgol2Δ/Δ microinjected with wild type, N54A, H150E, and T521A T600A Sgol2 mRNA are aligned to show the dynamics of MCAK localization and chromosome movements along the meiotic spindle. GVBD normalized time (in hr) is indicated on each frame. Scale bars represent 5 μm.
Figure 6—figure supplement 1
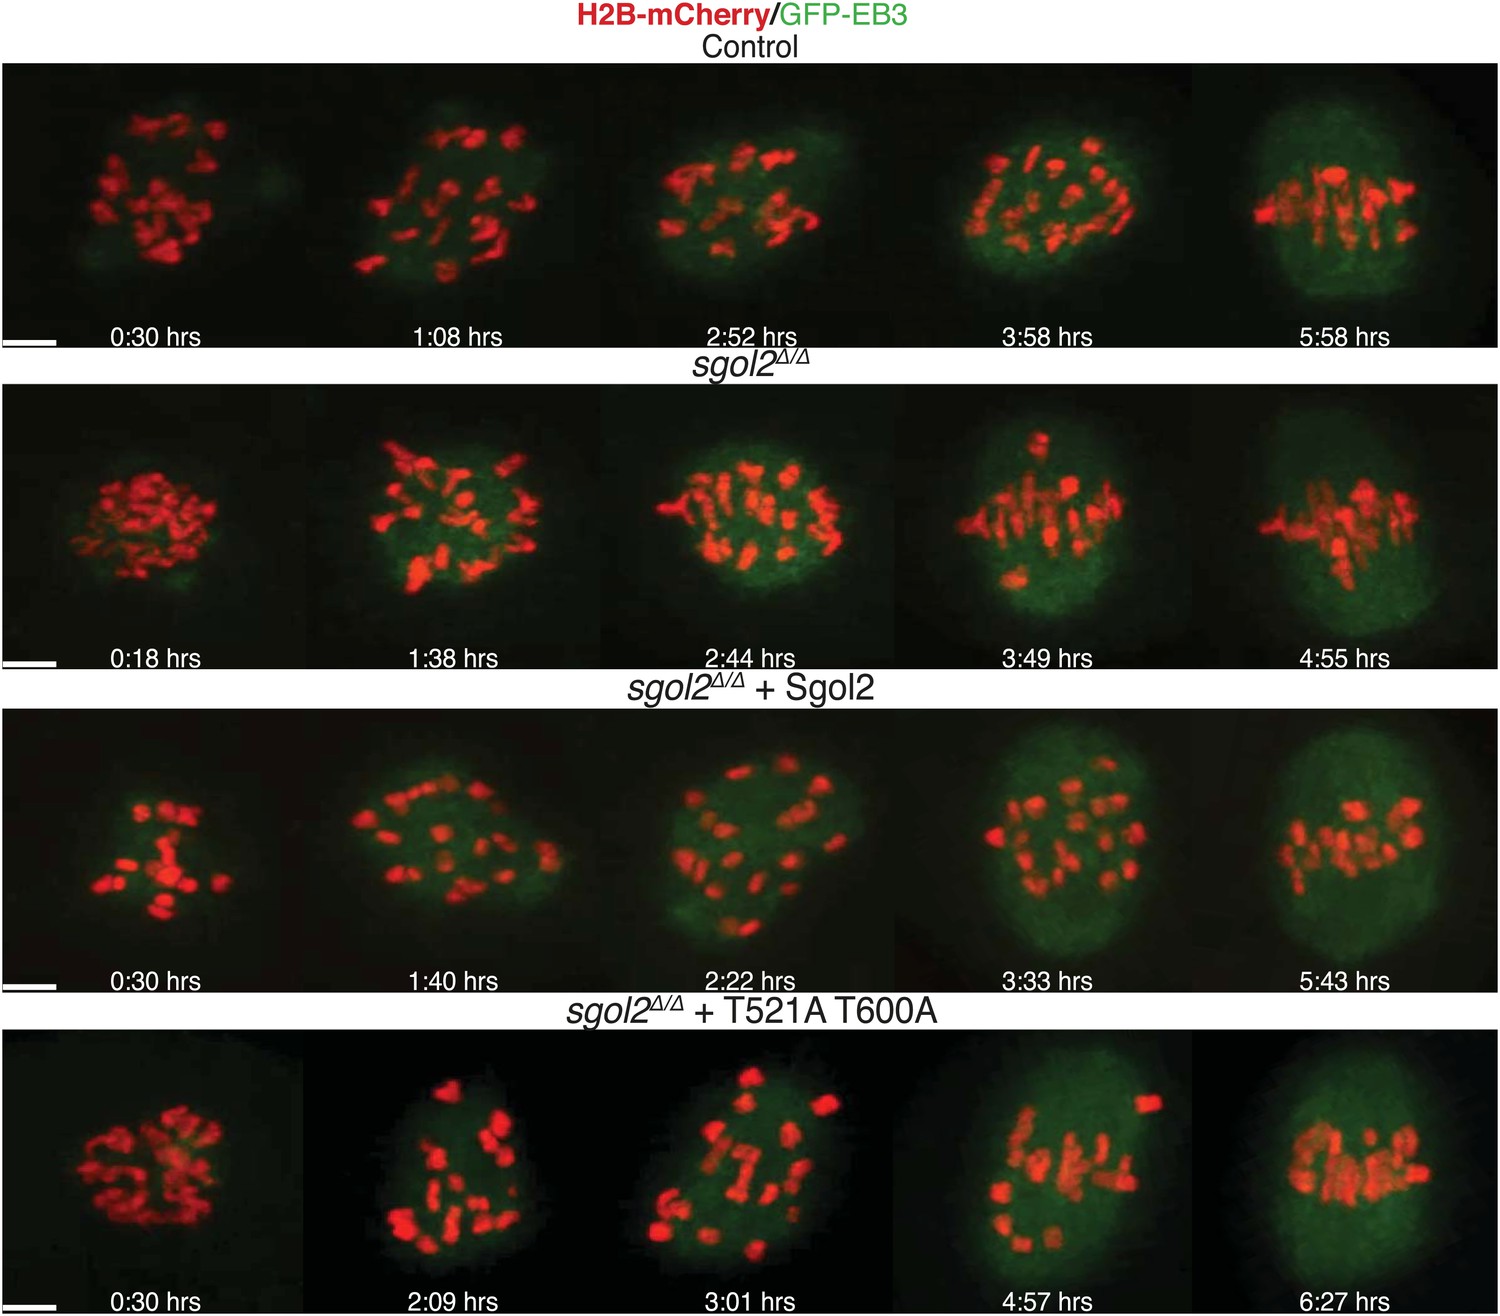
Live cell confocal microscopy images from oocytes expressing H2B-mCherry (chromosomes, red) and EB3-GFP (microtubules, green) are shown.
Representative images from control, sgol2Δ/Δ, and sgol2Δ/Δ microinjected with wild type and T521A T600A Sgol2 mRNA are displayed. Time (in hr) after GVBD is indicated on each frame. Scale bars represent 5 μm.
Figure 7
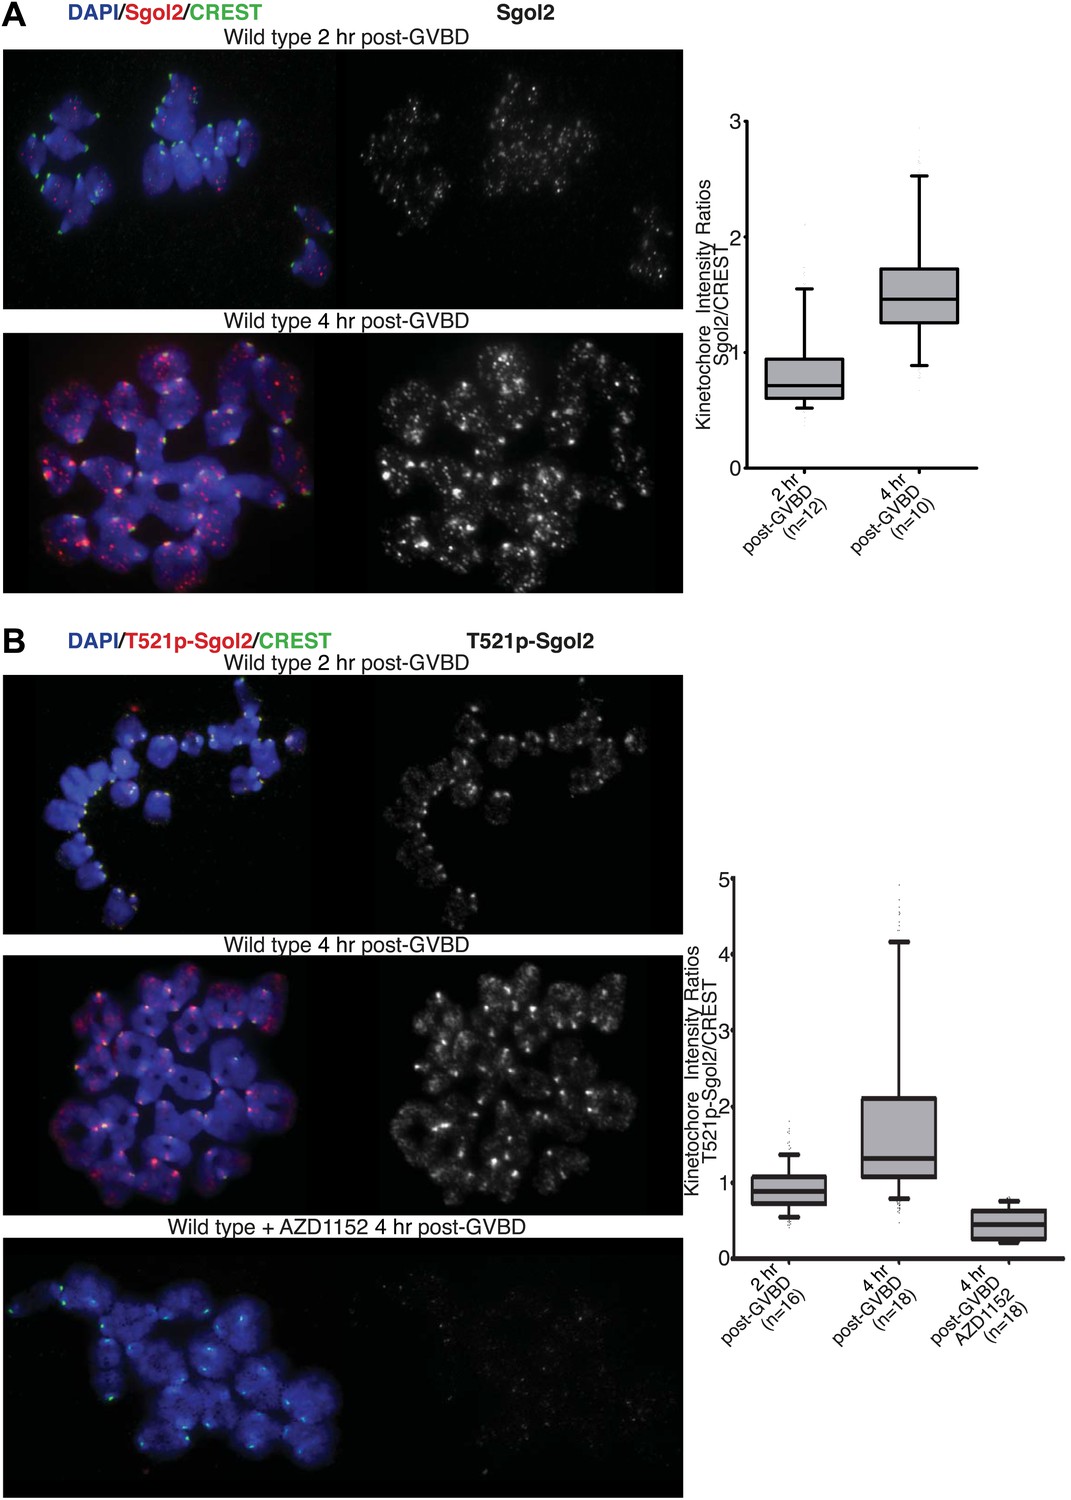
Aurora B/C Kinase phosphorylates Sgol2 on T521.
(A) Oocytes harvested from wild type control females at GV stage were matured in vitro and chromosome spreads were prepared at 2 and 4 hr post-GVBD. Slides were stained for DNA (blue), Sgol2 (red), and CREST (green). Fluorescence intensity ratios of Sgol2 and CREST at kinetochores were quantified. Numbers of oocytes examined are indicated (n). (B) Chromosome spreads were prepared at 2 and 4 hr post-GVBD from wild type control oocytes. Slides were stained for DNA (blue), anti-T521p-Sgol2 (red), and CREST (green). Aurora B/C kinase activity was inhibited by culturing oocytes in M16 medium supplemented with the AZD1152 (100 nM) inhibitor. Fluorescence intensity ratios of T521p–Sgol2 and CREST at kinetochores were quantified.
Figure 8
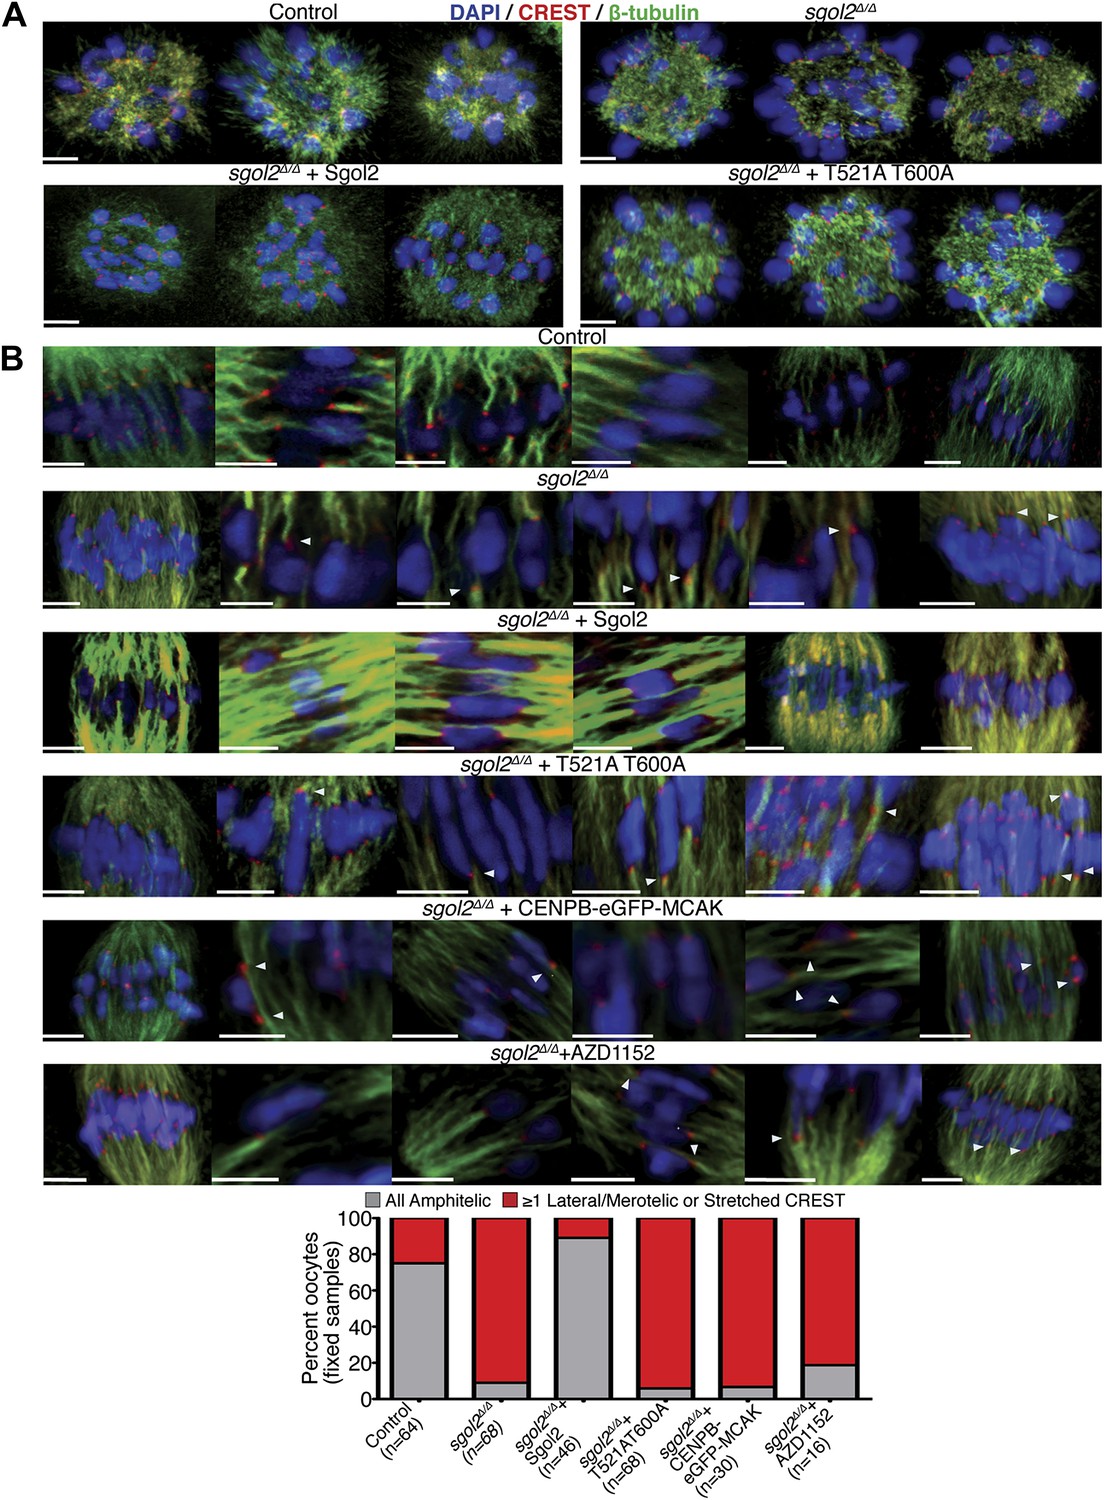
Sgol2 promotes bi-orientation of homologous chromosomes by increasing kinetochore-microtubule interactions.
(A) To study the relative distributions of chromosomes on the ball shaped spindle, at 2–3 hr post-GVBD, oocytes were treated with Ca2+ buffer for 90 s and then fixed in 1% PFA. Cells were stained with anti-β-tubulin (microtubules, green), CREST (kinetochores, red), and DAPI (chromosomes, blue). Scale bars represent 5 μm. (B) Oocytes harvested at GV stage from wild type, sgol2Δ/Δ and sgol2Δ/Δ microinjected with wild type, T521A T600A Sgol2 mRNA and CENPB-eGFP-MCAK mRNA were cultured in M16 medium for 6 hr. At 6 hr post-GVBD, oocytes were fixed in 1% PFA were stained with anti-β-tubulin (microtubules, green), CREST (kinetochores, red), and DAPI (chromosomes, blue). For Aurora B/C inhibition, oocytes harvested from Sgol2 knockout females were cultured in M16 medium for 4 hr. At 4 hr post-GVBD, oocytes were transferred to M16 medium supplemented with low concentration (20 nM) of AZD1152 inhibitor. Oocytes were cultured until 6 hr post-GVBD and were then fixed in 1% PFA. Scale bars represent 5 μm.
Figure 9

Sgol2 inhibits Aurora B/C Kinase activity at kinetochores.
(A) Chromosome spreads were prepared from indicated groups at 4 hr post-GVBD. Slides were stained with DAPI (blue), anti-S24p-Knl1 (red) and CREST (green). Kinetochore intensities of anti-S24p-Knl1 and CREST signals were quantified and the intensity ratios of anti-S24p-Knl1 and CREST signals are shown. Upper and lower bars indicate 95th and 5th percentiles, respectively. (B) Chromosome spreads prepared at 4 hr post-GVBD were stained with DAPI (blue), anti-p-Aurora A/B/C (red) and CREST (green). Kinetochore fluorescence intensity ratios of p-Aurora A/B/C and CREST are displayed. (C) Sgol2 knockout and Sgol2 knockout oocytes injected with wild type Sgol2 mRNA were cultured for 6 hr from GVBD in M16 medium supplemented with 400 nM Nocodazole. Chromosome spreads were stained for DNA (DAPI, blue), p-Aurora A/B/C (red), and CREST (green). (D) anti-S100p-Dsn1 and CREST kinetochore intensity ratios, quantified from chromosome spreads prepared at 3 and 6 hr post-GVBD from wild type control oocytes.
Figure 10

Sgol2 decreases Aurora C activity at the kinetochores without affecting its localization.
Chromosome spreads were prepared from the indicated groups at 4 hr post-GVBD. Slides were stained for DNA (DAPI, blue), Aurora C (red), and CREST (green). Fluorescence intensity ratios of Aurora C and CREST at kinetochores are displayed. Upper and lower bars indicate 95th and 5th percentiles, respectively.
Figure 11

Graphical summary of sequence features, interactions and key functions of Sgol2 in mouse oocytes.
https://doi.org/10.7554/eLife.01133.026Videos
Video 1
Z-projected time-course confocal microscopy video of control oocyte microinjected at GV stage with GFP-MCAK and H2B-mCherry mRNA.
https://doi.org/10.7554/eLife.01133.015
Video 2
Z-projected time-course confocal microscopy video of sgol2Δ/Δ oocyte microinjected at GV stage with GFP-MCAK and H2B-mCherry mRNA.
https://doi.org/10.7554/eLife.01133.016
Video 3
Z-projected time-course confocal microscopy video of sgol2Δ/Δ oocyte microinjected at GV stage with GFP-MCAK, H2B-mCherry and Sgol2 mRNA.
https://doi.org/10.7554/eLife.01133.017
Video 4
Z-projected time-course confocal microscopy video of sgol2Δ/Δ oocyte microinjected at GV stage with GFP-MCAK, H2B-mCherry and N54A Sgol2 mRNA.
https://doi.org/10.7554/eLife.01133.018
Video 5
Z-projected time-course confocal microscopy video of sgol2Δ/Δ oocyte microinjected at GV stage with GFP-MCAK, H2B-mCherry and H150E Sgol2 mRNA.
https://doi.org/10.7554/eLife.01133.019
Video 6
Z-projected time-course confocal microscopy video of sgol2Δ/Δ oocyte microinjected at GV stage with GFP-MCAK, H2B-mCherry and T521A T600A Sgol2 mRNA.
https://doi.org/10.7554/eLife.01133.021
Video 7
Upper panel displays Z-projected time-course confocal microscopy video of control and sgol2Δ/Δ oocytes microinjected at GV stage with CENPB-eGFP and H2B-mCherry mRNA. Lower panel displays representative confocal video of sgol2Δ/Δ oocyte microinjected with CENPB-eGFP-MCAK and H2B-mCherry mRNA.
https://doi.org/10.7554/eLife.01133.022Download links
A two-part list of links to download the article, or parts of the article, in various formats.
Downloads (link to download the article as PDF)
Open citations (links to open the citations from this article in various online reference manager services)
Cite this article (links to download the citations from this article in formats compatible with various reference manager tools)
Sgol2 provides a regulatory platform that coordinates essential cell cycle processes during meiosis I in oocytes
eLife 2:e01133.
https://doi.org/10.7554/eLife.01133


